 Fangxing Zhou
 Nan Chen
 Hui Qian2*
 Di Gong
 Kunke Li
94% of researchers rate our articles as excellent or good
Learn more about the work of our research integrity team to safeguard the quality of each article we publish.
Find out more
ORIGINAL RESEARCH article
Front. Med. , 07 January 2025
Sec. Ophthalmology
Volume 11 - 2024 | https://doi.org/10.3389/fmed.2024.1526703
This article is part of the Research Topic New Concepts, Advances, and Future Trends in Clinical Research on Eye Diseases View all 20 articles
Objective: This study aims to explore the differences in ocular parameters among adult myopic patients with different degrees of myopia and axial lengths, and to investigate the correlations between these ocular parameters.
Methods: This single-center observational study collected clinical data from myopic patients aged 18–45 years who visited the Eye Hospital of Nanjing Medical University between January and June 2023. The data included laterality, diopter of spherical power (DS), diopter of cylindrical power (DC), spherical equivalent (SE), axial length (AL), central corneal thickness (CCT), flat meridian keratometry (K1), steep meridian keratometry (K2), mean keratometry (Km), anterior chamber depth (ACD), corneal radius of curvature (CRC), and axial length/corneal radius of curvature ratio (AL/CRC). Following predefined inclusion and exclusion criteria, 1,026 eyes were included in the study. Patients were grouped based on SE and AL parameters into different degrees of myopia. Analysis of variance (ANOVA) and Welch ANOVA were used to compare intergroup differences. Spearman correlation coefficients were calculated to analyze the correlations between parameters, and linear regression and ROC curve analyses were performed.
Results: Significant differences (p < 0.05) were found among mild, moderate, and high myopia groups in parameters such as DS, DC, AL, K1, Km, ACD, CRC, and AL/CRC. Significant differences (p < 0.05) were also found in DS, DC, SE, CCT, K1, K2, Km, ACD, CRC, and AL/CRC among different axial length groups. Spearman correlation analysis showed a strong correlation between AL and DS, SE, and between AL/CRC and DS, SE, AL. Linear regression analysis revealed that the coefficient of determination (R2) for AL and SE was 0.699, and for AL/CRC and SE, it was 0.861. ROC curve analysis demonstrated high accuracy for both AL and AL/CRC in identifying high myopia, with an AUC of 0.952 for AL/CRC, which was superior to the AUC of 0.905 for AL (p < 0.05).
Conclusion: This study found significant differences in ocular parameters among patients with different degrees of myopia and axial lengths. There was a significant negative correlation between AL, AL/CRC, and SE. Compared to AL, AL/CRC had a stronger correlation with SE and higher accuracy in identifying high myopia.
Myopia, a common and complex refractive error, impairs the ability to see distant objects clearly and is often associated with severe complications such as glaucoma, retinal detachment, and macular degeneration. Current consensus defines myopia as a spherical equivalent (SE) refractive error of ≤−0.50 diopters (D). When SE ≤−3.00D, it is classified as mild myopia, and between −3.00D and >−6.00D as moderate myopia. SE≤−6.00D is classified as high myopia, usually accompanied by a significant increase in axial length (AL) (1). According to the World Health Organization, approximately 22% of the global population currently has some degree of myopia, a figure that is steadily rising. Epidemiological studies predict that by 2050, there will be 4.758 billion myopic individuals (49.8% of the world’s population) and 938 million highly myopic individuals (9.8% of the world’s population), severely impacting global vision health and quality of life (2, 3). Prevalence rates vary between countries, with East Asia and Southeast Asia reporting myopia rates as high as 80–90% among adults, and high myopia rates around 10–20% (4). Myopia not only affects individual learning, work, and daily life, but the increasing prevalence also indicates a rising burden of low vision and blindness due to pathological myopia, leading to significant socioeconomic costs (5).
Research on the treatment and management of myopia has been a focal point. Current clinical approaches to managing myopia progression include wearing orthokeratology lenses, defocus lenses, applying low-concentration atropine eye drops, repeated low-intensity red light therapy, and increasing outdoor activities. However, precision genetic treatment for myopia remains largely experimental in animals, and future efforts must explore multiple targets to develop treatments for this potentially blinding condition (6–8). In recent years, artificial intelligence and digital technologies have shown tremendous potential in myopia diagnosis and management, promising to provide advanced management tools in the future (9–14).
The exact mechanisms underlying the development and progression of myopia remain unclear, involving several signaling pathways such as TGF-β, cAMP, MMP-2, and hypoxia-inducible factor-1α (15). Previous studies have identified major risk factors for myopia, including prolonged near work, insufficient outdoor activities, high educational pressure, extended years of education, long screen time, and a family history of myopia (14, 16–20). Ocular parameters such as axial length (AL), corneal curvature, central corneal thickness (CCT), corneal radius of curvature (CRC), and axial length/corneal radius of curvature ratio (AL/CRC) are crucial factors in myopia development. Therefore, studying the relationships among these ocular parameters is vital for understanding the mechanisms of myopia, predicting its risk, and developing targeted prevention and intervention strategies (21–27).
This study aims to collect and analyze ocular parameter data from myopic patients to explore the differences in ocular parameters among patients with varying degrees of myopia and to investigate the correlation between axial length and other ocular parameters. Through these analyses, we hope to gain a more comprehensive understanding of the characteristics and mechanisms of myopia, providing a scientific basis for its prevention and treatment.
This study is a single-center observational study. Clinical data from adult myopic patients who visited the Eye Hospital of Nanjing Medical University from January to June 2023 were prospectively collected. Patients were screened according to predefined inclusion and exclusion criteria as follows:
Inclusion criteria:
1. Myopic patients aged between 18 and 45 years;
2. Best-corrected visual acuity (BCVA) ≥ 20/20;
3. Cessation of contact lens wear for more than 4 weeks;
4. Voluntary participation in relevant ophthalmic examinations, including visual acuity, intraocular pressure, slit-lamp examination, cycloplegic refraction, biometry measurements, and anterior segment panorama.
Exclusion criteria:
1. Presence of active inflammatory eye diseases;
2. Severe retinal pathology;
3. History of severe corneal disease;
4. History of ocular surgery;
5. History of severe ocular trauma.
The study protocol was approved by the Ethics Committee of Nanjing Medical University (Ethics No. (2021)-612).
The study collected and organized data on laterality, diopter of spherical power (DS), diopter of cylindrical power (DC), spherical equivalent (SE), axial length (AL, mm), central corneal thickness (CCT, μm), flat meridian keratometry (K1, D), steep meridian keratometry (K2, D), mean keratometry (Km, D), and anterior chamber depth (ACD, mm). Additionally, corneal radius of curvature (CRC) and axial length/corneal radius of curvature ratio (AL/CRC) were calculated. The extracted data were organized into an Excel file.
The formula for calculating the corneal radius of curvature is K = (n2–n1) * 1000/CRC, where K is the corneal curvature, CRC is the corneal radius of curvature, and n1 and n2 are the refractive indices of air and corneal aqueous humor, respectively. Assuming the refractive index of air is 1 and that of the corneal aqueous humor is 1.3375, the formula can be expressed as CRC = 337/Km.
AL/CRC is defined as AL divided by the average CRC measured at 90° and 180° meridians, i.e., AL/CRC = AL/CRC.
Patients were grouped based on the SE results of the examined eye: mild myopia (SE, ≤ −0.50D and > −3.00D), moderate myopia (SE, ≤ −3.00D and > −6.00D), and high myopia (SE, ≤ −6.00D).
Patients were also grouped based on the AL of the examined eye: short axial length (AL < 24 mm), medium axial length (24 mm ≤ AL < 26 mm), and long axial length (AL ≥ 26 mm).
Data were cleaned by removing outliers and imputing missing values using multiple imputation methods. Normality tests were performed on continuous variables. If the data followed a normal distribution, they were presented as mean ± standard deviation; otherwise, they were presented as median (P25, P75). Homogeneity of variance tests were conducted before comparing group differences. If homogeneity of variance was confirmed, ANOVA was used for comparison; otherwise, Welch ANOVA was used. Spearman correlation coefficients were calculated for continuous variables, and a correlation heatmap was drawn. Linear regression analysis and scatter plots were performed to assess the relationships between AL, AL/CRC, and SE. The accuracy of AL and AL/CRC in identifying high myopia was further evaluated by comparing the areas under the ROC curves (AUCs).
Statistical analysis was performed using SPSS version 26.0, with a significance level set at p < 0.05. The analysis results of Figures 1–4 plots were generated using the CNSknowall platform,1 a comprehensive web service for biomedical data analysis and visualization.
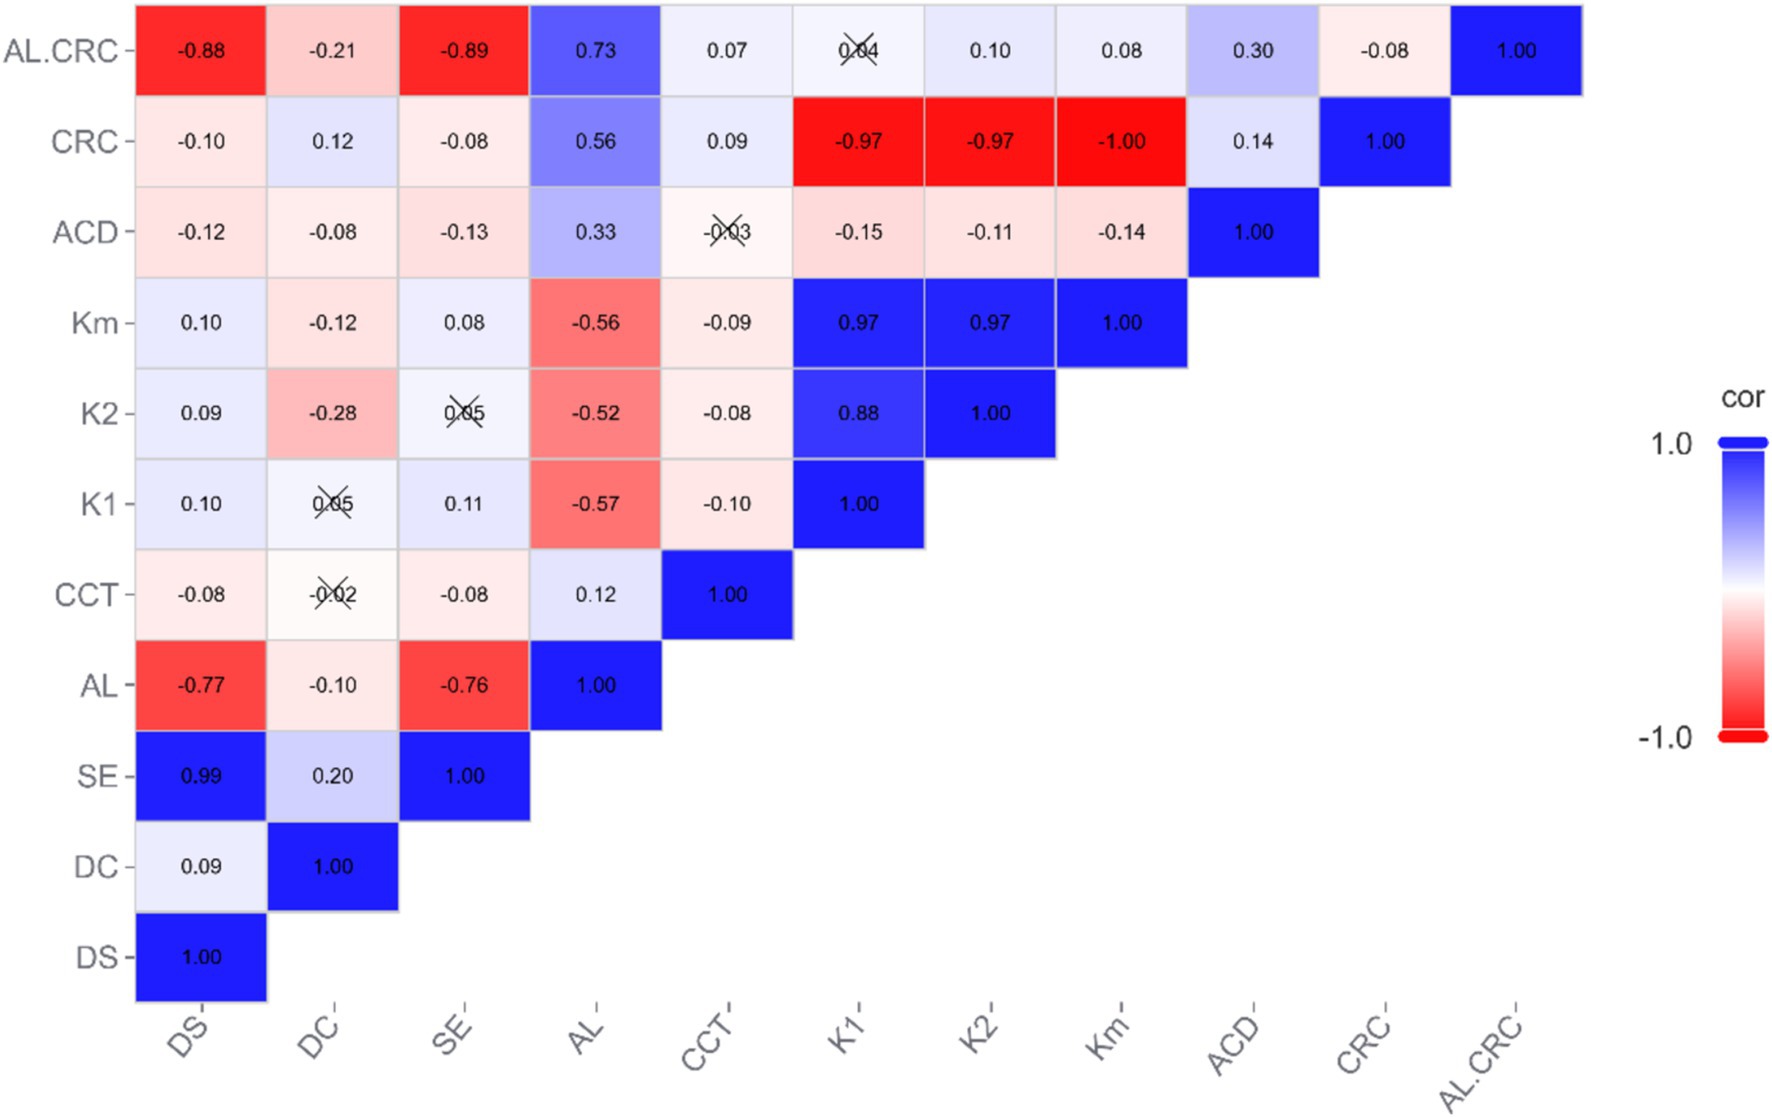
Figure 1. Heatmap of correlations between parameters.
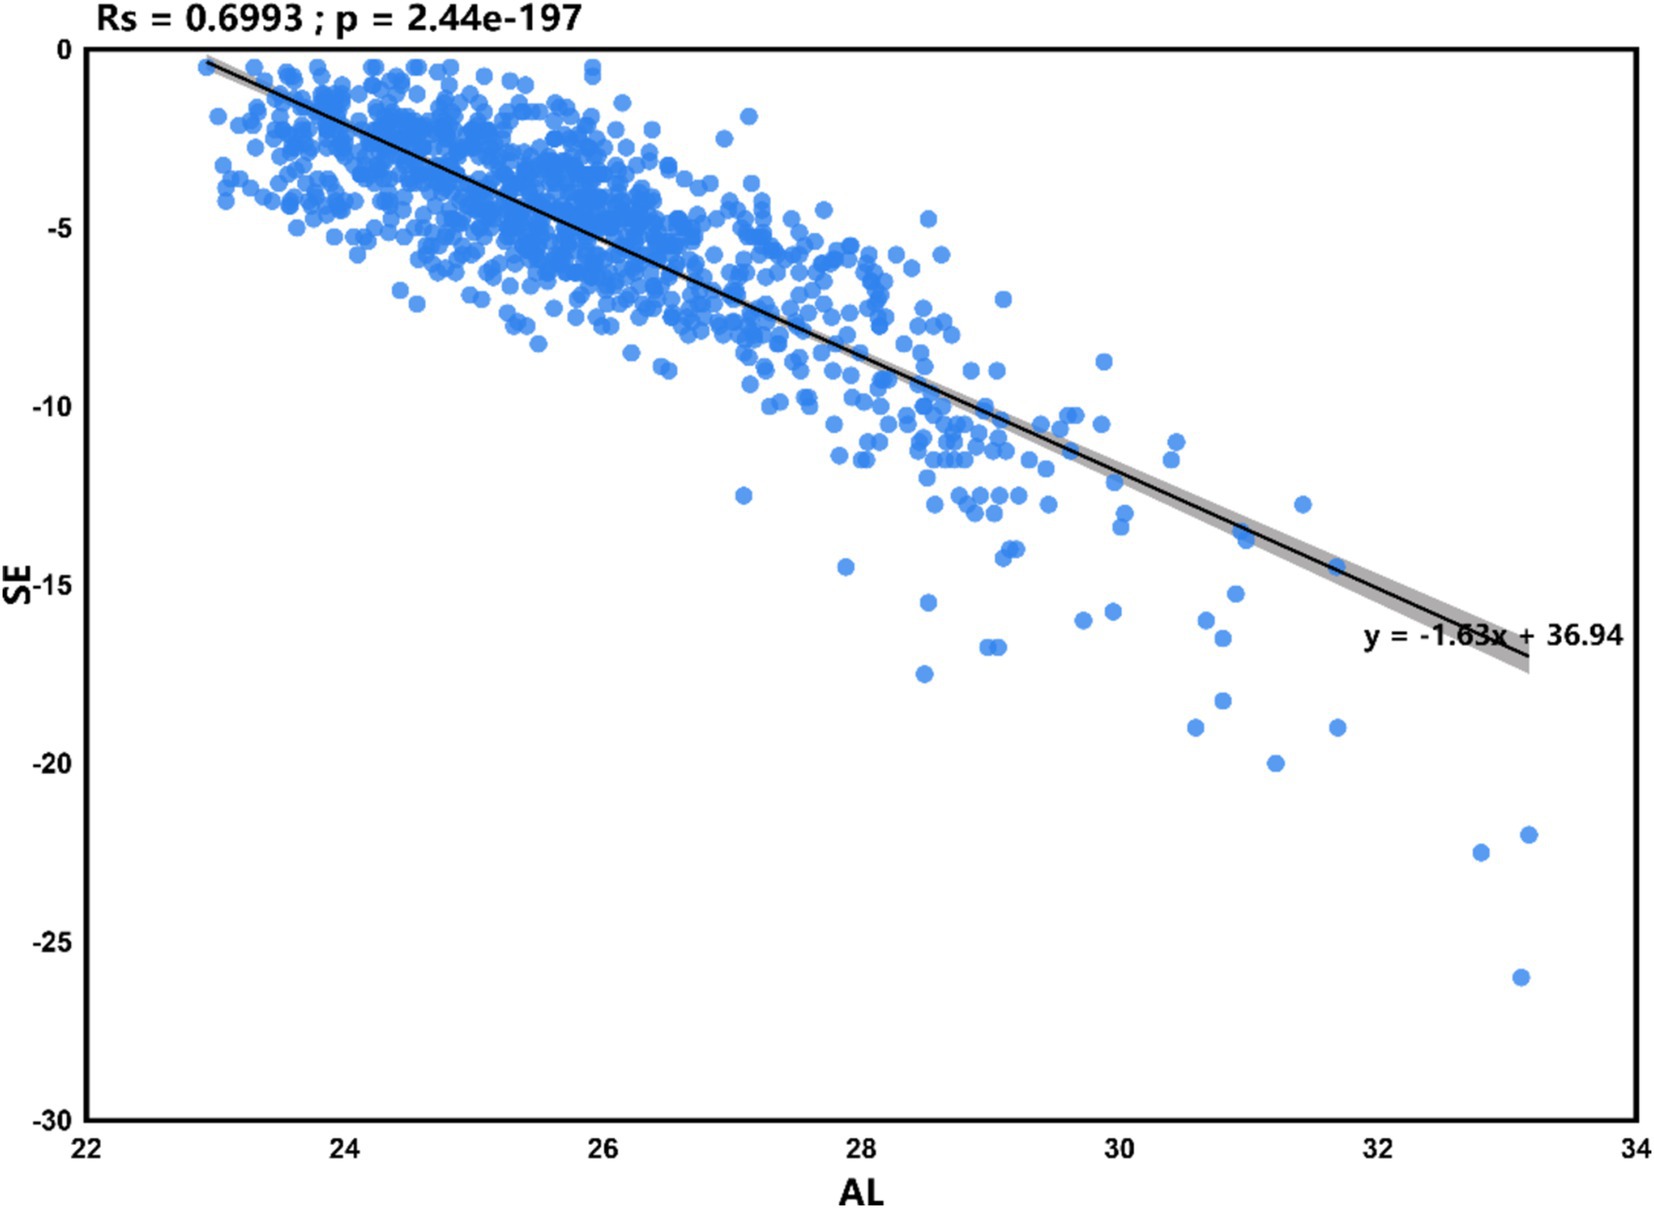
Figure 2. Scatter plot of linear regression between AL and SE.
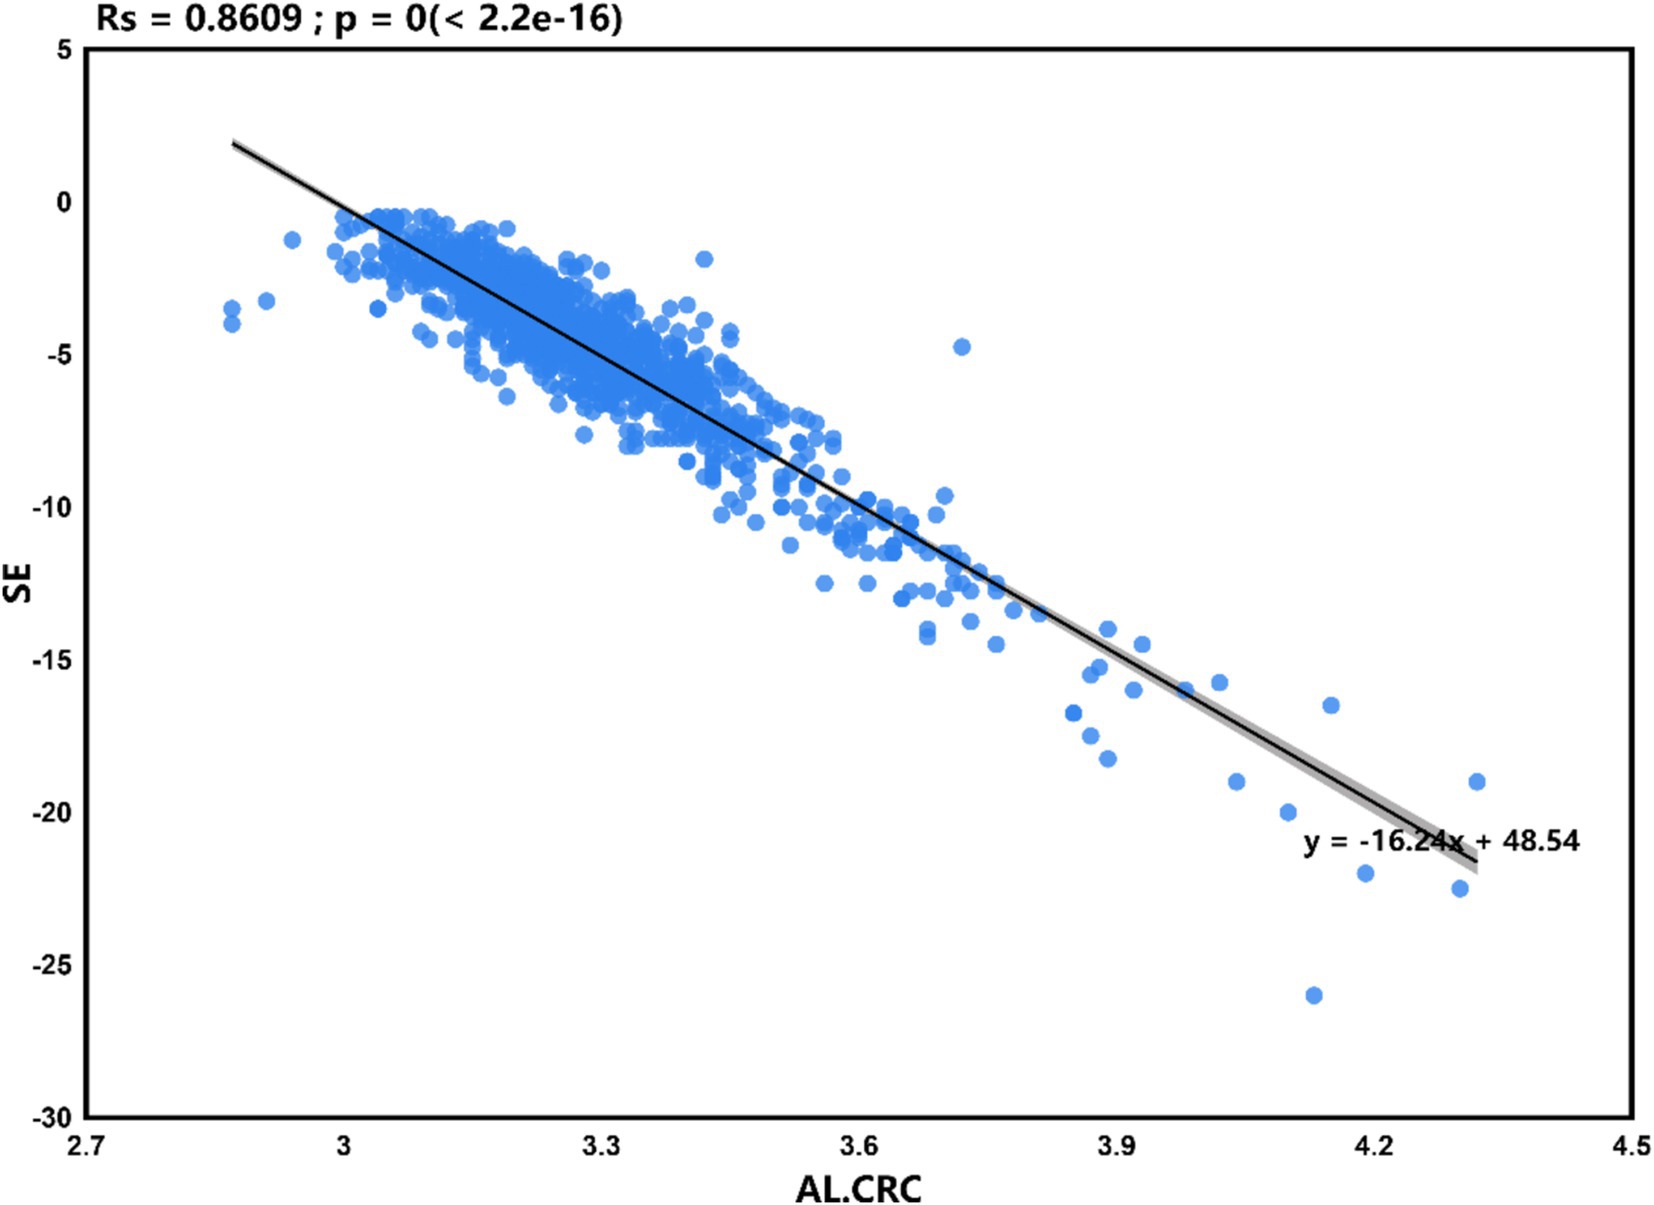
Figure 3. Scatter plot of linear regression between AL/CRC and SE.
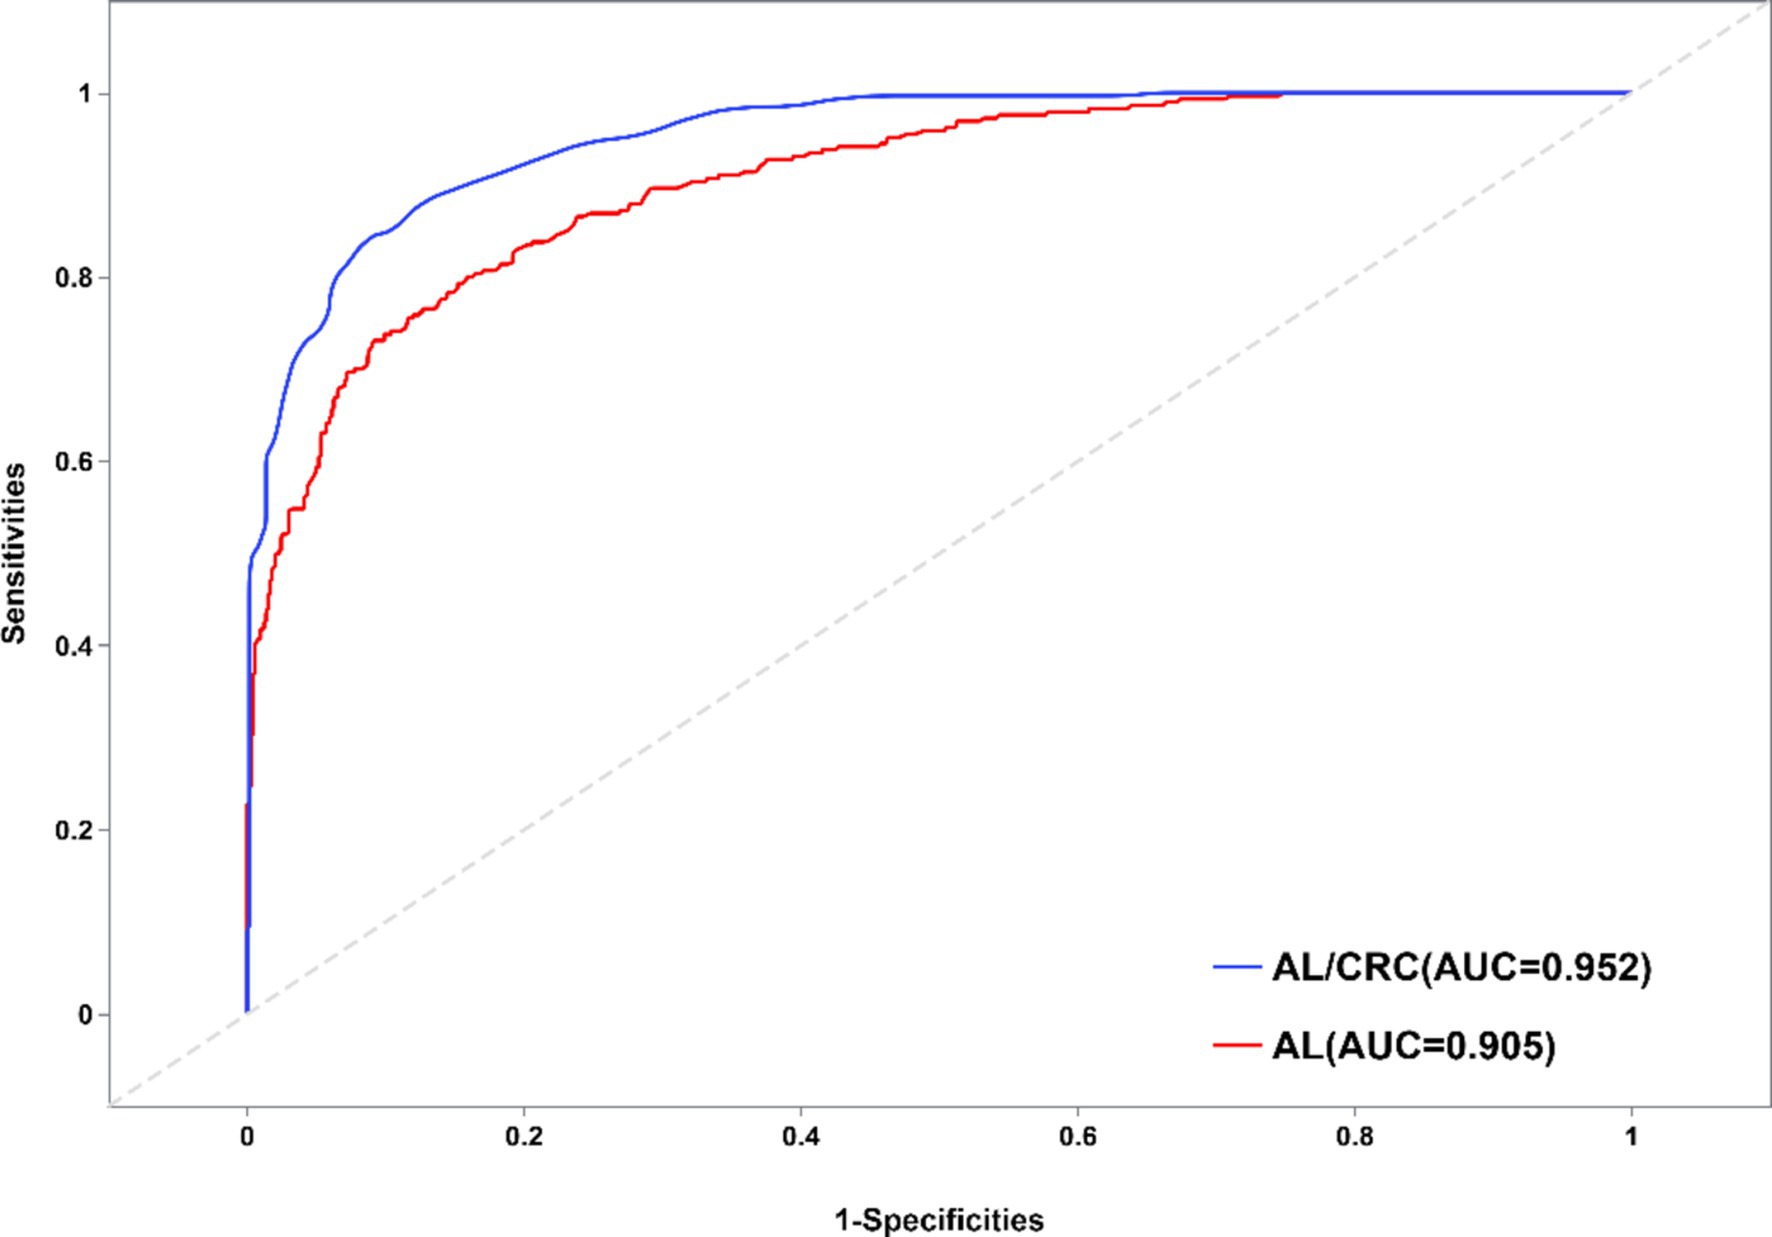
Figure 4. Schematic diagram of ROC curves for identifying high myopia with AL and AL/CRC parameters.
According to the predefined inclusion and exclusion criteria, a total of 537 myopic patients aged 18–45 years were initially enrolled in this study, comprising 1,074 eyes. However, due to refractive asymmetry in some patients, where one eye was myopic and the contralateral eye was either emmetropic or hyperopic, a total of 1,026 eyes were ultimately included for analysis. The basic data descriptive statistics are presented in Table 1. Based on the results in Table 1, it can be observed that the kurtosis of all parameters is <10 and skewness is <3, indicating a normal distribution of the study variables.
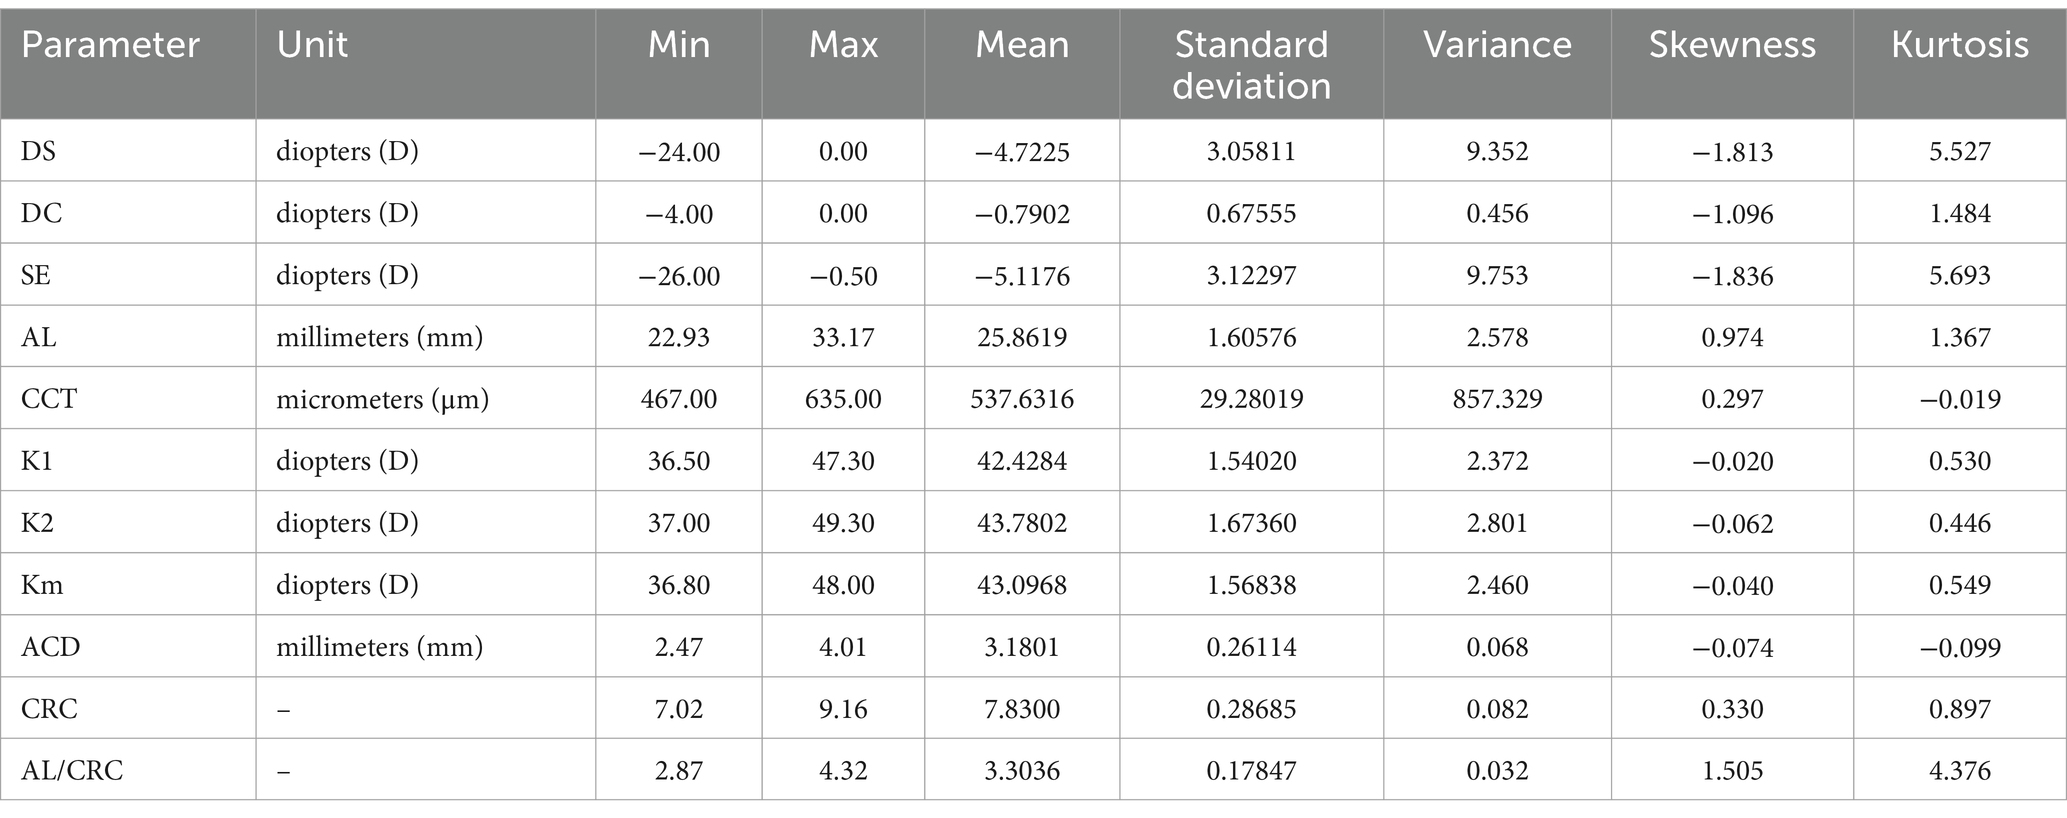
Table 1. Descriptive statistics of basic data.
Data were grouped based on the SE results, with 242 eyes in the mild myopia group, 494 eyes in the moderate myopia group, and 290 eyes in the high myopia group. Fluctuations in data variability were examined using homogeneity of variance tests. The results indicated homogeneity of variance for CCT, K2, ACD, and CRC (p > 0.05), suggesting consistent data variability. Welch ANOVA was used for these variables. However, DS, DC, AL, K1, Km, and AL/CRC showed significant differences among groups (p < 0.05), indicating inconsistent data variability and the need for Welch ANOVA. Table 2 presents the statistical results of the differences among groups of different degrees of myopia, with significant differences observed in eight parameters among the groups (p < 0.05).
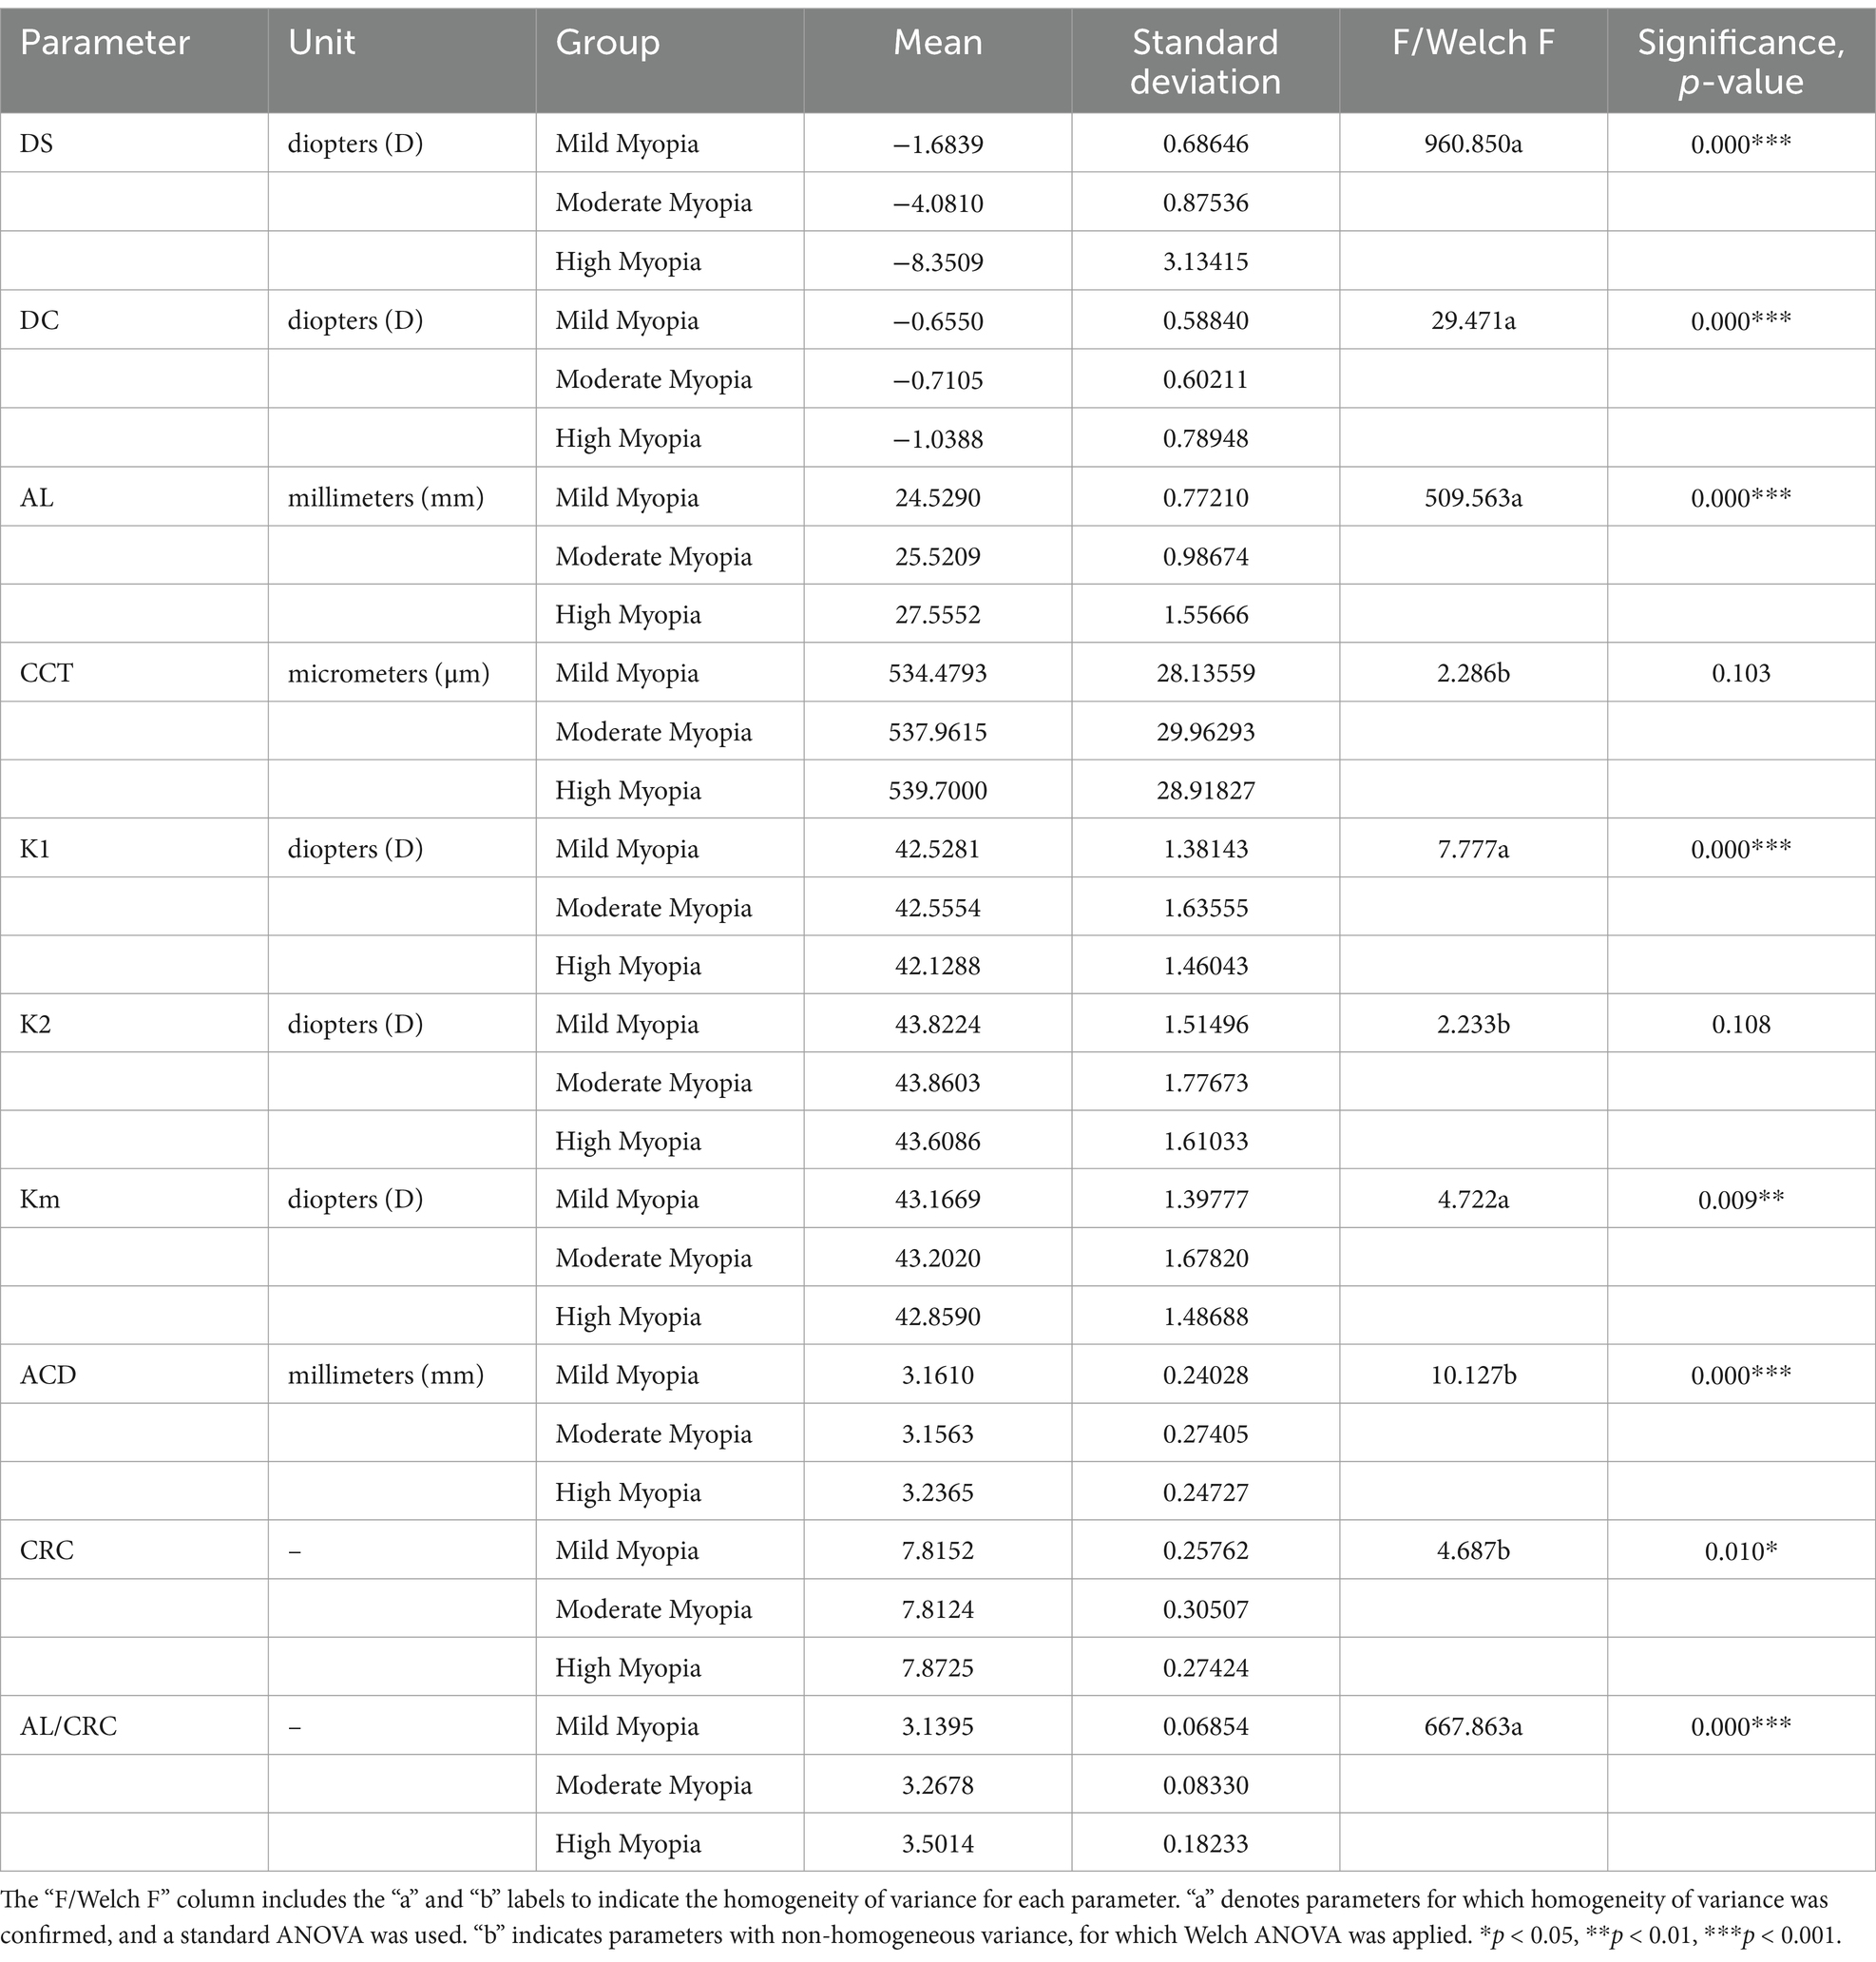
Table 2. Statistical analysis of differences among groups of different degrees of myopia.
Data were grouped based on the axial length (AL) results, with 111 eyes in the short axial length group, 522 eyes in the medium axial length group, and 393 eyes in the long axial length group. Similar to the previous analysis, homogeneity of variance tests was conducted, with consistent data variability observed for CCT, K1, K2, Km, and ACD (p > 0.05). Welch ANOVA was used for these variables. However, DS, DC, SE, CRC, and AL/CRC showed significant differences among groups (p < 0.05), indicating inconsistent data variability and the need for Welch ANOVA. Table 3 presents the statistical results of the differences among groups of different axial lengths, with significant differences observed in ten parameters among the groups (p < 0.05).
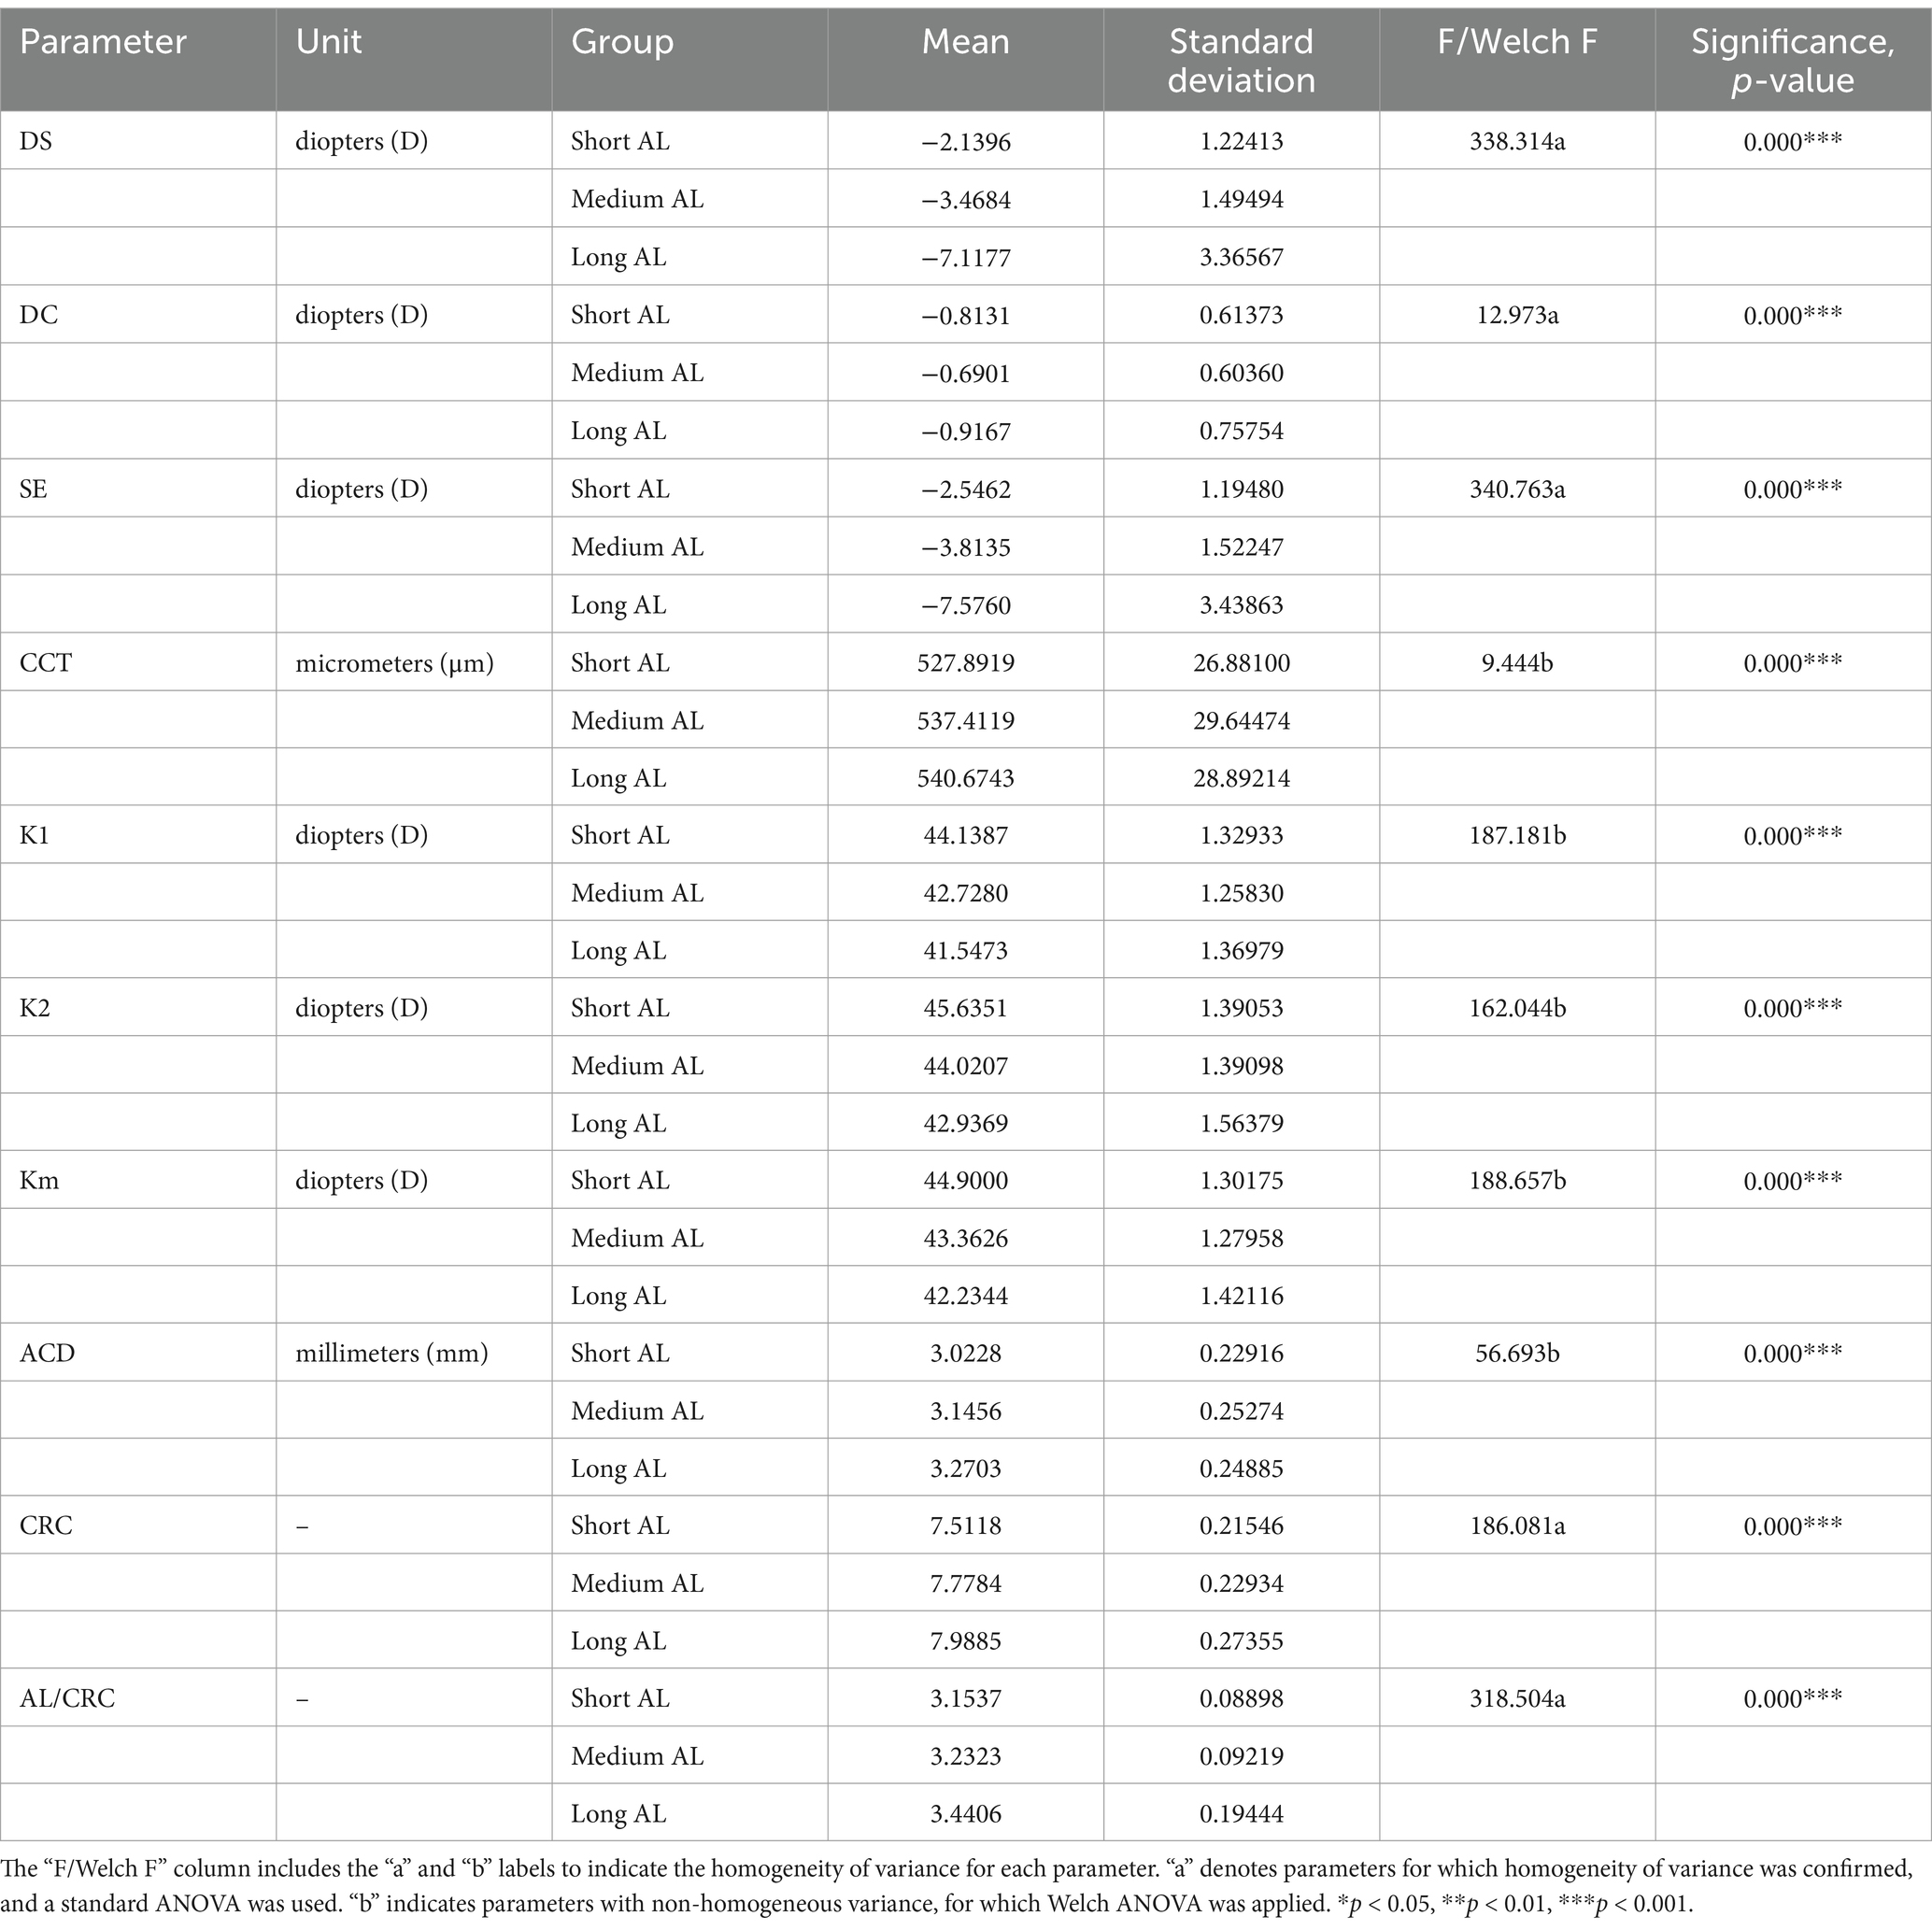
Table 3. Statistical analysis of differences among groups of different axial lengths.
Spearman correlation coefficients were calculated among the variables, and a matrix heatmap was plotted to visualize these correlations. In the heatmap, each cell’s color represents the magnitude of the correlation between the corresponding variables. Blue indicates a positive correlation, while red indicates a negative correlation. The intensity of the colors varies according to the correlation coefficients: darker shades represent stronger correlations, while lighter shades indicate weaker correlations. Variables with absolute correlation coefficients >0.7 were considered to have strong correlations.
The correlation analysis in this study revealed strong relationships between AL, SE, DS, and AL/CRC. Specifically, the strongest correlations were observed between AL and SE, as well as AL and DS. These strong positive correlations align with clinical knowledge, suggesting that changes in axial length are closely linked with variations in SE and refractive status. The AL/CRC parameter also demonstrated strong correlations with DS and SE, highlighting its potential as a composite measure for assessing refractive errors and supporting clinical diagnoses and prognostic evaluations.
In contrast, we noted weaker correlations between some of the other parameters, indicating that they are less directly related to the primary measures of axial length and refractive error. These weaker correlations may reflect secondary factors that are less influential in determining refractive status.
Based on the results in Figure 1 of section 3.4, this study found that the correlation coefficient between AL and SE is −0.78, suggesting a strong correlation between them. Setting SE as the dependent variable, the linear regression analysis between AL and SE showed a determination coefficient R2 = 0.699, indicating that the independent variable (AL) can explain 69.9% of the variance in the dependent variable (SE). The statistical test results of the model using analysis of variance (ANOVA) showed F = 2382.166 (p = 0.000), indicating the model’s statistical significance. Further calculation of the model’s intercept, regression coefficient of the independent variable, 95% confidence interval (CI), t-value, and p-value showed that the intercept of the regression model is 36.94, and the non-standardized coefficient (i.e., slope) of the independent variable (AL) is −1.63 (95% CI, −1.69 to −1.56). This indicates that for every 1 mm increase in AL, SE decreases by −1.63D, as illustrated in Figure 2. Based on this, the regression equation for this case can be written as:
This equation can be used to calculate the corresponding SE within a reasonable range of AL.
According to the results in Figure 1 of section 3.4, this study found that the correlation coefficient between AL/CRC and SE is −0.89, indicating a strong correlation between them. Setting SE as the dependent variable, the linear regression analysis between AL/CRC and SE showed a determination coefficient R2 = 0.861, indicating that the independent variable (AL/CRC) can explain 86.1% of the variance in the dependent variable (SE). The statistical test results of the model using analysis of variance (ANOVA) showed F = 6358.316 (p = 0.000), indicating the model’s statistical significance. Further calculation of the model’s intercept, regression coefficient of the independent variable, 95% confidence interval (CI), t-value, and p-value showed that the intercept of the regression model is 48.54, and the non-standardized coefficient of the independent variable (AL/CRC) is −16.24 (95% CI: −16.64 to −15.84). This indicates that for every 1-unit increase in AL/CRC, SE decreases by −16.24D, as illustrated in Figure 3. Based on this, the regression equation for this case can be written as:
This equation can be used to calculate the corresponding SE within a reasonable range of AL/CRC.
Based on the SE results of patients, AL and AL/CRC parameters were separately set as independent variables, and whether they had high myopia as the dependent variable. By comparing the area under the receiver operating characteristic (ROC) curves of the two indicators, the differences in the identification accuracy of high myopia between the two indicators were explored. The ROC curve is a visual tool for evaluating the classification method. When the AUC > 0.9, it indicates very high accuracy of the indicator, which can better distinguish between cases and non-cases. The results of this study found that the AUC for predicting high myopia through AL was 0.905 (95% CI: 0.885–0.925), and through AL/CRC was 0.952 (95% CI: 0.940–0.965). Both indicators showed high diagnostic accuracy, as shown in Figure 4. Furthermore, the statistical test results comparing the areas under the two indicators’ curves (AL-AL/CRC) showed a Z-value of −4.947, p-value of 0.000, and a difference in AUC of −0.048, indicating a statistically significant difference in the areas under the curves of the two diagnostic methods. Thus, it can be seen that the accuracy of AL/CRC in identifying high myopia is superior to that of AL, and the difference is statistically significant (p < 0.05).
This study comprehensively collected and analyzed ocular parameters in adult myopic patients to explore the differences in biological measurement indicators such as AL, corneal curvature, CCT, CRC, and AL/CRC among patients with different degrees of myopia. Furthermore, it investigated the correlation between axial length, AL/CRC, and the SE of myopic patients.
Firstly, significant differences were found in ocular parameters among patients with different degrees of myopia. Specifically, parameters such as AL, corneal curvature (K1, K2, Km), and ACD showed significant differences among patients with different degrees of myopia. In particular, AL significantly increased with the degree of myopia, while corneal curvature and anterior chamber depth showed varying trends. In our study, we found that CCT did not exhibit statistically significant differences across different myopia severity groups, which is consistent with the findings of several previous studies (28–31). This supports the notion that CCT may not be closely associated with the degree of myopia. However, we acknowledge that other studies have reported significant correlations between CCT and myopia severity, with some suggesting that CCT might play a role in myopic defocus compensation (24, 25). One possible explanation for this discrepancy could be the differences in study populations, methodologies, or sample sizes. For example, certain studies may have focused on populations with more extreme forms of myopia or employed different techniques for measuring CCT, which could lead to different results. Additionally, genetic and environmental factors could contribute to variations in CCT that may not be fully captured in our study.
Secondly, significant differences were observed in various ocular parameters among patients with different axial lengths. Specifically, as the axial length increased, CCT, ACD, CRC, and AL/CRC all showed a gradual increase. It is worth noting that in this study, CCT increased gradually with the increase in AL. However, a study by Jin et al. found a continuous decrease in CCT with the elongation of AL (25). Additionally, a retrospective multicenter study revealed a negative correlation between CCT and the rate of AL elongation, suggesting that thin CCT may be associated with accelerated myopia progression (32). Therefore, further evidence from evidence-based medicine is needed to explore the correlation between CCT and the degree of myopia and axial length.
Finally, this study focused on exploring the correlation between AL, AL/CRC, and SE of myopic patients and predicting high myopia. The results showed that compared to AL, AL/CRC had a stronger correlation with SE and better accuracy in identifying high myopia. Consistent with previous studies, most research on AL/CRC has focused on preschool children. Since preschool children cannot cooperate with cycloplegic refraction, some studies suggest that the AL/CRC ratio can be used as an alternative indicator to identify preschool children with low myopic reserves and myopia, aiding clinicians and parents in timely screening for low myopic reserve children before primary school (33, 34). Similarly, Fan et al.’s study also showed that the correlation between AL/CRC and SE was greater than that between AL and SE in adult myopic patients, suggesting that the AL/CRC index can to some extent be independent of refractive analysis and suitable for diagnosing high myopia in adults (35).
To further evaluate the diagnostic value of AL and AL/CRC for high myopia, this study employed ROC curve analysis. The results showed that the AUC for predicting high myopia was 0.905 (95% CI: 0.885–0.925) through AL and 0.952 (95% CI: 0.940–0.965) through AL/CRC, with a statistically significant difference in the areas under the curves of the two diagnostic methods. This indicates that AL/CRC significantly outperforms AL in identifying high myopia, demonstrating its superior predictive ability for high myopia.
AL/CRC measurement has several advantages. Firstly, it provides a reliable alternative method for diagnosing myopia in patients who cannot undergo cycloplegic refraction, especially in preschool children and patients with angle-closure glaucoma (26). Secondly, AL/CRC better reflects the biomechanical performance and morphological pathological changes caused by myopia progression, making it a more reliable indicator for diagnosing myopia and assessing the risk of fundus lesions in highly myopic patients (36). Thirdly, AL/CRC can also reflect the situation of peripheral retinal defocus. Patients with larger AL/CRC values are more likely to have myopic defocus around the retina, leading to further elongation of the axial length (27, 35, 36). However, while AL/CRC can be used to classify myopia of different grades, its potential for monitoring disease progression remains uncertain. Further evidence is needed to assess whether AL/CRC can accurately track changes in the degree of myopia over time and monitor the progression of myopia-related complications. Some studies have found that the progression of AL/CRC does not strongly correlate with the progression of SE, indicating that the relationship between AL/CRC and myopia progression is still not fully understood (37). This highlights the need for further investigation into the dynamic use of AL/CRC in clinical settings, particularly to determine its role in longitudinal monitoring of myopia and related ocular conditions.
This study has several limitations that should be addressed in future research. First, the small sample size may affect the generalizability of the findings, and larger studies are needed to improve statistical power. Additionally, the data were collected from a single medical institution, which may limit the external validity of the results. A multi-center approach could provide more representative data. The six-month observation period may not be sufficient to capture long-term myopia progression, and longer follow-up is needed. Moreover, while this study explored the relationship between the AL/CRC ratio and SE, it did not consider potential confounding factors such as age, gender, ethnicity, and other physiological characteristics (e.g., ocular diameter, lens thickness), which may influence the applicability of the AL/CRC ratio. Future studies should include more diverse populations and investigate how these factors impact the performance of the AL/CRC ratio to enhance its clinical relevance.
This study offers preliminary insights into the relationships among various ocular indicators of myopia. The results of the study indicate significant differences in eight indicators among patients with different degrees of myopia and ten indicators among patients with different axial lengths. There is a significant negative correlation between AL, AL/CRC, and SE. Compared to the AL index, the AL/CRC index has a stronger correlation with SE and better accuracy in identifying high myopia. The AL/CRC index measurement holds promise as an accurate and convenient alternative method for refractive examination.
This study analyzed ocular biological indicators in myopic patients, revealing significant variations across degrees of myopia and axial lengths. The AL/CRC index demonstrated a stronger correlation with SE and greater accuracy in identifying high myopia compared to the AL index, highlighting its potential as a precise and convenient alternative for refractive examination, particularly in patients unable to undergo cycloplegic refraction. These findings contribute valuable insights into the assessment of myopia and suggest promising directions for refining diagnostic methods in clinical practice.
The raw data supporting the conclusions of this article will be made available by the authors, without undue reservation.
The studies involving humans were approved by the Ethics Committee of Nanjing Medical University. The studies were conducted in accordance with the local legislation and institutional requirements. The participants provided their written informed consent to participate in this study.
FZ: Conceptualization, Formal analysis, Writing – original draft. NC: Conceptualization, Investigation, Writing – original draft. HQ: Project administration, Supervision, Writing – review & editing. DG: Methodology, Project administration, Software, Supervision, Visualization, Writing – review & editing. KL: Investigation, Project administration, Supervision, Writing – review & editing.
The author(s) declare financial support was received for the research, authorship, and/or publication of this article. This work was funded by the SanMing Project of Medicine in Shenzhen (No. SZSM202311012).
The authors declare that the research was conducted in the absence of any commercial or financial relationships that could be construed as a potential conflict of interest.
The author(s) declare that no Gen AI was used in the creation of this manuscript.
All claims expressed in this article are solely those of the authors and do not necessarily represent those of their affiliated organizations, or those of the publisher, the editors and the reviewers. Any product that may be evaluated in this article, or claim that may be made by its manufacturer, is not guaranteed or endorsed by the publisher.
1. Flitcroft, DI, He, M, Jonas, JB, Jong, M, Naidoo, K, Ohno-Matsui, K, et al. IMI - defining and classifying myopia: a proposed set of standards for clinical and epidemiologic studies. Invest Ophthalmol Vis Sci. (2019) 60:M20–30. doi: 10.1167/iovs.18-25957
2. Holden, BA, Fricke, TR, Wilson, DA, Jong, M, Naidoo, KS, Sankaridurg, P, et al. Global prevalence of myopia and high myopia and temporal trends from 2000 through 2050. Ophthalmology. (2016) 123:1036–42. doi: 10.1016/j.ophtha.2016.01.006
3. Singh, H, Singh, H, Latief, U, Tung, GK, Shahtaghi, NR, Sahajpal, NS, et al. Myopia, its prevalence, current therapeutic strategy and recent developments: a review. Indian J Ophthalmol. (2022) 70:2788–99. doi: 10.4103/ijo.IJO_2415_21
4. Morgan, IG, French, AN, Ashby, RS, Guo, X, Ding, X, He, M, et al. The epidemics of myopia: aetiology and prevention. Prog Retin Eye Res. (2018) 62:134–49. doi: 10.1016/j.preteyeres.2017.09.004
5. Naidoo, KS, Fricke, TR, Frick, KD, Jong, M, Naduvilath, TJ, Resnikoff, S, et al. Potential lost productivity resulting from the global burden of myopia: systematic review, meta-analysis, and modeling. Ophthalmology. (2019) 126:338–46. doi: 10.1016/j.ophtha.2018.10.029
6. Saw, SM, Matsumura, S, and Hoang, QV. Prevention and management of myopia and myopic pathology. Invest Ophthalmol Vis Sci. (2019) 60:488–99. doi: 10.1167/iovs.18-25221
7. Tang, J, Liao, Y, Yan, N, Dereje, SB, Wang, J, Luo, Y, et al. Efficacy of repeated low-level red-light therapy for slowing the progression of childhood myopia: a systematic review and meta-analysis. Am J Ophthalmol. (2023) 252:153–63. doi: 10.1016/j.ajo.2023.03.036
8. Jiang, L, Goh, DX, Koh, JHZ, Chan, X, Brennan, NA, Barathi, VA, et al. Applications of genomics and transcriptomics in precision medicine for myopia control or prevention. Biomol Ther. (2023) 13:494. doi: 10.3390/biom13030494
9. Li, Y, Foo, LL, Wong, CW, Li, J, Hoang, QV, Schmetterer, L, et al. Pathologic myopia: advances in imaging and the potential role of artificial intelligence. Br J Ophthalmol. (2023) 107:600–6. doi: 10.1136/bjophthalmol-2021-320926
10. Du, R, and Ohno-Matsui, K. Novel uses and challenges of artificial intelligence in diagnosing and managing eyes with high myopia and pathologic myopia. Diagnostics. (2022) 12:1210. doi: 10.3390/diagnostics12051210
11. Zhang, J, and Zou, H. Insights into artificial intelligence in myopia management: from a data perspective. Graefes Arch Clin Exp Ophthalmol. (2024) 262:3–17. doi: 10.1007/s00417-023-06101-5
12. Alnahedh, TA, and Taha, M. Role of machine learning and artificial intelligence in the diagnosis and treatment of refractive errors for enhanced eye care: a systematic review. Cureus. (2024) 16:e57706. doi: 10.7759/cureus.57706
13. Ren, PF, Tang, XY, Yu, CY, Zhu, LL, Yang, WH, and Shen, Y. Evaluation of a novel deep learning based screening system for pathologic myopia. Int J Ophthalmol. (2023) 16:1417–23. doi: 10.18240/ijo.2023.09.07
14. Zhu, S, Zhan, H, Yan, Z, Wu, M, Zheng, B, Xu, S, et al. Prediction of spherical equivalent refraction and axial length in children based on machine learning. Indian J Ophthalmol. (2023) 71:2115–31. doi: 10.4103/IJO.IJO_2989_22
15. Yang, J, Ouyang, X, Fu, H, Hou, X, Liu, Y, Xie, Y, et al. Advances in biomedical study of the myopia-related signaling pathways and mechanisms. Biomed Pharmacother. (2022) 145:112472. doi: 10.1016/j.biopha.2021.112472
16. Pan, CW, Ramamurthy, D, and Saw, SM. Worldwide prevalence and risk factors for myopia. Ophthalmic Physiol Opt. (2012) 32:3–16. doi: 10.1111/j.1475-1313.2011.00884.x
17. Morgan, IG, Wu, PC, Ostrin, LA, Tideman, JWL, Yam, JC, Lan, W, et al. IMI risk factors for myopia. Invest Ophthalmol Vis Sci. (2021) 62:3. doi: 10.1167/iovs.62.5.3
18. Mountjoy, E, Davies, NM, Plotnikov, D, Smith, GD, Rodriguez, S, Williams, CE, et al. Education and myopia: assessing the direction of causality by mendelian randomisation. BMJ. (2018) 361:k2022. doi: 10.1136/bmj.k2022
19. Hu, T, Wu, R, Wang, W, Li, H, and Peng, X. Analysis of factors related to the development of ocular biometric parameters in Chinese children aged 6-10 years: a cross-sectional study. BMJ Open. (2024) 14:e080066. doi: 10.1136/bmjopen-2023-080066
20. Lai, L, Trier, K, and Cui, DM. Role of 7-methylxanthine in myopia prevention and control: a mini-review. Int J Ophthalmol. (2023) 16:969–76. doi: 10.18240/ijo.2023.06.21
21. Du, R, Xie, S, Igarashi-Yokoi, T, Watanabe, T, Uramoto, K, Takahashi, H, et al. Continued increase of axial length and its risk factors in adults with high myopia. JAMA Ophthalmol. (2021) 139:1096–103. doi: 10.1001/jamaophthalmol.2021.3303
22. Tideman, JWL, Polling, JR, Vingerling, JR, Jaddoe, VWV, Williams, C, Guggenheim, JA, et al. Axial length growth and the risk of developing myopia in European children. Acta Ophthalmol. (2018) 96:301–9. doi: 10.1111/aos.13603
23. Wang, Y, Liu, Y, Zhu, X, Zhou, X, He, JC, and Qu, X. Corneal and lenticular biometry in Chinese children with myopia. Clin Exp Optom. (2023) 106:836–44. doi: 10.1080/08164622.2022.2116269
24. Mimouni, M, Flores, V, Shapira, Y, Graffi, S, Levartovsky, S, Sela, T, et al. Correlation between central corneal thickness and myopia. Int Ophthalmol. (2018) 38:2547–51. doi: 10.1007/s10792-017-0766-1
25. Jin, G, Liu, Z, Wang, L, Zhu, Y, Luo, L, and Liu, Y. Corneal biometric features and their association with axial length in high myopia. Am J Ophthalmol. (2022) 238:45–51. doi: 10.1016/j.ajo.2021.11.031
26. Mu, J, Zeng, D, Fan, J, Liu, M, Zhong, H, Shuai, X, et al. The accuracy of the axial length and axial length/corneal radius ratio for myopia assessment among Chinese children. Front Pediatr. (2022) 10:859944. doi: 10.3389/fped.2022.859944
27. Yu, Q, and Zhou, JB. Scleral remodeling in myopia development. Int J Ophthalmol. (2022) 15:510–4. doi: 10.18240/ijo.2022.03.21
28. Fam, HB, How, AC, Baskaran, M, Lim, KL, Chan, YH, and Aung, T. Central corneal thickness and its relationship to myopia in Chinese adults. Br J Ophthalmol. (2006) 90:1451–3. doi: 10.1136/bjo.2006.101170
29. Al-Mezaine, HS, Al-Obeidan, S, Kangave, D, Sadaawy, A, Wehaib, TA, and Al-Amro, SA. The relationship between central corneal thickness and degree of myopia among Saudi adults. Int Ophthalmol. (2009) 29:373–8. doi: 10.1007/s10792-008-9249-8
30. Chen, YC, Kasuga, T, Lee, HJ, Lee, SH, and Lin, SY. Correlation between central corneal thickness and myopia in Taiwan. Kaohsiung J Med Sci. (2014) 30:20–4. doi: 10.1016/j.kjms.2013.08.008
31. Ortiz, S, Mena, L, Rio-San Cristobal, A, and Martin, R. Relationships between central and peripheral corneal thickness in different degrees of myopia. J Optom. (2014) 7:44–50. doi: 10.1016/j.optom.2013.03.005
32. Zhou, P, Wang, DD, Fan, L, Yang, L, and Zhao, MW. Thin central corneal thickness may be a risk factor for myopia progression in children. J Ophthalmol. (2023) 2023:3815863. doi: 10.1155/2023/3815863
33. Tang, T, Zhao, H, Liu, D, Li, X, Wang, K, Li, Y, et al. Axial length to corneal radius of curvature ratio and refractive error in Chinese preschoolers aged 4-6 years: a retrospective cross-sectional study. BMJ Open. (2023) 13:e075115. doi: 10.1136/bmjopen-2023-075115
34. Foo, VH, Verkicharla, PK, Ikram, MK, Chua, SY, Cai, S, Tan, CS, et al. Axial length/corneal radius of curvature ratio and myopia in 3-year-old children. Transl Vis Sci Technol. (2016) 5:5. doi: 10.1167/tvst.5.1.5
35. Fan, Y, Huang, Y, and Huang, X. Association between axial length to corneal curvature radius ratio and myopia in adult patients. J Ophthalmol. (2024) 2024:4981095. doi: 10.1155/2024/4981095
36. Jonas, JB, Ang, M, Cho, P, Guggenheim, JA, He, MG, Jong, M, et al. IMI prevention of myopia and its progression. Invest Ophthalmol Vis Sci. (2021) 62:6. doi: 10.1167/iovs.62.5.6
Keywords: myopia, axial length, spherical equivalent, corneal radius of curvature, axial length/corneal radius of curvature ratio
Citation: Zhou F, Chen N, Qian H, Gong D and Li K (2025) A study on the variability and correlation of ocular biological measurement parameters in adult myopic patients. Front. Med. 11:1526703. doi: 10.3389/fmed.2024.1526703
Edited by:
Qi Dai, Wenzhou Medical University, ChinaReviewed by:
Gangjin Kang, The Affiliated Hospital of Southwest Medical University, ChinaCopyright © 2025 Zhou, Chen, Qian, Gong and Li. This is an open-access article distributed under the terms of the Creative Commons Attribution License (CC BY). The use, distribution or reproduction in other forums is permitted, provided the original author(s) and the copyright owner(s) are credited and that the original publication in this journal is cited, in accordance with accepted academic practice. No use, distribution or reproduction is permitted which does not comply with these terms.
*Correspondence: Hui Qian, cWlhbmh1aTE4NzUyMEAxMjYuY29t; Di Gong, Z29uZ2RpMTk5NTEyQDE2My5jb20=; Kunke Li, bGlrdW5rZUBmb3htYWlsLmNvbQ==
†These authors have contributed equally to this work and share first authorship
Disclaimer: All claims expressed in this article are solely those of the authors and do not necessarily represent those of their affiliated organizations, or those of the publisher, the editors and the reviewers. Any product that may be evaluated in this article or claim that may be made by its manufacturer is not guaranteed or endorsed by the publisher.
Research integrity at Frontiers
Learn more about the work of our research integrity team to safeguard the quality of each article we publish.