 Muhammad Zafar Iqbal
 Rodica Ivan
 Colleen Robb
 Jillian Derby
- Research Department, Acuity Insights, Toronto, ON, Canada
Introduction: Situational judgment tests (SJT) are commonly used in admissions to measure skills associated with professionalism. Although open-response SJTs have shown strong psychometric properties, assessors’ personal beliefs, experiences, and cultural backgrounds may influence how they perceive, organize and evaluate information within test takers’ diverse responses. Additionally, SJT research typically focuses on reliability and predictive validity, whereas the construct validity of open response SJTs remains underexplored. This mixed methods study aims to address this gap by exploring the construct-(ir)relevant factors that may impact assessors’ evaluation of professionalism in open response SJTs.
Methods: For this study, we used data from Casper, an open response SJT commonly used in professional program admissions. In Study I, a quantitative content analysis was conducted on 160 responses to identify factors which were significant predictors of low and high scores. Correlation coefficients and logistic regression models were used to evaluate the relationship between each factor and response scores. In Study II, think-aloud activities were conducted with 23 Casper assessors to directly observe how they evaluated responses. All interviews were transcribed verbatim, which were then thematically analyzed using an inductive coding technique.
Results: Results from both the content analyses and think-aloud activities revealed that several construct relevant factors influenced scores. Scores were impacted by the extent to which test takers demonstrated the competencies probed for by the SJT, engaged with the context of the presented ethical dilemma, provided in-depth justifications for their response, considered various perspectives relevant to the presented dilemma, and provided creative solutions or insightful arguments for the suggested approach. Mixed results were found with respect to construct irrelevant factors, such as the flow, cohesion, and kinds of phrases used in the response.
Conclusion: This mixed methods study contributes to the construct validity of SJTs by investigating construct relevant and irrelevant factors that may impact assessors’ evaluation of open responses. The findings of this study provide evidence that open-response SJTs are valid approaches to measure professional competencies more broadly, both in terms of what test takers focus on in their responses, as well as in terms of how they construct their responses.
1 Introduction
Situational judgment tests (SJT) are typically used to measure skills associated with professionalism by evaluating one’s responses to a variety of hypothetical scenarios that professionals would likely encounter in their roles or everyday life (1–3). Over the years, higher education programs have been increasingly integrating SJTs into their admissions process alongside traditional academic measures (e.g., GPA) across different professions, including medicine (4–7), healthcare (8, 9), and teacher’s education (10, 11). Historically, higher education programs relied on reference letters, personal statements, interviews, and/or multiple mini interviews (MMIs) to assess applicants’ personal and professional skills. Unfortunately, studies suggest that reference letters and personal statements have poor reliability and predictive validity (5, 12, 13). More recent concerns include the authenticity of such documents, given that letters written by artificial intelligence tools (i.e., ChatGPT) may sometimes be indistinguishable from those written by humans (14, 15). Alternatively, although interviews and MMIs are reliable and valid (16), they are also time and resource intensive for programs and applicants (9, 17). In the context of the limitations of these traditional measures, SJTs have emerged to be a cost effective and psychometrically sound method for assessing applicants’ professionalism early in the admissions process (5, 6).
While SJTs may share similar theoretical frameworks (2), there are unique test design elements that can have a notable impact on the measured construct(s) and on the quality of the test results (18, 19). We discuss two of these elements here: the response format and the question type. Typically, SJTs have either a fixed-response or an open-response format (and sometimes a combination of both). Fixed-response formats (e.g., multiple choice) require test takers to rate, rank, or select a response from a set of predetermined options, whereas open-response formats allow test takers to formulate their own responses by describing their approach and providing a rationale unique to them, their experience, and their interpretation of the presented situation (20, 21). Another key design difference in SJTs is the question type. Knowledge type questions, more commonly used in fixed-response SJTs, ask test takers to determine the extent to which the provided options would be effective in a specific scenario, inherently measuring one’s knowledge (22). Alternatively, behavioral tendency questions, more commonly used in open-response SJTs, ask test takers to express how they would likely react in response to the presented situation, thus measuring non-technical constructs like behaviors and traits associated with professionalism (22, 23).
When comparing the qualities of fixed-response and open-response SJTs, fixed-response formats have shown to produce larger demographic group differences (21); to be more vulnerable to fake or deceptive responses (15, 24, 25); and have revealed weaker predictive validity (26–28). In the context of medical school admissions, open-response SJTs measuring social intelligence and professionalism have evidenced correlations with interview performance ranging from r = 0.11 to r = 0.48 (27, 28), while fixed-response SJTs measuring similar constructs have evidenced relatively lower correlations ranging from r = 0.09 to r = 0.11 (26).
While open-response SJTs might be associated with relatively stronger psychometric properties, they are also inherently subject to more variability in the response content, and consequently more variability in how these responses are assessed. Open-response tests not only allow test takers to provide diverse and complex responses, they also offer more nuance in how assessors interpret and evaluate these individual responses against the provided scoring criteria (29–31). In a study investigating how assessors mark student essays, Hasan and Jones used think-aloud interviews to explore the scoring process and found that assessors would often rely on norm referencing (comparing essays to each other) even when instructed to closely follow scoring guidelines (31). Moreover, assessors’ personal beliefs, experiences, and cultural backgrounds may influence how they perceive, organize and evaluate information within responses and can sometimes lead to inconsistent or biased scoring (30, 32, 33). For instance, Condor found that construct-irrelevant factors such as response length, language, and phrase frequency can predict human assigned scores even for cognitive mathematics tests using open responses (34). Additionally, Mello et al. (35) argue that scoring open-ended responses is time-consuming, which might lead assessors to superficially screen responses and not fully consider applicants’ abilities. Other assessor related biases such as the halo effect (an applicant’s first impression influencing an assessor’s subsequent judgments) and leniency or severity bias (assessors consistently scoring higher or lower than average) have also been reported in the literature (33, 36). Given that this variability can undermine the reliability and fairness of SJT scores, it is vital that we understand the cognitive processes of assessors. It is important to highlight, however, that scoring can be quite complex for open-response and fixed-response SJTs alike. By design, SJTs present test takers with situations where several answers are plausible and/or appropriate. Since there is no definitive correct answer in either SJT format, fixed-response SJTs may employ several possible methods (i.e., empirical, expert-based, etc.) to score each response option, and thus impact the validity of the test (37), its reliability (38), as well as the measured construct (23).
Although both the response format (open/fixed) and the scoring process have been argued to affect the measured construct (19, 23), SJT research has primarily focused on (i) fixed-response SJTs, and (ii) quantitative psychometric properties, especially reliability and predictive validity evidence – that is – the relationship between SJT scores and future performance (6, 39). In fact, some scholars have claimed that the research focus on the relationship between SJT scores and other metrics (e.g., grades, interviews) has led to a lack of clarity in terms of the actual construct that SJTs are intended to measure (19, 40), which highlights the need for more in-depth construct validity research (19, 41). To address the literature gap on how SJTs measure their intended construct, Wolcott et al. (42) used think-aloud interviews to probe further into factors that impact test takers’ response process in a fixed-response SJT. In this study, we further address this gap by considering an entirely different piece of the puzzle, namely the factors that impact assessors’ scoring process in an open-response SJT. While SJTs often employ scoring guidelines to enhance score reliability and inter-rater agreement, assessors might nevertheless consider additional response attributes when deciding which scores to assign (30–32). Thus, we narrow in on the following research question: which construct-(ir)relevant factors play a role in assessors’ evaluation of test takers’ unique answers to open-response SJT scenarios?
To explore this research question, the Casper SJT was used, an open-response SJT that assesses the social intelligence and professionalism of those applying to a variety of professional programs (e.g., medicine, engineering, teacher’s education, health sciences, business, etc.). The Casper test comprises hypothetical scenarios designed to assess a combination of multiple personal and professional competencies including empathy, communication, motivation, resilience, self-awareness, problem-solving, collaboration, ethics, equity, and professionalism (43). These scenarios are presented to test-takers as either a text prompt (i.e., a short written description of a situation) or a video prompt (i.e., trained actors performing a situation). Test takers are required to respond to the scenario questions in two unique ways: either typing out their response or verbalizing their response via audio-visual recording. Responses are then scored by trained human assessors on a scale of 1 to 9. While assessors are provided with scoring guidelines specific for each scenario, scoring is also norm-referenced (i.e., responses are scored relative to other responses to the same scenario within the same test sitting). The scoring guidelines provide assessors with (1) a set of guiding questions to help them determine the extent to which the responses effectively answered the questions posed in the scenario and (2) detailed context on how the scenario relates to Casper competencies. Importantly, Casper was also selected because it demonstrates high reliability and validity (α = 0.82, test–retest reliability y = 0.75) (44), indicating that the items of the test work together to measure the same construct (45). Additionally, Casper has been shown to predict future performance on similar measures such as interview performance with correlations ranging from r = 0.11 to r = 0.48 (27, 28, 44).
Casper, with its open-response format and use of behavioral tendency questions, produces large pieces of text data which are then evaluated by human assessors. Although Casper has continuously demonstrated strong psychometric qualities (46), it is unclear what additional response attributes assessors consider during the scoring process (30, 31). By nature of its design, Casper provides optimal data for examining which construct-(ir)relevant factors may impact assessors’ evaluation of test takers’ unique answers to open-response SJT questions.
Given the complexity of this task, we employed a mixed-methods approach. First, we conducted a quantitative content analysis of test takers’ Casper responses to identify potential factors and response characteristics that might impact scoring (Study I). Then, in line with Hasan and Jones (31) and Wolcott et al. (42), we used think-aloud interviews to observe participants’ process and delve deeper into their decision making (Study II). While in Study I we focused on the content of test takers’ responses, in Study II we directly observed how assessors interacted with this content as they evaluated responses against scoring guidelines. Together, these findings shed more light on the implicit factors that play a role in assessing open-response SJTs, contribute to construct validity research on SJTs, and help enhance the transparency of SJTs more broadly.
2 Study I: quantitative content analysis
The primary aim of this study was to delve deeper into the content of test takers’ responses to Casper items and identify which response characteristics might play a role in scoring. Given the variability in response content and response assessment of open-response SJTs discussed above, we hypothesized that construct relevant and construct irrelevant factors alike impact a response’s score. Therefore, we expected that both types of factors would correlate with scores and predict low (1–3) and high (7–9) Casper scores.
2.1 Method
The open-response format of the Casper test results in large pieces of text data; therefore, we chose to conduct a content analysis because of its ability to dissect and identify granular response characteristics and apply a quantitative approach to aid in interpretation (47, 48). At its core, content analysis is a process by which large pieces of information are segmented into unique categories (i.e., factors) using coding rules which are guided by theory and/or previous findings (47, 49).
2.2 Procedure
We used a robust checklist for content analysis, which was developed by two researchers (RI and CR) who performed a thematic analysis of historical Casper data (i.e., 60 test takers responses) using an emergent approach. As outlined by Stemler (49), an emergent approach to checklist creation is an iterative process in which researchers review a set of data, identify factors for the checklist, reconcile differences, and edit accordingly. After developing the codes, we conducted multiple discussion rounds in which all four researchers went through all codes one by one, discussed their feasibility and voted for their inclusion and exclusion. In cases when a code was important but not clear, we reworded it to improve its clarity and applicability. Only those codes were kept in the checklist that received at least three out of four votes. Once the codes were finalized, two researchers (RI and CR) developed their definitions, and the other two researchers (MZI and JD) provided constructive feedback on the wording. Afterwards, consensus on the definitions of all codes was developed synchronously in a team discussion meeting.
Based on this historical data, we identified 13 different factors (see Table 1), nine of which were construct relevant and either related to information provided in the scoring guidelines (Addressed competencies targeted in the scenario, Considered context of the scenario) or they were common construct relevant characteristics of responses which are not directly referenced in the scoring guidelines (provided justification, consideration of other perspectives). The construct irrelevant factors we identified in the responses pertained to linguistic considerations or to applicant appearance (for the video responses). One of these construct irrelevant factors, Used phrases suggested by third party training materials, was inspired by online unofficial sources (unaffiliated with Casper) which recommend using particular phrases, e.g., “I would approach my colleague in a non-confrontational manner in a private setting.”
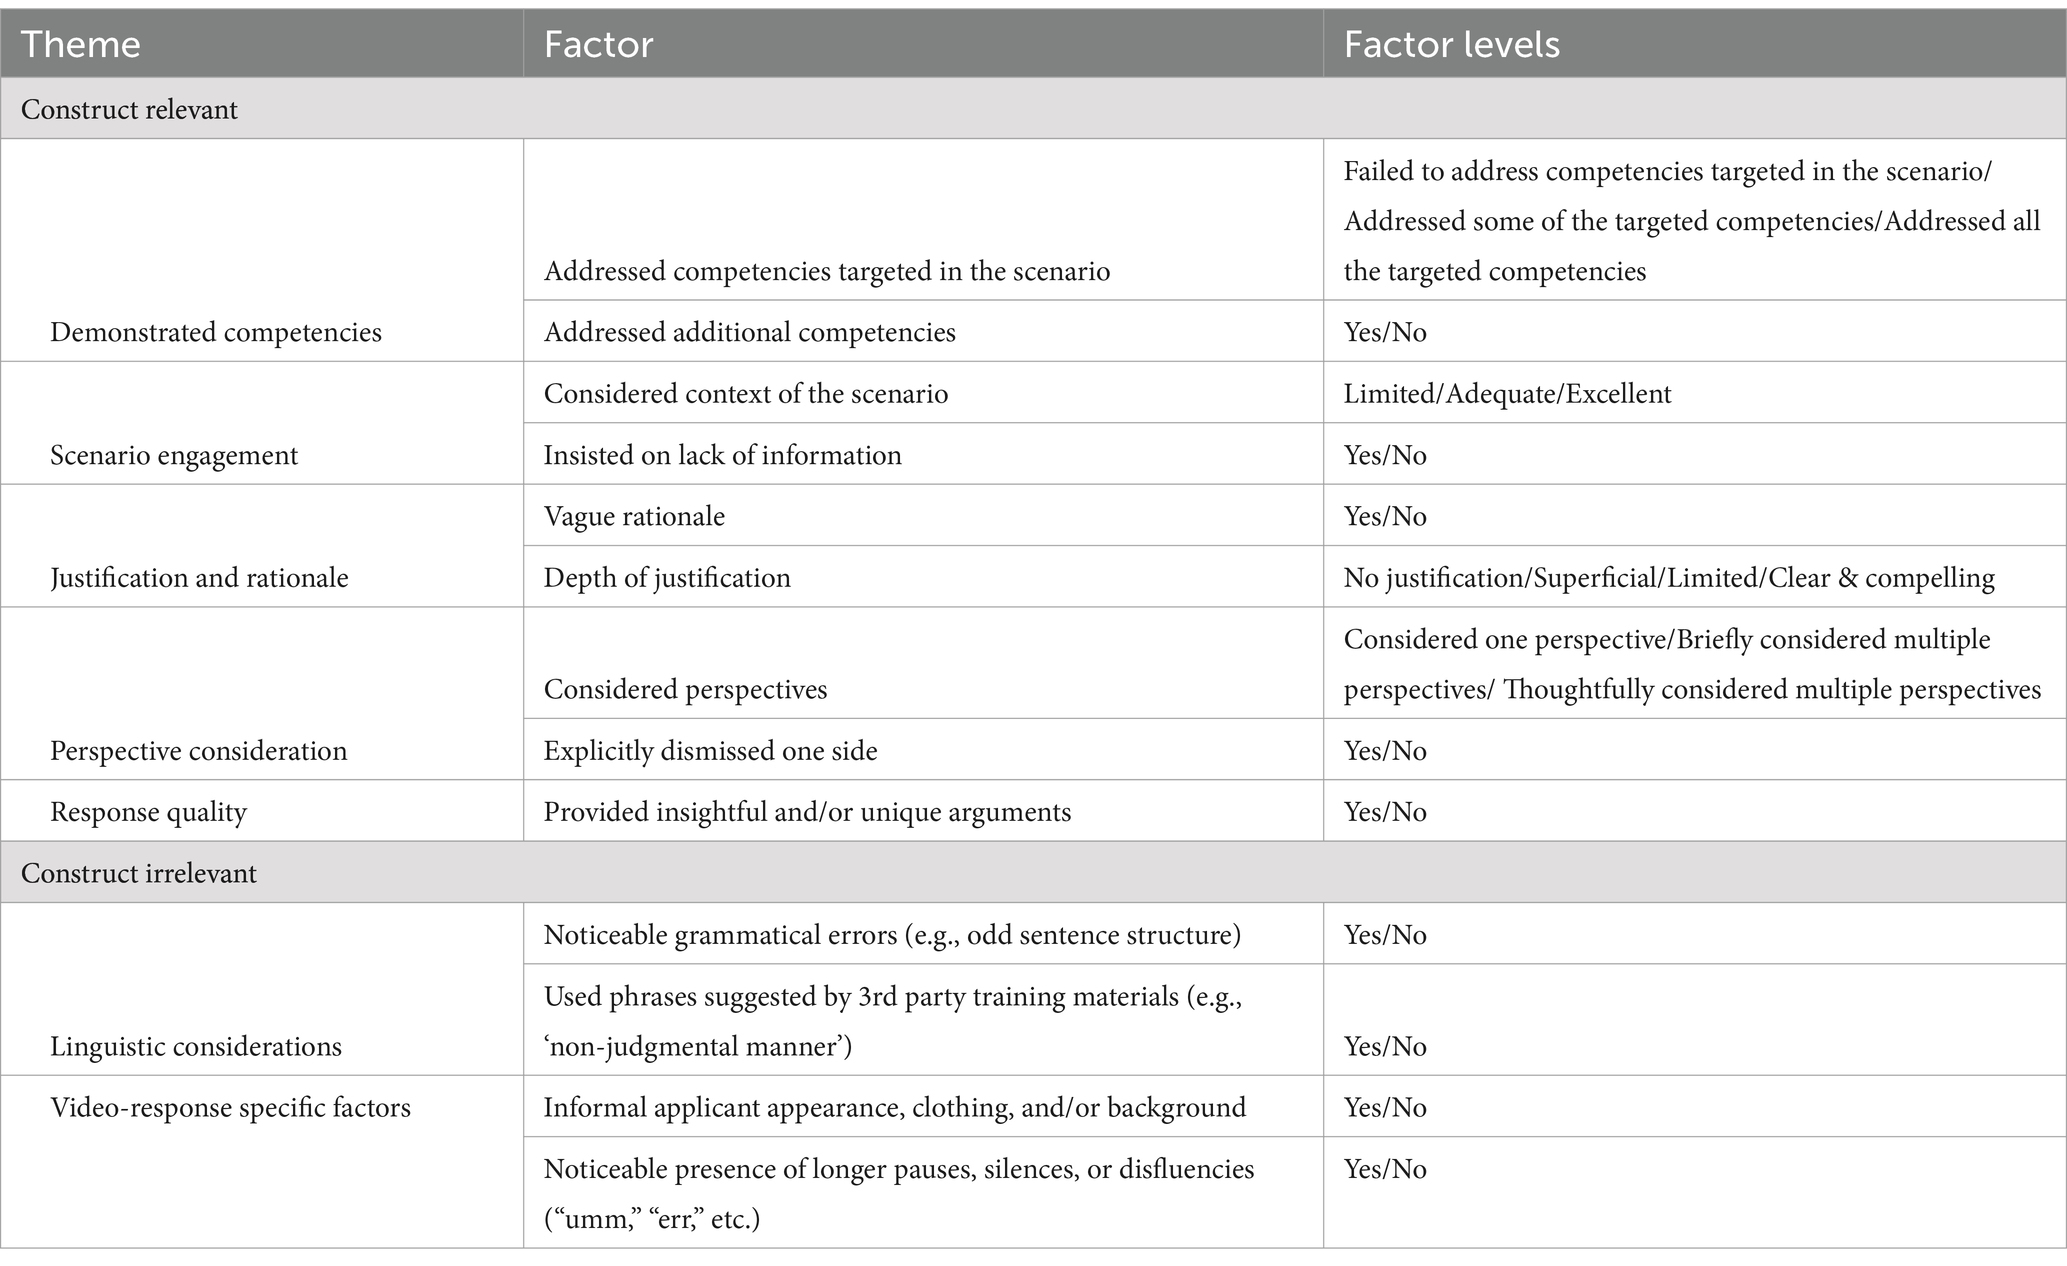
Table 1. Checklist: emergent factors from the thematic analysis of historical data.
2.3 Materials
To ensure a representative sample, the data selection process was as follows.
2.3.1 Test selection
Casper tests were considered if they were from the most recent application cycle available (2022–2023) and written by a minimum of 1,000 test takers to a variety of health sciences programs (e.g., occupational therapy, physician assistant, nursing, etc.). Ultimately, we selected a test from June 2022 which featured responses from 1,264 unique US test takers.
2.3.2 Scenario selection
The selected test included responses to 9 typed responses and 6 video responses. A sample of 3 scenarios of each response type were selected. We aimed for scenarios which had a good balance in terms of three psychometric criteria: average scores, item total correlations, and magnitude of demographic group differences.
The average score for the 15 scenarios ranged from 4.66 to 5.60; we selected scenarios that had an average score closer to the overall average score, namely 5.09. Aiming to ensure that a test taker’s score for a particular scenario was representative of their overall score, we only considered scenarios with an item total correlation between 0.30 and 0.70 as this range is often considered acceptable (50). All scenarios under consideration met this threshold, as their item total correlation ranged from 0.31 to 0.67. The magnitude of demographic group differences was assessed via Cohen’s d values. We aimed for the demographic differences for the score obtained on these particular scenarios to be considered negligible, small, or moderate in magnitude. For this reason, we ensured that no scenarios produced Cohen’s d values above 0.60 (51).
Following the identification of scenarios that met the desired quantitative thresholds, the final selections were discussed among the team to develop consensus. In total, six unique scenarios were selected for analysis: three typed responses and three video responses.
2.3.3 Response selection
Using the checklist (see Table 1), three researchers (MZI, RI, CR) conducted the content analysis independently, resulting in 243 observations (81 responses x 3 researchers) for typed responses and 237 observations (79 responses x 3 researchers) for video responses (2 responses removed due to technological issues). To ensure that the responses used in the content analysis were representative of the responses typically observed within a Casper test, we considered both the response score and the response length. Within each response score category, responses were labeled as short, average, or long according to word count for typed responses or video length for video responses. That is, the first tertile by response length within each of the 9 score categories was labeled ‘short’ (mean word count 168.2), the second tertile ‘average’ (mean word count 202.2) and the third tertile ‘long’ (mean word count 241.3). After this classification, for each possible score (1–9), a short, average, and long response was randomly selected. This process was completed for each of the six unique scenarios. After selection, two participants’ video-response answers were removed due to technological issues. Thus, a total of 160 responses were analyzed: 81 responses for typed responses and 79 responses for video responses. Prior to conducting the content analysis on the selected responses, all three researchers completed a practice content analysis on nine typed responses and nine video responses. Upon completion of the practice content analysis, the researchers met to align on and further establish consensus on factor definitions and levels.
2.3.4 Study participants
This demographic information was collected through an optional self-reported survey that test takers complete immediately after their test. Consent to use test takers’ responses for this study was obtained through the test’s Terms and Conditions which are signed upon test registration. This signed consent allows for response data to be used in research projects in an anonymized and aggregate fashion. In Table 2, we report the demographic makeup of the 154 unique test takers in the study sample, as well as the demographic makeup of the study population, namely the 31,860 applicants to US health science programs who took Casper in 2022–2023.
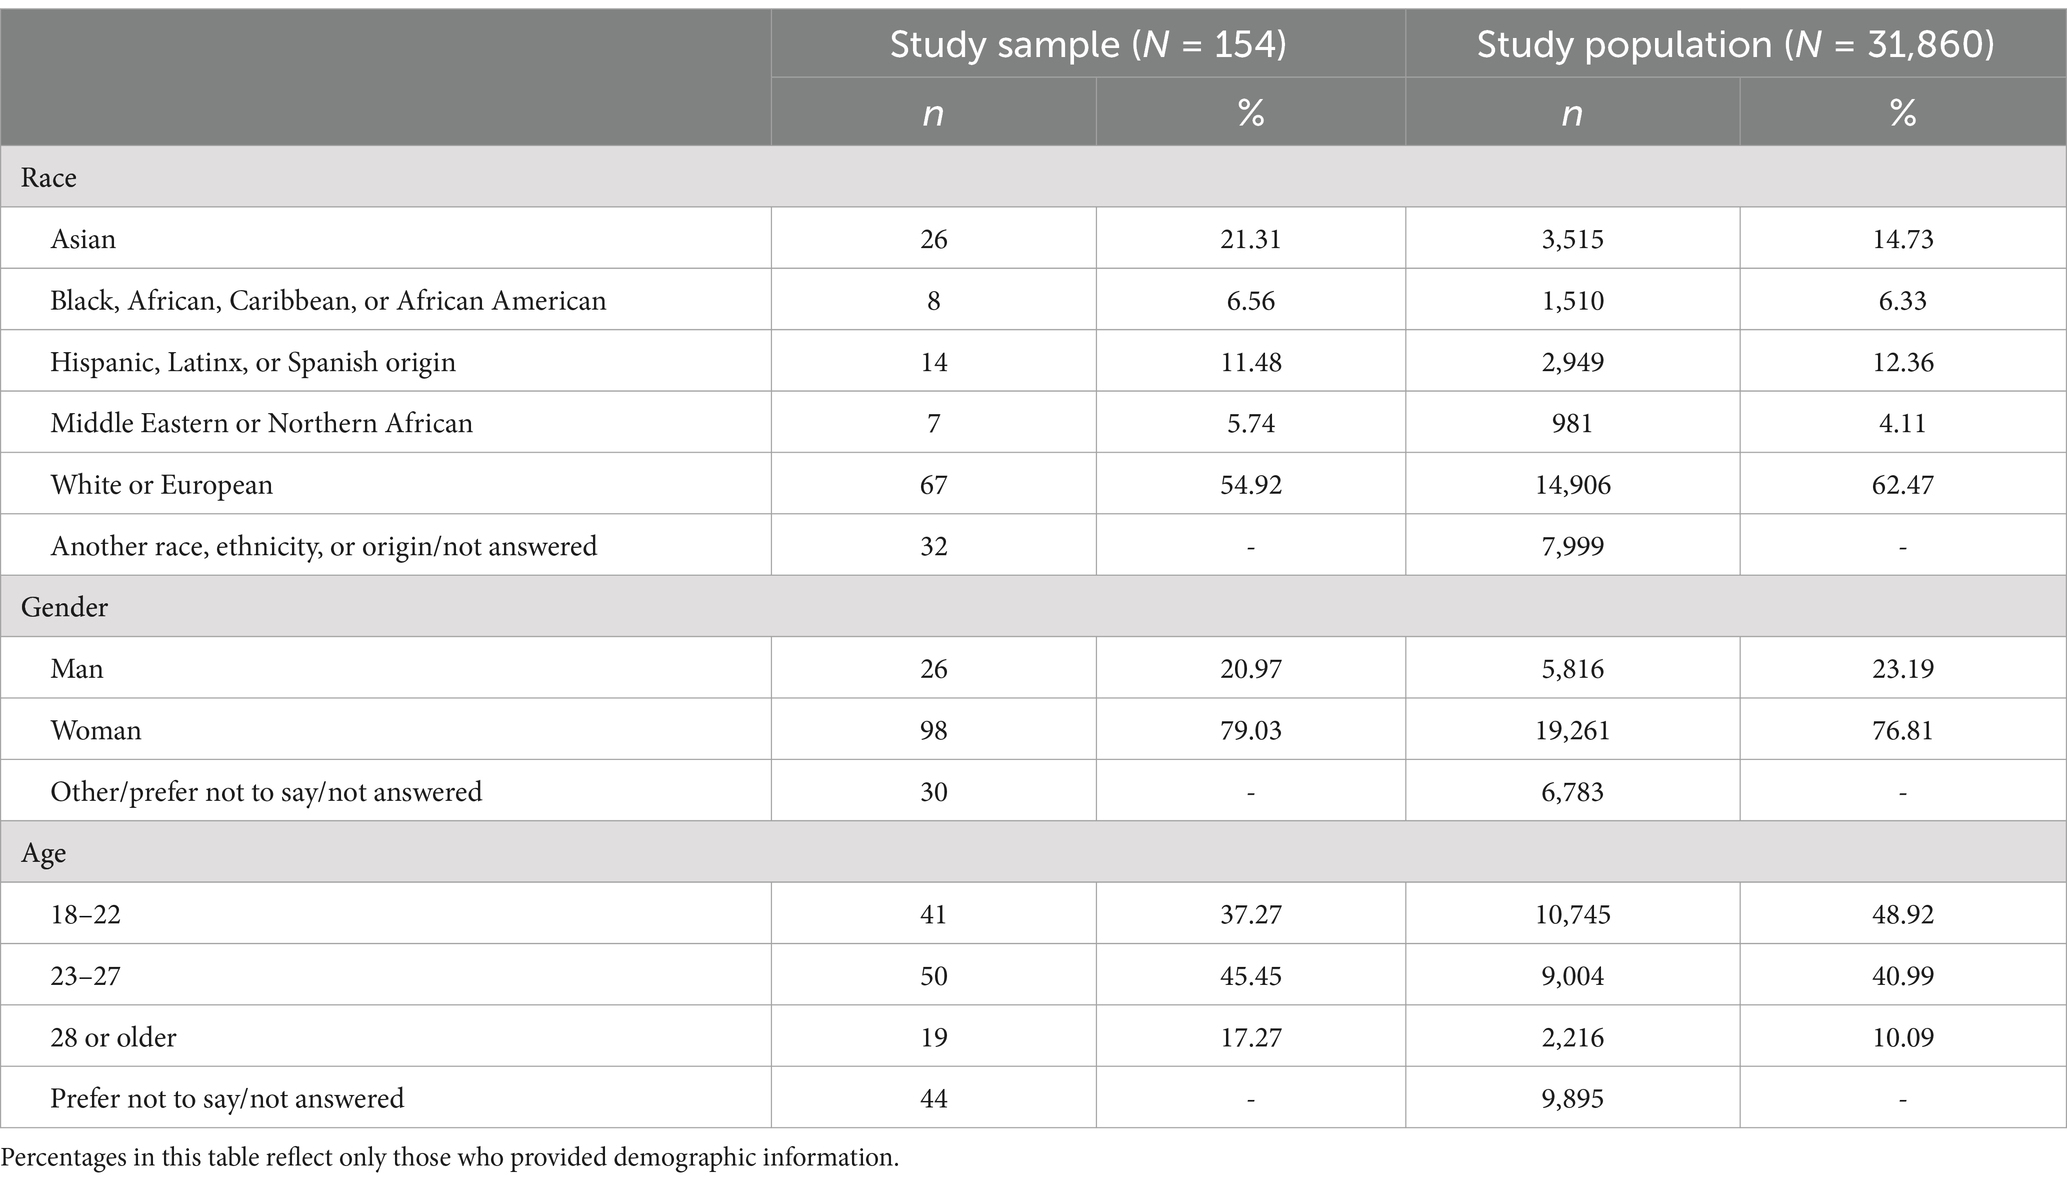
Table 2. Demographic makeup of participant sample.
2.4 Data pre-processing
Prior to conducting the content analysis, responses were grouped into three score buckets: low (scores 1–3), average (scores 4–6), and high (scores 7–9). We then converted factor levels into numerical values. The majority of factors (69.23%, n = 9) were binary and were numerically coded as 1 for yes and 0 for no. Four remaining factors had more than two levels and were numerically coded according to the level definition. For factors in which a characteristic could be completely absent, the coding started with 0 and continued to increase as the characteristic became more apparent (see Table 3 for further detail).
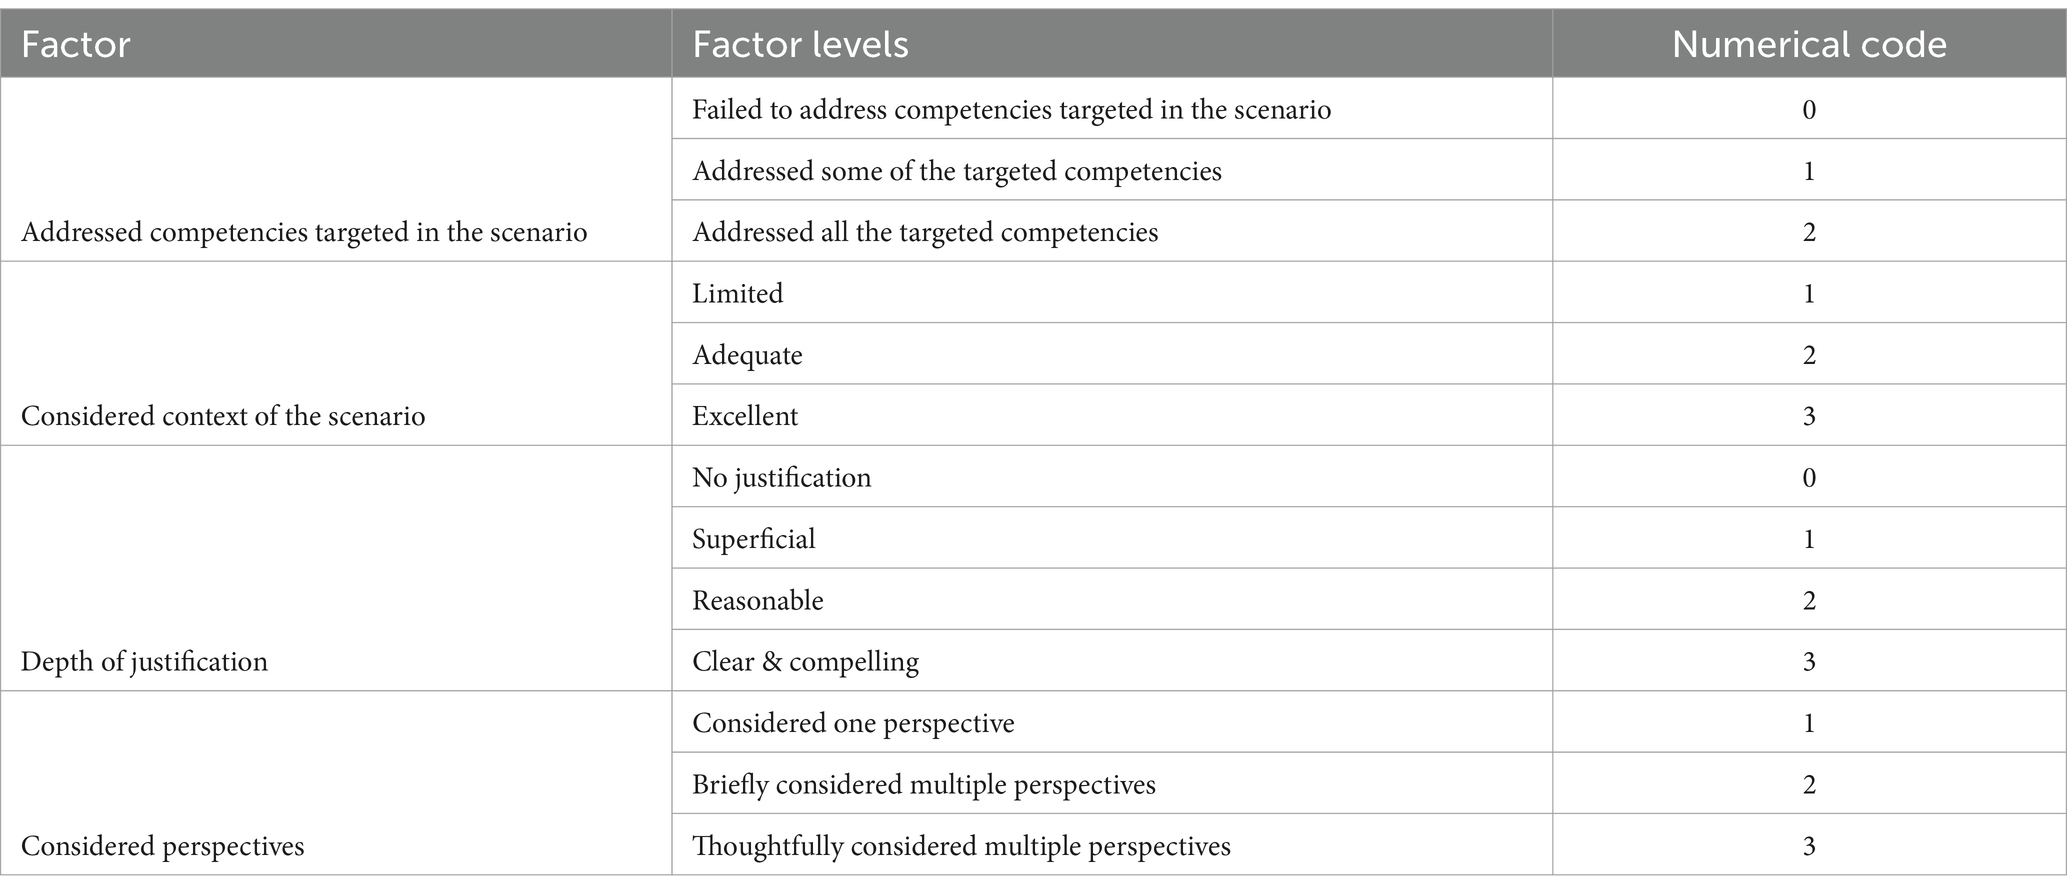
Table 3. Multilevel factor coding.
Given that the three researchers evaluated the same 81 responses, the researcher evaluations were averaged for each factor for each response to avoid treating evaluations of the same responses as independent items. For example, if two researchers labeled a response as having a limited depth of justification (coded as 2) and one researcher labeled the same response as having a superficial depth of justification (coded as 1), the average score for the depth of justification for this particular response would be 1.67. The value of 1.67 was then used in the quantitative analyses as the factor score for that particular response.
2.5 Statistical data analysis
First, the data were evaluated via descriptive statistics and Spearman correlation analyses. Spearman correlation coefficients were used to evaluate the relationship between each factor and response scores (1–9), as they allow users to measure the relationship between ranked variables (45). While correlation coefficients provide insight into the direction and strength of a relationship between the factors and scores, they are unable to explain the effect the two variables have on one another. Thus, for each content analysis factor, a single predictor logistic regression model was fit to predict (1) high scores (scores of 7–9) and (2) low scores (scores of 1–3), allowing us to estimate the likelihood of receiving a high and low score with each factor. All data analyses were conducted using RStudio Version 2023.3.0.386 (52).
2.6 Results
The descriptive statistics for each response characteristic across the typed-response scenarios and video-response scenarios are reported in Table 4. These include the mean, median, and standard deviation of the average researcher evaluation for each factor across all unique responses.
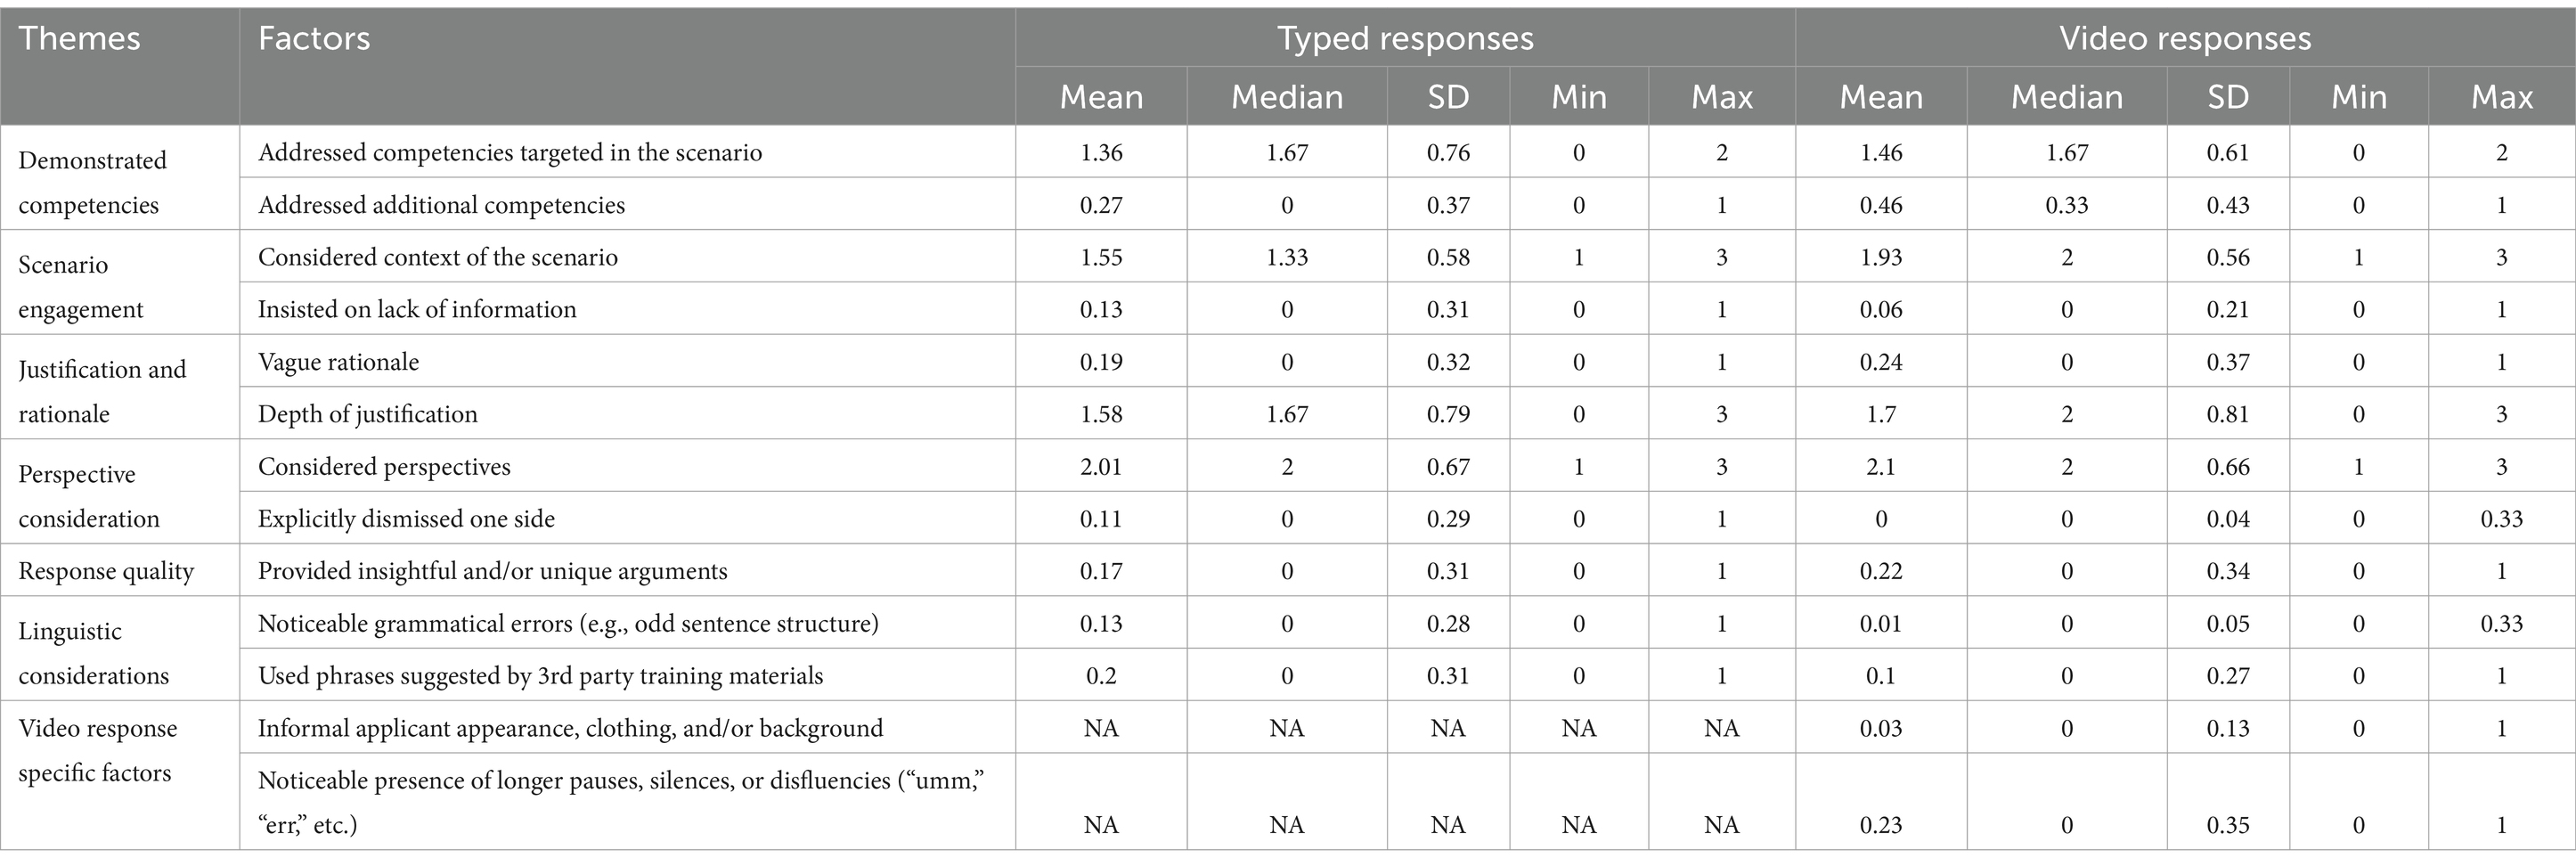
Table 4. Descriptive statistics of response characteristics.
Below, we report the significant factors within each theme. Results from the correlation analyses are available in Table 5. Results from single-predictor bivariate logistic regression models that were fit are presented for each factor to assess the extent to which each could predict high scores and low scores are available in Tables 6, 7, respectively.
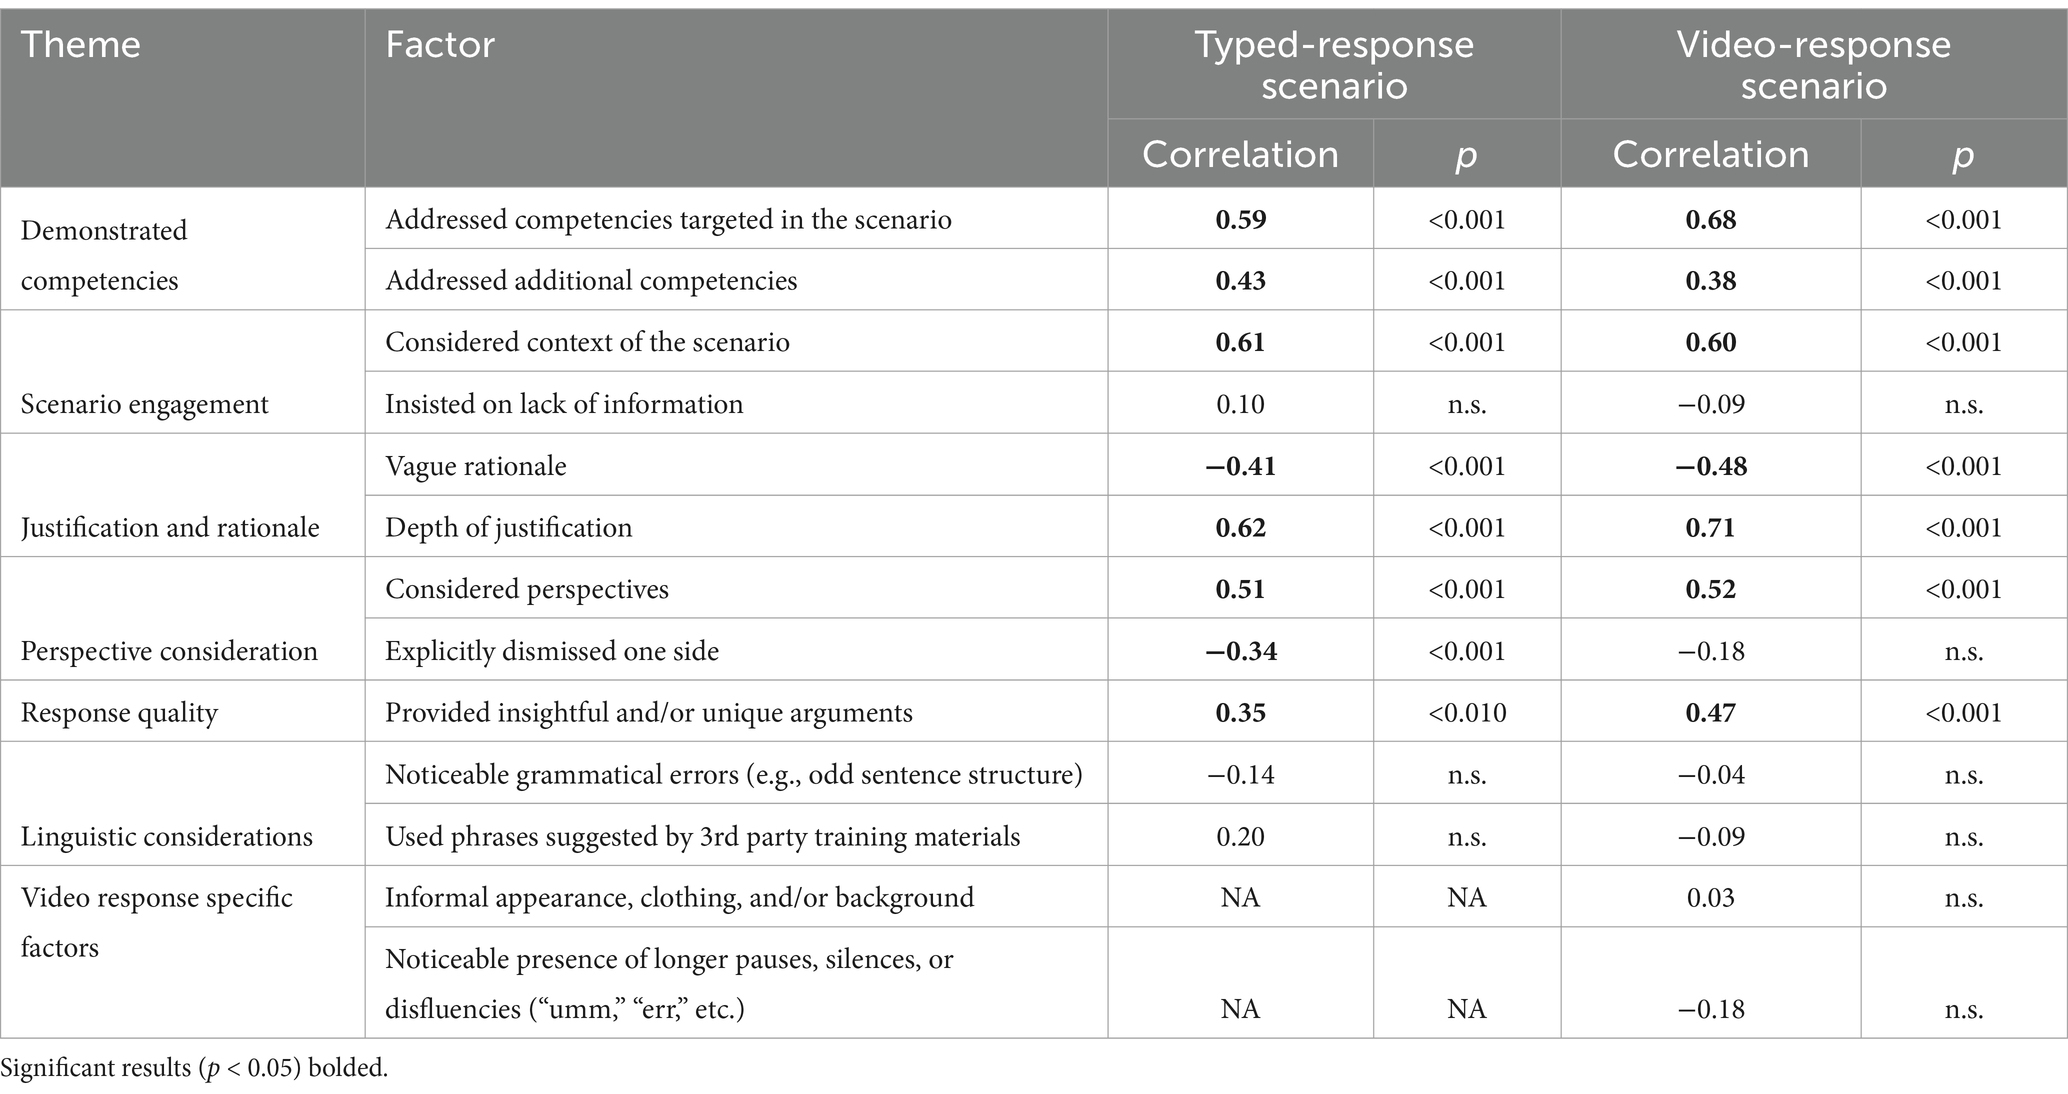
Table 5. Correlations between each factor and Casper scores.
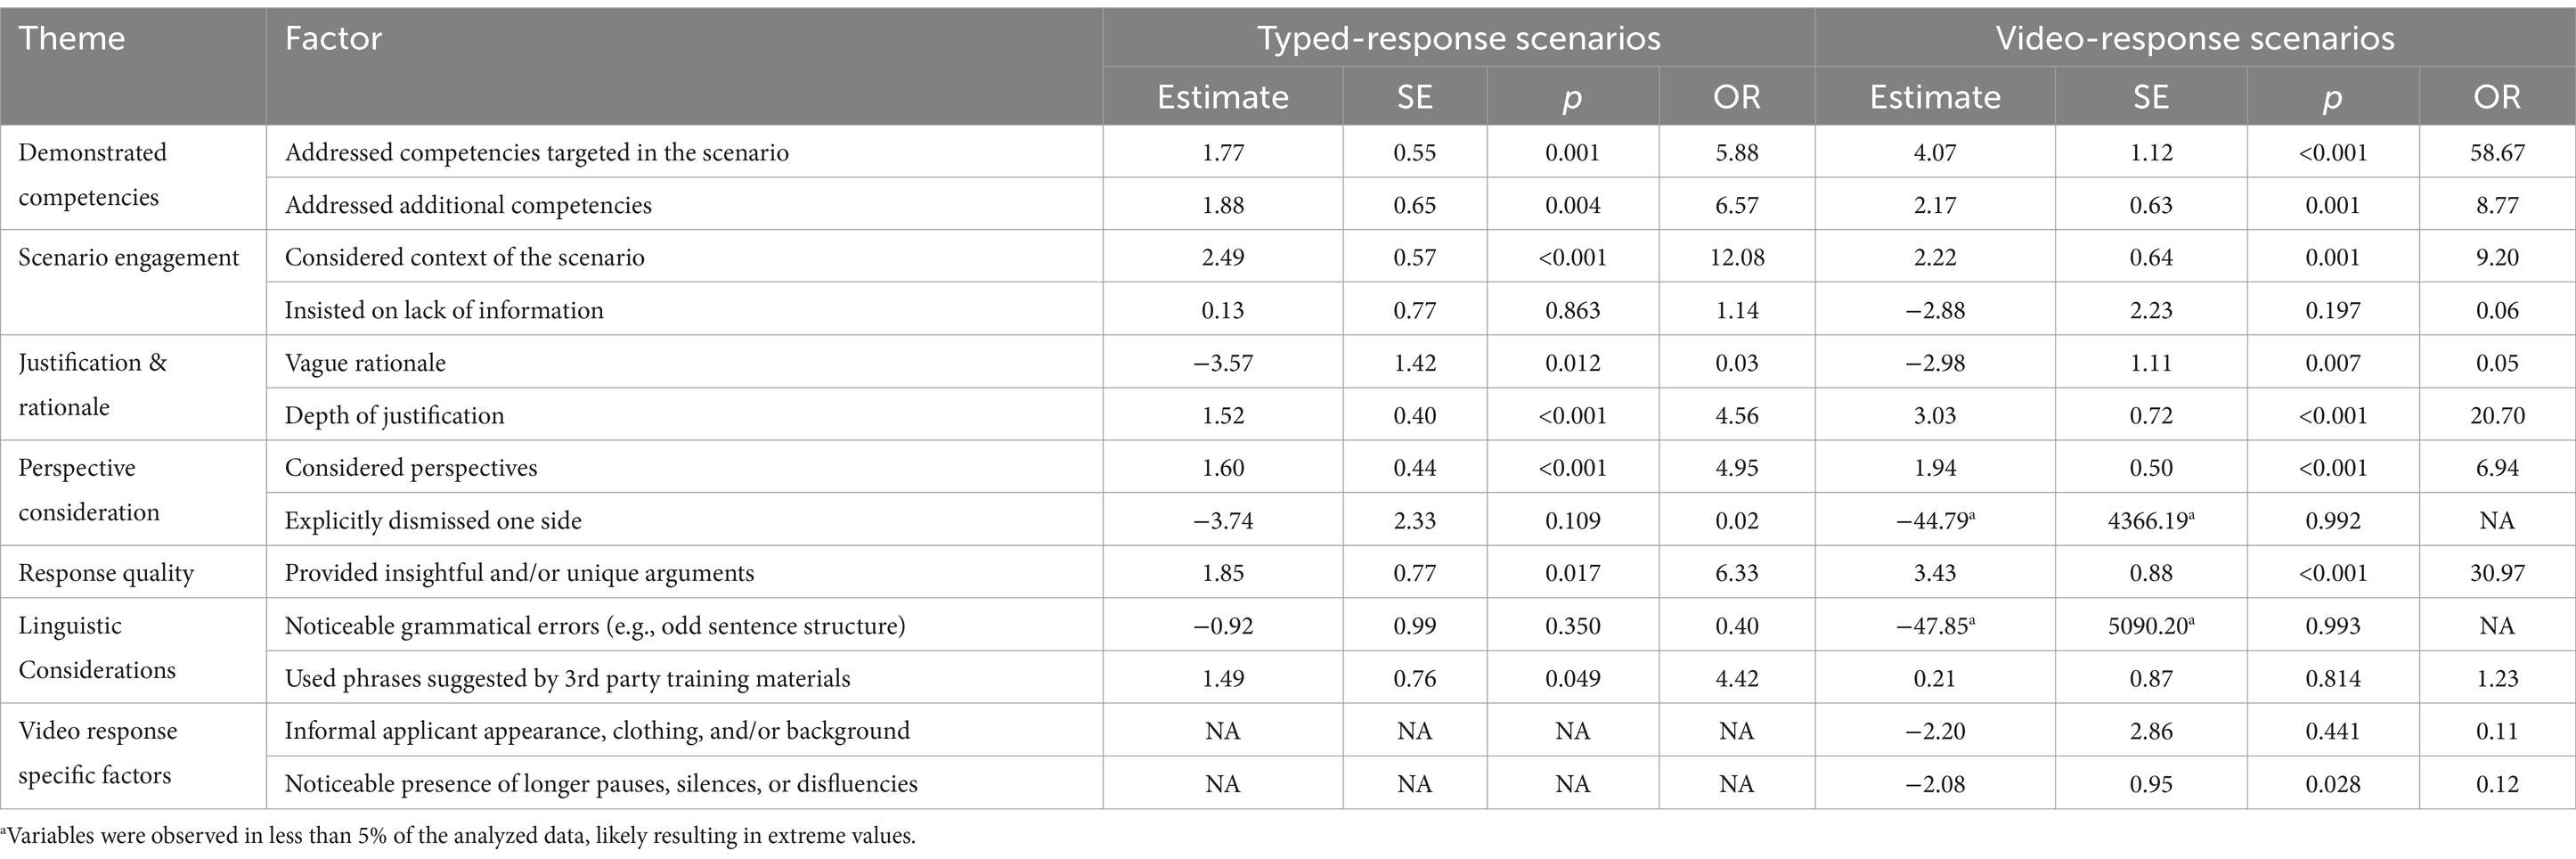
Table 6. Logistic regression models: predicting HIGH scores.

Table 7. Logistic regression models: predicting LOW scores.
2.6.1 Demonstrated competencies
Responses that demonstrated the competencies of the test evidenced a positive and statistically significant relationship with scores. This is true for responses that addressed the competencies specifically targeted within the scenario (rTyped = 0.59, p < 0.001; rVideo = 0.68, p < 0.001), as well as for responses that addressed those which were not specifically targeted within that particular scenario (rTyped = 0.38, p < 0.001; rVideo = 0.43, p < 0.001). Further, demonstration of the competencies targeted in the scenario have greater odds of receiving a high score (ORTyped = 5.88, p = 0.001; ORVideo = 58.67, p < 0.001). Responses which demonstrated other competencies that were not targeted in the scenarios also have greater odds of receiving a high score (ORTyped = 6.57, p = 0.004; ORVideo = 8.77, p = 0.001).
2.6.2 Scenario engagement
Results indicate that scores tended to increase as the level of consideration and integration of the scenario context increased (rTyped = 0.60, p < 0.001; rVideo = 0.61, p < 0.001); responses that considered and integrated the scenario context were also more likely to attain a higher score (OR Typed = 2.22, p < 0.001; OR Video = 9.20, p = 0.001).
2.6.3 Justification and rationale
Results indicate that providing a vague rationale had a negative impact on scores (rTyped = −0.41, p < 0.001; rVideo = −0.48, p < 0.001) and increased the odds of receiving a low score (ORTyped = 9.79, p = 0.004; ORVideo = 15.75, p < 0.001). Further, we found providing a higher-level justification had a positive impact on scores (rTyped = 0.62, p < 0.001; rVideo = 0.71, p < 0.001) and increased the odds of receiving a high score (ORTyped = 4.56, p < 0.001; ORVideo = 20.70, p < 0.001).
2.6.4 Perspective consideration
Scores are positively associated with the consideration of more perspectives (rTyped = 0.51, p < 0.001; r Video = 0.52, p < 0.001); responses that had a higher level of perspective consideration were more likely to achieve a high score (ORTyped = 4.95, p < 0.001; ORVideo = 6.94, p < 0.001). Explicitly dismissing one or more of the perspectives in the scenario had a negative impact on scores for the typed responses (rTyped = −0.34, p < 0.001) and increased the odds of receiving a low score (ORTyped = 16.17, p = 0.006).
2.6.5 Response quality
Scores are positively associated with responses which were found to provide an insightful and/or unique argument or approach to the presented dilemma (rTyped = 0.35, p < 0.010; rVideo = 0.47, p < 0.001) and these responses have greater odds of receiving a high score (OR Typed = 6.33, p = 0.017; OR Video = 30.97, p < 0.001). The presence of insightful and/or unique arguments or solutions evidenced lower odds of receiving a low score, although it was only significant for the video-response scenarios (ORVideo = 0.15, p = 0.045).
2.6.6 Linguistic considerations
Grammatical errors or the use of phrases suggested by 3rd party training materials were not significantly associated with scores. Also, the use of phrases suggested by 3rd party training materials was not predictive of low or high scores for video responses, however this factor achieved significance (p < 0.05) as a predictor of high scores for typed responses (ORTyped = 4.42, p = 0.049).
2.6.7 Video-response specific factors
Informal applicant appearance and responses which contained noticeable pauses, silences, or disfluencies did not demonstrate a statistically significant relationship with scores. Only the presence of longer pauses, silences, or disfluencies (e.g., “umm,” “err”) was predictive of scores for video responses. Specifically, responses in which longer pauses, silences, or disfluencies were present had lower odds of receiving a high score (ORVideo = 0.12, p = 0.028).
2.7 Discussion
The goal of this study was to analyze the content of test takers’ responses in order to identify which response characteristics evidenced a statistically significant relationship with scores. For the content analysis, we hypothesized that both construct relevant and construct irrelevant response characteristics would correlate with scores and that they would be significant predictors of low (1–3) and high (7–9) Casper scores.
The statistical analyses revealed that most of the construct-relevant factors identified in the checklist were indeed significant predictors of low and high Casper scores. The factors which related to the scoring guidelines (Addressed competencies targeted in the scenario, Considered context of the scenario) showed strong positive correlations with scores for both typed and video responses. These results provide evidence that assessors are mindful of the provided guidelines when scoring: responses which can demonstrate the targeted competencies (collaboration, empathy, etc.) in the scenario and which relate their response to the context of the scenario are associated with higher scores. In addition, we found that test takers who thoughtfully justified their approach to the presented situation, carefully considered multiple perspectives, and provided insightful and/or novel arguments or approaches in response to the presented situation were more likely to receive a high score. Opposite to this, test takers who provided a vague or neutral rationale for their approach to the presented situation were more likely to receive a low score.
With respect to the four construct irrelevant factors we identified in the checklist, correlation analyses did not reveal significant relationships with scores overall. On the other hand, logistic regression analyses revealed that Use of phrases suggested by 3rd party training materials was a significant predictor of high scoring typed responses, while Noticeable presence of longer pauses, silences, or disfluencies was a significant predictor of high scoring video responses (OR = 0.12) indicating lower odds of receiving a high score. Lastly, responses with Noticeable grammatical errors or Informal applicant appearance, clothing and/or background within the video responses did not have a relationship with or impact on scores.1
Given that the lack of statistical significance for some of these factors might also be due to low sample size, future research should replicate this study with larger sample sizes. In the interim, we conducted a post-hoc replication of this content analysis with a second Casper dataset to observe any differences due to geographical setting. Thus, we followed the same procedure laid out above and examined a different set of 81 typed responses from an Australian Casper test. This post-hoc replication revealed similar results to the ones reported above: the same construct relevant factors exhibited strong positive relationships with scores, while construct irrelevant factors were not significantly associated with scores.
The results of this study contribute to the construct validity evidence for the Casper SJT and to open response SJTs more broadly from the perspective of the content of test takers’ responses. While we found that factors related to the scoring guidelines used by assessors (demonstrating competencies, relating the response to the scenario context) were indeed significant predictors of scores, so were additional construct relevant factors, including the provided justification, the consideration of different perspectives, and the presence of what were considered to be ‘insightful’ or ‘unique’ arguments. We expected that these factors would also surface in Study II, where we examined the construct validity of Casper from the perspective of the scoring process.
3 Study II: think-aloud sessions
While in Study I we identified common characteristics of test takers’ responses and whether these characteristics demonstrated statistically significant relationships with scores, in Study II we approach construct validity from the perspective of the assessors and how responses are evaluated by directly observing the scoring process. Based on the findings of our content analysis, we hypothesize that, in addition to the scoring guidelines, assessors might factor in additional construct relevant considerations (e.g., provided justification). Although construct irrelevant factors did not reveal strong relationships with scores in Study I, we hypothesize that response characteristics which emerged in the content analysis (language, appearance, etc.) might also be noted by assessors and could play a role in scoring.
3.1 Method
To observe assessors’ scoring process and decision making, in line with similar research of this kind (31, 42), we used think-aloud interviews. Think-aloud is a method in which participants verbalize their thoughts, rationale and process while performing a given task (typically of higher-order thinking), or recall thoughts immediately following completion of that task (53). The theoretical underpinning of this method is that the thoughts elicited by the participants in real time are a valid reflection of the thoughts involved in the mediation of the task being performed (54). To capture assessor behaviors and to avoid cognitive overload, we split the think-aloud sessions into two phases: one think-aloud activity specifically targeted typed responses and another targeted video responses.
3.1.1 Scenario and response selection
For the think-aloud activities, we selected scenarios and responses from the data that were used in the content analysis. The three researchers who conducted the content analysis identified lower, average, and higher scoring responses that were hypothesized to elicit rich discussion from the think-aloud participants.
3.1.2 Participants
We recruited participants via a survey sent out to Casper assessors. Since the responses used in the think-aloud activities were from a North American Casper test, we recruited assessors from the US and Canada. The survey also included demographic questions (i.e., gender, race, age, geography, education level) to ensure that the selected participants were representative of the assessor population. 72 unique assessors expressed interest in participating in the think-aloud activity. When selecting participants, we used a stratified random sampling technique to ensure representation across demographic groups (i.e., race, gender, age) was approximately proportional with the total population of survey respondents. Ultimately, a total of 23 assessors participated in the two think-aloud sessions: 15 participated in the activity using typed responses, 4 in the activity using video responses, and 4 participated in both activities (see Table 8 for participant demographics). This resulted in 27 total think-aloud sessions.
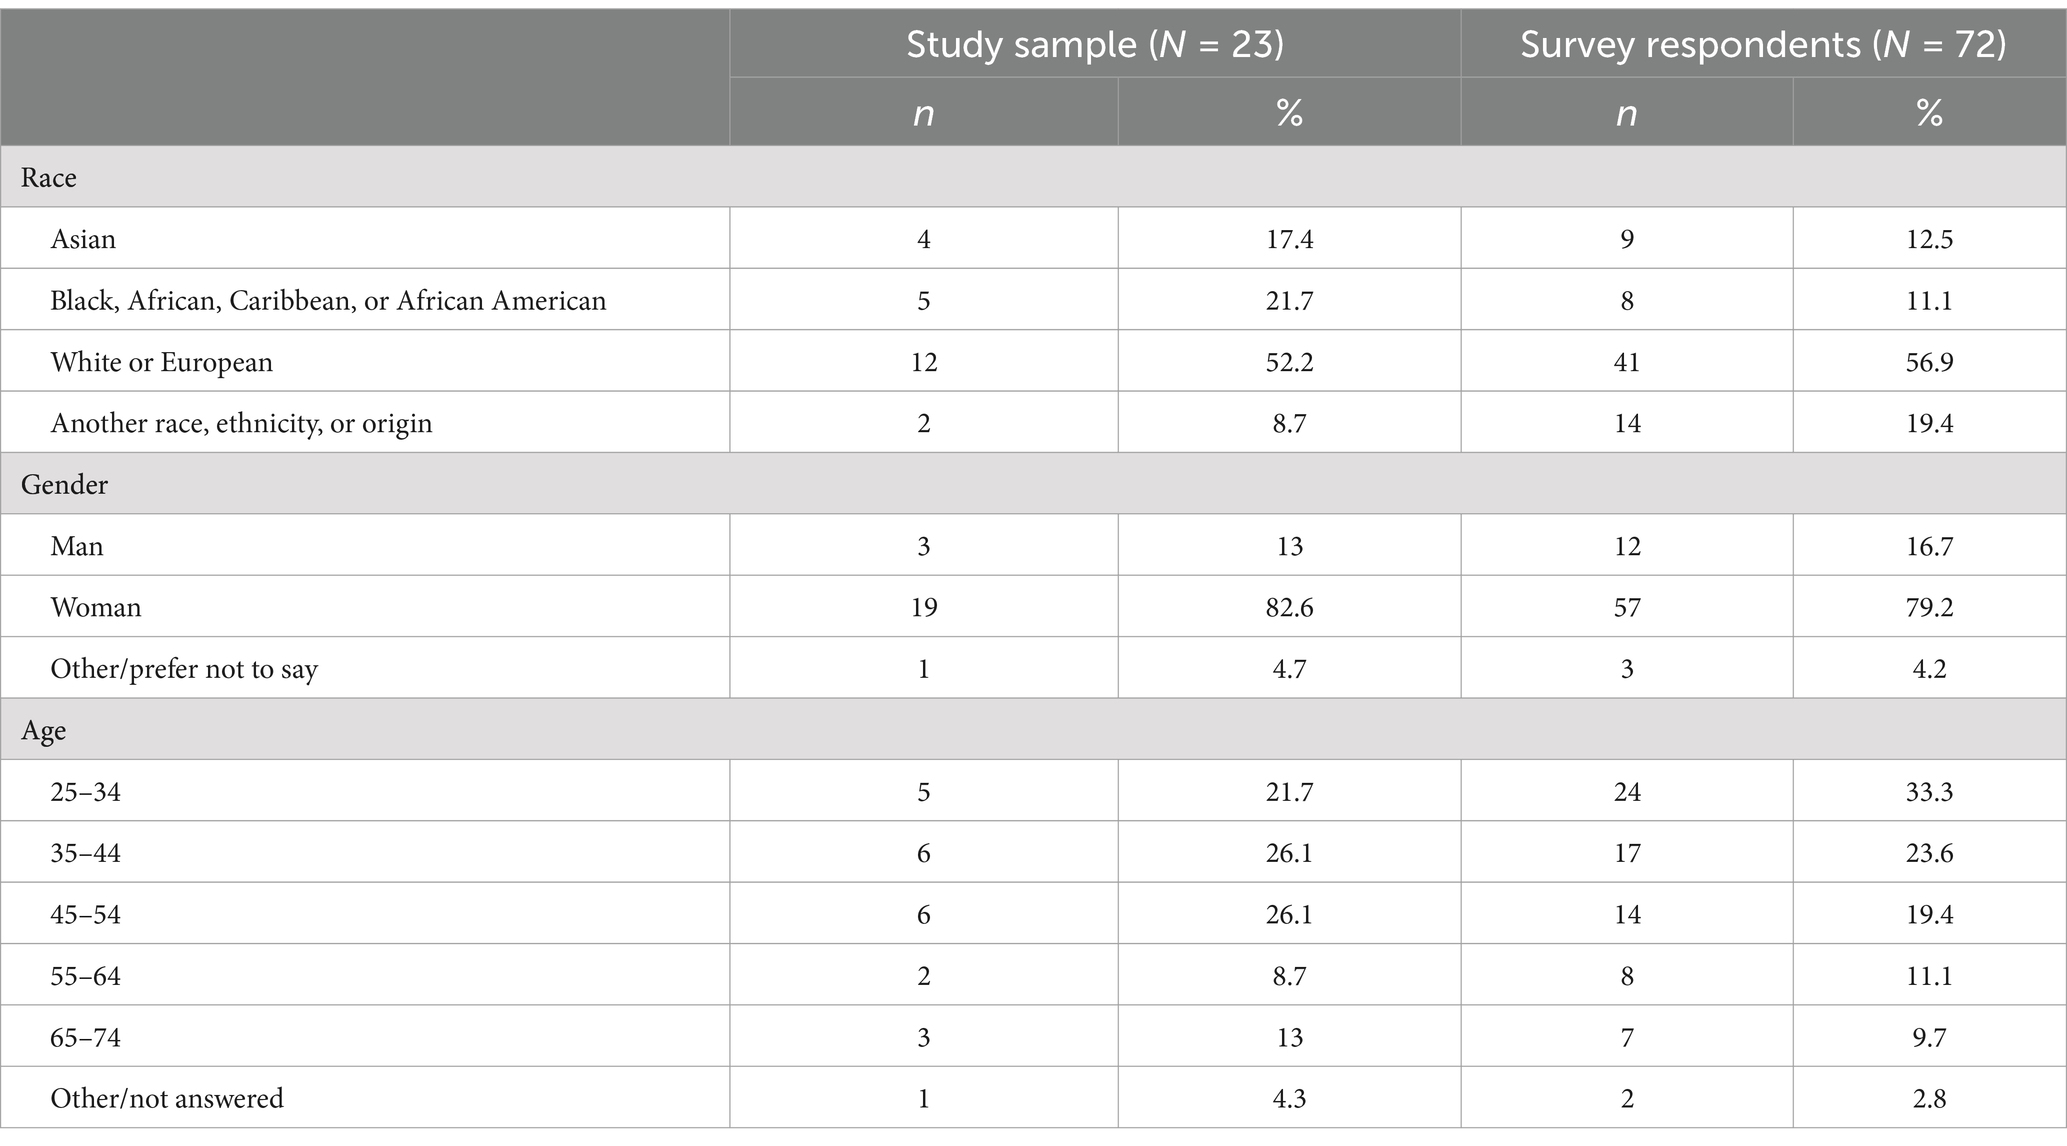
Table 8. Demographic makeup of think-aloud participants.
3.2 Procedure
Recruited assessors participated in the think-aloud study conducted from May to August, 2023. The Independent Review Board at Veritas IRB reviewed and approved this study (2023-3267-14464-1) on May 2, 2023. We obtained written informed consent for recording each session from all participants before the think-aloud activity, and participants also gave verbal consent during the activity. Each session lasted approximately 1 h, and all participants were compensated 50 USD or 60 CAD (depending on their country of residence) for their contribution to the study. In the first 10 min of each session, assessors were informed about the study objectives, the task expected of them, their role and the researcher’s role during the activity, and their rights as study participants.
During the think-aloud activity, participants first reviewed the scenario and read the associated scoring instructions and guidelines. They were then asked to review and score each of the four responses one by one and concurrently verbalize their thought process. To avoid leading the participants and compromising the integrity of the results, the researchers did not ask any questions or interfere during the think-aloud portion of the session. Researchers were only responsible for recording the assigned scores (record maintained separately) and noting down any extraordinary observations or comments made by the assessors during the think-aloud.
After completion of the think-aloud activity, researchers conducted a short exit interview to probe for any information that was of interest, but not already offered by the assessor. The exit interview questions were designed to explore general scoring behaviors and potential assessor biases. The complete think-aloud activity guide, including follow up questions and exit interview guide (for both typed and video responses) is given in the Supplementary material.
3.3 Data analysis
Prior to data analysis, all interviews were transcribed verbatim using Whisper, an AI-based, automatic speech recognition platform (55). These transcripts were proofread and cleaned by all three researchers individually to ensure accuracy. We did this by playing the recording while simultaneously reading through the transcript and correcting anything that was missing or transcribed incorrectly.
After cleaning the transcripts, we analyzed the data using an inductive coding technique (56). Each researcher coded the next researcher’s transcripts to ensure transparency and avoid researcher bias (57). These coded transcripts were then proofread by the other two researchers to ensure that we did not miss anything significant while coding the data.
After developing group consensus on coding, one researcher (MZI) grouped the codes into three categories (low, average and high scoring responses) based on the scores participants provided during the think-aloud activity and then developed themes and factors. Each theme represents the overarching domain and the factors represent the factors that underpin that domain. The other three researchers (RI, CR, JD) thoroughly reviewed the themes and factors and provided iterative feedback for improvement. The same data analysis approach was used for both think-aloud sessions (typed and video responses).
3.4 Results
Throughout the think-aloud sessions, seven themes were identified. The most prominent themes identified across all three score categories (low, average, high) in both typed and video response think-aloud sessions were: demonstrated competencies, scenario engagement, justification and rationale, perspective consideration, and response quality. Linguistic considerations was a common theme in both low and average scoring categories, whereas concerning behaviors was found in the low scoring category only. Table 9 provides all themes and factors alongside their associated frequencies. Below, each theme is described briefly.
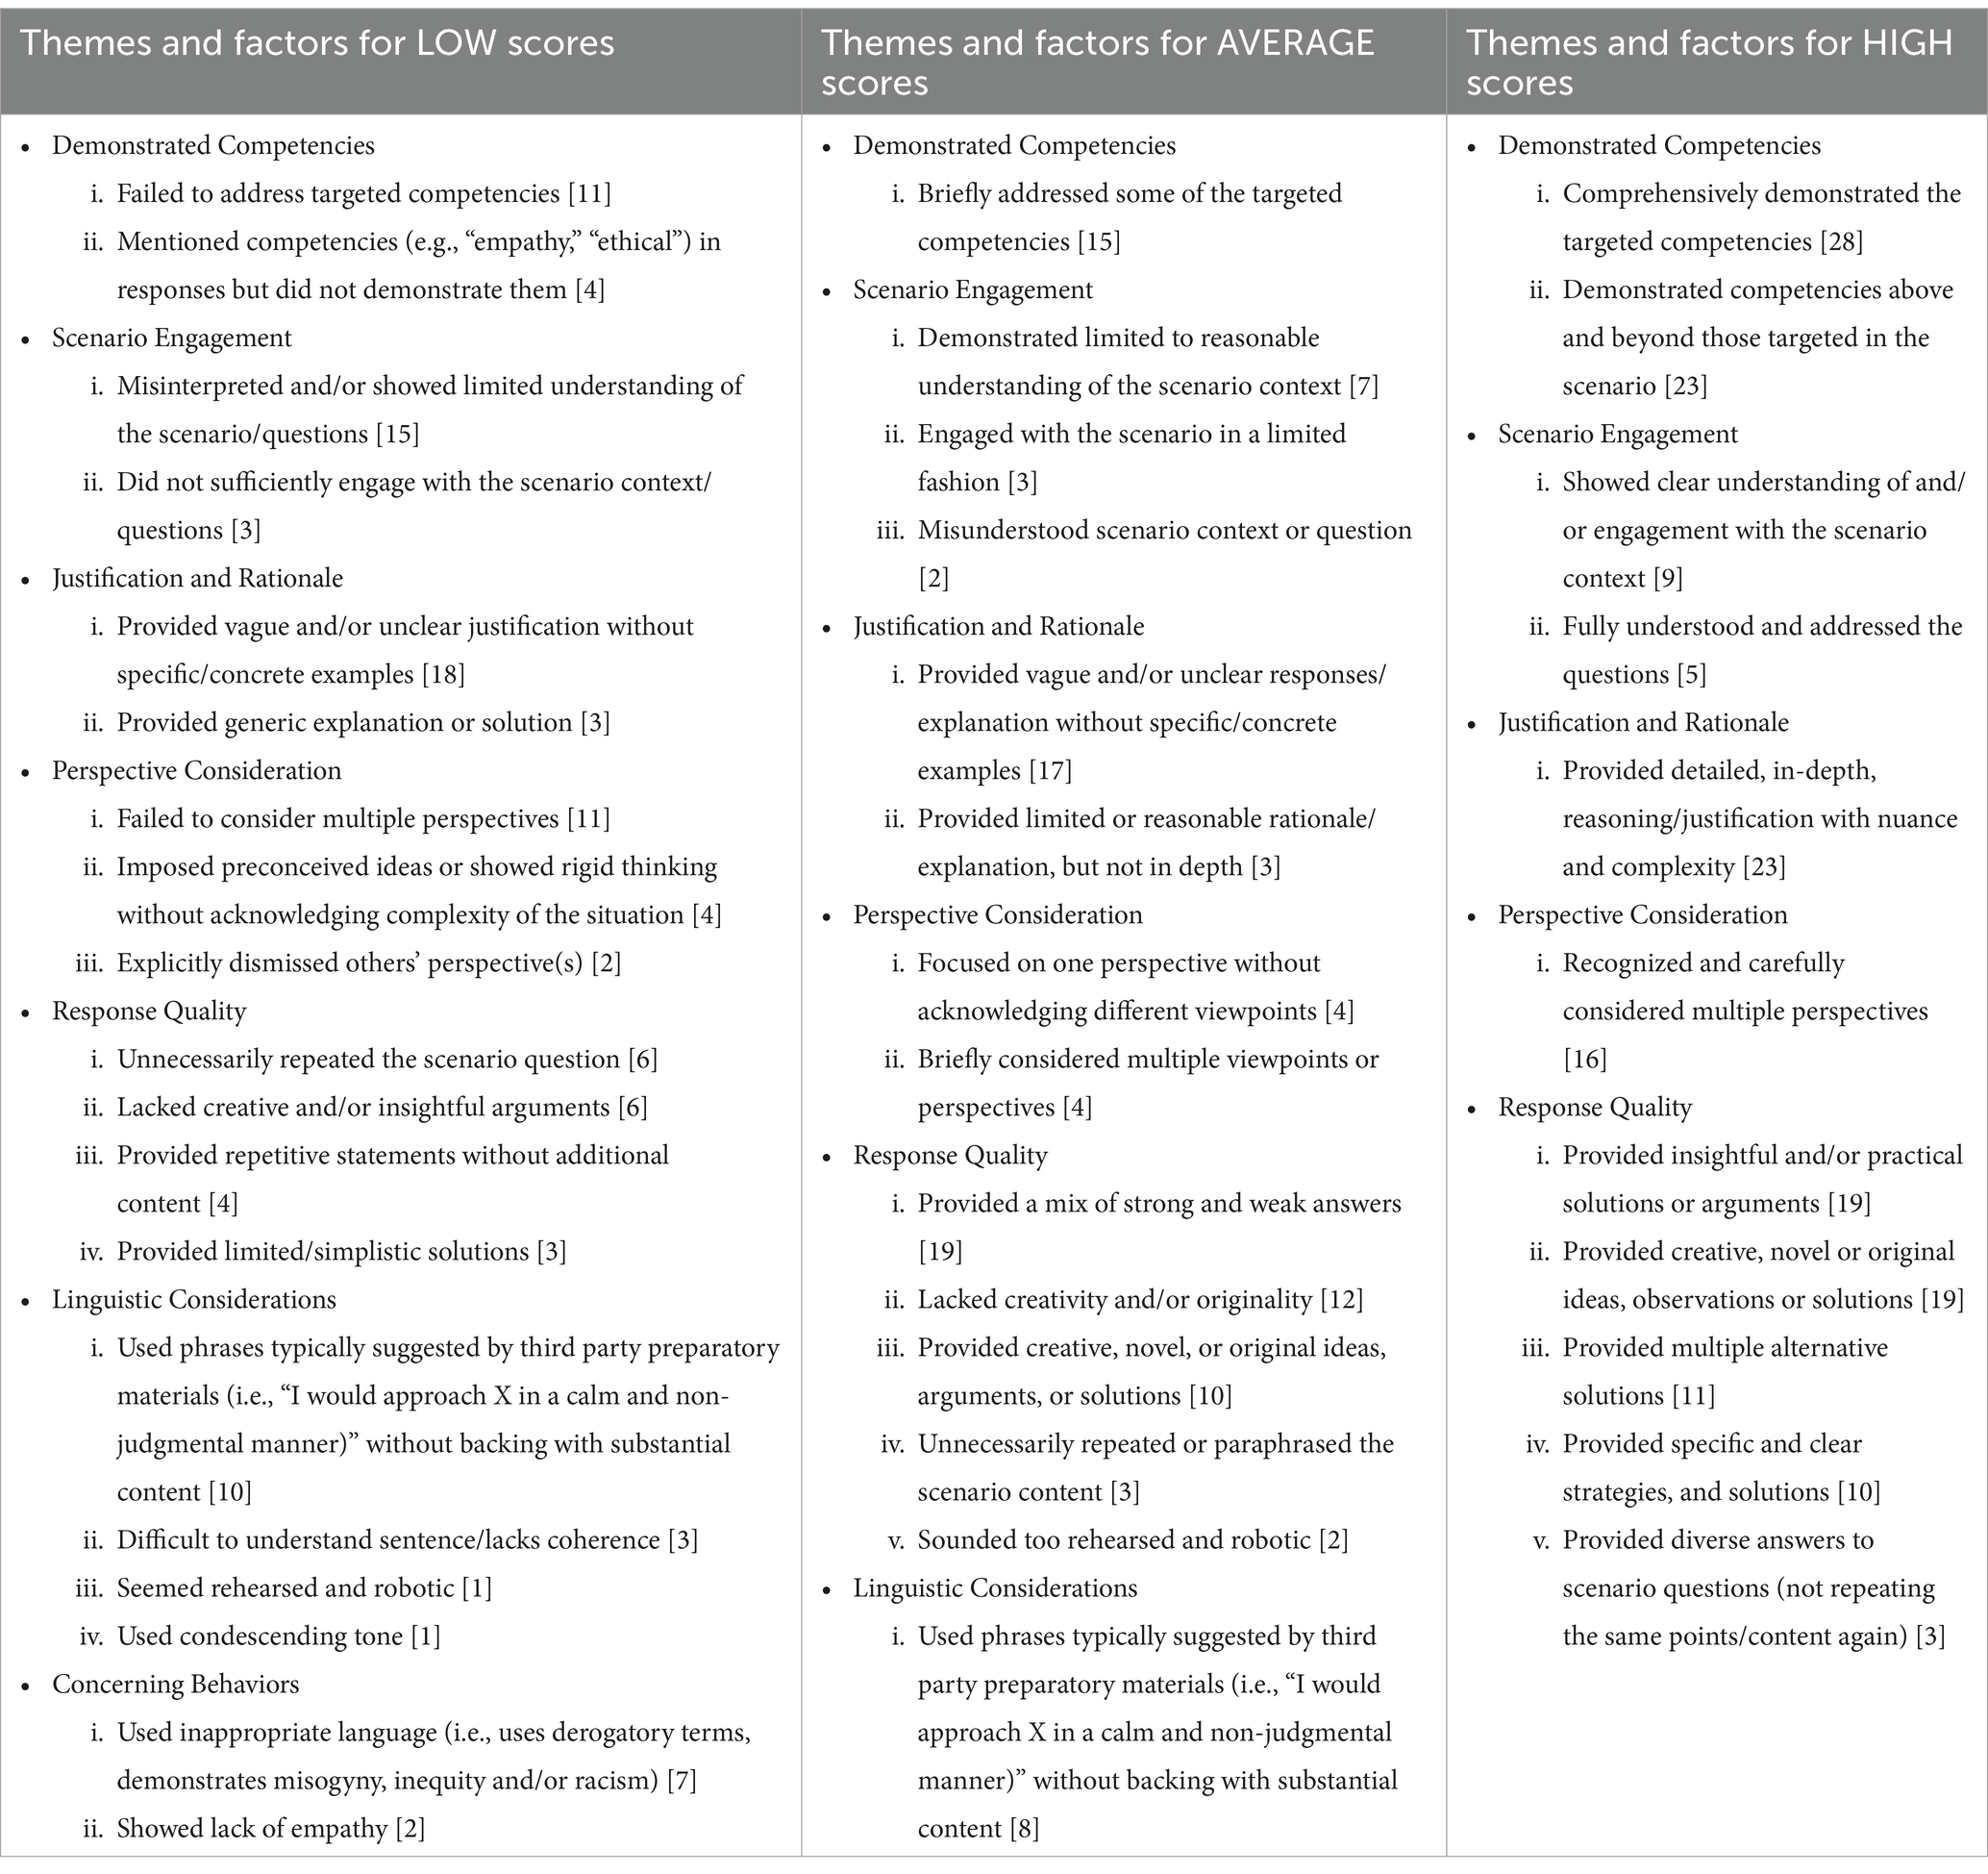
Table 9. Themes and factors for all three scoring categories and associated frequencies (i.e., how often a factor was mentioned).
3.4.1 Demonstrated competencies
Participants shared that the scores depended upon the extent to which test takers addressed competencies in their responses. For instance, high scoring responses comprehensively demonstrated the competencies targeted in the respective scenario and competencies beyond those that the scenario was probing for. Contrarily, the lower scoring responses failed to address some or all competencies. The two quotes below are two such instances of assessors explaining how demonstration of competencies impacted the score.
“[The responses] were in tune with what we were expecting of them in terms of, you know, collaboration [and empathy], and they also showed things like the other competencies that were not necessarily [targeted in the scenario] like self-awareness or problem solving. […] They were good responses in my opinion.” – (UR2; score 7).
“there wasn’t a lot of problem solving [targeted aspect] in this situation for this first response. And so that’s going to make me tend to score lower because I know that’s one thing that we are looking for. Like, again, the scenario is intended to probe for problem solving and also resilience. So we are not really seeing a lot of that from this first response.” (AR3; score 3).
3.4.2 Scenario engagement
This theme represents the extent to which test takers incorporated the context of the scenario into their response and addressed the associated questions. Participants shared that high scoring responses showed clear understanding of the scenario; engaged well with the scenario context; and fully understood and addressed the questions. Contrarily, low scoring responses either misinterpreted or showed limited understanding of the scenario and/or the question(s); and did not engage sufficiently with the scenario context. One participant shared,
“[High-scoring responses demonstrate] identification of complexity or nuance, where people aren’t giving very simplistic answers […] [and that] can be understanding the impact of context, right? […] something that shows that it’s beyond, you know, a reaction, that there’s some reflection” (CR16; on high scores).
3.4.3 Justification and rationale
This theme represents the depth of the justification for the provided approach in the response. Participants shared that high scoring responses provided detailed and in-depth reasoning and justification, took a stance on moral issues, and gave explanations for their position. Contrarily, low scoring responses provided vague and/or unclear justifications without specific or concrete examples. One participant said,
“I feel like they could have gone into further detail. I would say a better response would have gone into more detail on how they can collaborate as a team […]. Just further explaining their response, you know. […]. Give examples.” (UR17; score 4).
3.4.4 Perspective consideration
This theme represents how test takers considered the perspectives of different parties within a scenario. Participants shared that high scoring responses typically recognized and considered multiple perspectives, whereas low scoring responses imposed preconceived ideas or showed rigid thinking without acknowledging the complexity of the situation; and explicitly dismissed others’ perspective(s). One participant shared,
“[Low scoring responses are] too simple, um too polarized. […] Being dismissive of another perspective or another view or one of the people involved in the scenario. Um, just really uh, not giving any consideration to them or writing them off which I have seen, […] dismissing one of the players in this scenario too quickly.” (AR5; on low scores).
3.4.5 Response quality
This theme represents the quality of the provided argumentation or solution in the responses. Participants explained that high scoring responses provided creative, novel or original ideas, observations, or solutions to the presented dilemma; provided insightful and/or practical arguments or solutions; provided specific and clear strategies, or solutions; provided multiple alternative solutions instead of a single surface level solution; and provided diverse answers to the scenario questions instead of repeating the same points. Contrarily, low scoring responses provided limited (or simplistic) solutions; unnecessarily repeated the scenario information; provided repetitive statements without additional content; and lacked creative and/or insightful arguments. One participant said,
“Also, when the person comes up with a different solution than what everybody else is saying, then I score higher. I feel like sometimes the easiest solution is the same thing everybody says. It’s the first thing that comes to mind. But when I hear somebody say something that’s something different and it makes me think like, wow, they are not really thinking about the usual stuff.” (UR14; on high scores).
“See, these are the kind of answers that I look for! Because I think you cannot always handle problems in, like, the same way. […] sometimes it kind of requires being unique and thinking outside the box.” (UR13; score 8).
3.4.6 Linguistic considerations
This theme subsumes language related aspects including sentence structure, coherence, clarity and conciseness. In particular, participants shared that low scoring responses were difficult to understand; lacked coherence; used phrases typically suggested by third party preparatory materials (i.e., “I would approach X in a calm and non-judgmental manner”) without supporting these statements with further content or rationale; used a condescending tone; and sounded rehearsed or robotic. The use of phrases from third party preparatory materials was also noted for average scoring responses. This theme did not emerge in the high scoring response category. One participant shared,
“And in [the response] can occasionally lie the “canned” formula answers without anything additional provided, right? I’ve been to the prep course, I’ve learned that I’m supposed to say, I’m going to “approach you in a non-confrontational manner,” and then there’s nothing else.” (CR16; on low scores).
3.4.7 Concerning behaviors
This theme refers to test takers’ comments and/or behaviors that assessors found concerning, (e.g., unprofessional behavior, lack of empathy). Participants noted that low scoring responses can sometimes feature inappropriate language (i.e., used derogatory terms, demonstrated misogyny, inequity and/or racism) or insensitivity toward the individuals in the scenario. This theme only emerged in the case of low scoring responses.
3.5 Discussion
In Study II, we aimed to observe the scoring process while assessors evaluated typed and video responses in order to identify which factors pertaining to the responses might impact response scores. The results of this qualitative study with assessors largely corroborated the findings of our quantitative content analysis.
The most frequent theme that emerged during the think-aloud sessions and follow-up interviews was Demonstrated Competencies. As expected, based on the scoring guidelines, low scores were associated with perceived insufficient demonstration of these competencies, while responses that clearly demonstrated competencies were associated with high scores. Another construct relevant theme that was related to the scoring guidelines was Scenario Engagement. We observed that assessors tend to assign low scores to responses that show limited understanding of the presented dilemma, while high scoring responses engage with the scenario in more depth, and demonstrate complex and nuanced understanding of the dilemma.
Assessors also highlighted construct relevant response characteristics that were not included in the scoring guidelines directly; these characteristics correspond to the following themes: Justification and Rationale, Perspective Consideration, Response Quality, and Concerning Behaviors. Low scoring responses were frequently found to be vague, to be less considerate of the different perspectives in the scenario, to be repetitive, or to sometimes demonstrate lack of empathy or equity. On the other hand, high scoring responses were described as providing detailed justifications for their approaches, acknowledging and discussing different relevant perspectives to the presented dilemma, and as providing insightful, creative or multiple and diverse arguments and/or solutions.
Lastly, assessors flagged several construct irrelevant factors which we have listed under Linguistic Considerations. Some raters highlighted that low scoring responses may sometimes be unclear or lack coherence, or that they may sound “rehearsed” or seem “condescending.” The most commonly mentioned factor in this theme, however, had to do with the use of phrases suggested by 3rd party training materials. The qualitative interviews revealed that assessors are largely indifferent to test takers’ use of phrases such as “I would approach X in a calm and non-judgmental manner”; assessors were likely to find the use of these phrases generic and to assign responses including such phrases either low or average scores (see CR11 below).
“Well, there’s a lot of [test takers who] are using, “I will talk to this person in a nonjudgmental, non-confrontational…” And I think those people have been coached to use that language. So, it’s not really annoying, but it’s not original and unique.” (CR11).
Overall, the results of this second study contribute to the construct validity evidence for the Casper SJT and to open response SJTs more broadly from the perspective of response characteristics noted by assessors during scoring. Our results show that assessors were indeed mindful of the information provided in the scoring guidelines and that the demonstration of competencies and understanding the complexities of the presented scenario were important considerations during scoring. Additional construct relevant factors mentioned by the assessors included the clarity and/or insightfulness of the provided arguments and solutions, and how the test takers consider and incorporate others’ perspectives in their response. Lastly, we found that construct irrelevant factors like the use of specific phrases and the coherence of the response may also be considered during the scoring process.
4 General discussion
In the context of increased SJT use and research focused predominantly on SJT reliability, experts have highlighted a need for in-depth construct validity research (19, 40, 41). Typically, construct validity is estimated by examining the relationship between SJT scores and scores on assessments that measure similar constructs (3, 26). The counterargument to this approach is that the focus on what SJT scores relate to has led to a lack of clarity in terms of what SJTs actually measure (19, 40), and research to address this gap has been scant. To examine how SJTs measure their intended constructs, Wolcott et al. (42) explored test takers’ cognitive process as they responded to fixed-response SJT items. In this paper, we focused on a different and novel piece of the construct validity puzzle, namely how the construct relevant and irrelevant characteristics of test takers’ answers to open-response SJT items impact assessors and their scoring process. To address this gap, we used data from a commonly used open-response SJT in higher education admissions, Casper, which has strong psychometric properties (28, 46, 58).
Unlike fixed-response SJTs, where a test taker selects or ranks given responses, open-response SJTs allow test takers to freely respond to the question and provide reasoning and detail to their approach. This means that while open-response SJTs provide richer and more complex data, they also allow SJT assessors more room for interpretation when evaluating responses against the scoring criteria (30, 31), bearing similarity to the assessment of short essays (29). Given the complexity of these responses, we employed a mixed-methods approach. In Study I, we analyzed the content of archival Casper responses to identify potential factors and assess their statistical relationship with scores assigned by assessors. In Study II, we used think-aloud interviews to directly examine the scoring process, and how assessors interacted with the responses.
Results from both studies revealed construct relevant factors that relate to scores that may consciously or unconsciously impact scoring. First, both the quantitative content analysis on archival responses and the think-aloud activities with assessors reflected the instructions provided to assessors in the scenario-specific scoring guidelines. Namely, we found that test takers who demonstrated the competencies within the test construct (ethics, collaboration, etc.) and who demonstrated engagement and reflection on the context of the provided ethical dilemma were likely to obtain higher scores. Secondly, both studies revealed additional construct relevant factors, which are not directly related to the scoring guidelines. Results showed that assessors were mindful of the justification provided by test takers for their approach: responses with in-depth rationale were likely to receive higher scores, while vague responses were likely to receive lower scores. Analyzing the provided situation and providing a clear rationale is related to critical thinking (59, 60), which is an indirect component of two competencies targeted by Casper: problem solving and collaboration. Additionally, although not made explicit in the scoring guidelines, assessors also noted whether responses gave thoughtful or insufficient consideration to the various perspectives in the scenario, and whether they provided novel, insightful, creative, or generic and simplistic arguments and solutions. While perspective consideration is a facet of the Casper competency of empathy (61), the factor pertaining to creative or insightful or diverse arguments and solutions is again a reflection of problem solving and collaboration (60), as well as of critical thinking more broadly (62).2
While the correlations between scores and the four construct irrelevant factors identified during the content analysis did not achieve significance, logistic regressions in the content analysis revealed that video responses with noticeable pauses, silences, or disfluencies had lower odds of receiving a high score. Although such pauses were not mentioned by assessors during the think-aloud activities, a few assessors did note that responses that lack coherence or those which seem ‘rehearsed’ or ‘robotic’ are likely to receive low scores.
One assessor also noted that responses which have a ‘condescending tone’ may receive lower scores. While flow and cohesion may be construct-relevant in language assessments (29), they are not in the case of SJTs that measure social intelligence and professionalism. These findings bear similarity to those of Condor (34), who found that construct-irrelevant linguistic features (grammar, phrases) may impact the scores of open-ended responses on a mathematics assessment. In the case of our study, while the presence of grammatical errors did not have a significant effect on scores in either response format, linguistic aspects like tone, flow, and cohesion were salient.
Lastly, logistic regression analyses also showed that typed responses which included phrases suggested by third party training materials had higher odds of receiving a high score. On the other hand, the think-aloud activities and interviews with assessors revealed that the use of such phrases (e.g., “non-confrontational manner”) was found ‘unoriginal’ and assessors believed that these phrases were used as an effect of reviewing unofficial test prep materials. These ‘canned’ phrases used without supporting evidence or rationale often resulted in low or average scores. The mixed results might suggest that while these phrases are found in both low and high scoring responses, and while Casper assessors are not likely to reward the use of these phrases because they seem ‘canned’ or ‘empty’, test takers who receive high scores tend to provide compelling responses despite the use of these phrases. Our previous work showed that applicants who used official Casper sources to prepare for the test scored highest, applicants who used 3rd party training materials performed worse, and those who did not prepare at all performed the worst (44). Given this context and our findings, it is possible that the use of phrases like “non-confrontational manner” may not have a positive effect on scores, but may be correlated with whether test takers prepared or not for the Casper test. Future research can provide more insight into how various third-party preparatory methods may impact scores.
4.1 Limitations and future research
This study is, to our knowledge, the first of its kind to investigate the construct validity of open response SJTs by examining (i) which response characteristics are associated with scores, and (ii) which implicit factors influence scores during evaluation. Given that validity research typically focuses on fixed response SJTs and on psychometric analyses and external metrics and assessments that relate to SJT scores (6, 19, 39) or on test item instructions (63), it is difficult to draw parallels between the nature of our novel results and previous findings. While Wolcott et al. (42) broke new ground by examining the cognitive processes of test takers in the context of fixed response SJT, we examined the scoring process of assessors evaluating an open response SJT. We hope that future research will delve even deeper into the construct validity of these assessments by undertaking mixed-methods and qualitative studies on the process of test takers and assessors alike.
While we found evidence to support that performance on an open response SJT like Casper can be impacted by both construct relevant and construct irrelevant factors, these results have only been based on Casper data, and have not been investigated in the case of other open response SJTs. We hope that this paper provides a methodology that researchers may apply to other open response SJTs in the future.
Although the think-aloud method is highly beneficial in collecting data on assessors’ scoring process during their live evaluation of responses, this kind of study is subject to self-selection bias. It is possible that assessors who chose to participate in the study are more comfortable with the scoring guidelines, which is perhaps one reason why construct relevant factors related to the guidelines were featured so frequently. Additionally, it could be argued that this method, where an assessor is being observed while scoring, might preclude them from mentioning construct irrelevant factors. For instance, Casper assessors receive implicit bias training where they are instructed to not penalize grammatical errors, which might have prevented them from mentioning grammar during the think-aloud activities. Moreover, the participants of this study are regular assessors of the Casper test, and their role in test scoring could present a possible source of social desirability bias (where participants feel compelled to provide favorable answers rather than sharing their true opinion).
Another limitation of our research is the sample size. The content analysis was conducted on 160 responses and the think-aloud activity was conducted with 23 participants. It is possible that some factors are infrequent and might have achieved significance in a larger sample size. While the findings of the content analysis were corroborated in a post-hoc replication on a different set of 81 responses, we leave a larger scale replication of this study to future research.
4.2 Conclusion and implications
This mixed methods study contributes to the validity research of SJTs by investigating construct relevant and irrelevant factors that may impact assessors evaluating open response SJTs. Results from the quantitative content analyses of archival data and think-aloud activities with assessors reveal that several construct relevant factors have an effect on scores: both those which reflect the scoring guidelines, as well as additional implicit factors. We found that scores are dependent on the extent to which responses demonstrated the personal and professional competencies probed for by the SJT, engaged with the context of the presented ethical dilemma, provided in-depth justifications for their response, considered the various perspectives relevant to the scenario, and provided creative solutions or insightful arguments for their approach. We also found mixed results with respect to construct irrelevant factors, such as the flow, cohesion, and kinds of phrases used in the response.
This is the first study of its kind to analyze how response characteristics relate to construct relevant and irrelevant factors in open-response SJTs more broadly, but also for the specific test (Casper) that provided the data. With respect to Casper, we found that the two kinds of response formats (typed and video) were impacted by the same factors: the results were largely the same across the two formats. With respect to open-response SJTs, our study provides an approach for how to investigate construct validity by examining the content of the responses and the scoring processes of the assessors. Our results also provide evidence that open-response SJTs are valid approaches to measure professionalism related competencies such as empathy, collaboration, problem solving, and critical thinking more broadly both in terms of what test takers focus on in their response, as well as in terms of how they construct their response.
Data availability statement
Research data are not publicly available due to the confidentiality agreements with Casper applicants. However, the raw, anonymized data and analyses performed in the study are available from the corresponding author upon reasonable request.
Ethics statement
The studies involving humans were approved by Independent Review Board at Veritas IRB (2023-3267-14464-1). The studies were conducted in accordance with the local legislation and institutional requirements. The participants provided their written informed consent to participate in this study.
Author contributions
MI: Conceptualization, Data curation, Formal analysis, Investigation, Methodology, Validation, Writing – original draft, Writing – review & editing, Resources. RI: Conceptualization, Data curation, Formal analysis, Investigation, Methodology, Project administration, Resources, Software, Validation, Writing – original draft, Writing – review & editing. CR: Conceptualization, Data curation, Formal analysis, Investigation, Methodology, Resources, Software, Validation, Writing – original draft, Writing – review & editing. JD: Conceptualization, Funding acquisition, Methodology, Project administration, Resources, Supervision, Validation, Writing – original draft, Writing – review & editing.
Funding
The author(s) declare that financial support was received for the research, authorship, and/or publication of this article. This study was internally funded by the organization (Acuity Insights) where the study was conducted. Funding was used to provide a token of appreciation to the assessors for their contribution to the think-aloud exercises.
Acknowledgments
We wish to acknowledge all the assessors who participated in our think-aloud study and provided their valuable time and insights. We are also grateful to our peers, Alexander MacIntosh, Cole Walsh, Gill Sitarenios, Josh Moskowitz, Kelly Dore, Matt Holland, Tara Scott, and Yiyu Xie for their constructive feedback on the manuscript.
Conflict of interest
MI, RI, CR, and JD are employed by Acuity Insights, the company that provides the situational judgment test (Casper), which has been examined in this study.
Generative AI statement
The authors declare that no Gen AI was used in the creation of this manuscript.
Publisher’s note
All claims expressed in this article are solely those of the authors and do not necessarily represent those of their affiliated organizations, or those of the publisher, the editors and the reviewers. Any product that may be evaluated in this article, or claim that may be made by its manufacturer, is not guaranteed or endorsed by the publisher.
Supplementary material
The Supplementary material for this article can be found online at: https://www.frontiersin.org/articles/10.3389/fmed.2024.1525156/full#supplementary-material
Footnotes
1. ^It is important to note, however, that for video responses the factors Noticeable grammatical errors and Informal applicant appearance, clothing, and/or background were observed in less than 5% of the analyzed data. It is possible that these factors might achieve significance in a larger sample.
2. ^These construct relevant factors were found in the case of both typed and video responses. The only difference between the two formats was found for the ‘Explicitly dismissed one side’ factor, which achieved significance in the content analysis of typed responses, but not in the content analysis of video responses. It is possible that either it is less likely for test takers to appear dismissive of other viewpoints in video responses, or that this characteristic was infrequent in the sample we analyzed.
References
1. Motowidlo, SJ, Dunnette, MD, and Carter, GW. An alternative selection procedure: the low-fidelity simulation. J Appl Psychol. (1990) 75:640–7. doi: 10.1037/0021-9010.75.6.640
2. Patterson, F, Zibarras, L, and Ashworth, V. Situational judgement tests in medical education and training: research, theory and practice: AMEE guide no. 100. Med Teach. (2016) 38:3–17. doi: 10.3109/0142159X.2015.1072619
3. Olaru, G, Burrus, J, MacCann, C, Zaromb, FM, Wilhelm, O, and Roberts, RD. Situational judgment tests as a method for measuring personality: development and validity evidence for a test of dependability. PLoS One. (2019) 14:e0211884. doi: 10.1371/journal.pone.0211884
4. Lievens, F. Adjusting medical school admission: assessing interpersonal skills using situational judgement tests. Med Educ. (2013) 47:182–9. doi: 10.1111/medu.12089
5. Patterson, F, Knight, A, Dowell, J, Nicholson, S, Cousans, F, and Cleland, J. How effective are selection methods in medical education? A systematic review. Clin. Teacher. (2016) 50:36–60. doi: 10.1111/medu.12817
6. Webster, ES, Paton, LW, Crampton, PE, and Tiffin, PA. Situational judgement test validity for selection: a systematic review and meta-analysis. Med Educ. (2020) 54:888–902. doi: 10.1111/medu.14201
7. Ballejos, MP, Cestone, C, Copeland, HL, Dunleavy, DM, Geiger, T, and Patel, D. Predicting medical student performance with a situational judgment test in admissions. Acad Med. (2024) 99:175–82. doi: 10.1097/ACM.0000000000005516
8. Patterson, F, and Driver, R. Situational judgement tests (SJTs) In: F Patterson and L Zibarras, editors. Selection and recruitment in the healthcare professions: Research, theory and practice. Cham: Springer International Publishing (2018). 79–112.
9. Cox, WC, Wolcott, M, Hahn, F, and McLaughlin, JE. The relationship between a multiple mini-interview and situational judgment test for admissions. Am J Pharm Educ. (2023) 87:ajpe9058. doi: 10.5688/ajpe9058
10. Klassen, R, Durksen, T, Rowett, E, and Patterson, F. Applicant reactions to a situational judgment test used for selection into initial teacher training. Int J Educ Psychol. (2014) 3:104–24. doi: 10.4471/ijep.2014.07
11. Nadmilail, AI, Mohd Matore, MEE, Maat, SM, and Sheridan, L. Broad vs. narrow traits: a scoping review of measuring personality traits in teacher selection using the situational judgment test. Front Psychol. (2023) 14:1–15. doi: 10.3389/fpsyg.2023.1217321
12. Aamodt, MG, Bryan, DA, and Whitcomb, AJ. Predicting performance with letters of recommendation. Public Pers Manage. (1993) 22:81–90. doi: 10.1177/009102609302200106
13. Kuncel, NR, Kochevar, RJ, and Ones, DS. A meta-analysis of letters of recommendation in college and graduate admissions: reasons for hope. Int J Sel Assess. (2014) 22:101–7. doi: 10.1111/ijsa.12060
14. Chen, J, Tao, BK, Park, S, and Bovill, E. Can ChatGPT fool the match? Artificial intelligence personal statements for plastic surgery residency applications: a comparative study. Plastic Surg. (2024):22925503241264832. doi: 10.1177/22925503241264832
15. Harwood, H, Roulin, N, and Iqbal, MZ. “Anything you can do, I can do”: examining the use of ChatGPT in situational judgement tests for professional program admission. J Vocat Behav. (2024) 154:104013. doi: 10.1016/j.jvb.2024.104013
16. Eva, KW, Reiter, HI, Trinh, K, Wasi, P, Rosenfeld, J, and Norman, GR. Predictive validity of the multiple mini-interview for selecting medical trainees. Med Educ. (2009) 43:767–75. doi: 10.1111/j.1365-2923.2009.03407.x
17. Fogel, HA, Liskutin, TE, Wu, K, Nystrom, L, Martin, B, and Schiff, A. The economic burden of residency interviews on applicants. Iowa Orthop J. (2018) 38:9–15.
18. Whetzel, DL, McDaniel, MA, and Nguyen, NT. Subgroup differences in situational judgment test performance: a meta-analysis. Hum Perform. (2008) 21:291–309. doi: 10.1080/08959280802137820
19. Tiffin, PA, Paton, LW, O’Mara, D, MacCann, C, Lang, JWB, and Lievens, F. Situational judgement tests for selection: traditional vs construct-driven approaches. Med Educ. (2020) 54:105–15. doi: 10.1111/medu.14011
20. Rockstuhl, T, Ang, S, Ng, K-Y, Lievens, F, and Van Dyne, L. Putting judging situations into situational judgment tests: evidence from intercultural multimedia SJTs. J Appl Psychol. (2015) 100:464–80. doi: 10.1037/a0038098
21. Lievens, F, Sackett, PR, Dahlke, JA, Oostrom, JK, and De Soete, B. Constructed response formats and their effects on minority-majority differences and validity. J Appl Psychol. (2019) 104:715–26. doi: 10.1037/apl0000367
22. MichaelA, MD, Hartman, NS, Whetzel, DL, and Grubb, WL III. Situational judgment tests, response instructions, and validity: a meta-analysis. Pers Psychol. (2007) 60:63–91. doi: 10.1111/j.1744-6570.2007.00065.x
23. Whetzel, DL, and McDaniel, MA. Situational judgment tests: an overview of current research. Hum Resour Manag Rev. (2009) 19:188–202. doi: 10.1016/j.hrmr.2009.03.007
24. Lievens, F, Peeters, H, and Schollaert, E. Situational judgment tests: a review of recent research. Pers Rev. (2008) 37:426–41. doi: 10.1108/00483480810877598
25. Borchert, RJ, Hickman, CR, Pepys, J, and Sadler, TJ. Performance of ChatGPT on the situational judgement test—a professional dilemmas–based examination for doctors in the United Kingdom. JMIR Med Educ. (2023) 9:e48978. doi: 10.2196/48978
26. Ellison, HB, Grabowski, CJ, Schmude, M, Costa, JB, Naemi, B, Schmidt, M, et al. Evaluating a situational judgment test for use in medical school admissions: two years of AAMC PREview exam administration data. Acad Med. (2024) 99:183–91. doi: 10.1097/ACM.0000000000005548
27. Parker-Newlyn, L, Dore, KL, and Mansfield, K. “CASPer down under”: piloting an online situational judgement test for medical student selection in Australia. Can Med Educ J. (2020) 11:e76–7. doi: 10.36834/cmej.v11i2
28. Yingling, S, Park, Y, Curry, R, Monson, V, and Girotti, J. Beyond cognitive measures: empirical evidence supporting holistic medical school admissions practices and professional identity formation. Med EdPublish. (2018) 7:274. doi: 10.15694/mep.2018.0000274.1
29. Lumley, T. Assessment criteria in a large-scale writing test: what do they really mean to the raters? Lang Test. (2002) 19:246–76. doi: 10.1191/0265532202lt230oa
30. Wood, TJ. Exploring the role of first impressions in rater-based assessments. Adv Health Sci Educ. (2014) 19:409–27. doi: 10.1007/s10459-013-9453-9
31. Hasan, A, and Jones, B. Assessing the assessors: investigating the process of marking essays. Front Oral Health. (2024) 5:1–9. doi: 10.3389/froh.2024.1272692
32. Gingerich, A, Regehr, G, and Eva, KW. Rater-based assessments as social judgments: rethinking the etiology of rater errors. Acad Med. (2011) 86:S1–7. doi: 10.1097/ACM.0b013e31822a6cf8
33. Shapiro, VB, Kim, B, Accomazzo, S, and Roscoe, JN. Predictors of rater bias in the assessment of social-emotional competence. Int J Emot Educ. (2016) 8:25–44.
34. Condor, A. Predicting short response ratings with non-content related features: a hierarchical modeling approach. ArXiv Prepr ArXiv. (2024):240508574. doi: 10.48550/arXiv.2405.08574
35. Mello, RF, Neto, R, Fiorentino, G, Alves, G, Arêdes, V, Silva, JVGF, et al. Enhancing instructors’ capability to assess open-response using natural language processing and learning analytics In: I Hilliger, PJ Muñoz-Merino, T De Laet, A Ortega-Arranz, and T Farrell, editors. Educating for a new future: Making sense of technology-enhanced learning adoption: 17th European conference on technology enhanced learning, EC-TEL 2022, Toulouse, France, September 12–16, 2022, proceedings. Cham: Springer International Publishing (2022). 102–15.
36. McKinstry, BH, Cameron, HS, Elton, RA, and Riley, SC. Leniency and halo effects in marking undergraduate short research projects. BMC Med Educ. (2004) 4:28. doi: 10.1186/1472-6920-4-28
37. Bergman, ME, Drasgow, F, Donovan, MA, Henning, JB, and Juraska, SE. Scoring situational judgment tests: once you get the data, your troubles begin. Int J Sel Assess. (2006) 14:223–35. doi: 10.1111/j.1468-2389.2006.00345.x
38. De Leng, WE, Stegers-Jager, KM, Husbands, A, Dowell, JS, Born, MP, and Themmen, APN. Scoring method of a situational judgment test: influence on internal consistency reliability, adverse impact and correlation with personality? Adv Health Sci Educ. (2017) 22:243–65. doi: 10.1007/s10459-016-9720-7
39. Whetzel, DL, Sullivan, TS, and McCloy, RA. Situational judgment tests: an overview of development practices and psychometric characteristics. Pers Assess Decis. (2020) 6:1–17. doi: 10.25035/pad.2020.01.001
40. McDaniel, MA, List, SK, and Kepes, S. The “hot mess” of situational judgment test construct validity and other issues. Ind Organ Psychol. (2016) 9:47–51. doi: 10.1017/iop.2015.115
41. Lievens, F, and Motowidlo, SJ. Situational judgment tests: from measures of situational judgment to measures of general domain knowledge. Ind Organ Psychol. (2016) 9:3–22. doi: 10.1017/iop.2015.71
42. Wolcott, MD, Lobczowski, NG, Zeeman, JM, and McLaughlin, JE. Situational judgment test validity: an exploratory model of the participant response process using cognitive and think-aloud interviews. BMC Med Educ. (2020) 20:506–12. doi: 10.1186/s12909-020-02410-z
43. Dore, KL, Reiter, HI, Kreuger, S, and Norman, GR. CASPer, an online pre-interview screen for personal/professional characteristics: prediction of national licensure scores. Adv Health Sci Educ. (2017) 22:327–36. doi: 10.1007/s10459-016-9739-9
44. Casper Technical Manual. (2024). Unpublished report: acuity insights. Available online at: https://acuityinsights.com/wp-content/uploads/2024/07/Casper-Technical-Manual.pdf
46. Saxena, A, Desanghere, L, Dore, K, and Reiter, H. Incorporating a situational judgement test in residency selections: clinical, educational and organizational outcomes. BMC Med Educ. (2024) 24:339. doi: 10.1186/s12909-024-05310-8
47. Gheyle, N, and Jacobs, T. Content analysis: a short overview. Intern Res Note. (2017):1–18. doi: 10.13140/RG.2.2.33689.31841
48. White, MD, Marsh, EE, Marsh, EE, and White, MD. Content analysis: a flexible methodology. Libr Trends. (2006) 55:22–45. doi: 10.1353/lib.2006.0053
49. Stemler, S. An overview of content analysis: practical assessment. Pract Assess Res Eval. (2000) 7:17. doi: 10.7275/z6fm-2e34
51. Cohen, J. Methodological issues and strategies in clinical research. 4th Edn Washington: American Psychological Association. (2016). 279–284.
52. R Core Team. (2021) A language and environment for statistical computing. Available online at: https://www.R-project.org/
53. Ericsson, KA. Protocol analysis and expert thought: concurrent verbalizations of thinking during experts’ performance on representative tasks In: KA Ericsson, N Charness, PJ Feltovich, and RR Hoffman, editors. The Cambridge handbook of expertise and expert performance. Cambridge: Cambridge University Press (2006). 223–42.
54. Charters, E. The use of think-aloud methods in qualitative research: an introduction to think-aloud methods. Brock Educ J. (2003) 12:12. doi: 10.26522/brocked.v12i2.38
55. Radford, A, Kim, JW, Xu, T, Brockman, G, Mcleavey, C, and Sutskever, I. Robust speech recognition via large-scale weak supervision In: A Krause, E Brunskill, K Cho, B Engelhardt, S Sabato, and J Scarlett, editors. Proceedings of the 40th international conference on machine learning (2023). 28492–518.
56. Thomas, DR. A general inductive approach for analyzing qualitative evaluation data. Am J Eval. (2006) 27:237–46. doi: 10.1177/1098214005283748
57. Braun, V, and Clarke, V. Toward good practice in thematic analysis: avoiding common problems and be(com)ing a knowing researcher. Int J Transgender Health. (2023) 24:1–6. doi: 10.1080/26895269.2022.2129597
58. Juster, FR, Baum, RC, Zou, C, Risucci, D, Ly, A, Reiter, H, et al. Addressing the diversity–validity dilemma using situational judgment tests. Acad Med. (2019) 94:1197–203. doi: 10.1097/ACM.0000000000002769
60. Reynders, G, Lantz, J, Ruder, SM, Stanford, CL, and Cole, RS. Rubrics to assess critical thinking and information processing in undergraduate STEM courses. Int J STEM Educ. (2020) 7:9. doi: 10.1186/s40594-020-00208-5
61. Decety, J. Perspective taking as the royal avenue to empathy In: Other minds: How humans bridge the divide between self and others. New York, NY: The Guilford Press (2005). 143–57.
62. Glassner, A, and Schwarz, BB. What stands and develops between creative and critical thinking? Argumentation? Think Skills Creat. (2007) 2:10–8. doi: 10.1016/j.tsc.2006.10.001
Keywords: situational judgment tests, open response scoring, construct validity, professionalism, personal skills, professional skills, admissions
Citation: Iqbal MZ, Ivan R, Robb C and Derby J (2025) Evaluating factors that impact scoring an open response situational judgment test: a mixed methods approach. Front. Med. 11:1525156. doi: 10.3389/fmed.2024.1525156
Edited by:
Kamran Sattar, King Saud University, Saudi ArabiaReviewed by:
Mona Hmoud AlSheikh, Imam Abdulrahman Bin Faisal University, Saudi ArabiaZiqi Zhou, Sichuan University, China
Copyright © 2025 Iqbal, Ivan, Robb and Derby. This is an open-access article distributed under the terms of the Creative Commons Attribution License (CC BY). The use, distribution or reproduction in other forums is permitted, provided the original author(s) and the copyright owner(s) are credited and that the original publication in this journal is cited, in accordance with accepted academic practice. No use, distribution or reproduction is permitted which does not comply with these terms.
*Correspondence: Muhammad Zafar Iqbal, emlxYmFsQGFjdWl0eWluc2lnaHRzLmNvbQ==