 Danila Potyagaylo1*
 Peter M. van Dam1Marcin Kuniewicz2,3Damian Dolega-Dolegowski4
 Agnieszka Pregowska5
 Andrew Atkinson6
 Halina Dobrzynski2,6
 Klaudia Proniewska1,7
- 1Center for Digital Medicine and Robotics, Jagiellonian University Medical College, Krakow, Poland
- 2Department of Anatomy, Jagiellonian University Medical College, Krakow, Poland
- 3Department of Electrocardiology, Institute of Cardiology, Jagiellonian University Medical College, Krakow, Poland
- 4Jagiellonian University Medical College, Krakow, Poland
- 5Institute of Fundamental Technological Research, Polish Academy of Sciences, Warsaw, Poland
- 6Division of Cardiovascular and Endocrine Sciences, University of Manchester, Manchester, United Kingdom
- 7Department of Bioinformatics and Telemedicine, Jagiellonian University Medical College, Krakow, Poland
The most commonly applied way of teaching students to convey the foundations of human anatomy and physiology involves textbooks and lectures. This way of transmitting knowledge causes difficulties for students, especially in the context of three-dimensional imaging of organ structures, and as a consequence translates into difficulties with imagining them. Even despite the rapid uptake of knowledge dissemination provided by online materials, including courses and webinars, there is a clear need for learning programs featuring first-hand immersive experiences tailored to suit individual study paces. In this paper, we present an approach to enhance a classical study program by combining multi-modality data and representing them in a Mixed Reality (MR)-based environment. The advantages of the proposed approach have been proven by the conducted investigation of the relationship between atrial anatomy, its electrophysiological characteristics, and resulting P wave morphology on the electrocardiogram (ECG). Another part of the paper focuses on the role of the sinoatrial node in ECG formation, while the MR-based visualization of combined micro-computed tomography (micro-CT) data with non-invasive CineECG imaging demonstrates the educational application of these advanced technologies for teaching cardiac anatomy and ECG correlations.
1 Introduction
It is known that teaching cardiac anatomy and electrophysiology involves conveying complex three-dimensional (3D) structures and dynamic processes, which are fundamental for understanding cardiovascular function and disease (1). Learning about the electrocardiogram (ECG) and its relation to heart anatomy is in its turn fundamental in understanding cardiac electrophysiology and diagnosing pathologies. Classical methods have traditionally focused on providing a foundational understanding through various educational tools and approaches, each with its own set of advantages and limitations.
Lectures are the oldest and an efficient way to deliver theoretical knowledge, including fundamental concepts of cardiac anatomy and the basics of electrophysiology. They are typically enhanced with visual aids, e.g. diagrams and videos, to illustrate dynamic processes. This way of learning is, however, passive in nature and may not effectively engage all students in real time. Textbooks and atlases facilitate deep understanding of complex spatial and functional concepts by providing detailed descriptions and high-quality illustrations of cardiac structures and electrical conduction pathways. They contain the basics of ECG interpretation, including detailed discussions on PQRST waves genesis, morphology, and clinical implications. These resources serve as a valuable reference for self-study and reviews, though static images are not always sufficient to fully capture the dynamic nature of cardiac electrophysiology. Concerning hands-on experience, cadaveric dissection offers an early encounter with the heart's anatomy, allowing students to appreciate the physical dimensions and spatial relationships of cardiac structures. Such an experience comes at the cost of limited functional understanding, such as electrical conduction. Furthermore, there might be scarce availability and ethical considerations in distinct countries limiting the utility of this teaching method. To overcome this limitation, physical, e.g. 3D printed, models can be manipulated to better understand the patient-specific 3D structure of the heart (2, 3). Clinical training and rotations are ECG-related hands-on practices that involve studying various ECGs to recognize normal and abnormal wave morphologies, understanding their clinical relevance, and correlating them with potential pathologies.
More recent didactic approaches include problem-based learning (PBL), simulation software tools and extended reality (XR), including virtual reality (VR) and mixed reality (MR) (4, 5). PBL promotes deeper understanding by confronting multiple clinical scenarios. It develops critical thinking and collaborative skills (6). This art of teaching requires well-designed problems, which may not cover all relevant material equally comprehensively. An analogous learning process occuring in the everyday clinical setup is through mentorship programs and case studies, where special ECG cases are discussed with experienced colleagues and presented to a broad audience in the form of scientific reports.
Simulation software for electrophysiological mapping is a very powerful tool that allows students to visualize and manipulate the electrical activity of the heart in the unprecedented ways. Moreover, the underlying excitation patterns are directly linked to the ECG enabling invasive treatment testing. A plethora of pathological conditions covering a broad range of potential scenarios with associated ECGs can be simulated for educational purposes. However, it may require a strong foundational technical knowledge to be effectively utilized (7).
VR and MR are digital animations and interactive models that an provide immersive experience for grasping truly 3D complex spatial relationships and demonstrating dynamic processes regarding cardiac electrophysiology and blood flow (8). VR simulations offer immersive experiences that can significantly enhance understanding of complex spatial relationships and functions.
Such an approach combining theoretical knowledge with practical experience and ongoing learning is crucial for understanding the complex relationship between the ECG waves and cardiac anatomy in general, and P wave on the ECG and human atrial anatomy in particular (9, 10). The heart functions fundamentally as a muscle, contracting to pump blood throughout the body. It is primarily composed of muscle cells known as cardiac myocytes. For these myocardial cells to contract, they must depolarize, a process that does not occur spontaneously, but follows a physiologically prescribed sequence triggered by natural pacemakers and realized via the conduction system. The depolarization begins in the sinoatrial node (SAN), the heart's primary pacemaker, then spreads through the contractile myocytes of the atria to reach the AV node. The AV node slowly transmits the depolarization to the His bundles, which are connected to an extensive network of small Purkinje fibers. The potential differences between adjacent myocardial cells generate currents in the extracellular space. These currents, following Ohm's law, create potentials on the body volume, detectable on its surface as the electrocardiogram (ECG). In this study we focus on the relationship between the SAN location on the highly detailed atrial anatomy, the resulting depolarization wave and the potentials measured on the body surface as the P wave.
The study of P-wave morphology is gaining interest because it can reveal the complex path of atrial depolarization and identify specific conduction issues. The characteristics of the P-wave are influenced by several factors, including (1) the starting point of the sinus rhythm, i.e. SAN, which determines the direction of depolarization in the right atrium, (2) the connection points to the left atrium, where it starts to depolarize, and (3) anatomical and tissue characteristics of the atrial chambers. In some cases, it could be challenging to ascertain if abnormalities in the P-wave morphology are due to pathological anatomical changes, e.g. atrial enlargement, or delays (or blocks) in conduction between the atria. Recent advancements in the technology for mapping the atrial endocardium connected particular P-wave shapes to specific patterns of conduction between the atria and the functionality of the primary pathways for this conduction (11). P-wave morphology analysis is important not just for identifying heart rhythm issues related to atrial conduction delays, but also for forecasting the outcomes of various cardiovascular diseases (12).
This paper aims to investigate interrelation between the atrial anatomy, P wave morphology and activation sequences, and present novel visualization options augmented by combining multi-modal data based on MR technologies, namely the application of the Microsoft HoloLens 2 device.
1.1 SA node location and atrial excitation
In a healthy heart, the SA node is a group of cells located in the upper part of the right atrium, near the superior vena cava (SVC) junction. Distinct approaches to analyze its size have reported substantially varying results. While electron microscopy measurements provided 13.5 ± 2.5 mm in length, 1.2 ± 0.3 mm in height, and 5.6 ± 1.4 mm in width (13), immunohistochemical methods resulted in 29.5 mm in length, 1.8 mm in height, and 6.4 mm in width (14). At the same time, a functional study analyzing atrial depolarisation in 14 patients revealed multiple patterns of impulse initiation with a pacemaker region (paranodal area) encompassing a zone as large as 75 mm × 15 mm (15). Upon SAN excitation, the area first captured by the myocardium is coined as the earliest activation site (EAS). The location of a single or multiple EASs is a subject to great inter-individual variability. In Boineau et al. (15) a typical unifocal SAN activation was observed along with unifocal extranodal impulse origin, and multicentric excitation from two to four separate atrial pacemaker sites. Furthermore, Schuessler reviewed how SAN conduction can be coupled with extranodal pacemakers and in combination with the autonomic nervous system control the pattern of atrial EAS (16).
In healthy conditions, the electrical impulse from the SAN travels through the atrial muscle in a manner facilitating coordinated and regular atrial depolarization. The fastest propagation occurs in the bundles and pectinate mucsles (PM) due to more pronounced cellular anisotropy in these regions (17). The Crista Terminals (CT), Bachmann's bundle (BB) and PM are the most prominent conductive structures, while the left atrium (LA) consists of subepicardial and subendocardial layers featuring the interatrial and septopulmonary bundles, respectively. The CT runs on the posterior wall on the right side from the SVC orifice down to the inferior vena cava orifice. The BB represents the most largest interatrial connection crossing the interatrial groove and splitting into two branches running toward atrial appendages (18). Other interatrial connections are found on the anterior and posterior sides showing a great interindividual variability.
1.2 P wave morphology
With the SAN in its standard (i.e. close to SVC junction) position, the P wave on the ECG usually appears as a smooth, upright deflection in the leads I, II, aVF, often biphasic in V1, and inverted in the lead aVR. Obviously, deviations in the SAN position, extent and EAS within the paranodal area can significantly impact the morphology of the P wave. Thus, an inferior SAN placement, or an inferior EAS within a normally distributed paranodal area (19), might cause a downward or negative deflection in the P wave due to the altered direction of the impulse. A posteriorly located SA node can make the P wave more pronounced in the posterior ECG leads. A shift of the SA node to the left or right may also modify P-wave morphology, affecting the interatrial connections involved and thus the direction of atrial depolarization.
Variations in P wave morphology linked to the varying SAN location can sometimes be of pathophysiological nature, e.g. due to congenital heart disease (20). Acquired changes in the interatrial muscular bridges may result in fibrotic substrate building leading to atrial fibrillation (AF) (21). Delayed interatrial conduction as measured by P wave duration has been considered as a reliable non-invasive marker associated with AF history. However, as reviewed by Platonov (11) development of paroxysmal AF is not always accompanied by underlying structural heart disease. It was further indicated that the P wave morphology depends on the three basic factors, being the SAN location defining the RA excitation pattern, the active interatrial connections and breakthrough points in the LA, and the individual atrial shape, size and structural properties. The latter factor is further affected by presence of certain pathophysiological conditions, e.g. accumulation of insoluble amyloid fibrils between cardiomyocytes promoting supraventricular arrhythmias (22). This poses the task of distinguishing morphological changes between normal anatomical variability versus those caused by pathological conditions, for instance, atrial enlargement or electrolyte imbalances.
2 Methods
In this study, we combine multi-modality data allowing a deeper understanding of the P wave genesis in the light of factors outlined in the previous chapter. Furthermore, it enhances visualization and thus facilitates comprehension and learning of the underlying excitation mechanisms. To achieve this two-fold goal we use micro-CT (mCT) data of the human atria, CineECG methodology and MR environment.
2.1 Micro-CT data
The acquisition and processing steps for the mCT data used in this study were previously reported and described in great detail in Stephenson et al. (23). For our computation and visualization purposes we used the high-resolution triangulated meshes (498,121 nodes) as the input. The resulting atrial anatomy with color-coded distinct segmented structures is shown in Figure 1.
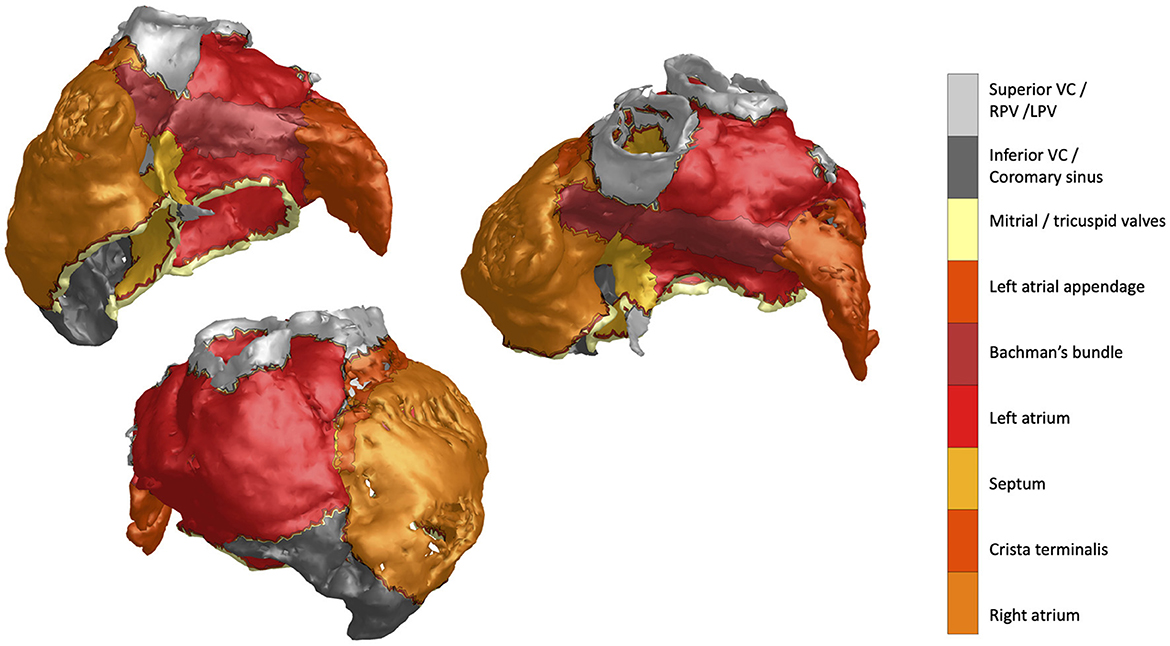
Figure 1. MicroCT atrial mesh data featuring distinct structures annotated by the colorbar label text.
2.2 CineECG
Interpretation of 12-lead ECG is a skill requiring extensive knowledge of cardiac electrophysiology. Moreover, ECG decoding usually involves application of rule-based heuristics ignoring intrinsic anatomical relationships during wavefront propagation. With this regard, CineECG is a novel tool that allows anatomically adjusted representation of cardiac activation. CineECG approximates the path of the average electrical processes in the heart and can be best compared to estimating as the position of a moving dipole vector over time. This dipole or vector position has anatomical and electrical meaning as shown by Boonstra et al. (24). To estimate the position of the dipole vector, the vector direction needs to be estimated. This vectorcardiogram (VCG) is obtained by computing the lead vectors over time relative to the estimated vector position within the heart. For this purpose, the atrial model was used with the torso electrodes placement at the standard 12-lead positions. Based on the consectively computed VCG, the position is estimated over time by moving into the direction of the VCG with a fixed step. The obtained path represents the CineECG. It was demonstrated to correctly reflect the average location and direction of cardiac activation, recover clinically important features of the excitation spread and reliably relate an activation trajectory to the three-dimensional cardiac geometry. Beyond the proof-of-concept, this methodology has also been shown to open a novel view on the normal P waves distribution (25) and be instrumental in the 3D-based detection of an early-stage interatrial block (26).
Extending on the application of this methodology to the P wave analysis, we considered the three following cases of distinct P wave morphologies highlighting the benefits of the combined representation approach to identify individualized atrial depolarization patterns related linked to a 3D anatomy. A healthy normal, a negative and a P wave morphologically indicating an interatrial block (IAB) were extracted from the PTB-XL ECG database (27). The respective ECGs are presented in Figure 2.
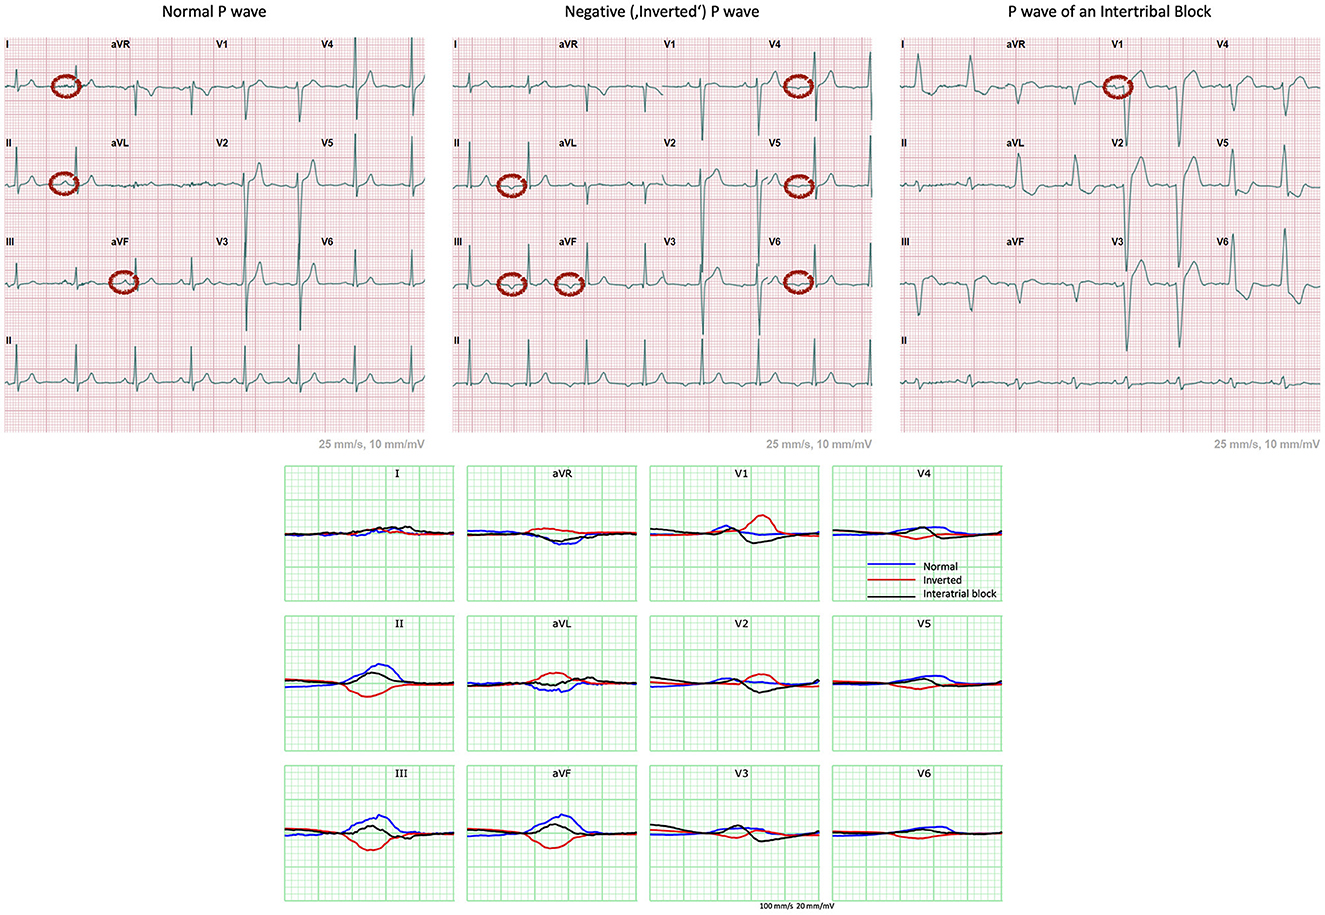
Figure 2. 12-lead ECGs extracted from the PTB-XL ECG database showing examples of cases of a healthy normal, a negative and a P wave exhibiting an IAB. Normal P wave has positive (or upright) waves in leads I, II and aVF (11). The “inverted” P waves are negative in leads II, III, aVF, V4 to V6 and biphasic in V3. This indicates retrograde atrial conduction with the depolarization starting at the bottom of the atria, most probably originating in the atrioventricular (AV) junction. The biphasic nature of V1 indicates presence of at least partial IAB (11).
The mCT atrial anatomy was then fitted into a generic body model with pre-defined ECG leads location on it. Having the ECG signals and anatomical relationship between the torso and atria, we computed the mean activation trajectory through the atrial geometry. Based on this mean activation pathway we determined the EAS, corresponding to the SAN excitation breakthrough, as the surface mesh node closest to the trajectory onset. Given the excitation start, we performed the fastest route simulations to compute the activation times on the whole atrial surface given the changes in local myocardial velocities (28). For computing the initial estimates of atrial activation in the healthy and negative P waves, the conduction velocity in the BB and CT was set to be 1.5 times higher than for the normal value of 1 m/s. In the case of IAB, the BB velocity was set to 0.5 m/s. The generated excitation sequences were then further optimized to match the recorded ECGs (29).
3 Results
The resulting activation trajectories together with the activation times overlaid with the used atrial geometry are visualized in Figure 3. In the considered normal (positive) P wave the activation vector starts, as expected, close to the SAN area and runs in the inferior direction toward the LA. The activation times exhibit earlier depolarization on the latero-anterior RA and lateral LA walls corresponding to the faster conducting pectinate muscles and BB. The major excitation direction has a downward right-to-left pattern with the antero-lateral LA wall and IVC having the latest activation times. In contrast, activation reconstruction of the inverted P wave clearly shows the upward left-to-right propagation. The EAS is located in the inferior part of the posterior wall, and the propagation spreads to the LA and superior part of the RA. In the case of an interatrial block, the excitation pattern is markedly distinct—the trajectory leaves the paranodal area and then, instead of spreading to the LA via Bachmann's bundle and pointing downwards, goes first inferior while supposedly activating the LA via interseptal connections. The left atrial appendage exhibits expectedly the latest activation.
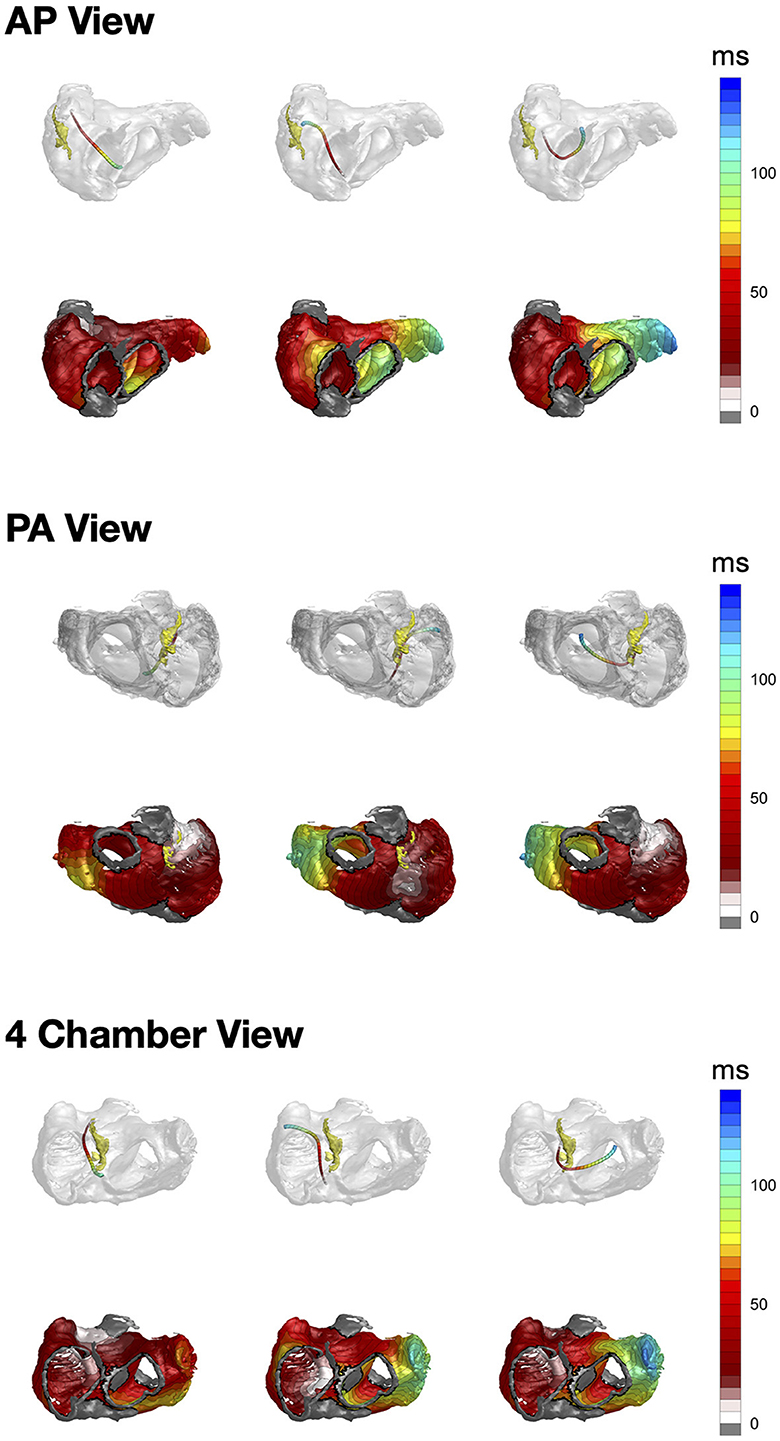
Figure 3. From left to right: CineECG-derived vector trajectories (upper row) together with the respective activation times (lower row) for the normal P wave, inverted P wave and interatrial block, respectively. Yellow structure in the top row is the SAN paranodal area provided by Stephenson et al. (23).
As Supplementary material we provide videos from the MR HoloLenses software to show user interaction while studying the presented case series.
4 Discussion
The presented examples indicate potential benefits of the suggested combined approach to tackle the current obstacles in the P wave analysis as well as to bridge the respective teaching gaps. Taken alone each of the methodologies, be it mCT, CineECG (or any other non-invasive ECG imaging procedure), Microsoft HoloLenses 2, can not provide a comprehensive view on the interplay between anatomy and electrophysiological function of the heart. Thus, the application of MR enhanced spatial understanding of the complex anatomical structures of the heart as well as their spatial relations. In this context, it is worth emphasizing the mutual relationship between structural cardiac changes and respective ECG waveforms. The electrical axis of the heart does not necessarily correlate to its anatomical axis reflecting possible underlying conduction disorders (30). Furthermore, it has been shown that ECG derived parameters can indicate subclinical markers of abnormal cardiac structure and function (31). Cardiomyopathy patients having very pronounced anatomical and functional alterations of the heart could benefit from careful 12-lead ECG interpretation guiding the diagnosis toward a specific disease form and providing appropriate risk stratification scores (32). Also regional disruptions of conduction properties, e.g. due to fibrotic tissue presence, result in late potentials, low voltage and fractionated local electrograms affecting the ECG genesis (33, 34).
Data obtained with the dedicated mCT protocol allow a thorough examination and delineation of all anatomical structures and substrates relevant for atrial electrical excitation, including the SAN, fast conducting fibers (CT, BB, intercaval, septopulmunory and septoatrial bundles, pectinate muscles). While mCT offers an unparalleled high resolution compared to conventional clinical CT scanners, it comes at cost of much high radiation power and exposure times. As dose and motion artifacts are less of a concern in cadaveric tissues, the mCT data can be obtained and processed only post-mortem. Therefore we needed to augment the geometry with ECG recordings from other individuals. The PTB-XL represents an excellent well-documented source of ECG data featuring a variety of normal and abnormal cases. For the proof-of-concept and illustration purposes we picked a healthy normal, an inverted P wave and a case with an interatrial block. As CineECG estimates excitation patterns based on the anatomical relationships between the heart, torso and 12-lead ECG electrodes, we fitted the mCT atria into a generic body with pre-specified lead locations. In principle, this procedure can be applied to any generic torso-heart pair, however, overlaying the resulting excitation pattern could be of greater clinical and teaching significance. Highlighting areas with slow or blocked conduction and breakthrough points in the RA and LA matched with the anatomical mCT template can serve as a valuable tool for 3D visualization facilitating ECG interpretation and diagnosis. Even further enhancement in data representation and show-casing is provided by the Microsoft HoloLens 2 technology allowing an immersive experience and thus amended understanding of the relationship between cardiac anatomy and electrical activity. It is worth noting that an MR-based environment by combining virtual content with the real world, not only makes it more attractive but also increases the level of student engagement (35). It is also an effective environment that supports collaborative learning (36).
In research, such a combined approach can aid in studying the impact of anatomical variations. For the same ECG excitation pathways might be distinct, and performing this analysis would provide the spectrum of possible conduction disorders. Detailed mCT data together with the HoloLenses can also be augmented by a cardiac simulation tool, e.g. Plank et al. (7). Then all anatomical structures would be incorporated into the modeling procedure and different pathological scenarios, i.e. excitation sequences together with the respective ECGs, can be simulated and visualized for educational purposes. In a clinical setting, integrating patient-specific ECG data with the template mCT anatomical data can assist in planning and guiding cardiac procedures, such as ablations, by providing a detailed map of the cardiac structures and electrical activation patterns.
5 Limitations
The needed CT resolution can not be currently implemented in the clinical patient-screening settings, making the combination of patient-specific ECG with a template mCT data necessary for clinical applications of the combined approach. However, we believe it to be a great fit for educational purposes merging anatomical and electrophysiological data in a user-friendly visualization environment. The CineECG tool aims to provide a novel view of cardiac excitation facilitating ECG students and practitioners in patients' screening and diagnostic. It does not deliver an activation map competing in accuracy with a result of the invasive mapping study. Nevertheless, it was shown to provide additional information at the spatial level that can be related to the atrial conduction system (26). Finally, the Hololenses as a tool requires specialized software and hardware incurring the purchase cost. Thus, the implementation of MR-based imaging technology in educational practice due to high cost, which is particularly important in low-income countries may be troublesome (37). For many educational units, such an expense may turn out to be too high. This may have a potential influence on deepening already existing inequalities in education. Furthermore, some knowledge in both cardiac imaging and electrophysiology constitute the pre-requisites for the HoloLenses to be run effectively. MR-based systems may also be quite complicated in configuration and maintenance. Another limitation is connected with the introduction of some kind of dependence of the learning process on technology. In this case, technical failures, software glitches, or hardware failures may disrupt this process. Additionally, prolonged use of MR technology may cause physical discomfort or fatigue, including headaches and motion sickness (38).
6 Conclusions
To summarize, the combination of mCT data with ECG analysis for visualization purposes is a powerful approach that can enhance our understanding of atrial electrophysiology, aid in medical education, and have clinical applications in diagnosing and treating cardiac conditions. The present cases will be made publicly available in the HoloLenses-compatible format to bring more awareness to this kind of methodology and start building an educational platform hosting and combining mutli-modality data.
Data availability statement
The data analyzed in this study is subject to the following licenses/restrictions: Postmortem data. See HH074 and HH059 http://www.vhlab.umn.edu/atlas/histories/fordetails. Requests to access these datasets should be directed at: HD, aGFsaW5hLmRvYnJ6eW5za2lAdWouZWR1LnBs.
Author contributions
DP: Conceptualization, Investigation, Methodology, Writing – original draft, Writing – review & editing. PD: Conceptualization, Software, Writing – original draft, Writing – review & editing. MK: Methodology, Writing – review & editing. DD-D: Visualization, Writing – review & editing. AP: Writing – review & editing. AA: Resources, Writing – review & editing. HD: Conceptualization, Writing – review & editing. KP: Funding acquisition, Supervision, Writing – original draft, Writing – review & editing.
Funding
The author(s) declare that financial support was received for the research, authorship, and/or publication of this article. This work was supported by the grant and project “Interactive TEAching of Medical 3D cardiac anatomy supported by Mixed Reality (iTeam 3D-MR),” agreement number 2023-1-PL01-KA220-HED-000159314, Erasmus + Program, Strategic Partnerships (Key Action 2). The research was also partially supported by the National Centre for Research and Development under Grant Lider No. LIDER/17/0064/L-11/19/NCBR/2020. AA and HD was received supported by the Leducq Foundation (The FANTACY 19CVD03).
Conflict of interest
The authors declare that the research was conducted in the absence of any commercial or financial relationships that could be construed as a potential conflict of interest.
The author(s) declared that they were an editorial board member of Frontiers, at the time of submission. This had no impact on the peer review process and the final decision.
Publisher's note
All claims expressed in this article are solely those of the authors and do not necessarily represent those of their affiliated organizations, or those of the publisher, the editors and the reviewers. Any product that may be evaluated in this article, or claim that may be made by its manufacturer, is not guaranteed or endorsed by the publisher.
Supplementary material
The Supplementary Material for this article can be found online at: https://www.frontiersin.org/articles/10.3389/fmed.2024.1422017/full#supplementary-material
References
1. Glover BM, Buckley O, Ho SY, Sanchez-Quintana D, Brugada P. Cardiac anatomy and electrophysiology. In:Glover BM, Brugada P, , editors. Clinical Handbook of Cardiac Electrophysiology. New York, NY: Springer (2016), p. 1–37. doi: 10.1007/978-3-319-40818-7_1
2. Lim KHA, Loo ZY, Goldie SJ, Adams JW, McMenamin PG. Use of 3D printed models in medical education: arandomized control trial comparing 3D prints versus cadaveric materials for learning external cardiac anatomy. Anat Sci Educ. (2016) 9:213–21. doi: 10.1002/ase.1573
3. Karsenty C, Guitarte A, Dulac Y, Briot J, Hascoet S, Vincent R, et al. The usefulness of 3D printed heart models for medical student education in congenital heart disease. BMC Med Educ. (2021) 21:1–8. doi: 10.1186/s12909-021-02917-z
4. Fidan M, Tuncel M. Integrating augmented reality into problem based learning: the effects on learning achievement and attitude in physics education. Comput Educ. (2019) 142:103635. doi: 10.1016/j.compedu.2019.103635
5. Maresky H, Oikonomou A, Ali I, Ditkofsky N, Pakkal M, Ballyk B. Virtual reality and cardiac anatomy: exploring immersive three-dimensional cardiac imaging, a pilot study in undergraduate medical anatomy education. Clin Anat. (2019) 32:238–43. doi: 10.1002/ca.23292
6. Allen DE, Donham RS, Bernhardt SA. Problem-based learning. New Dir Teach Learn. (2011) 2011:21–9. doi: 10.1002/tl.465
7. Plank G, Loewe A, Neic A, Augustin C, Huang YL, Gsell MA, et al. The openCARP simulation environment for cardiac electrophysiology. Comput Methods Programs Biomed. (2021) 208:106223. doi: 10.1016/j.cmpb.2021.106223
8. Kolecki R, Pręgowska A, Dąbrowa J, Skuciński J, Pulanecki T, Walecki P, et al. Assessment of the utility of mixed reality in medical education. Transl Res Anat. (2022) 28:100214. doi: 10.1016/j.tria.2022.100214
9. Kistler PM, Chieng D, Tonchev IR, Sugumar H, Voskoboinik A, Schwartz LA, et al. P-wave morphology in focal atrial tachycardia: an updated algorithm to predict site of origin. Clin Electrophysiol. (2021) 7:1547–56. doi: 10.1016/j.jacep.2021.05.005
10. Auricchio A, Özkartal T, Salghetti F, Neumann L, Pezzuto S, Gharaviri A, et al. Short P-wave duration is a marker of higher rate of atrial fibrillation recurrences after pulmonary vein isolation: new insights into the pathophysiological mechanisms through computer simulations. J Am Heart Assoc. (2021) 10:e018572. doi: 10.1161/JAHA.120.018572
11. Platonov PG. P-wave morphology: underlying mechanisms and clinical implications. Ann Noninvasive Electrocardiol. (2012) 17:161–9. doi: 10.1111/j.1542-474X.2012.00534.x
12. Maheshwari A, Norby FL, Soliman EZ, Alonso A, Sotoodehnia N, Chen LY. Association of P-wave abnormalities with sudden cardiac and cardiovascular death: the ARIC study. Circ Arrhythm Electrophysiol. (2021) 14:e009314. doi: 10.1161/CIRCEP.120.009314
13. Sanchez-Quintana D, Cabrera J, Farre J, Climent V, Anderson R, Ho SY. Sinus node revisited in the era of electroanatomical mapping and catheter ablation. Heart. (2005) 91:189–94. doi: 10.1136/hrt.2003.031542
14. Chandler N, Aslanidi O, Buckley D, Inada S, Birchall S, Atkinson A, et al. Computer three-dimensional anatomical reconstruction of the human sinus node and a novel paranodal area. Anat Rec. (2011) 294:970–9. doi: 10.1002/ar.21379
15. Boineau J, Canavan TE, Schuessler R, Cain M, Corr P, Cox JL. Demonstration of a widely distributed atrial pacemaker complex in the human heart. Circulation. (1988) 77:1221–37. doi: 10.1161/01.CIR.77.6.1221
16. Schuessler RB, Boineau JP, Bromberg BI. Origin of the sinus impulse. J Cardiovasc Electrophysiol. (1996) 7:263–74. doi: 10.1111/j.1540-8167.1996.tb00524.x
17. Kotadia I, Whitaker J, Roney C, Niederer S, O'Neill M, Bishop M, et al. Anisotropic cardiac conduction. Arrhythm Electrophysiol Rev. (2020) 9:202. doi: 10.15420/aer.2020.04
18. Ho SY, Anderson RH, Sánchez-Quintana D. Atrial structure and fibres: morphologic bases of atrial conduction. Cardiovasc Res. (2002) 54:325–36. doi: 10.1016/S0008-6363(02)00226-2
19. Dobrzynski H, Anderson RH, Atkinson A, Borbas Z, D'Souza A, Fraser JF, et al. Structure, function and clinical relevance of the cardiac conduction system, including the atrioventricular ring and outflow tract tissues. Pharmacol Ther. (2013) 139:260–88. doi: 10.1016/j.pharmthera.2013.04.010
20. Kharbanda RK, van Schie MS, Ramdat Misier NL, Wesselius FJ, Zwijnenburg RD, van Leeuwen WJ, et al. In-vivo sino-atrial node mapping in children and adults with congenital heart disease. Front Pediatr. (2022) 10:896825. doi: 10.3389/fped.2022.896825
21. Cosio FG, Palacios J, Vidal JM, Cocina EG, Gómez-Sánchez MA, Tamargo L. Electrophysiologic studies in atrial fibrillation: slow conduction of premature impulses: a possible manifestation of the background for reentry. Am J Cardiol. (1983) 51:122–30. doi: 10.1016/S0002-9149(83)80022-8
22. Vergaro G, Aimo A, Rapezzi C, Castiglione V, Fabiani I, Pucci A, et al. Atrial amyloidosis: mechanisms and clinical manifestations. Eur J Heart Fail. (2022) 24:2019–28. doi: 10.1002/ejhf.2650
23. Stephenson RS, Atkinson A, Kottas P, Perde F, Jafarzadeh F, Bateman M, et al. High resolution 3-Dimensional imaging of the human cardiac conduction system from microanatomy to mathematical modeling. Sci Rep. (2017) 7:7188. doi: 10.1038/s41598-017-07694-8
24. Boonstra MJ, Brooks DH, Loh P, van Dam PM. CineECG: a novel method to image the average activation sequence in the heart from the 12-lead ECG. Comput Biol Med. (2022) 141:105128. doi: 10.1016/j.compbiomed.2021.105128
25. Locati ET, Pappone C, Heilbron F, van Dam PM. CineECG provides a novel anatomical view on the normal atrial P-wave. Eur Heart J Digit Health. (2022) 3:169–80. doi: 10.1093/ehjdh/ztac007
26. Baturova M, Van Dam P, Johnson L, Smith G, Platonov P. Usefulness of CineECG method in identification of P-wave morphology variants in an elderly epidemiologic cohort. Eur Heart J. (2023) 44(Supplement_2):ehad655-2913. doi: 10.1093/eurheartj/ehad655.2913
27. Wagner P, Strodthoff N, Bousseljot R-D, Kreiseler D, Lunze FI, Samek W, et al. PTB-XL, a large publicly available electrocardiography dataset. Sci Data. (2020) 7:154. doi: 10.1038/s41597-020-0495-6
28. van Dam PM, Oostendorp TF, van Oosterom A. Application of the fastest route algorithm in the interactive simulation of the effect of local ischemia on the ECG. Med Biol Eng Comput. (2009) 47:11–20. doi: 10.1007/s11517-008-0391-2
29. Van Dam PM, Oostendorp TF, Linnenbank AC, Van Oosterom A. Non-invasive imaging of cardiac activation and recovery. Ann Biomed Eng. (2009) 37:1739–56. doi: 10.1007/s10439-009-9747-5
30. Sathananthan G, Zahid S, Aggarwal G, Chik W, Friedman D, Thiagalingam A. Cardiac orientation: is there a correlation between the anatomical and the electrical axis of the heart. Br J Cardiol. (2015) 22. doi: 10.5837/bjc.2015.016
31. Biering-Sørensen T, Kabir M, Waks JW, Thomas J, Post WS, Soliman EZ, et al. Global ECG measures and cardiac structure and function: the ARIC study (Atherosclerosis Risk in Communities). Circ Arrhythm Electrophysiol. (2018) 11:e005961. doi: 10.1161/CIRCEP.117.005961
32. Silvetti E, Lanza O, Romeo F, Martino A, Fedele E, Lanzillo C, et al. The pivotal role of ECG in cardiomyopathies. Front Cardiovasc Med. (2023) 10:1178163. doi: 10.3389/fcvm.2023.1178163
33. Aliot EM, Stevenson WG, Almendral-Garrote JM, Bogun F, Calkins CH, Delacretaz E, et al. EHRA/HRS expert consensus on catheter ablation of ventricular arrhythmias: developed in a partnership with the European Heart Rhythm Association (EHRA), a registered branch of the European Society of Cardiology (ESC), and the Heart Rhythm Society (HRS); in collaboration with the American College of Cardiology (ACC) and the American Heart Association (AHA). Europace. (2009) 11:771–817. doi: 10.1093/europace/eup098
34. Boonstra MJ, Oostendorp TF, Roudijk RW, Kloosterman M, Asselbergs FW, Loh P, et al. Incorporating structural abnormalities in equivalent dipole layer based ECG simulations. Front Physiol. (2022) 13:1089343. doi: 10.3389/fphys.2022.1089343
35. Hmoud M, Swaity H, Karram O, Shibli H, Swaity S, Daher W. High school students' engagement in biology in the context of XR technology. IEEE Access. (2023) 11:137053–66. doi: 10.1109/ACCESS.2023.3338176
36. Fortman J, Quintana R. Fostering collaborative and embodied learning with extended reality: special issue introduction. Int J Comput Support Collab Learn. (2023) 18:145–52. doi: 10.1007/s11412-023-09404-1
37. Rudnicka Z, Proniewska K, Perkins M, Pregowska A. Cardiac healthcare digital twins supported by artificial intelligence-based algorithms and extended reality–a systematic review. Electronics. (2024) 13:866. doi: 10.3390/electronics13050866
Keywords: mixed reality, CineECG, micro-CT, P wave, ECG imaging
Citation: Potyagaylo D, van Dam PM, Kuniewicz M, Dolega-Dolegowski D, Pregowska A, Atkinson A, Dobrzynski H and Proniewska K (2024) Interactive teaching of medical 3D cardiac anatomy: atrial anatomy enhanced by ECG and 3D visualization. Front. Med. 11:1422017. doi: 10.3389/fmed.2024.1422017
Received: 23 April 2024; Accepted: 19 June 2024;
Published: 04 July 2024.
Edited by:
Rüdiger Christoph Pryss, Julius Maximilian University of Würzburg, GermanyReviewed by:
Vladyslav Sikora, University of Foggia, ItalyXuejing Sun, University of Pittsburgh, United States
Copyright © 2024 Potyagaylo, van Dam, Kuniewicz, Dolega-Dolegowski, Pregowska, Atkinson, Dobrzynski and Proniewska. This is an open-access article distributed under the terms of the Creative Commons Attribution License (CC BY). The use, distribution or reproduction in other forums is permitted, provided the original author(s) and the copyright owner(s) are credited and that the original publication in this journal is cited, in accordance with accepted academic practice. No use, distribution or reproduction is permitted which does not comply with these terms.
*Correspondence: Danila Potyagaylo, ZGFuaWxhLnBvdHlhZ2F5bG9AdWouZWR1LnBs