- 1Clinical Laboratory, Chongqing University Central Hospital, School of Medicine, Chongqing University, Chongqing, China
- 2Chongqing Key Laboratory of Emergency Medicine, Chongqing Emergency Medical Center, Chongqing, China
- 3Department of Blood Transfusion, Chongqing University Central Hospital, School of Medicine, Chongqing University, Chongqing, China
- 4Intensive Care Unit, Chongqing University Central Hospital, School of Medicine, Chongqing University, Chongqing, China
Introduction: Sepsis poses a serious threat to individual life and health. Early and accessible diagnosis and targeted treatment are crucial. This study aims to explore the relationship between microbes, metabolic pathways, and blood test indicators in sepsis patients and develop a machine learning model for clinical diagnosis.
Methods: Blood samples from sepsis patients were sequenced. α-diversity and β-diversity analyses were performed to compare the microbial diversity between the sepsis group and the normal group. Correlation analysis was conducted on microbes, metabolic pathways, and blood test indicators. In addition, a model was developed based on medical records and radiomic features using machine learning algorithms.
Results: The results of α-diversity and β-diversity analyses showed that the microbial diversity of sepsis group was significantly higher than that of normal group (p < 0.05). The top 10 microbial abundances in the sepsis and normal groups were Vitis vinifera, Mycobacterium canettii, Solanum pennellii, Ralstonia insidiosa, Ananas comosus, Moraxella osloensis, Escherichia coli, Staphylococcus hominis, Camelina sativa, and Cutibacterium acnes. The enriched metabolic pathways mainly included Protein families: genetic information processing, Translation, Protein families: signaling and cellular processes, and Unclassified: genetic information processing. The correlation analysis revealed a significant positive correlation (p < 0.05) between IL-6 and Membrane transport. Metabolism of other amino acids showed a significant positive correlation (p < 0.05) with Cutibacterium acnes, Ralstonia insidiosa, Moraxella osloensis, and Staphylococcus hominis. Ananas comosus showed a significant positive correlation (p < 0.05) with Poorly characterized and Unclassified: metabolism. Blood test-related indicators showed a significant negative correlation (p < 0.05) with microorganisms. Logistic regression (LR) was used as the optimal model in six machine learning models based on medical records and radiomic features. The nomogram, calibration curves, and AUC values demonstrated that LR performed best for prediction.
Discussion: This study provides insights into the relationship between microbes, metabolic pathways, and blood test indicators in sepsis. The developed machine learning model shows potential for aiding in clinical diagnosis. However, further research is needed to validate and improve the model.
1 Introduction
Sepsis is a severe organ dysfunction endangering life, resulting from impaired host function triggered by infection (1, 2). Epidemiological survey data show (3) that sepsis is characterized by a high incidence and mortality, and its incidence has been increasing in recent years. Each year, sepsis impacts over 30 million individuals globally and leads to around 6 million deaths (4). According to domestic statistics, around 20.6% of ICU patients experience sepsis, the 90-day overall mortality is 35.5%, and the rate is as high as 51.94% combined with septic shock (5). Sepsis is a serious threat to physical health.
Sepsis has a variety of clinical manifestations, including fever, increased heart rate, shortness of breath, hypotension, changes in consciousness, etc. (6). Additionally, patients may experience systemic multiple organ dysfunction such as pneumonia, acute respiratory distress syndrome (ARDS), renal impairment, and cardiac insufficiency. Severe sepsis can lead to shock and even death. Therefore, an early diagnosis is particularly important for the treatment of sepsis. It is diagnosed based on the evidence of infection and manifestations of systemic inflammation (7). Currently, the diagnosis of sepsis is mainly based on blood culture (8), and white blood cell (WBC) count, classification, C-reactive protein (CRP), and procalcitonin precursor (PCT) are determined for auxiliary diagnosis (9).
With the advancement of big data analysis, genomics research, and biomarker research, the pathogenesis of sepsis will be further clarified (10), which will facilitate molecular biology-oriented diagnosis of sepsis, improve the sensitivity and specificity of diagnosis, and formulate more appropriate diagnostic criteria to reflect the infection and uncontrolled response of the body, thereby further contributing to the early identification and diagnosis of sepsis. It can also reflect the characteristics of dynamic changes in the disease, provide conditions for accurate treatment of sepsis, and improve patient survival. This project aimed to obtain a comprehensive bacterial infectious sepsis-specific pathogenic microorganism through comparative research and whole genome sequencing technology on the metagenomic next-generation sequencing (mNGS) platform, and to establish a prediction model of sepsis integrating radiomics and machine learning algorithms, hoping to provide an implication for its clinical diagnosis.
2 Materials and methods
2.1 Data analysis
Metagenomic sequencing was performed on 25 patients with sepsis, and nine samples from the normal group were used for metagenomic sequencing. After the raw data were exported, low-quality reads were filtered out and the obtained valid data were used for subsequent analyses. The host sequences were first removed, and sequence alignment was used to infer the species composition and relative abundance of the microbial community, followed by plotting of the species abundance profile. The function, consanguinity, and metabolic pathways of each gene were determined by comparing and annotating the genes to a known database. Through integration and statistical analyses of the annotated results, functional modules and metabolic pathways involved in the microbial community were identified, and their roles in the ecosystem were explored.
2.2 Radiomics analysis
The region of interest (ROI)/volume of interest (VOI) usually refers to a lesion that was manually segmented using 3D Slicer v5.1.0. Quantitative features were extracted from the digital images, which were stored in a shared database. The data were mined, and hypotheses were generated or validated. A plugin of the 3D Slicer v5.1.0 software PyRadiomics was used to perform radiomic feature extraction from each ROI. The plugin automatically extracted 851 radioactive features from each ROI. It includes first-order statistical features (energy, entropy, mean, standard deviation, maximum, etc.), shape-and size-based features (maximum 3D diameter, volume, superficial area, etc.), texture features (grayscale co-occurrence matrix GLCM and grayscale run matrix GLRLM), and wavelet-based transform features.
2.3 Construction of a machine learning model
In the training set, the selection was made by 10-fold cross-validation and grid search 10 times, and six classification algorithms (LR: logistic regression; RF: random forest; adaboost: adaptive enhancement; SVM: support vector machine; NB: naive Bayes; GBDT: gradient enhancement decision tree) of the corresponding cohort were obtained. The six classification algorithms completed by the training were called to train the data and build the model, and the prediction results of the different models were obtained. The average value of the multiple accuracies was used as the final model score, and the final model was generated simultaneously. A receiver operating characteristic (ROC) curve was plotted for each training model and test result, and the area under the curve (AUC), accuracy, sensitivity, recall rate, and specificity were calculated.
2.4 Statistical analysis
Statistical analyses were performed using R software (V4.2.2). The measured data were tested for homogeneity and normality of variance. For measurement data following a normal distribution, the mean ± standard deviation was utilized, with t-tests employed for inter-group comparisons. Count data were presented as percentages, and differences between groups were assessed using χ2 tests, with significance set at p < 0.05. Correlation analysis of microorganisms, metabolic pathways, and blood test-related indicators was performed using the Spearman’s correlation coefficient. Based on R software (version 4.0.3) and R studio platform, Lasso feature dimensionality reduction, logistic regression model construction, ROC curve plotting, calibration curve plotting, nomographic chart and clinical decision analysis curve were performed using the corresponding software package.
3 Results
3.1 Microbiome composition analysis
The α-diversity analysis showed that ACE, Chao1, Shannon, and Simpson indices of sepsis patients were significantly higher than those of normal group (p < 0.05), indicating that the microbial abundance and diversity of sepsis patients were elevated (Figure 1A). The β-diversity results showed small sample differences between the two groups (Figure 1B). Based on the species annotation results, the top 20 species in terms of abundance were selected at the species level for each sample in the sepsis and normal groups to plot the relative abundance histogram (Figure 2A). The top 10 microbial genera in both groups included Vitis vinifera, Mycobacterium canettii, Solanum pennellii, Ralstonia insidiosa, Ananas comosus, Moraxella osloensis, Escherichia coli, Staphylococcus hominis, Camelina sativa, and Cutibacterium acnes. The enriched metabolic pathways were mainly protein families: genetic information processing, translation, protein families: signaling and cellular processes, and unclassified: genetic information processing (Figure 2B).
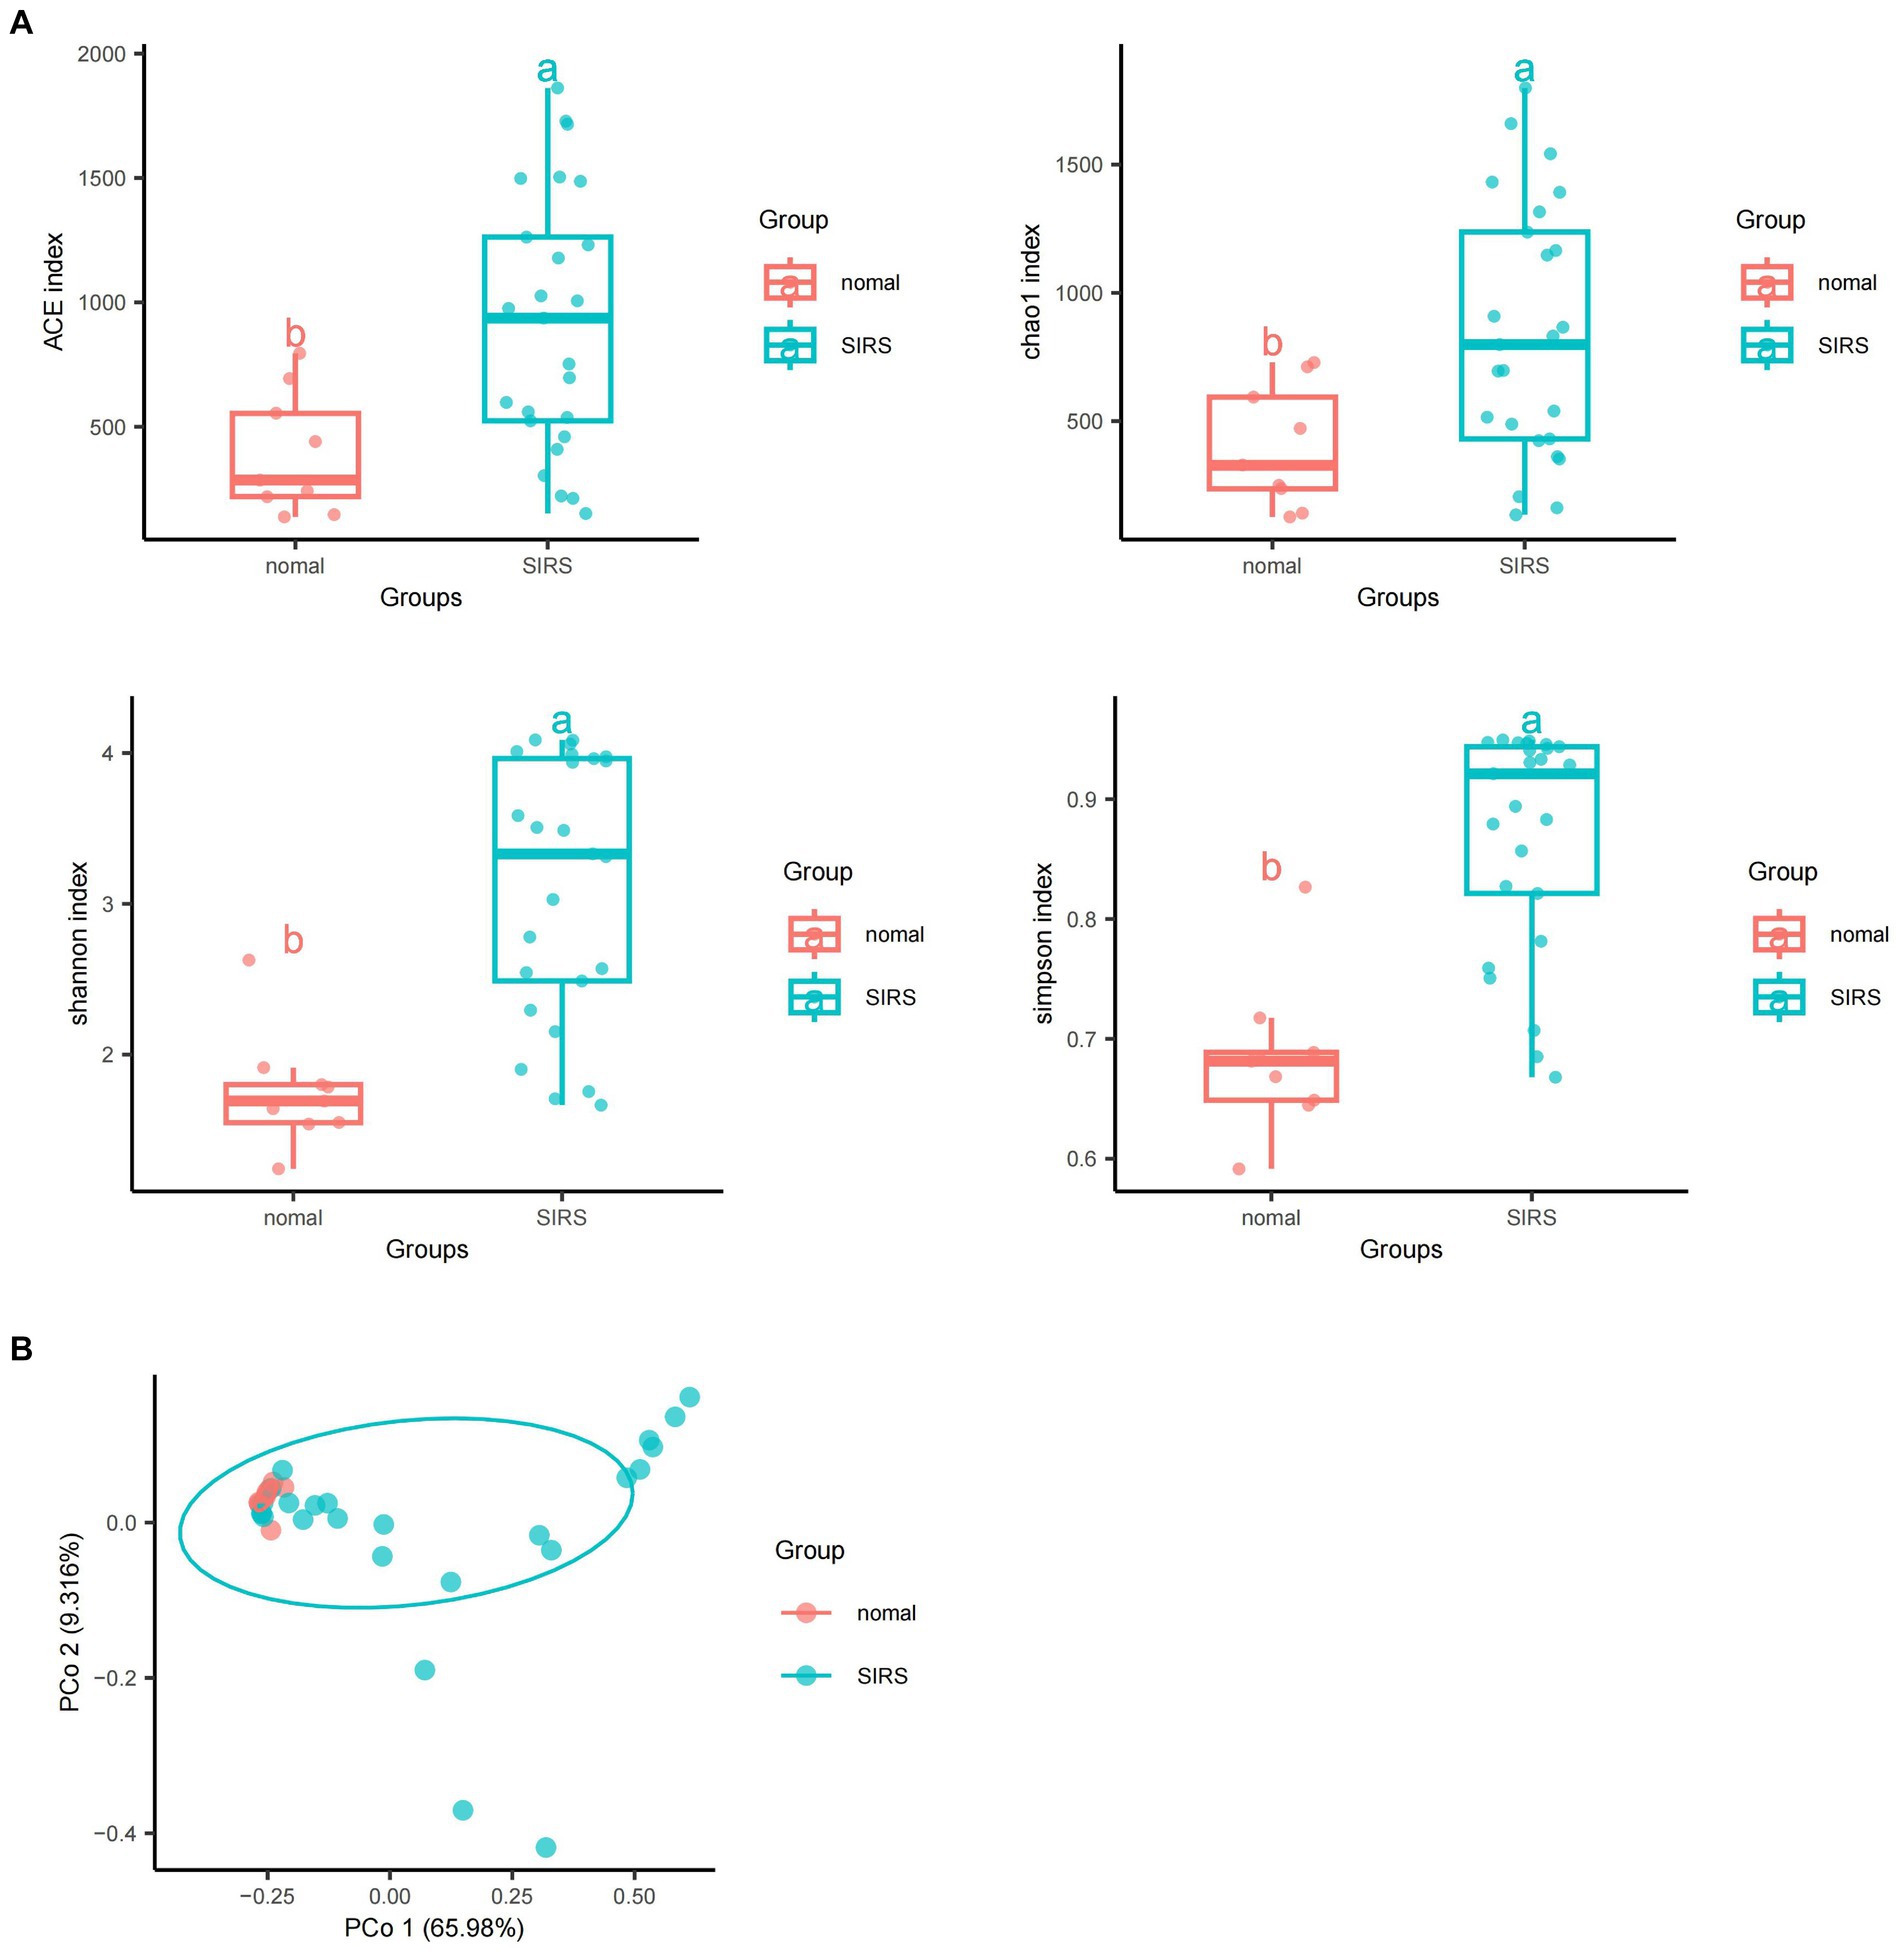
Figure 1. Diversity and abundance analyses of pathogenic microorganisms. (A) α-diversity analyses showed that ACE, Chao1, Shannon, and Simpson indices of sepsis patients were significantly higher than those of normal group (p < 0.05). (B) β-diversity analyses showed that the sample difference between the two groups was small.
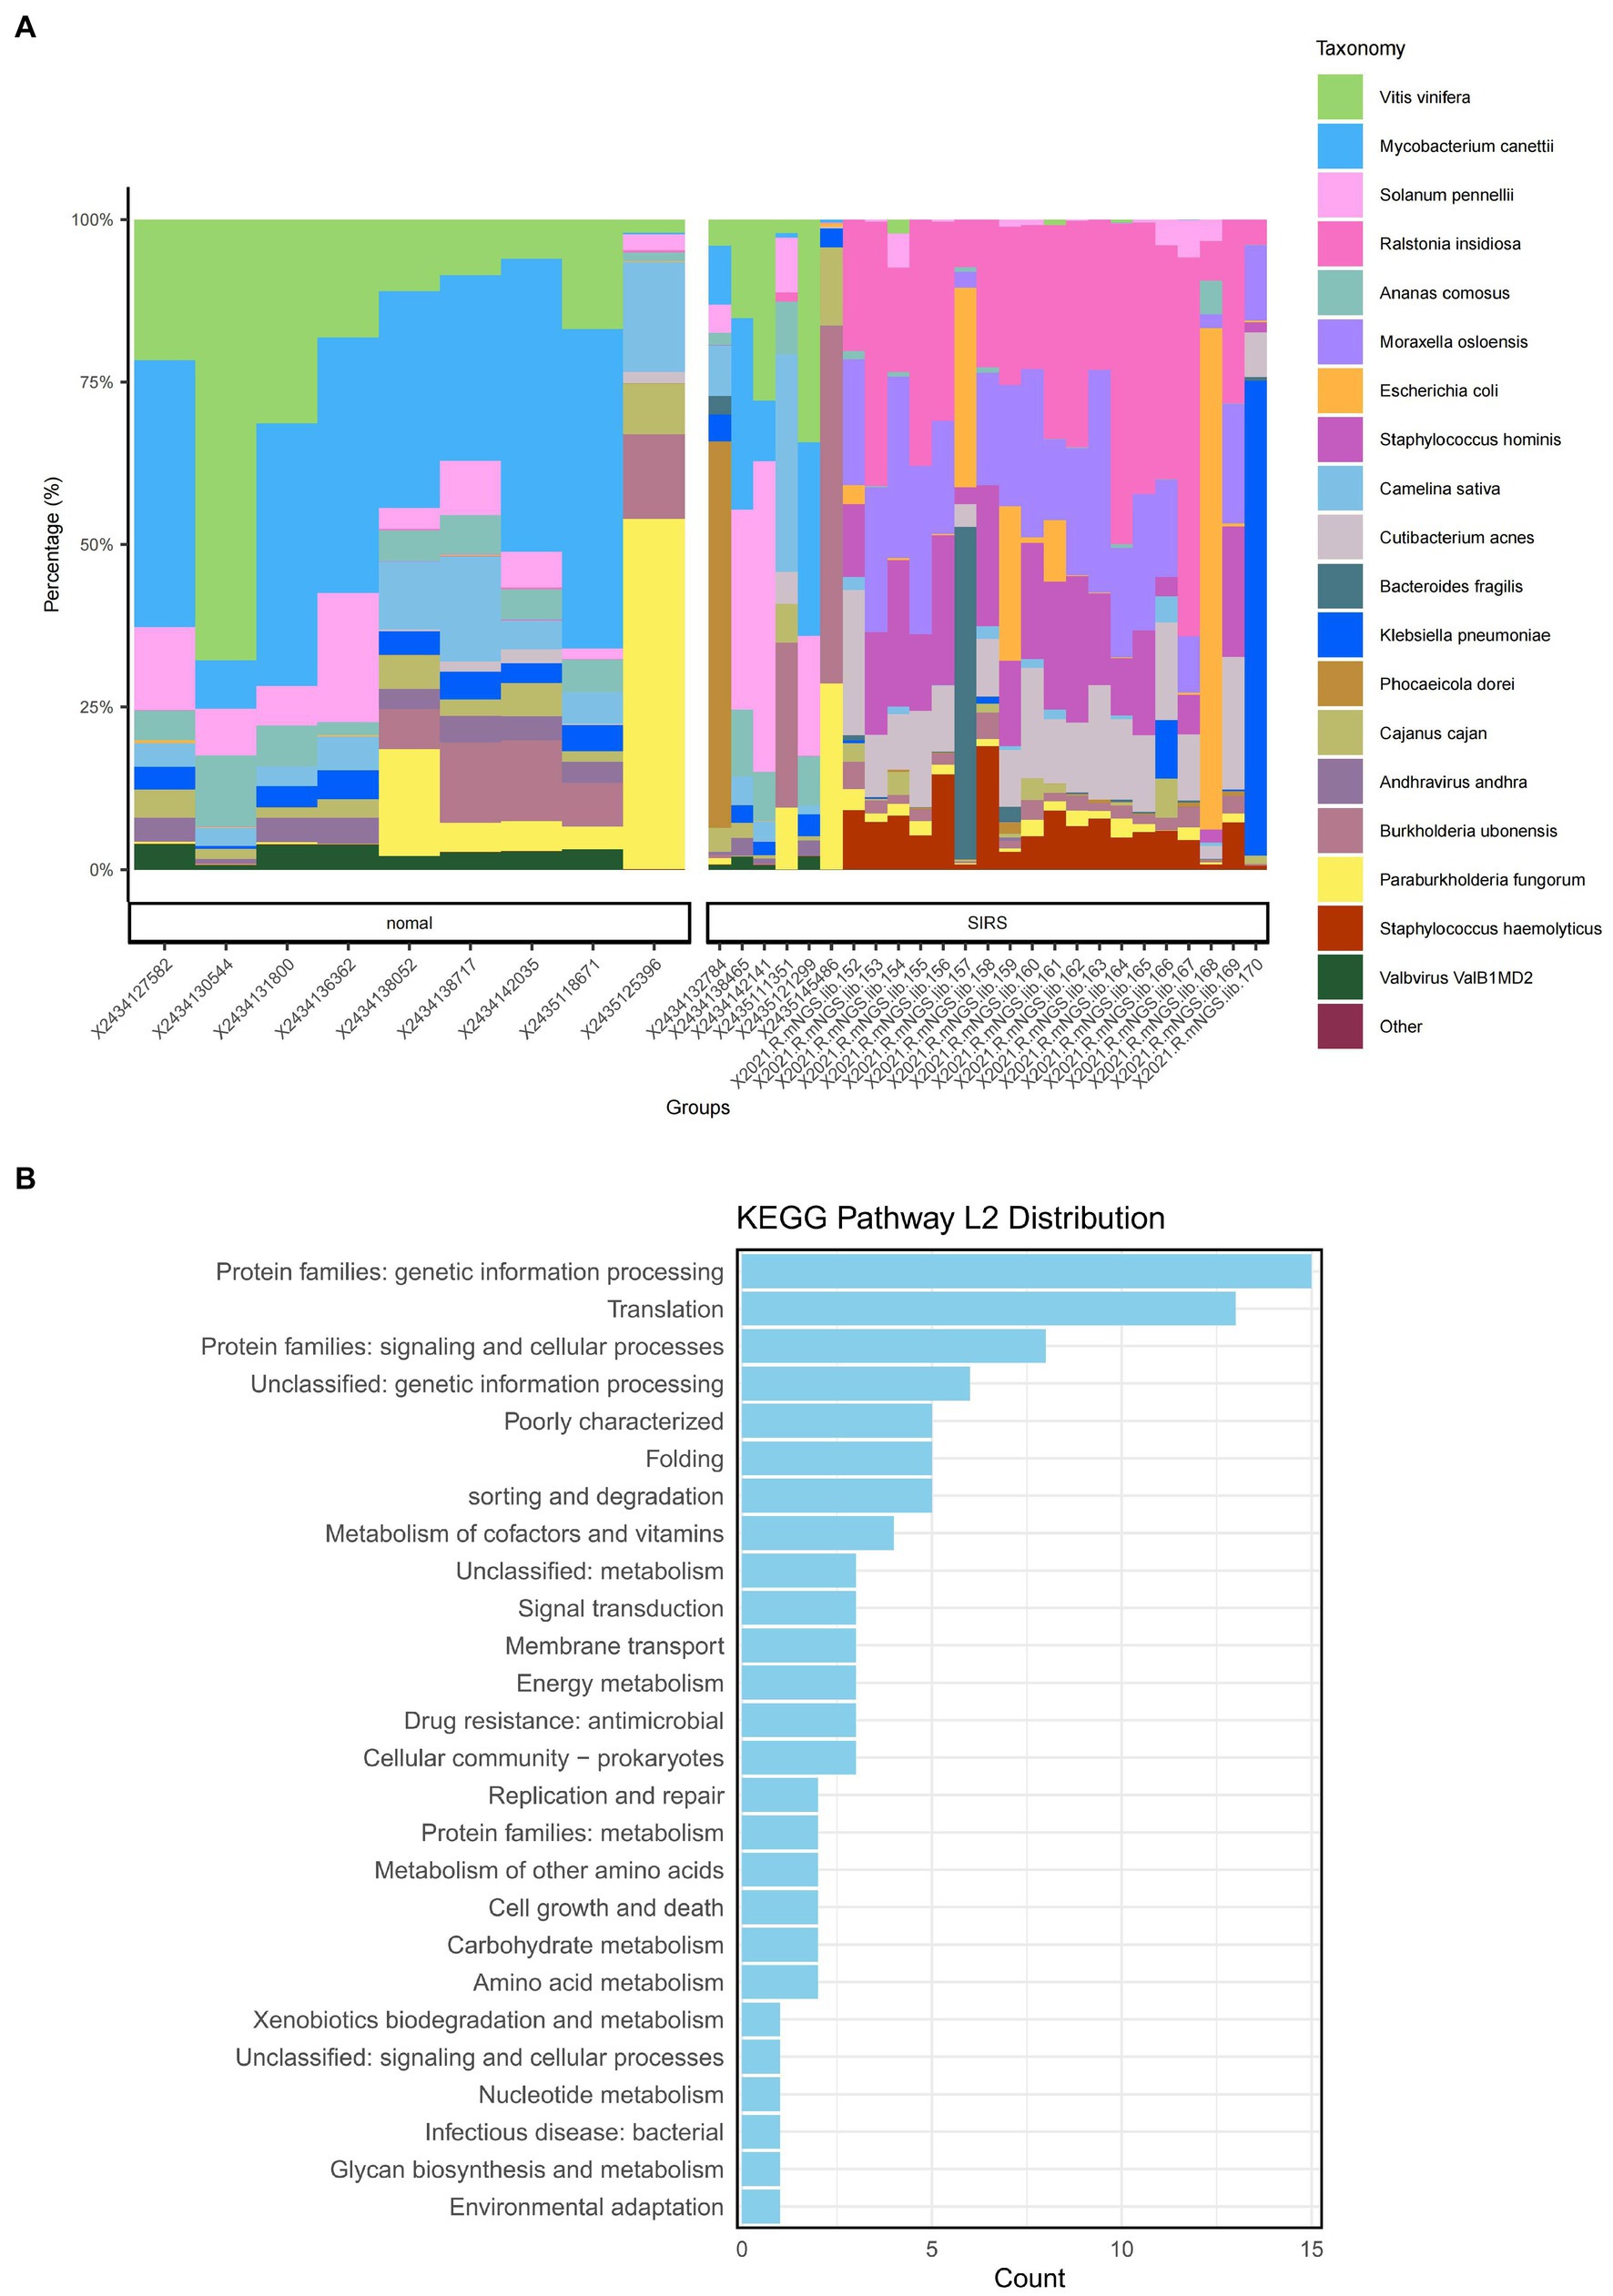
Figure 2. Species annotation results and KEGG metabolic pathway enrichment. (A) Bar chart of the relevant abundance of the top 20 species in the sepsis and normal groups. (B) Enriched metabolic pathways.
3.2 Correlation analysis
The analyses revealed (Figures 3A–C) a correlation between metabolic pathways, blood detection indicators, and pathogenic microorganisms, with a significant positive correlation (p < 0.05) between IL-6 and membrane transport. Metabolism of other amino acids showed a significant positive correlation (p < 0.05) with Cutibacterium acnes, Ralstonia insidiosa, Moraxella osloensis, and Staphylococcus hominis. Ananas comosus showed a significant positive correlation (p < 0.05) with poorly characterized and unclassified: metabolism. Escherichia coli showed a significant positive correlation (p < 0.05) with protein families: signaling and cellular processes, amino acid metabolism, and carbohydrate metabolism. WBC showed a significant positive correlation (p < 0.05) with Ralstonia insidiosa, and Staphylococcus hominis. Camelina sativa showed a significant negative correlation (p < 0.05) with NEU%, CRP, WBC, and NEU. Solanum pennelli showed a significant negative correlation (p < 0.05) with NEU%, CRP, PCT, WBC, and NEU. Ananas comosus showed a significant negative correlation (p < 0.05) with NEU%, CRP, SAA, PCT, WBC, and NEU. Vitis vinifera showed a significant negative correlation (p < 0.05) with NEU%, PCT, WBC, and NEU. Mycobacterium canettii showed a significant negative correlation (p < 0.05) with CRP, PCT, and WBC.
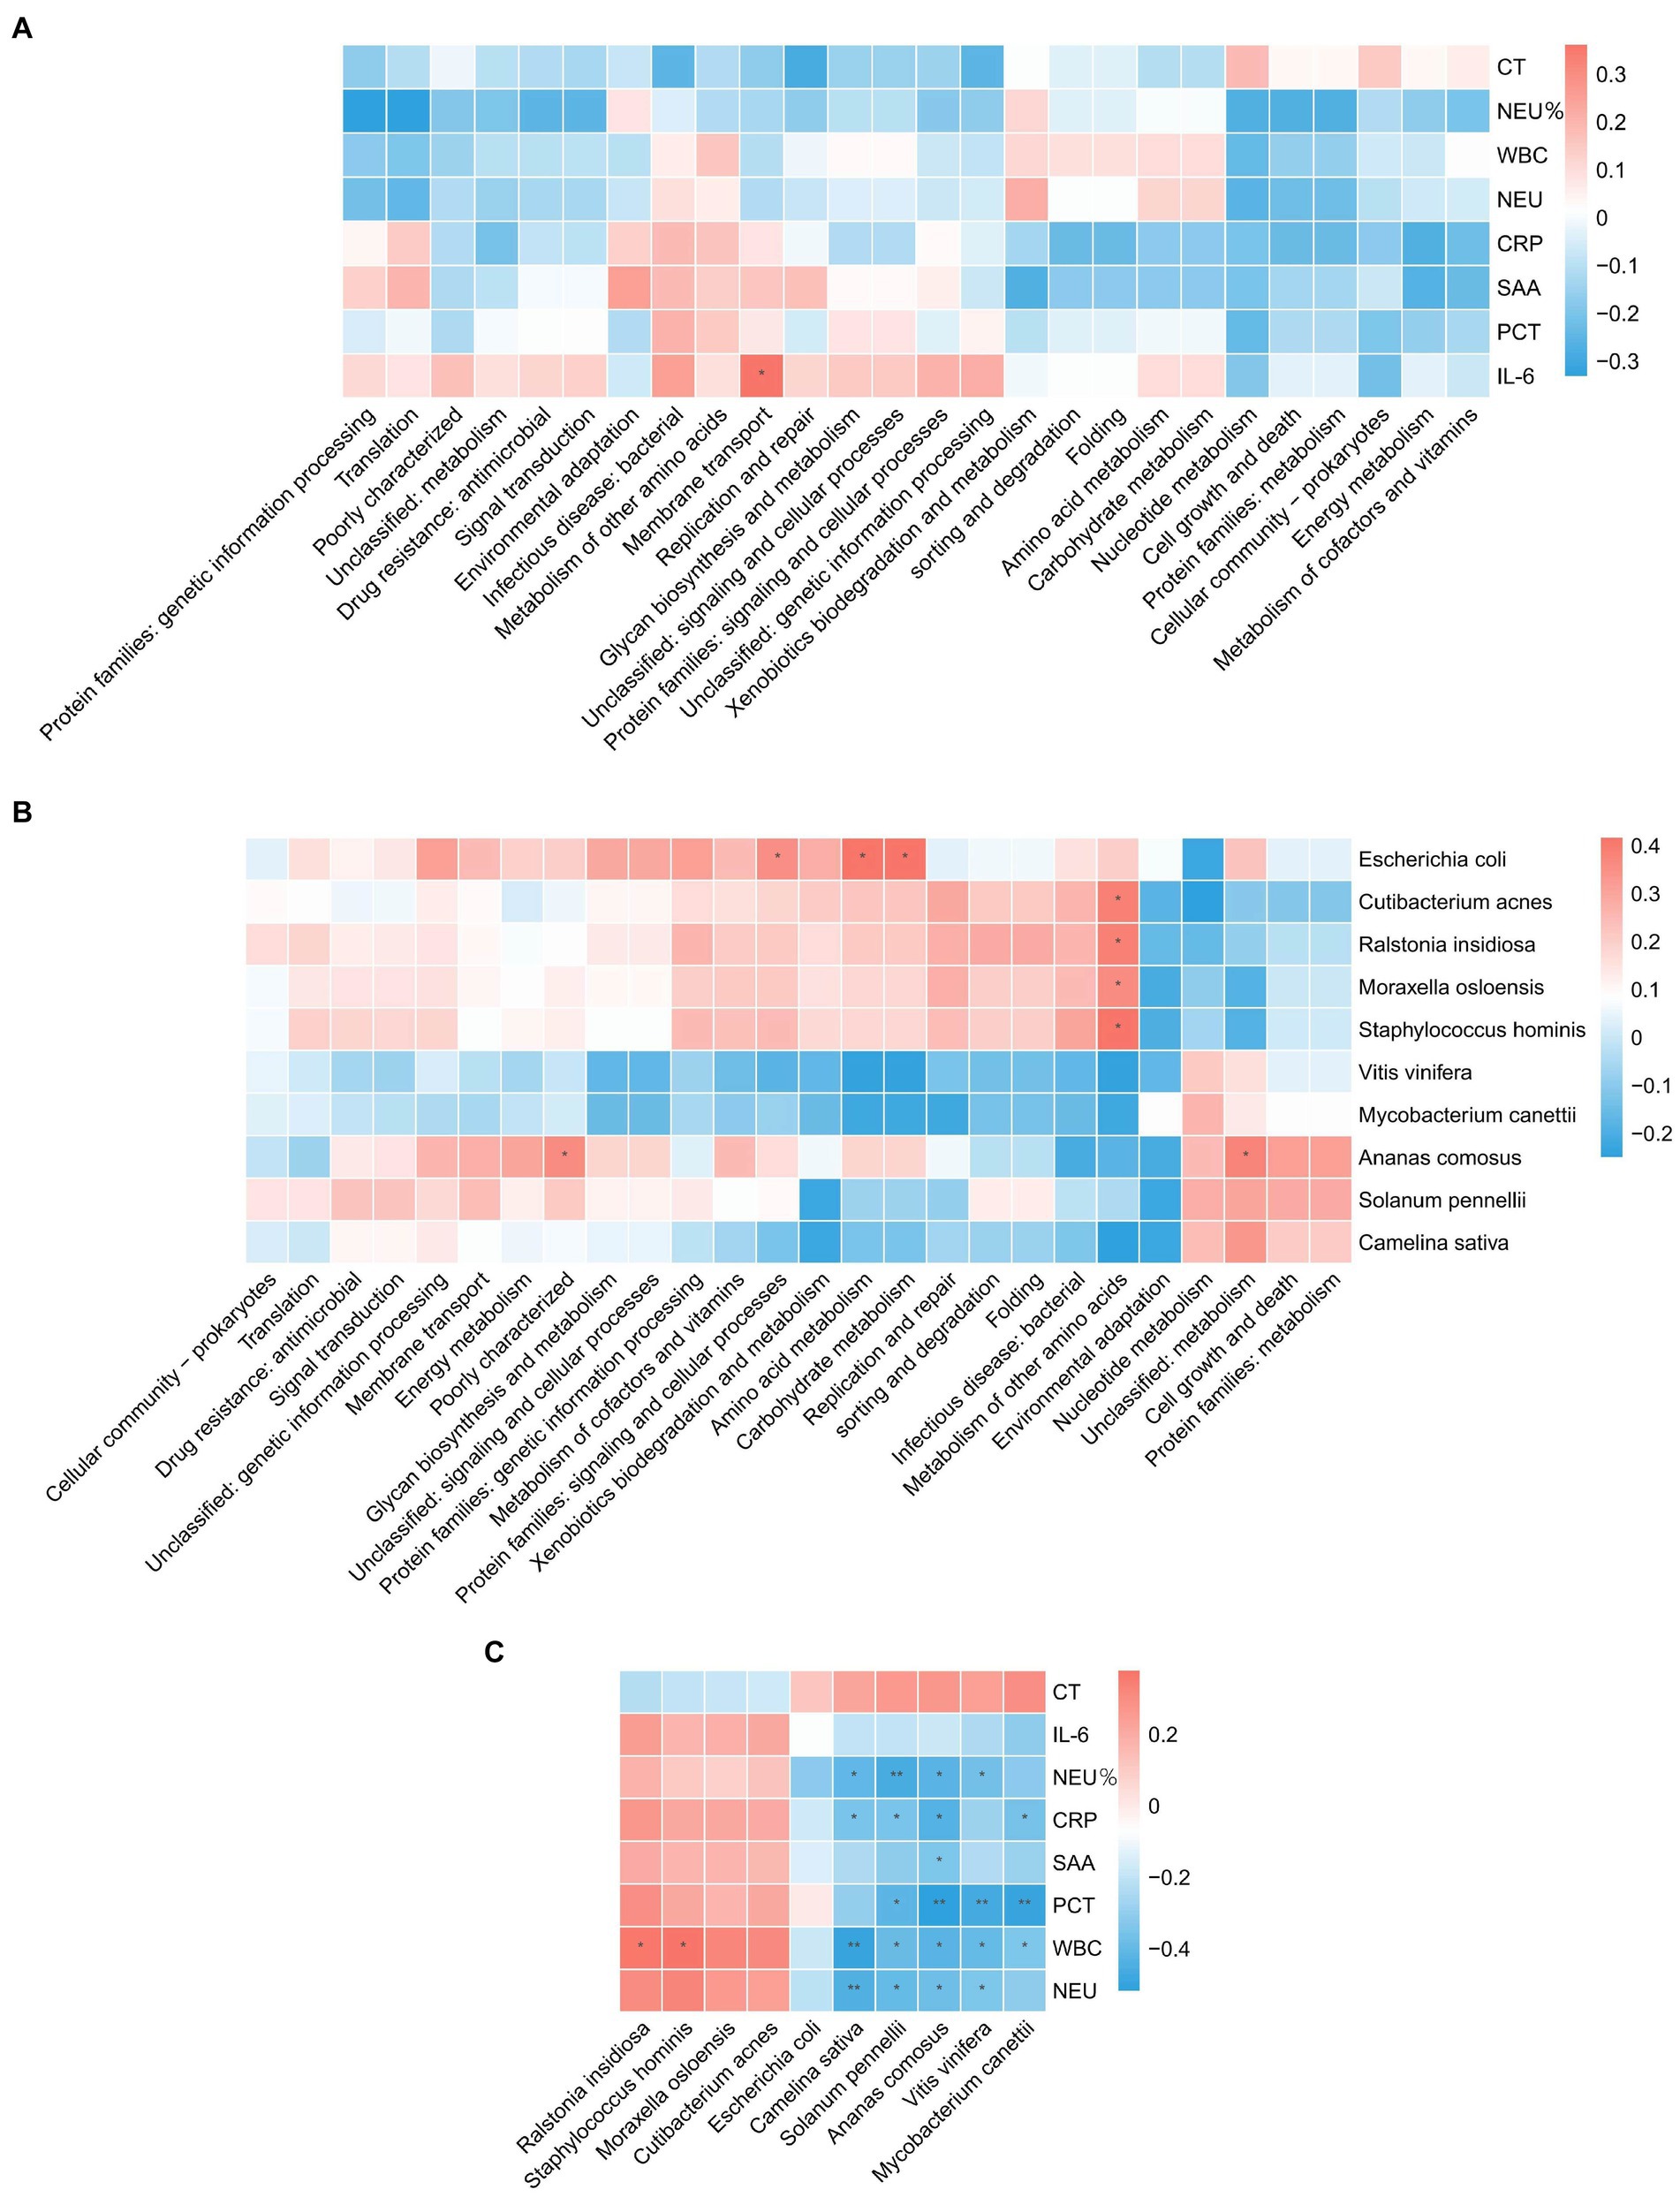
Figure 3. Correlation analysis. (A) Correlation between blood test indicators and metabolic pathways. (B) Correlation of pathogenic microorganisms and metabolic pathways. (C) Correlation between blood test indicators and pathogenic microorganisms.
3.3 Construction of a machine learning model
Based on radiomics, five important image features were finally screened using LASSO-Cox regression and 10-fold cross validation including original-shape-sphericity, original-firstorder-10Percentile, wavelet-HHL-glcm-InverseVariance, wavelet-HHH-glszm-ZoneEntropy, and wavelet-LLL-gldm-LargeDependenceLowGrayLevelEmphasis (Figure 4A). Utilizing the previously outlined features, model performance was assessed through the ROC curve, revealing an AUC = 0.791 for the model’s ROC curve (Figure 4B). Significant features were extracted from the medical records using LASSO, including occupancy, inflammation, blood lipids, prognosis, advention, and discharge (Figure 5A). Drawing from the characteristics outlined earlier, the model’s performance was analyzed via the ROC curve, indicating an AUC = 0.873 for the model’s ROC curve (Figure 5B).
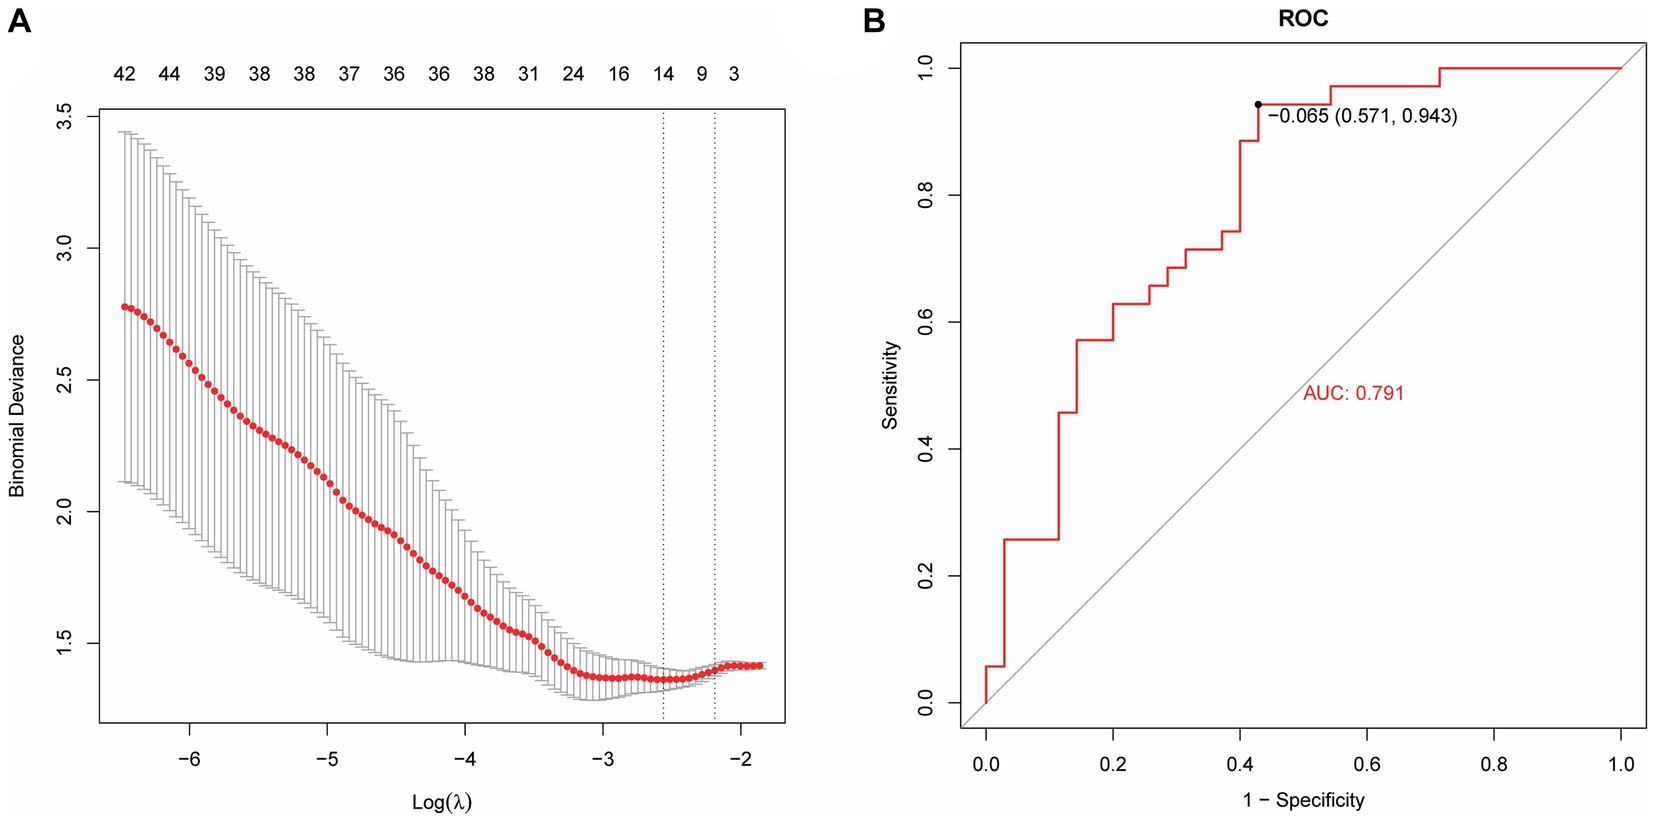
Figure 4. Machine learning model establishment based on radiomics. (A) Five important image features screened using LASSO-Cox regression and 10-fold cross validation. (B) The AUC value of the model ROC curve is 0.791.
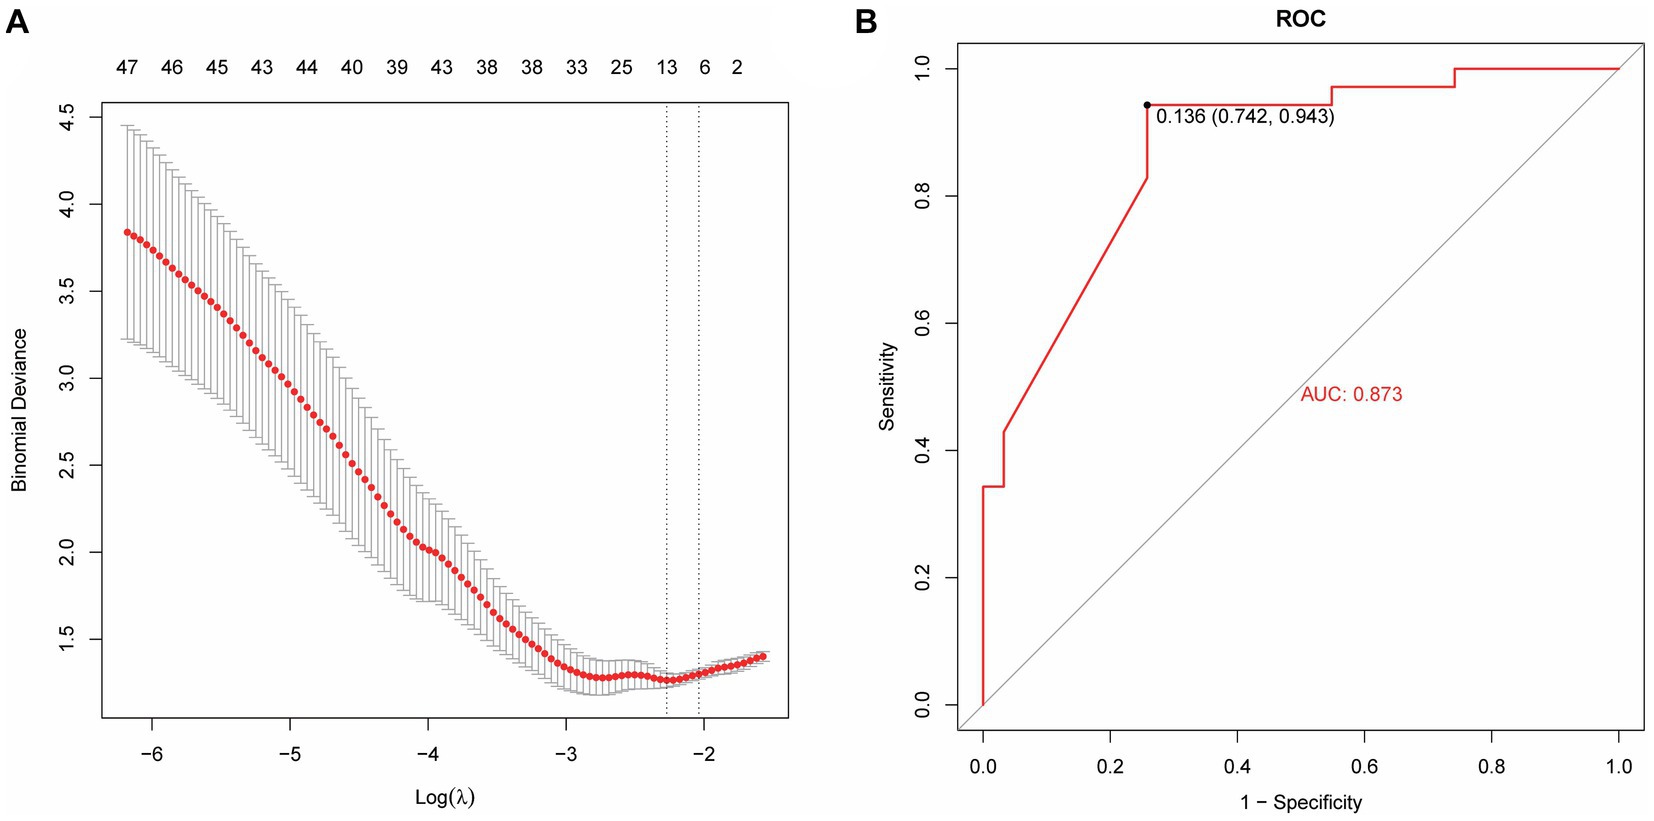
Figure 5. A machine learning model based on medical record data. (A) Lasso extraction of seven features from the medical records. (B) The AUC value of the model ROC curve is 0.873.
The model performance was evaluated and compared using the following seven metrics: AUC, sensitivity, specificity, accuracy, precision, recall (F1), and prAUC. In comparison, among all the machine learning models, the LR model performed the best in classification (AUC value was 0.897 in the training set), and the sensitivity, specificity, accuracy, precision, F1, and prAUC values were also the highest in the LR model (Table 1); therefore, the optimal model was LR. We visualized the LR model and plotted the nomogram for easy clinical application (Figure 6). A calibration curve was utilized to assess the model’s performance, and it can be seen that the error between the predicted values and the real values of the prediction model was small, and the result was highly accurate. The AUC = 0.879 for the model’s ROC curve, demonstrating that LR had the best predictive power (Figure 7).
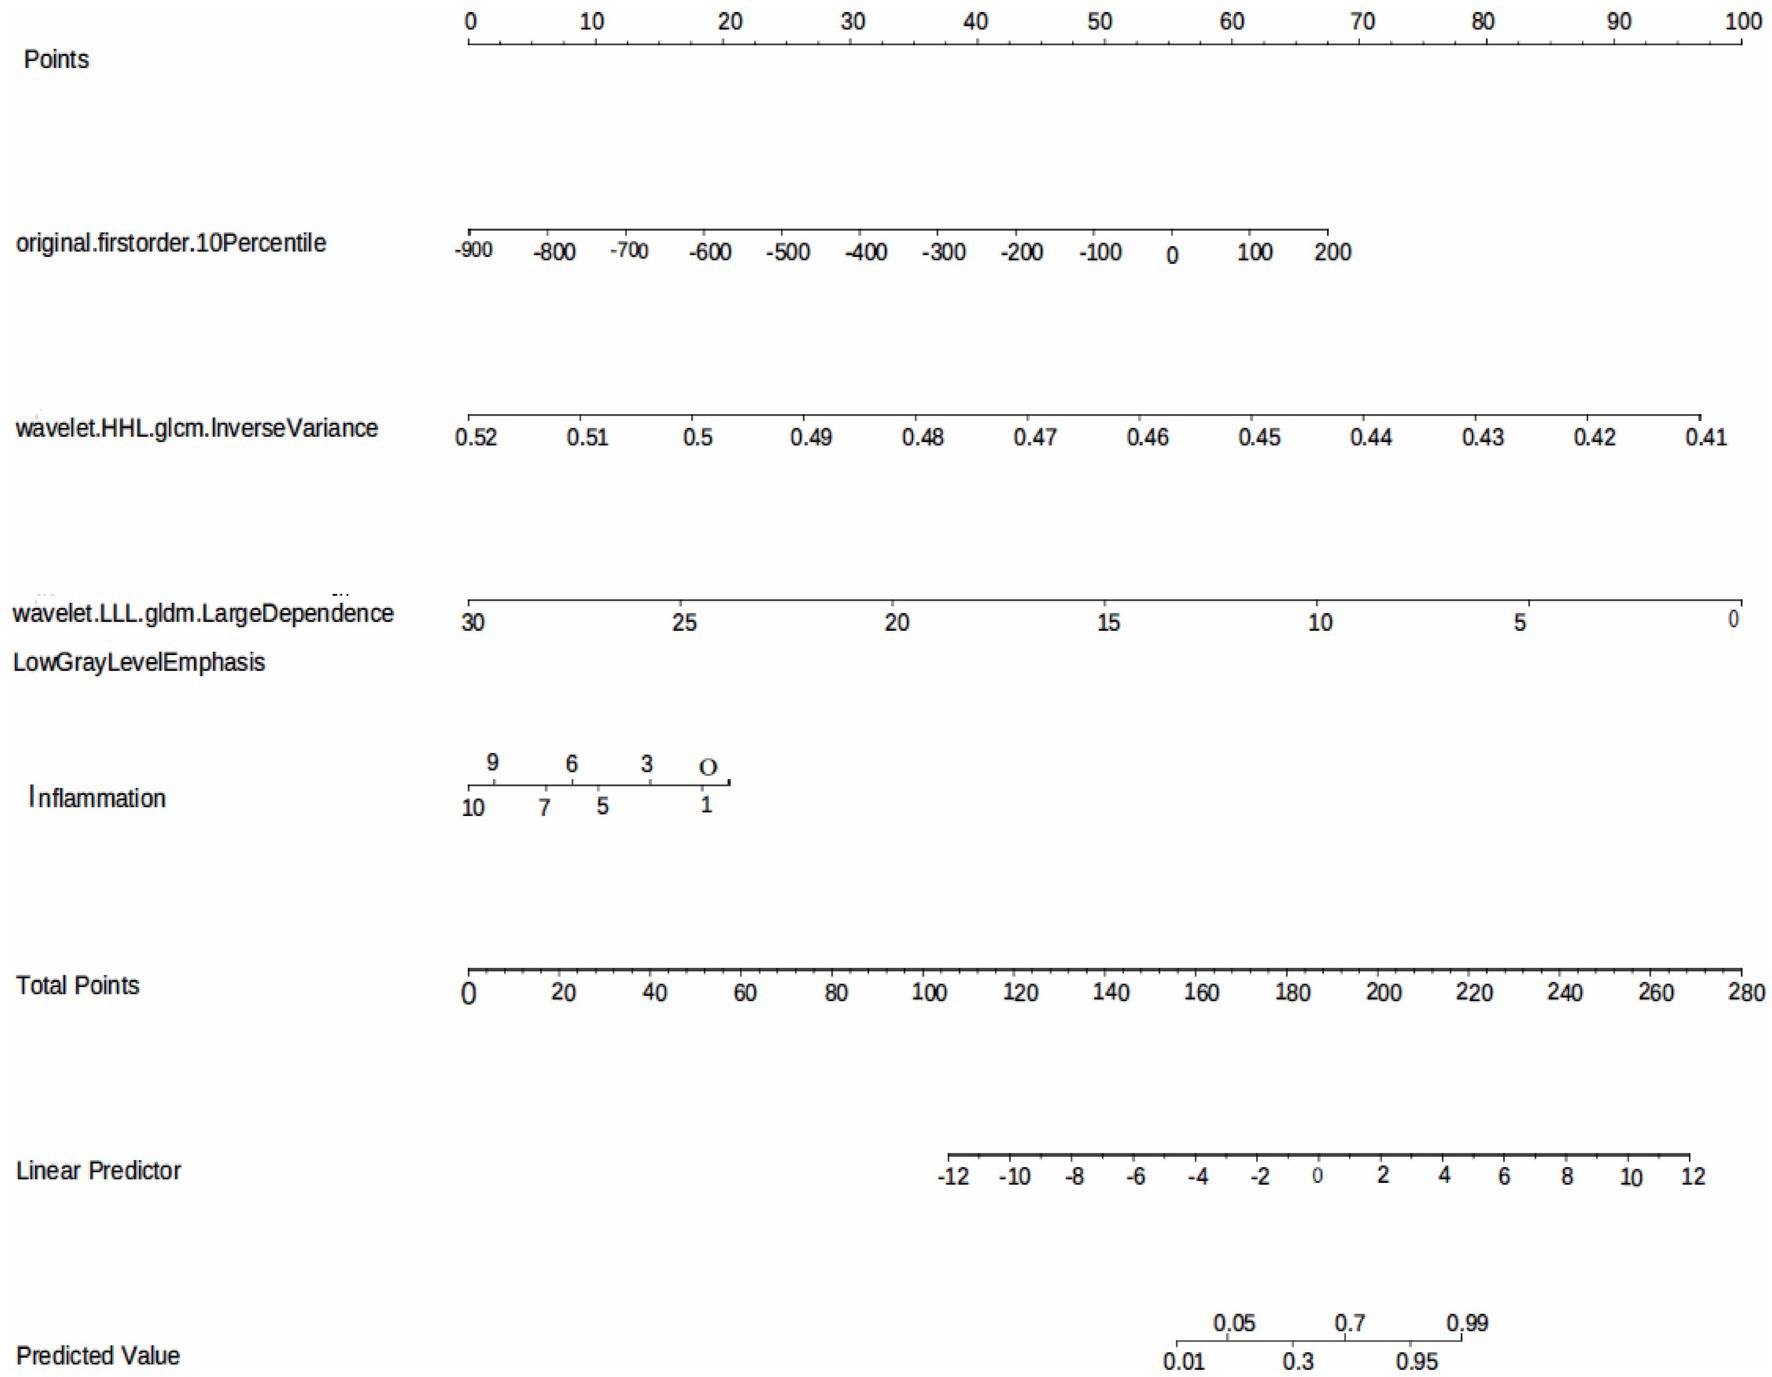
Figure 6. The LR model based on the features extracted from medical records and radiomics is visualized using nomogram.
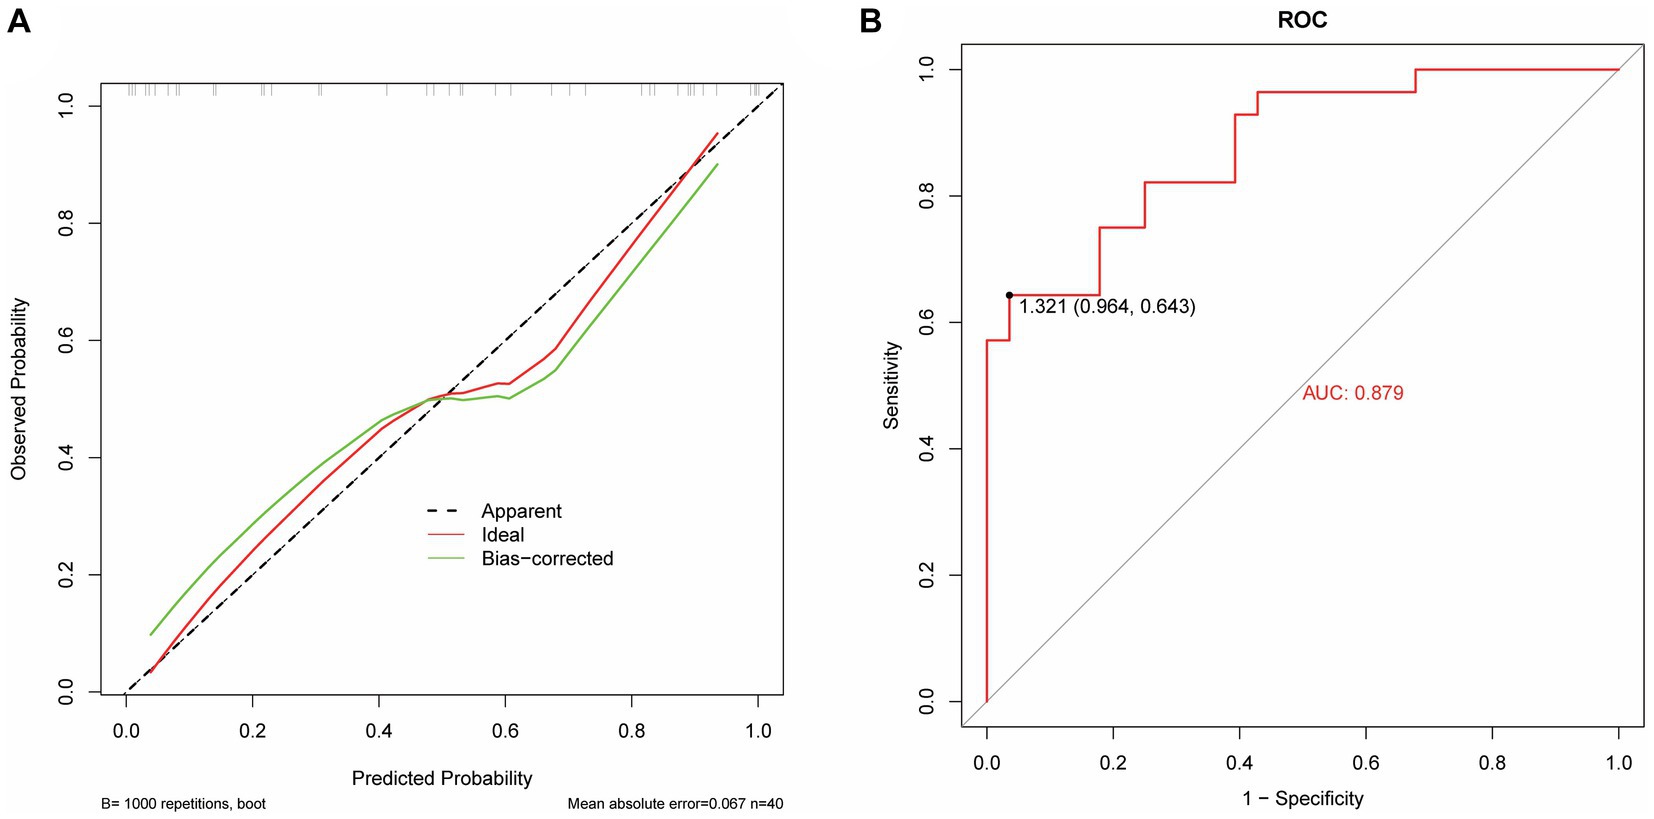
Figure 7. Performance evaluation of the LR model. (A) The calibrate calibration curves. (B) The ROC curve.
4 Discussion
Sepsis is a serious infectious disease, and its pathogenesis involves multiple factors such as the immune system, inflammatory mediators, and vascular endothelium. The clinical manifestations of sepsis are diverse and it is necessary to comprehensively consider infection control, inflammation regulation, and organ support during treatment. Studies have shown that there may be potential benefits in the treatment and prevention of sepsis through the regulation of intestinal flora and the use of microbial preparations. The microbiota in the gastrointestinal tract of the human body is composed of trillions of bacteria that form the mucosal barrier of the intestine and are present in different proportions and numbers in different parts of the intestine, thus playing a defensive and protective role (11). Dysregulation of the microbiome or a reduction in microbial diversity is associated with altered immune responses. Sepsis affects the composition of the intestinal microbiome, which is characterized by loss of diversity, reduced abundance of key symbiotic bacteria such as Faecium and Gastrococcus, weakened colonization capacity of Proteus and other conditioning pathogens, and overpropagation, growing as a dominant bacterial group (12). A prospective cohort study of over 200 preterm infants in 2019 found that increased bacterial diversity and anaerobic colonization of the neonatal gut microbiome protected newborns from sepsis (13). The results of metagenomic sequencing technology in this study showed that the microbial abundance and diversity in patients with sepsis were significantly higher than those in the normal group (p < 0.05). The top 10 microbial abundances in the sepsis and normal groups were Vitis vinifera, Mycobacterium canettii, Solanum pennellii, Ralstonia insidiosa, Ananas comosus, Moraxella osloensis, Escherichia coli, Staphylococcus hominis, Camelina sativa, and Cutibacterium acnes, which mainly include protein families: genetic information processing, translation, protein families: signaling and cellular processes, and unclassified: genetic information processing.
Nowadays, traditional biomarkers such as CRP, PCT and IL-6 are widely used in the diagnosis and evaluation of sepsis (9). Inflammation serves as a defensive reaction aimed at eliminating invading pathogens, mitigating detrimental stimuli, and initiating tissue healing. The inflammatory response is activated when innate immune cells detect antigenic structures via pattern recognition receptors that identify molecular patterns associated with pathogens or damage-related molecular patterns (14). Excessive inflammatory response contributes to tissue damage and organ dysfunction in individuals with sepsis. Neutrophils produce reactive oxygen species through chemotaxis and phagocytosis, leading to widespread inflammation and increased microvascular permeability. Excessive inflammation causes a large number of neutrophil degranulation and proteolytic enzyme release, resulting in systemic and local endothelial damage (15). Therefore, neutrophils reflect the inflammatory response and immune status of the body during sepsis. IL-6 not only activates neutrophils but also delays phagocytosis of senescent and dysfunctional neutrophils, thereby exacerbating the production of post-traumatic inflammatory mediators and promoting the onset of post-traumatic systemic inflammatory response syndrome (16). Normal human serum IL-6 levels are very low, but when the body has an inflammatory response, IL-6 levels are significantly increased, and its level are increased earlier than other acute stage proteins, so it is helpful for the early diagnosis of emergency infection patients and can reflect the change in the disease condition (17). CRP is an acute phase protein produced by hepatocytes under the action of IL-6, and the serum CRP level in healthy people is very low; however, it can be significantly increased during bacterial infection, tissue damage, or stress, and it is significantly increased at the early stage of inflammation, which is a sensitive indicator of bacterial infection (18, 19). PCT is a hormone-free calcitonin peptide. Under normal physiological conditions, serum PCT levels are extremely low (20). However, under the action of inflammatory cytokines, the liver, kidneys, muscles, adipose tissue, and other solid organs of septic shock patients produce a large amount of PCT, resulting in a significant increase in the blood PCT levels of patients (20). Therefore, it can be used to diagnose, evaluate, and predict infectious diseases by measuring serum PCT levels in patients. Serum amyloid A (SAA) can be used as a sensitive indicator to reflect body infection and inflammation management, playing a crucial role in the adjunct diagnosis of infectious diseases (21). WBC is a common indicator of systemic inflammation, and relevant studies have reported that WBC count can diagnose early sepsis and is closely related to its prognosis (22). By analyzing the correlation between sepsis detection indicators and pathogenic microorganisms, it is possible to improve the diagnostic accuracy of sepsis, formulate more effective treatment options, and evaluate the prognosis of patients, which can help improve the recovery and survival rates of patients with sepsis. In this study, the correlation between sepsis-related inflammatory indicators, pathogenic microorganisms, and metabolic pathways was analyzed. The correlation analysis revealed a significant positive correlation (p < 0.05) between IL-6 and membrane transport. Metabolism of other amino acids showed a significant positive correlation (p < 0.05) with Cutibacterium acnes, Ralstonia insidiosa, Moraxella osloensis, and Staphylococcus hominis. Ananas comosus showed a significant positive correlation (p < 0.05) with poorly characterized and unclassified: metabolism. Blood test-related indicators showed a significant negative correlation (p < 0.05) with microorganisms.
Radiomics is the high-throughput extraction of a large amount of information from medical images to achieve lesion segmentation, feature extraction, and model establishment. It assists clinicians in making the most accurate diagnosis by conducting deeper mining, prediction, and analysis of massive amounts of image data information. It can also be intuitively understood as converting visual image information into deep quantitative features (23). In recent years, with the enhancement of computer data processing capabilities, improvement of image recognition technology, and continuous improvement of machine learning algorithms, in-depth data information of massive medical images can be mined and analyzed (24, 25). This capability has been applied to assess the severity of diseases (26), construct disease monitoring systems (automated alerting system) (27), and enable early prediction of diseases (28–31). Zhang et al. (32) found that the establishment of an XGBoost prediction model can predict sepsis-associated delirium earlier and is suitable for patients who are difficult to evaluate using traditional methods. Ge et al. (29) developed a machine learning model to accurately predict the occurrence of sepsis-associated acute brain injury and provide a basis for early intervention and treatment. In this study, the AUC value of the model based on the features extracted by radiomics was 0.791, the AUC of the medical record data features is 0.873; the AUC value of the logistic regression model based on the features extracted from medical records and radiomics was 0.879. It is proven that the model prediction ability is better when the two features are combined.
In this study, the blood samples of patients with sepsis were metagenomically sequenced to explore the complex relationship between microorganisms, metabolic pathways and blood test indicators, which provided a new idea and method for the diagnosis of sepsis. At the same time, a machine learning model based on medical records and radiomic features was developed for clinical diagnosis of sepsis, which filled some gaps in this field. The sample size of this study was small; the results may have been affected by sample selection, and further expansion of the sample size is required to verify the stability of the conclusions. Although the establishment of machine learning models has achieved certain prediction capabilities, they still need to be verified and optimized on larger datasets.
5 Conclusion
Taken together, microbial abundance and diversity were elevated in the sepsis group. Correlation analysis of blood test-related indicators with microbial and metabolic pathways showed significant correlations, which might contribute to further clinical diagnosis and treatment. The LR prediction model based on radiomics and medical record data had good diagnostic efficacy and calibration for identifying patients with sepsis, which is a potential auxiliary tool for clinical decision-making.
Data availability statement
The original contributions presented in the study are included in the article/supplementary material, further inquiries can be directed to the corresponding author.
Ethics statement
The studies involving humans were approved by the Ethics Committee of Chongqing Emergency Medical Center and Chongqing University Central Hospital (Approval Ethics Review No. 2021-73). The studies were conducted in accordance with the local legislation and institutional requirements. The participants provided their written informed consent to participate in this study.
Author contributions
XH: Conceptualization, Formal analysis, Methodology, Project administration, Resources, Writing – original draft, Data curation, Investigation, Writing – review & editing. SZ: Data curation, Investigation, Writing – original draft, Writing – review & editing, Supervision. WW: Investigation, Writing – original draft, Writing – review & editing, Methodology. YT: Investigation, Methodology, Writing – original draft, Writing – review & editing. YZ: Investigation, Methodology, Writing – original draft, Writing – review & editing. LL: Investigation, Methodology, Writing – original draft, Writing – review & editing. XL: Investigation, Methodology, Writing – original draft, Writing – review & editing. LP: Data curation, Writing – review & editing. HF: Data curation, Writing – review & editing. WL: Conceptualization, Formal analysis, Funding acquisition, Methodology, Project administration, Resources, Writing – original draft.
Funding
The author(s) declare that financial support was received for the research, authorship, and/or publication of this article. This work was supported by the Scientific and Technological Research Program of Chongqing Municipal Education Commission (Grant Number: KJZD-M202300101), Emergency Medicine Chongqing Municipal Key Laboratory Talent Innovation Development Joint Fund Project (Grant Number: 2024RCCX06), and Chongqing Advanced Medical Talents Program for Young and Middle Aged People (Grant Number: ZQNYXGDRCGZS2019008).
Conflict of interest
The authors declare that the research was conducted in the absence of any commercial or financial relationships that could be construed as a potential conflict of interest.
Publisher’s note
All claims expressed in this article are solely those of the authors and do not necessarily represent those of their affiliated organizations, or those of the publisher, the editors and the reviewers. Any product that may be evaluated in this article, or claim that may be made by its manufacturer, is not guaranteed or endorsed by the publisher.
References
1. Singer, M, Deutschman, CS, Seymour, CW, Shankar-Hari, M, Annane, D, Bauer, M, et al. The third international consensus definitions for sepsis and septic shock (sepsis-3). JAMA. (2016) 315:801–10. doi: 10.1001/jama.2016.0287
2. Yang, J, Hao, S, Huang, J, Chen, T, Liu, R, Zhang, P, et al. The application of artificial intelligence in the management of sepsis. Med Rev. (2021) 3:369–80. doi: 10.1515/mr-2023-0039
3. Huang, M, Cai, S, and Su, J. The pathogenesis of sepsis and potential therapeutic targets. Int J Mol Sci. (2019) 20:5376. doi: 10.3390/ijms20215376
4. Chicco, D, and Jurman, G. Survival prediction of patients with sepsis from age, sex, and septic episode number alone. Sci Rep. (2020) 10:17156. doi: 10.1038/s41598-020-73558-3
5. Xie, J, Wang, H, Kang, Y, Zhou, L, Liu, Z, Qin, B, et al. The epidemiology of sepsis in Chinese ICUs: a national cross-sectional survey. Crit Care Med. (2020) 48:e209–18. doi: 10.1097/CCM.0000000000004155
6. Guan, W, Xu, J, Shi, Y, Wang, X, Gu, S, and Xie, L. VNN1 as a potential biomarker for sepsis diagnosis and its implications in immune infiltration and tumor prognosis. Front Med. (2023) 10:1236484. doi: 10.3389/fmed.2023.1236484
7. Zhang, Y, and Han, J. Rethinking sepsis after a two-year battle with COVID-19. Cell Mol Immunol. (2022) 19:1317–8. doi: 10.1038/s41423-022-00909-7
8. Shi, J, Lu, Z-Q, Lin, Q-M, Zeng, W, Gu, PJ, Yu, Q, et al. The role of albumin in the diagnosis of neonatal sepsis over the last 11 years: a retrospective study. J Inflamm Res. (2023) 16:2855–63. doi: 10.2147/JIR.S414611
9. Westerdijk, K, Simons, KS, Zegers, M, Wever, PC, Pickkers, P, and de Jager, CPC. The value of the neutrophil-lymphocyte count ratio in the diagnosis of sepsis in patients admitted to the intensive care unit: a retrospective cohort study. PLoS One. (2019) 14:e0212861. doi: 10.1371/journal.pone.0212861
10. Kojic, D, Siegler, BH, Uhle, F, Lichtenstern, C, Nawroth, PP, Weigand, MA, et al. Are there new approaches for diagnosis, therapy guidance and outcome prediction of sepsis? World J Exp Med. (2015) 5:50–63. doi: 10.5493/wjem.v5.i2.50
11. Xie, T, Lv, J, Wei, J, Ye, L, and Zhang, D. Research on the mechanisms and treatment of dysbiosis of intestinal microbiota in sepsis. J Med Res. (2018) 47:4. doi: 10.11969/j.issn.1673-548X.2018.08.043
12. McDonald, D, Ackermann, G, Khailova, L, Baird, C, Heyland, D, Kozar, R, et al. Extreme dysbiosis of the microbiome in critical illness. mSphere. (2016) 1:e00199. doi: 10.1128/mSphere.00199-16
13. Graspeuntner, S, Waschina, S, Künzel, S, Twisselmann, N, Rausch, TK, Cloppenborg-Schmidt, K, et al. Gut dysbiosis with bacilli dominance and accumulation of fermentation products precedes late-onset sepsis in preterm infants. Clin Infect Dis. (2019) 69:268–77. doi: 10.1093/cid/ciy882
14. Slaats, J, ten Oever, J, van de Veerdonk, FL, and Netea, MG. IL-1β/IL-6/CRP and IL-18/ferritin: distinct inflammatory programs in infections. PLoS Pathog. (2016) 12:e1005973. doi: 10.1371/journal.ppat.1005973
15. Sheats, MK. A comparative review of equine SIRS, Sepsis, and neutrophils. Front Vet Sci. (2019) 6:69. doi: 10.3389/fvets.2019.00069
16. Tang, S, Wan, M, Huang, W, Stanton, RC, and Xu, Y. Maresins: specialized proresolving lipid mediators and their potential role in inflammatory-related diseases. Mediat Inflamm. (2018) 2018:1–8. doi: 10.1155/2018/2380319
17. Wu, Y, Wang, G, Huang, Z, Yang, B, Yang, T, Liu, J, et al. Diagnostic and therapeutic value of biomarkers in urosepsis. Ther Adv Urol. (2023) 15:17562872231151852. doi: 10.1177/17562872231151852
18. Kudlinski, B, Zgoła, D, Stolińska, M, Murkos, M, Kania, J, Nowak, P, et al. Systemic inflammatory predictors of in-hospital mortality in COVID-19 patients: a retrospective study. Diagnostics. (2022) 12:859. doi: 10.3390/diagnostics12040859
19. Ruan, G-T, Xie, H-L, Gong, Y-Z, Ge, YZ, Zhang, Q, Wang, ZW, et al. Prognostic importance of systemic inflammation and insulin resistance in patients with cancer: a prospective multicenter study. BMC Cancer. (2022) 22:700. doi: 10.1186/s12885-022-09752-5
20. Hegazy, MA, Omar, AS, Samir, N, Moharram, A, Weber, S, and Radwan, WA. Amalgamation of procalcitonin, C-reactive protein, and sequential organ failure scoring system in predicting sepsis survival. Anesth Essays Res. (2014) 8:296–301. doi: 10.4103/0259-1162.143115
21. Lv, Y-J, Hu, Q-L, Huang, R, Zhang, L, Wu, L-F, and Fu, S. The diagnostic and therapeutic value of the detection of serum amyloid a and C-reactive protein in infants with rotavirus diarrhea. Int J Gen Med. (2021) 14:3611–7. doi: 10.2147/IJGM.S319915
22. Rimmer, E, Garland, A, Kumar, A, Doucette, S, Houston, BL, Menard, CE, et al. White blood cell count trajectory and mortality in septic shock: a historical cohort study. Can J Anaesth. (2022) 69:1230–9. doi: 10.1007/s12630-022-02282-5
23. Chen, C, Geng, Q, Song, G, Zhang, Q, Wang, Y, Sun, D, et al. A comprehensive nomogram combining CT-based radiomics with clinical features for differentiation of benign and malignant lung subcentimeter solid nodules. Front Oncol. (2023) 13:1066360. doi: 10.3389/fonc.2023.1066360
24. Ochiai, K, Ozawa, T, Shibata, J, Ishihara, S, and Tada, T. Current status of artificial intelligence-based computer-assisted diagnosis systems for gastric cancer in endoscopy. Diagnostics. (2022) 12:3153. doi: 10.3390/diagnostics12123153
25. Zhang, Z, Kashyap, R, Su, L, and Meng, Q. Editorial: clinical application of artificial intelligence in emergency and critical care medicine, volume III. Front Med. (2022) 9:1075023. doi: 10.3389/fmed.2022.1075023
26. Liu, X, Hu, P, Yeung, W, Zhang, Z, Ho, V, Liu, C, et al. Illness severity assessment of older adults in critical illness using machine learning (ELDER-ICU): an international multicentre study with subgroup bias evaluation. Lancet Digit health. (2023) 5:e657–67. doi: 10.1016/s2589-7500(23)00128-0
27. Zhang, Z, Chen, L, Xu, P, Wang, Q, Zhang, J, Chen, K, et al. Effectiveness of automated alerting system compared to usual care for the management of sepsis. npj Digit Med. (2022) 5:101. doi: 10.1038/s41746-022-00650-5
28. Moor, M, Rieck, B, Horn, M, Jutzeler, CR, and Borgwardt, K. Early prediction of sepsis in the ICU using machine learning: a systematic review. Front Med. (2021) 8:607952. doi: 10.3389/fmed.2021.607952
29. Ge, C, Deng, F, Chen, W, Ye, Z, Zhang, L, Ai, Y, et al. Machine learning for early prediction of sepsis-associated acute brain injury. Front Med. (2022) 9:962027. doi: 10.3389/fmed.2022.962027
30. Le, S, Hoffman, J, Barton, C, Fitzgerald, JC, Allen, A, Pellegrini, E, et al. Pediatric severe sepsis prediction using machine learning. Front Pediatr. (2019) 7:413. doi: 10.3389/fped.2019.00413
31. Su, L, Xu, Z, Chang, F, Ma, Y, Liu, S, Jiang, H, et al. Early prediction of mortality, severity, and length of stay in the intensive care unit of sepsis patients based on sepsis 3.0 by machine learning models. Front Med. (2021) 8:664966. doi: 10.3389/fmed.2021.664966
Keywords: sepsis, metagenomics, blood test indicators, radiomics, machine learning
Citation: Hu X, Zhi S, Wu W, Tao Y, Zhang Y, Li L, Li X, Pan L, Fan H and Li W (2024) The application of metagenomics, radiomics and machine learning for diagnosis of sepsis. Front. Med. 11:1400166. doi: 10.3389/fmed.2024.1400166
Edited by:
Zhongheng Zhang, Sir Run Run Shaw Hospital, ChinaReviewed by:
Juhua Hu, University of Washington, United StatesChang Hu, Zhongnan Hospital of Wuhan University, China
Copyright © 2024 Hu, Zhi, Wu, Tao, Zhang, Li, Li, Pan, Fan and Li. This is an open-access article distributed under the terms of the Creative Commons Attribution License (CC BY). The use, distribution or reproduction in other forums is permitted, provided the original author(s) and the copyright owner(s) are credited and that the original publication in this journal is cited, in accordance with accepted academic practice. No use, distribution or reproduction is permitted which does not comply with these terms.
*Correspondence: Wei Li, bGl3ZWkwMTExQGNxdS5lZHUuY24=
 Xiefei Hu1,2
 Wei Li