 Xinghui Liu
 Hongwen Tan2
 Zhangrong Chen
- 1School of Clinical Medicine, Guizhou Medical University, Guiyang, China
- 2Department of Cardiovascular Medicine, Guizhou Provincial People's Hospital, Guiyang, China
- 3Electrical Engineering College, Guizhou University, Guiyang, China
- 4Department of Cardiovascular Medicine, The Affiliated Hospital of Guizhou Medical University, Guiyang, China
Retinal vessels play a pivotal role as biomarkers in the detection of retinal diseases, including hypertensive retinopathy. The manual identification of these retinal vessels is both resource-intensive and time-consuming. The fidelity of vessel segmentation in automated methods directly depends on the fundus images' quality. In instances of sub-optimal image quality, applying deep learning-based methodologies emerges as a more effective approach for precise segmentation. We propose a heterogeneous neural network combining the benefit of local semantic information extraction of convolutional neural network and long-range spatial features mining of transformer network structures. Such cross-attention network structure boosts the model's ability to tackle vessel structures in the retinal images. Experiments on four publicly available datasets demonstrate our model's superior performance on vessel segmentation and the big potential of hypertensive retinopathy quantification.
1 Introduction
Hypertension (HT) is a chronic ailment posing a profound menace to human wellbeing, manifesting in vascular alterations (1). Its substantial contribution to the global prevalence and fatality rates of cardiovascular diseases (CVD) cannot be overstated. The escalated incidence and mortality rates are not solely attributable to HT's correlation with CVD but also to the ramifications of hypertension-mediated organ damage (HMOD). This encompasses structural and functional modifications across pivotal organs, including arteries, heart, brain, kidneys, vessels, and the retina, signifying preclinical or asymptomatic CVD (2, 3). HT management's principal aim remains to deter CVD incidence and mortality rates. Achieving this goal mandates meticulous adherence to HT guidelines, emphasizing precise blood pressure monitoring and evaluating target organ damage (4). Consequently, the early identification of HT-mediated organ damage emerges as a pivotal concern.
The retinal vascular system shares commonalities in structural, functional, and embryological aspects with the vascular systems of the heart, brain, and kidneys (5–9). Compared to other microvascular territories, the distinctive attributes of the retinal microcirculation enable relatively straightforward detection of localized HMOD (5, 9). Its capacity to offer a non-invasive and uncomplicated diagnostic tool positions retinal visualization as the simplest means of elucidating the microcirculatory system. In hypertensive patients, retinal microvasculature gives insight into the wellbeing of the heart, kidneys, and brain (5, 10, 11). Early detection of HT-mediated retinal changes indirectly mirrors the vascular status of these organs, facilitating refined evaluation of cardiovascular risk stratification, timely interventions, and improved prognostication, thereby holding substantial clinical significance. Traditional clinical methodologies for diagnosing HT-mediated retinal alterations, while reliant on the proficiency of ophthalmic professionals, often demand considerable time and specialized expertise (12). Figure 1 presents a sample fundus image, demonstrating the complexity of the retinal vasculature and image intensity variation. However, integrating AI-based models in ophthalmology holds promising prospects for revolutionizing this paradigm. Leveraging machine learning algorithms and deep neural networks, AI-enabled diagnostic tools have demonstrated the potential to expedite and enhance the assessment of HT-related retinal vessel changes (13–17). These AI models learn from extensive datasets of annotated medical images, swiftly recognizing subtle retinal anomalies that might elude human detection. By automating the analysis and interpretation of retinal images, AI-based systems offer the prospect of reducing diagnostic timeframes, improving accuracy, and potentially mitigating the need for extensive human oversight. In this work, we proposed a heterogeneous features cross-attention neural network to tackle the retinal vessel segmentation task with color fundus images.
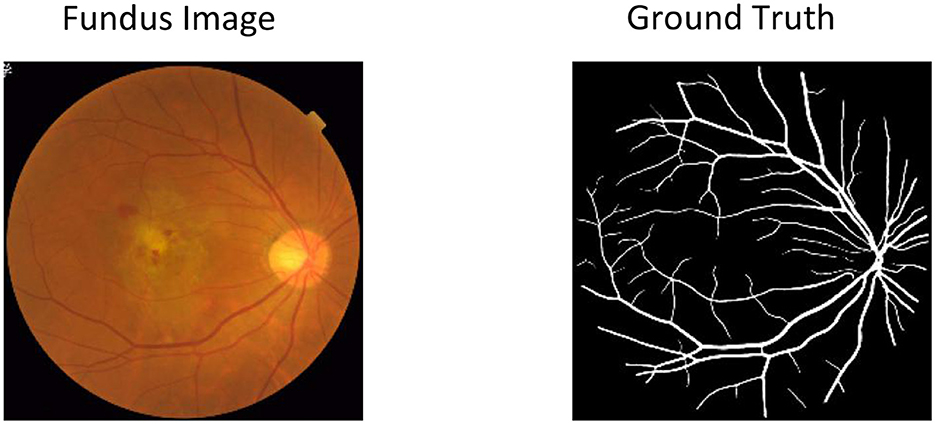
Figure 1. Sample retinal fundus image for vessel segmentation and hypertensive retinopathy quantification. The yellow areas in Ground Truth represent the retinal vessel area that needs to be segmented for disease analysis.
2 Related work
Segmenting blood vessels in retinal color fundus images plays a pivotal role in the diagnostic process of hypertensive retinopathy. Over the years, researchers have explored computer-assisted methodologies to tackle this task. For instance, Annunziata and Trucco (18) introduced a novel curvature segmentation technique leveraging an accelerating filter bank implemented via a speed-up convolutional sparse coding filter learning approach. Their method employs a warm initialization strategy, kickstarted by meticulously crafted filters. These filters are adept at capturing the visual characteristics of curvilinear structures, subsequently fine-tuned through convolutional sparse coding. Similarly, Marín et al. (19) delved into the realm of hand-crafted feature learning methods, harnessing gray-level and moment invariant-based features for vessel segmentation. However, despite the efficacy of such techniques, the manual crafting of filters is inherently time-intensive and prone to biases, necessitating a shift toward more automated and data-driven approaches in this domain.
Deep learning techniques based on data analysis have demonstrated superior performance to conventional retinal vessel segmentation approaches (18–20). For instance, Maninis et al. (21) developed a method wherein feature maps derived from a side output layer contributed to vessel and optic disc segmentation. Along a similar line, Oliveira et al. (22) combined the benefits of stationary wavelet transform's multi-scale analysis with a multi-scale full convolutional neural network, resulting in a technique adept at accommodating variations in the width and orientation of retinal vessel structures. In terms of exploiting the advance of the Unit structure, there are previous methods that achieved promising performance. For example, Yan et al. (23) implemented a joint loss function in U-Net, comprising two components responsible for pixel-wise and segment-level losses, aiming to enhance the model's ability to balance segmentation between thicker and thinner vessels. Mou et al. (24) embedded dense dilated convolutional blocks between encoder and decoder cells at corresponding levels of a U-shaped network, employing a regularized walk algorithm for post-processing model predictions. Similarly, Wang et al. (25) proposed a Dual U-Net with two encoders: one focused on spatial information extraction and the other on context information. They introduced a novel module to merge information from both paths.
Despite the proficiency of existing deep learning methodologies in segmenting thicker vessels, there remains a challenge in combining heterogeneous features from different stages of the deep learning models via Transformers and CNN models. Generally, improving deep learning-based techniques for vessel segmentation can be approached from various angles, including multi-stage feature fusion and optimization of loss functions. This work proposes a heterogeneous feature cross-attention neural network to address the above challenge.
3 Materials and methods
3.1 Heterogeneous features cross-attention neural network
A detailed model structure overview is shown in Figure 2. In detail, two brunches of feature extraction modules are proposed to extract heterogeneous features from different stages of the backbone network. In detail, there is CNN-based (Conv-Block) and transformer-based (Trans-Block) brunch, which focus on local semantic and long-range spatial information. Those two features' information are both important for the vessel segmentation task.
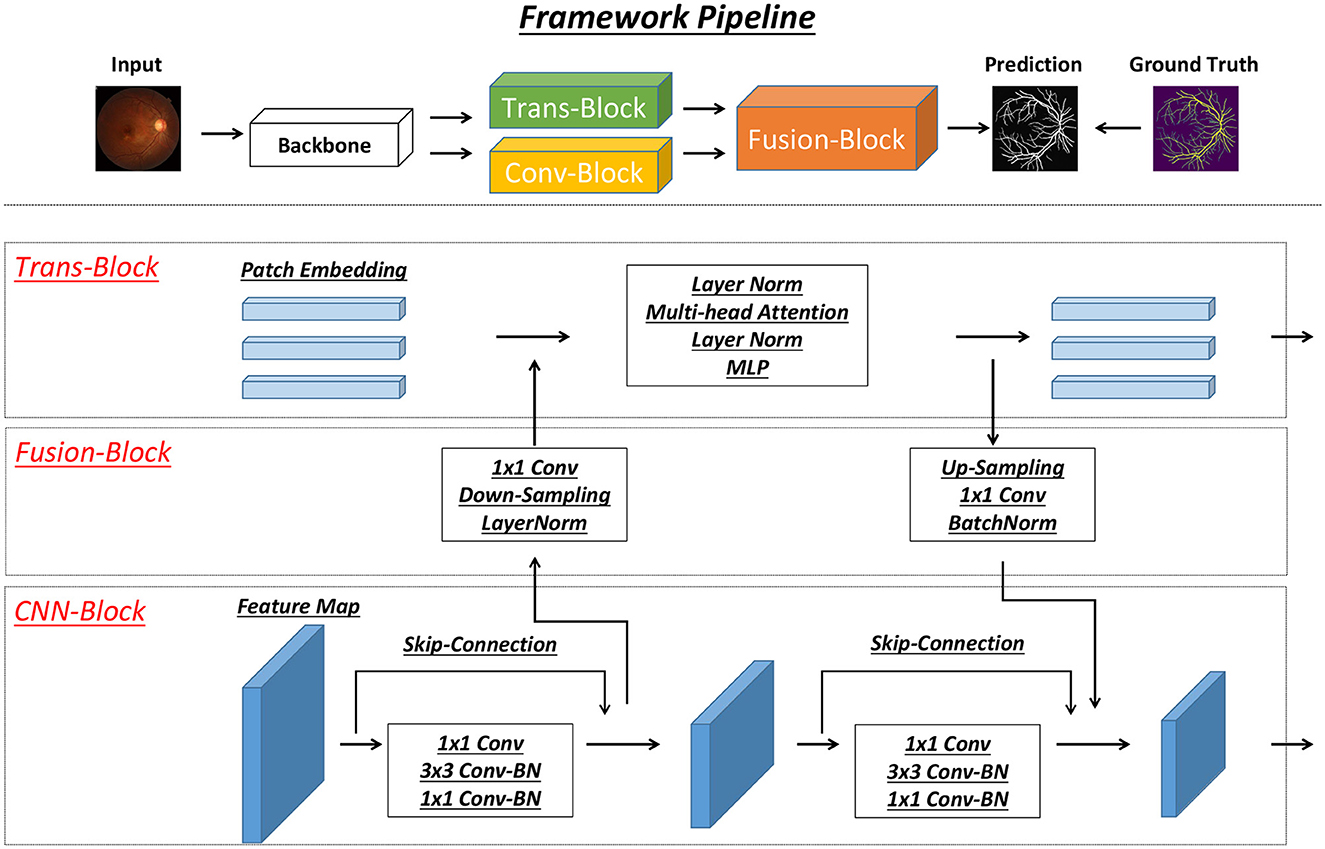
Figure 2. Figure of our proposed model structure. Our model contains three modules, including Trans-Block, CNN-Block and Fusion-Block. The detailed structure of each module is shown in the figure.
The interaction between the two branches is used as a cross-attention module to emphasize the essential heterogeneous (semantic and spatial) features. It is used as the main structure to facilitate the interaction and integration of local and long-range global features. Drawing inspiration from the work by Peng et al. (26), the intersecting network architecture within our model ensures that both Conv-Block and Trans-Block can concurrently learn features derived from the preceding Conv-Block and Trans-Block, respectively.
3.1.1 CNN blocks
In the structure depicted in Figure 2, the CNN branch adopts a hierarchical structure, leading to a reduction in the resolution of feature maps as the network depth increases and the channel count expands. Each phase of this structure consists of several convolution blocks, each housing multiple bottlenecks. These bottlenecks, in accordance with the ResNet framework (27), comprise a sequence involving down-projection, spatial convolution, up-projection, and a residual connection to maintain information flow within the block. Distinctly, visual transformers (28) condense an image patch into a vector in one step, which unfortunately leads to the loss of localized details. Conversely, in CNNs, the convolutional kernels operate on feature maps, overlapping to retain intricate local features. Consequently, the CNN branch ensures a sequential provision of localized feature intricacies to benefit the transformer branch.
3.1.2 Transformer blocks
In line with the approach introduced in ViT (28), this segment consists of N sequential transformer blocks, as showcased in Figure 2. Each transformer block combines a multi-head self-attention module with an MLP block, encompassing an up-projection fully connected layer and a down-projection fully connected layer. Throughout this structure, LayerNorms (29) are applied before each layer, and residual connections are integrated into both the self-attention layer and the MLP block. For tokenization purposes, the feature maps generated by the backbone module are compressed into 16 × 16 patch embeddings without overlap. This compression is achieved using a linear projection layer, implemented via a 3 × 3 convolution with a stride of 1. Notably, considering that the CNN branch (3 × 3 convolution) encodes both local features and spatial location information, the necessity for positional embeddings diminishes. This strategic adaptation results in an improved image resolution, advantageous for subsequent tasks related to vision.
3.1.3 Feature fusion blocks
Aligning the feature maps derived from the CNN branch with the patch embeddings within the transformer branch poses a significant challenge. To tackle this, we introduce the feature fusion block, aiming to continuously and interactively integrate local features with global representations. The substantial difference in dimensionalities between the CNN and transformer features is noteworthy. While CNN feature maps are characterized by dimensions C×H×W (representing channels, height, and width, respectively), patch embeddings assume a shape of (L+1) × J, where L, 1, and J denote the count of image patches, class token, and embedding dimensions, respectively. To reconcile these disparities, feature maps transmitted to the transformer branch undergo an initial 1 × 1 convolution to align their channel numbers with the patch embeddings. Subsequently, a down-sampling module (depicted in Figure 2) aligns spatial dimensions, following which the feature maps are amalgamated with patch embeddings, as portrayed in Figure 2. Upon feedback from the transformer to the CNN branch, the patch embeddings necessitate up-sampling (as illustrated in Figure 2) to match the spatial scale. Following this, aligning the channel dimension with that of the CNN feature maps through a 1 × 1 convolution is performed, integrating these adjusted embeddings into the feature maps. Furthermore, LayerNorm and BatchNorm modules are employed to regularize the features. Moreover, a significant semantic disparity arises between feature maps and patch embeddings. While feature maps stem from local convolutional operators, patch embeddings arise from global self-attention mechanisms. Consequently, the feature fusion block is incorporated into each block (excluding the initial one) to bridge this semantic gap progressively.
3.2 Experiments
3.2.1 Datasets
Four public datasets, DRIVE (30), CHASEDB1 (31), STARE (32), and HRF (33), were used in our experiments. The images of these datasets were captured by different devices and with different image sizes. A detailed description of each dataset is elaborated below:
1) DRIVE dataset: the dataset known as DRIVE comprises 40 pairs of fundus images accompanied by their respective labels for vessel segmentation. Each image within this dataset measures 565 × 584 pixels. Furthermore, the dataset has been partitioned into distinct training and test sets, encompassing 20 pairs of images and corresponding labels within each set. Notably, in the test set, every image has undergone labeling by two medical professionals. Typically, the initial label is considered the reference standard (ground truth), while the second label serves as a human observation used to assess accuracy.
2) CHASEDB1 dataset: the CHASEDB1 dataset encompasses a collection of 28 images, comprising samples from both the left and right eyes, with each image possessing dimensions of 999 × 960 pixels. Past investigations have specifically delineated the dataset's utilization, designating a distinct partition for training and testing purposes. According to prior scholarly research (31), a selection strategy has been employed, with the final eight images demarcated for evaluation as testing samples, while the preceding images have been earmarked for utilization as training samples. This segmentation strategy in the dataset facilitates a structured approach for model training and evaluation, enabling a systematic analysis of algorithm performance on separate subsets of images to ensure robustness and generalizability in vessel segmentation tasks.
3) STARE dataset: each image within the STARE dataset measures 700 × 605 pixels. This dataset comprises 20 color fundus images without a predefined division into training and test sets. Previous studies have employed two common schemes for test set allocation to assess method performance. One approach involves assigning 10 images to the training set and the remaining 10 to the test set. Alternatively, the Leave-One-Out method has been utilized, wherein each image successively serves as the test set while the remaining images form the training set for evaluation purposes in different iterations.
4) HRF dataset: the HRF dataset comprises 45 fundus images with a resolution of 3,504 × 2,336 pixels. From this dataset, 15 images from are allocated to the training set, while the remaining 30 images constitute the test set. To mitigate computational expenses, both the images and their corresponding labels are downsampled twice, as noted in (34).
3.2.2 Loss functions
Commonly utilized region-based losses, like Dice loss (35), often result in highly precise segmentation. However, they tend to disregard the intricate vessel shapes due to a multitude of pixels outside the target area, overshadowing the significance of those delineating the vessel (36–40). This oversight may contribute to relatively imprecise retinal vessel segmentation and, consequently, inaccurate quantification of hypertensive retinopathy. In response, we incorporated the TopK loss (Equation 1) (41, 42) to emphasize the retinal vessels during the training process specifically. When objects exhibit sizes that are not notably smaller in comparison to the convolutional neural network's (CNN) receptive field, the vessel emerges as the most variable component within the prediction, displaying the least certainty; thus, the loss within the vessel region tends to be the highest among the predictions (43). Building upon these observations and rationale, the TopK loss is formulated as follows:
where gi is the ground truth of pixel i, si is the corresponding predicted probability, and K is the set of the k% pixels with the lowest prediction accuracy. While sole vessel-focused loss often causes training instability (44), region-based loss, such as Dice loss (Equation 2) (35), is needed at the early stage of the training. We represent Dice loss as follows:
where Vg is the ground truth label and Vs is the prediction result of segmentation. We coupled TopK with region-based Dice loss as our final loss function (Equation 3) for the retinal vessel segmentation.
3.2.3 Experimental setting
To enrich the dataset, we introduce random rotations on the fly to the input images in the training dataset, applied to both segmentation tasks. Specifically, these rotations span from –20 to 20 degrees. Additionally, 10% of the training dataset is randomly chosen to serve as the validation dataset. The proposed network was implemented utilizing the PyTorch Library and executed on the Nvidia GeForce TITAN Xp GPU. Throughout the training phase, we employed the AdamW optimizer to fine-tune the deep model. To ensure effective training, a gradually decreasing learning rate was adopted, commencing at 0.0001, alongside a momentum parameter set at 0.9. For each iteration, a random patch of size 118 × 118 from the image was selected for training purposes, with a specified batch size of 16. A backbone of ResNet50 (27) is used in this work.
3.2.4 Evaluation metrics
The model's output is represented as a probability map, assigning to each pixel the probability of being associated with the vessel class. Throughout the experiments, a probability threshold of 0.5 was employed to yield the results. To comprehensively assess the efficacy of our proposed framework during the testing phase, the subsequent metrics will be computed:
• Acc (accuracy) = (TP + TN) / (TP + TN + FP + FN),
• SE (sensitivity) = TP / (TP + FN),
• SP (specificity) = TN / (TN + FP)
• F1 (F1 score) = (2 × TP) / (2 × TP + FP + FN)
• AUROC = area under the receiver operating characteristic curve.
In this context, the correct classification of a vessel pixel is categorized as a true positive (TP), while misclassification is identified as a false positive (FP). Correspondingly, accurate classification of a non-vessel pixel is considered a true negative (TN), whereas misclassification is denoted as a false negative (FN).
3.3 Compared methods
We compared our approach to other classic and state-of-the-art models that have achieved promising performance on different medical image segmentation tasks. All of the experiments are conducted under the same experimental setting. The compared methods are briefly introduced below:
• Unet (45): Unet is a CNN architecture used for image segmentation tasks. Its U-shaped design includes an encoder (contracting path) for feature extraction and a symmetric decoder (expansive path) for generating segmented outputs. The network uses skip connections to preserve fine details and context, making it effective for tasks like biomedical image segmentation.
• Unet++ (46): Unet++ is an advanced version of the U-Net architecture designed for image segmentation tasks. It improves upon U-Net by introducing nested skip connections and aggregation pathways, allowing better multi-scale feature integration and context aggregation. This enhancement leads to more accurate and precise segmentation results compared to the original U-Net model.
• Swin-Transformer (47): Swin-Transformer is a hierarchical vision transformer (28) structure. It uses shifted windows to process image patches hierarchically, allowing for improved global context understanding. This architecture has demonstrated competitive segmentation performance with efficient computation.
• AttenUnet (48): The AttenUnet enhances the traditional U-Net architecture that integrates attention mechanisms. These mechanisms enable the network to focus on important image features during segmentation tasks. It improves accuracy by refining object delineation and suppressing irrelevant information. This variant is particularly effective in tasks like medical image segmentation, where precise localization of structures is essential.
• TransUnet (49): TransUNet is a proposed architecture to improve medical image segmentation, addressing limitations seen in the widely used U-Net model. It combines the strengths of Transformers' global self-attention with U-Net's precise localization abilities. The Transformer part encodes image patches from a CNN feature map to capture global context, while the decoder integrates this with high-resolution feature maps for accurate localization.
4 Results
4.1 Vessel segmentation performance
Figure 3 illustrates qualitative comparison with other compared methods on the test dataset. Tables 1–4 shows the quantitative performance of Ours and other methods on four different datasets, respectively.
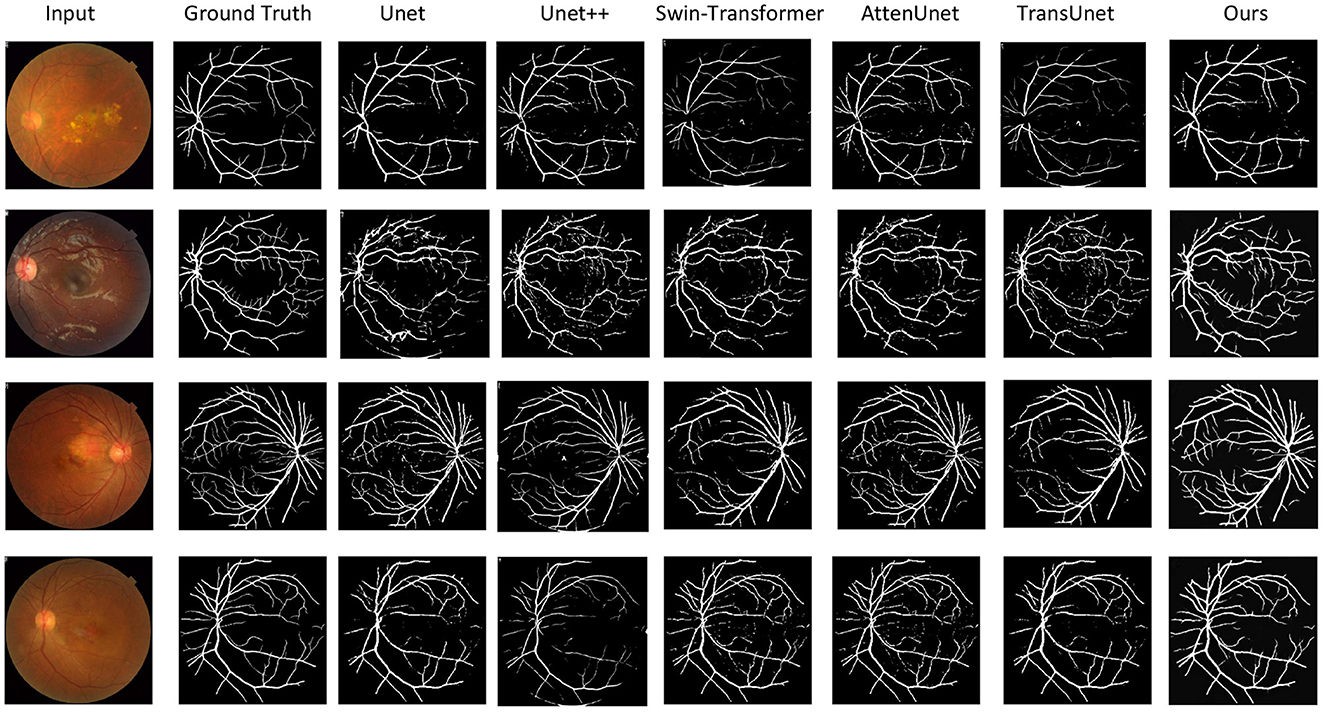
Figure 3. Qualitative results of the vessel segmentation. We compare our model with Unet (45), Unet++ (46), Swin-Transformer (47), AttenUnet (48), TransUnet (49). Our method can produce more accurate segmentation results than the other methods compared with the ground truth.

Table 1. Quantitative results comparison between our methods and other compared state-of-the-art methods on DRIVE dataset.

Table 2. Quantitative results comparison between our methods and other compared state-of-the-art methods on CHASEDB1 dataset.
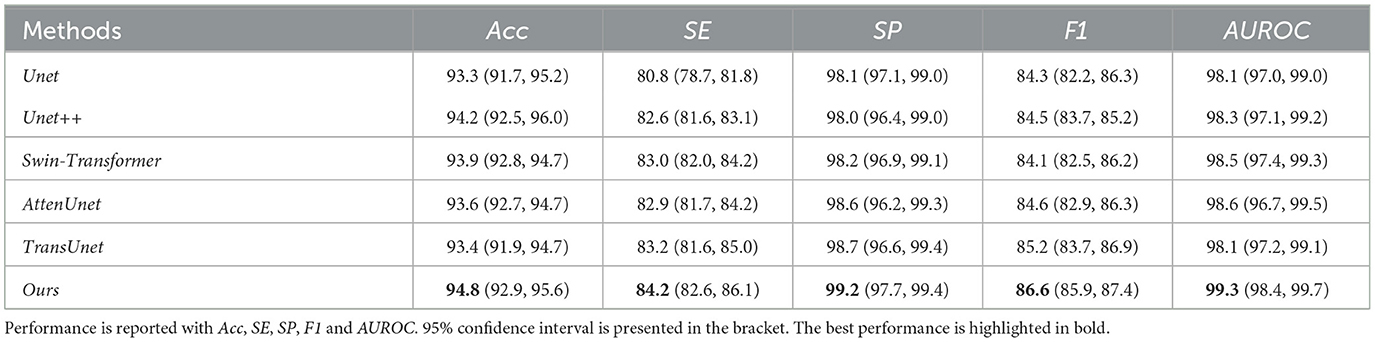
Table 3. Quantitative results comparison between our methods and other compared state-of-the-art methods on STARE dataset.
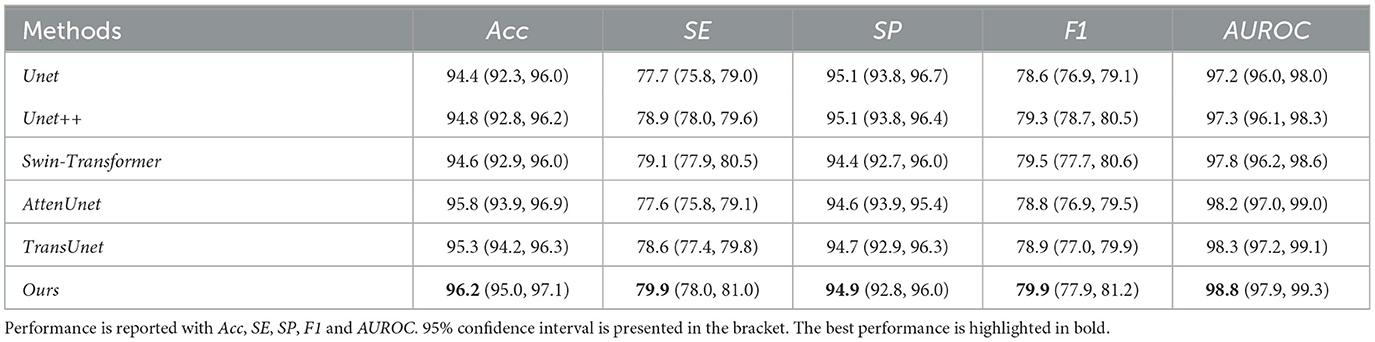
Table 4. Quantitative results comparison between our methods and other compared state-of-the-art methods on HRF dataset.
Our proposed method can outperform other compared methods on DRIVE, CHASEDB1, STARE, and HRF datasets, respectively. In detail, Ours achieved 83.3% F1 on DRIVE dataset, which outperformed Unet (45) by 3.6%, outperformed Swin-Transformer (47) by 1.6% and outperformed TransUnet (49) by 4.0%. Ours achieved 81.6% F1 on CHASEDB1 dataset, which outperformed Unet++ (46) by 1.9%, outperformed AttenUnet (48) by 2.1% and outperformed TransUnet (49) by 1.5%. Ours achieved 86.6% F1 on STARE dataset, which outperformed Unet (45) by 2.7%, outperformed AttenUnet (48) by 2.4% and outperformed TransUnet (49) by 1.6%. Ours achieved 79.9% F1 on HRF dataset, which outperformed Unet++ (46) by 0.8%, outperformed Swin-Transformer (47) by 0.5% and outperformed TransUnet (49) by 1.3%. Notably, Swin-Transformer (47) and TransUnet (49) belong to the transformer-based model structure, which demonstrates a superior performance on many tasks. However, in this work, the limited data size is one of the leading reasons for the relatively low performance of those datasets. Another reason could be the task's own nature of vessel segmentation, where more local information is needed rather than the long-range relationship between pixels. Thus, given two brunches with transformer and CNN structures and fusion modules, our proposed model can simultaneously tackle both the local semantic information and long-range spatial information for the segmentation task.
Figure 3 shows the qualitative comparison between ours and other compared methods. It demonstrated that our proposed methods can segment the vessels more accurately. This is important for vessel segmentation tasks and hypertensive retinopathy quantification with more accurate vessel area calculation.
4.2 Ablation study
4.2.1 Ablation study on loss functions
We did ablation study experiments on loss functions. We maintain the same model structure and only change the loss functions. In detail, we remove Dice loss and TopK loss, respectively, to evaluate their respective contribution to the performance of the proposed models. Furthermore, we replace TopK loss with a cross-entropy loss to validate the effectiveness of TopK loss in the segmentation task. Table 5 demonstrates that Dice Loss can lead to a 6.2% F1 and TopK loss can lead to a 2.9% F1 performance. On the other hand, Dice loss can lead to 15.5% SE performance, and TopK loss can lead to a 2.8% SE performance on Drive dataset. Additionally, compared with cross-entropy loss, the TopK loss could lead to a 1.5% F1 improvement and 2.3% SE improvement. Each loss function can boost the model's performance in different evaluation metrics. This demonstrated that the adopted loss function can both contribute to the learning process and benefit the vessel segmentation performance.
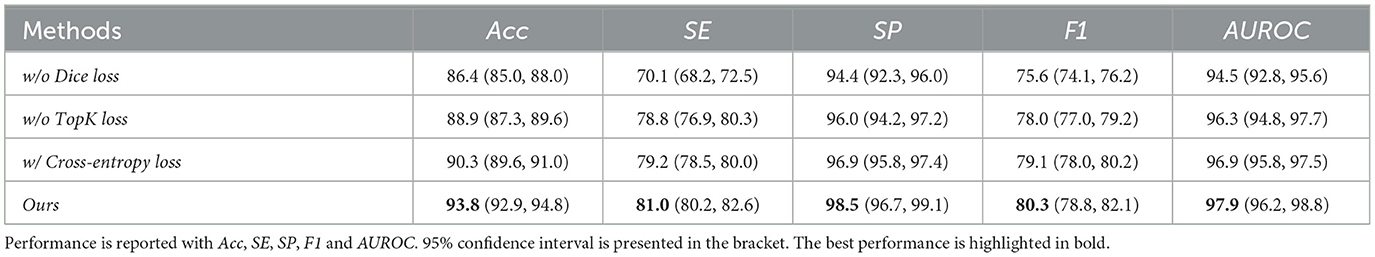
Table 5. Quantitative ablation study results of the loss function on DRIVE dataset.
4.2.2 Ablation study on the models' components
We did ablation study experiments on the model's components. In detail, we maintain the same model structure and only change the models' structure by removing different modules, including Trans-Block, CNN-Block and Fusion-Block, respectively. In detail, we remove each of those three modules, respectively, to evaluate their respective contribution to the performance of the proposed models. Table 6 demonstrates that Trans-Block can lead to a 10% F1, CNN-Block can lead to a 10.3% F1 performance and Fusion-Block can lead to a 7.9% F1 performance boost. On the other hand, Trans-Block can lead to a 3.3% SE performance, CNN-Block can lead to a 2.3% SE performance, and Fusion-Block can lead to an 0.9% SE performance on Drive dataset. Each module can boost the model's performance in different evaluation metrics. This demonstrated that the proposed modules can all contribute to the learning process and benefit the vessel segmentation performance.

Table 6. Quantitative ablation study results of the model's components on DRIVE dataset.
5 Hypertensive retinopathy quantification
The proposed method has demonstrated a promising retinal vessel segmentation performance on different datasets and benchmarks. Additionally, precise segmentation of retinal vessels plays a vital role in hypertensive retinopathy detection, whereas manual segmentation tends to be cumbersome and time-consuming (50). The model proposed can generate a binary mask distinguishing vessel pixels as one and background pixels as zero. This mask effectively quantifies the total count of vessel pixels within each mask. The ratio (Rvessel) between the count of vessel pixels and non-vessel pixels is defined as follows:
where Nv represents the count of vessel pixels, and Nnon denotes the count of non-vessel pixels. The ratio Rvessel (Equation 4) serves as a valuable metric in identifying hypertensive retinopathy within fundus images. Hypertensive retinopathy leads to vascular constriction (51, 52), resulting in a decrease in the count of vessel pixels (Rvessel).
Detection of hypertensive retinopathy, characterized by vascular constriction, involves assessing changes in Rvessel across sequential examinations. Increases or decreases in Rvessel indicate the occurrence or progression of hypertensive retinopathy, respectively. Hence, our proposed methods offer a straightforward approach for detecting hypertensive retinopathy.
In the future, with increased datasets comprising fundus images from hypertensive and healthy patients, we can further analyze vessel changes within these images. In real-world clinical practice, comparing the Rvessel obtained from consecutive visits can serve as a diagnostic tool. Additionally, the detection of newly formed vessels can be achieved by subtracting images from successive visits post-segmentation. This approach enables the identification and tracking of changes in vasculature over time, offering potential insights for clinical assessment and monitoring.
6 Limitation and future works
While our deep learning method has shown promising results in the challenging tasks of retinal vessel segmentation and hypertensive retinopathy quantification, it's important to acknowledge the nuanced landscape of limitations accompanying such endeavors. One notable factor is the inherent variability present in medical imaging datasets. Our model's performance could be influenced by factors such as variations in image quality and disease severity across different datasets. Moreover, despite achieving commendable results overall, there are instances where the model might struggle to accurately delineate intricate vascular structures or detect subtle manifestations of hypertensive retinopathy. This suggests the need for further exploration and refinement of our approach.
In future research, attention could be directed toward enhancing the model's robustness and adaptability to diverse imaging conditions and patient populations. Techniques such as advanced data augmentation and domain adaptation strategies could prove instrumental in achieving this goal. Additionally, integrating complementary sources of information, such as clinical metadata or genetic markers, holds promise for enriching the predictive capabilities of our model and enhancing its clinical relevance. Furthermore, the pursuit of interpretability and explainability remains paramount. Providing clinicians with insights into how the model arrives at its predictions can foster trust and facilitate its integration into real-world clinical workflows. However, this pursuit must be balanced with ethical considerations, particularly concerning patient privacy, algorithmic bias, and the potential consequences of automated decision-making in healthcare settings. By addressing these multifaceted challenges, we can pave the way for more effective and responsible deployment of deep learning technologies in ophthalmology and beyond.
7 Conclusion
We have proposed a novel and comprehensive framework for retinal vessel segmentation and hypertensive retinopathy quantification. It takes advantage of heterogeneous feature cross-attention with the help of local emphasis CNN and long-range emphasis transformer structure with a fusion module to aggregate the information. Our experiments on four large-scale datasets have demonstrated that our framework can simultaneously conduct accurate segmentation and potential hypertensive retinopathy quantification performance.
Data availability statement
The original contributions presented in the study are included in the article/supplementary material, further inquiries can be directed to the corresponding author.
Author contributions
XL: Writing – review & editing, Writing – original draft, Visualization, Validation, Software, Methodology, Formal analysis, Data curation. HT: Writing – review & editing, Writing – original draft, Visualization, Validation, Resources, Formal analysis, Conceptualization. WW: Writing – review & editing, Writing – original draft, Visualization, Validation, Software, Methodology. ZC: Writing – review & editing, Writing – original draft, Supervision, Resources, Project administration, Funding acquisition, Conceptualization.
Funding
The author(s) declare financial support was received for the research, authorship, and/or publication of this article. This research was supported by the Clinical special of Science and Technology Department of Guizhou Province (No. Qiankehechengguo-LC[2021]023) and the Youth Foundation of Guizhou Provincial People's Hospital (No. GZSYQN[2019]06). The funders had no role in study design, data collection and analysis, decision to publish, or preparation of the manuscript.
Conflict of interest
The authors declare that the research was conducted in the absence of any commercial or financial relationships that could be construed as a potential conflict of interest.
Publisher's note
All claims expressed in this article are solely those of the authors and do not necessarily represent those of their affiliated organizations, or those of the publisher, the editors and the reviewers. Any product that may be evaluated in this article, or claim that may be made by its manufacturer, is not guaranteed or endorsed by the publisher.
References
1. Houben AJ, Martens RJ, Stehouwer CD. Assessing microvascular function in humans from a chronic disease perspective. J Am Soc Nephrol. (2017) 28:3461. doi: 10.1681/ASN.2017020157
2. Rizzoni D, Agabiti-Rosei C, De Ciuceis C, Boari GEM. Subclinical hypertension-mediated organ damage (HMOD) in hypertension: atherosclerotic cardiovascular disease (ASCVD) and calcium score. High Blood Press Cardiovasc Prev. (2023) 30:17–27. doi: 10.1007/s40292-022-00551-4
3. Meng Y, Bridge J, Addison C, Wang M, Merritt C, Franks S, et al. Bilateral adaptive graph convolutional network on CT based Covid-19 diagnosis with uncertainty-aware consensus-assisted multiple instance learning. Med Image Anal. (2023) 84:102722. doi: 10.1016/j.media.2022.102722
4. Mancia G, De Backer G, Dominiczak A, Cifkova R, Fagard R, Germano G, et al. 2007 Guidelines for the management of arterial hypertension: the Task Force for the Management of Arterial Hypertension of the European Society of Hypertension (ESH) and of the European Society of Cardiology (ESC). Eur Heart J. (2007) 28:1462–536. doi: 10.1093/eurheartj/ehm236
5. Flammer J, Konieczka K, Bruno RM, Virdis A, Flammer AJ, Taddei S. The eye and the heart. Eur Heart J. (2013) 34:1270–8. doi: 10.1093/eurheartj/eht023
6. Wong TY, Mitchell P. Hypertensive retinopathy. N Engl J Med. (2004) 351:2310–7. doi: 10.1056/NEJMra032865
7. Bidani AK, Griffin KA. Pathophysiology of hypertensive renal damage: implications for therapy. Hypertension. (2004) 44:595–601. doi: 10.1161/01.HYP.0000145180.38707.84
8. Del Pinto R., Mulè G, Vadalà M, Carollo C, Cottone S, Agabiti Rosei C, et al. Arterial hypertension and the hidden disease of the eye: diagnostic tools and therapeutic strategies. Nutrients. (2022) 14:2200. doi: 10.3390/nu14112200
9. Rizzoni D, Agabiti Rosei C, De Ciuceis C, Semeraro F, Rizzoni M, Docchio F. New methods to study the microcirculation. Am J Hypertens. (2018) 31:265–73. doi: 10.1093/ajh/hpx211
10. Peng SY, Lee YC., Wu IWn, Lee CC, Sun CC, Ding JJ, et al. Impact of blood pressure control on retinal microvasculature in patients with chronic kidney disease. Sci Rep. (2020) 10:14275. doi: 10.1038/s41598-020-71251-z
11. Rizzoni D, De Ciuceis C, Porteri E, Paiardi S, Boari GE, Mortini P, et al. Altered structure of small cerebral arteries in patients with essential hypertension. J Hypertens. (2009) 27:838–45. doi: 10.1097/HJH.0b013e32832401ea
12. Arsalan M, Haider A, Lee YW, Park KR. Detecting retinal vasculature as a key biomarker for deep learning-based intelligent screening and analysis of diabetic and hypertensive retinopathy. Expert Syst Appl. (2022) 200:117009. doi: 10.1016/j.eswa.2022.117009
13. Wu H, Wang W, Zhong J, Lei B, Wen Z, Qin J. Scs-net: a scale and context sensitive network for retinal vessel segmentation. Med Image Anal. (2021) 70:102025. doi: 10.1016/j.media.2021.102025
14. Lin J, Huang X, Zhou H, Wang Y, Zhang Q. Stimulus-guided adaptive transformer network for retinal blood vessel segmentation in fundus images. Med Image Anal. (2023) 89:102929. doi: 10.1016/j.media.2023.102929
15. Wei J, Zhu G, Fan Z, Liu J, Rong Y, Mo J, et al. Genetic U-Net: automatically designed deep networks for retinal vessel segmentation using a genetic algorithm. IEEE Trans Med Imaging. (2021) 41:292–307. doi: 10.1109/TMI.2021.3111679
16. Tan Y, Yang KF, Zhao SX, Li YJ. Retinal vessel segmentation with skeletal prior and contrastive loss. IEEE Trans Med Imaging. (2022) 41:2238–51. doi: 10.1109/TMI.2022.3161681
17. Li Y, Zhang Y, Cui W, Lei B, Kuang X, Zhang T. Dual encoder-based dynamic-channel graph convolutional network with edge enhancement for retinal vessel segmentation. IEEE Trans Med Imaging. (2022) 41:1975–89. doi: 10.1109/TMI.2022.3151666
18. Annunziata R, Trucco E. Accelerating convolutional sparse coding for curvilinear structures segmentation by refining SCIRD-TS filter banks. IEEE Trans Med Imaging. (2016) 35:2381–92. doi: 10.1109/TMI.2016.2570123
19. Marín D, Aquino A, Gegúndez-Arias ME, Bravo JM. A new supervised method for blood vessel segmentation in retinal images by using gray-level and moment invariants-based features. IEEE Trans Med Imaging. (2010) 30:146–8. doi: 10.1109/TMI.2010.2064333
20. Soares JV, Leandro JJ, Cesar RM, Jelinek HF, Cree MJ. Retinal vessel segmentation using the 2-D Gabor wavelet and supervised classification. IEEE Trans Med Imaging. (2006) 25:1214–22. doi: 10.1109/TMI.2006.879967
21. Maninis KK, Pont-Tuset J, Arbeláez P, Van Gool L. Deep retinal image understanding. In: Medical Image Computing and Computer-Assisted Intervention-MICCAI 2016: 19th International Conference, Athens, Greece, October 17-21, 2016, Proceedings, Part II 19. Cham: Springer (2016), p. 140–8. doi: 10.1007/978-3-319-46723-8_17
22. Oliveira A, Pereira S, Silva CA. Retinal vessel segmentation based on fully convolutional neural networks. Expert Syst Appl. (2018) 112:229–42. doi: 10.1016/j.eswa.2018.06.034
23. Yan Z, Yang X, Cheng KT. Joint segment-level and pixel-wise losses for deep learning based retinal vessel segmentation. IEEE Trans Biomed Eng. (2018) 65:1912–23. doi: 10.1109/TBME.2018.2828137
24. Mou L, Chen L, Cheng J, Gu Z, Zhao Y, Liu J. Dense dilated network with probability regularized walk for vessel detection. IEEE Trans Med Imaging. (2019) 39:1392–403. doi: 10.1109/TMI.2019.2950051
25. Wang B, Qiu S, He H. Dual encoding u-net for retinal vessel segmentation. In: Medical Image Computing and Computer Assisted Intervention-MICCAI 2019: 22nd International Conference, Shenzhen, China, October 13-17, 2019, Proceedings, Part I 22. Cham: Springer (2019), p. 84–92. doi: 10.1007/978-3-030-32239-7_10
26. Peng Z, Huang W, Gu S, Xie L, Wang Y, Jiao J, et al. Conformer: local features coupling global representations for visual recognition. In: Proceedings of the IEEE/CVF International Conference on Computer Vision. Montreal, QC: IEEE (2021), p. 367–76. doi: 10.1109/ICCV48922.2021.00042
27. He K, Zhang X, Ren S, Sun J. Deep residual learning for image recognition. In: Proceedings of the IEEE Conference on Computer Vision and Pattern Recognition. Las Vegas, NV: IEEEE (2016), p. 770–8. doi: 10.1109/CVPR.2016.90
28. Dosovitskiy A, Beyer L, Kolesnikov A, Weissenborn D, Zhai X, Unterthiner T, et al. An image is worth 16x16 words: transformers for image recognition at scale. arXiv. (2020) [Preprint]. arXiv:2010.11929. doi: 10.48550/arXiv:2010.11929
29. Ba JL, Kiros JR, Hinton GE. Layer normalization. arXiv. (2016) [Preprint]. arXiv:1607.06450. doi: 10.48550/arXiv:1607.06450
30. Staal J. Abràmoff MD, Niemeijer M, Viergever MA, Van Ginneken B. Ridge-based vessel segmentation in color images of the retina. IEEE Trans Med Imaging. (2004) 23:501–9. doi: 10.1109/TMI.2004.825627
31. Fraz MM, Remagnino P, Hoppe A, Uyyanonvara B, Rudnicka AR, Owen CG, et al. An ensemble classification-based approach applied to retinal blood vessel segmentation. IEEE Trans Biomed Eng. (2012) 59:2538–48. doi: 10.1109/TBME.2012.2205687
32. Hoover A, Kouznetsova V, Goldbaum M. Locating blood vessels in retinal images by piecewise threshold probing of a matched filter response. IEEE Trans Med Imaging. (2000) 19:203–10. doi: 10.1109/42.845178
33. Odstrcilik J, Kolar R, Budai A, Hornegger J, Jan J, Gazarek J, et al. Retinal vessel segmentation by improved matched filtering: evaluation on a new high-resolution fundus image database. IET Image Process. (2013) 7:373–83. doi: 10.1049/iet-ipr.2012.0455
34. Cherukuri V, Bg VK, Bala R, Monga V. Deep retinal image segmentation with regularization under geometric priors. IEEE Trans Image Process. (2019) 29:2552–67. doi: 10.1109/TIP.2019.2946078
35. Drozdzal M, Vorontsov E, Chartrand G, Kadoury S, Pal C. The importance of skip connections in biomedical image segmentation. In: Deep Learning and Data Labeling for Medical Applications. Cham: Springer (2016), p. 179–87. doi: 10.1007/978-3-319-46976-8_19
36. Meng Y, Zhang H, Zhao Y, Gao D, Hamill B, Patri G, et al. Dual consistency enabled weakly and semi-supervised optic disc and cup segmentation with dual adaptive graph convolutional networks. IEEE Trans Med Imaging. (2022) 42:416–29. doi: 10.1109/TMI.2022.3203318
37. Meng Y, Chen X, Zhang H, Zhao Y, Gao D, Hamill B, et al. Shape-aware weakly/semi-supervised optic disc and cup segmentation with regional/marginal consistency. In: International Conference on Medical Image Computing and Computer-Assisted Intervention. Cham: Springer (2022), p. 524–34. doi: 10.1007/978-3-031-16440-8_50
38. Meng Y, Wei M, Gao D, Zhao Y, Yang X, Huang X, et al. CNN-GCN aggregation enabled boundary regression for biomedical image segmentation. In: Medical Image Computing and Computer Assisted Intervention-MICCAI 2020: 23rd International Conference, Lima, Peru, October 4-8, 2020, Proceedings, Part IV 23. Cham: Springer (2020), p. 352–62. doi: 10.1007/978-3-030-59719-1_35
39. Meng Y, Meng W, Gao D, Zhao Y, Yang X, Huang X, et al. Regression of instance boundary by aggregated CNN and GCN. In: Computer Vision-ECCV 2020: 16th European Conference, Glasgow, UK, August 23-28, 2020, Proceedings, Part VIII 16. Cham: Springer (2020), p. 190–207. doi: 10.1007/978-3-030-58598-3_12
40. Meng Y, Zhang Y, Xie J, Duan J, Joddrell M, Madhusudhan S, et al. Multi-granularity learning of explicit geometric constraint and contrast for label-efficient medical image segmentation and differentiable clinical function assessment. Med Image Anal. (2024) 95:103183. doi: 10.1016/j.media.2024.103183
41. Wu Z, Shen C, Hengel AD. Bridging category-level and instance-level semantic image segmentation. arXiv. (2016) [Preprint]. arXiv:1605.06885. doi: 10.48550/arXiv.1605.06885
42. Zhang Y, Meng Y, Zheng Y. Automatically segment the left atrium and scars from LGE-MRIs using a boundary-focused nnU-Net. In: Challenge on Left Atrial and Scar Quantification and Segmentation. Cham: Springer (2022), p. 49–59. doi: 10.1007/978-3-031-31778-1_5
43. Yang X, Wang N, Wang Y, Wang X, Nezafat R, Ni D, et al. Combating uncertainty with novel losses for automatic left atrium segmentation. In: International Workshop on Statistical Atlases and Computational Models of the Heart. Cham: Springer (2018), p. 246–54. doi: 10.1007/978-3-030-12029-0_27
44. Meng Y, Zhang H, Zhao Y, Yang X, Qiao Y, MacCormick IJ, et al. Graph-based region and boundary aggregation for biomedical image segmentation. IEEE Trans Med Imaging. (2021) 41:690–701. doi: 10.1109/TMI.2021.3123567
45. Ronneberger O, Fischer P, Brox T. U-net: convolutional networks for biomedical image segmentation. In: International Conference on Medical Image Computing and Computer-Assisted Intervention. Cham: Springer (2015), p. 234–41. doi: 10.1007/978-3-319-24574-4_28
46. Zhou Z, Siddiquee MMR, Tajbakhsh N, Liang J. UNet++: a nested U-net architecture for medical image segmentation. In: Deep Learning in Medical Image Analysis and Multimodal Learning for Clinical Decision Support. Cham: Springer (2018), p. 3–11. doi: 10.1007/978-3-030-00889-5_1
47. Liu Z, Lin Y, Cao Y, Hu H, Wei Y, Zhang Z, et al. Swin transformer: hierarchical vision transformer using shifted windows. In: Proceedings of the IEEE/CVF International Conference on Computer Vision. Montreal, QC: IEEE (2021), p. 10012–22. doi: 10.1109/ICCV48922.2021.00986
48. Oktay O, Schlemper J, Folgoc LL, Lee M, Heinrich M, Misawa K, et al. Attention U-net: learning where to look for the pancreas. arXiv [Preprint]. arXiv:1804.03999 (2018).
49. Chen J, Lu Y, Yu Q, Luo X, Adeli E, Wang Y, et al. Transunet: transformers make strong encoders for medical image segmentation. arXiv [Preprint]. arXiv:2102.04306 (2021). doi: 10.48550/arXiv:2102.04306
50. Laibacher T, Weyde T, Jalali S. M2u-net: effective and efficient retinal vessel segmentation for real-world applications. In: Proceedings of the IEEE/CVF Conference on Computer Vision and Pattern Recognition Workshops. Long Beach, CA: IEEE (2019). doi: 10.1109/CVPRW.2019.00020
51. Hua D, Xu Y, Zeng X, Yang N, Jiang M, Zhang X, et al. Use of optical coherence tomography angiography for assessment of microvascular changes in the macula and optic nerve head in hypertensive patients without hypertensive retinopathy. Microvasc Res. (2020) 129:103969. doi: 10.1016/j.mvr.2019.103969
Keywords: retinal vessel segmentation, hypertensive retinopathy quantification, deep learning, cross-attention network, color fundus images
Citation: Liu X, Tan H, Wang W and Chen Z (2024) Deep learning based retinal vessel segmentation and hypertensive retinopathy quantification using heterogeneous features cross-attention neural network. Front. Med. 11:1377479. doi: 10.3389/fmed.2024.1377479
Received: 27 January 2024; Accepted: 09 May 2024;
Published: 22 May 2024.
Edited by:
Yanda Meng, University of Exeter, United KingdomCopyright © 2024 Liu, Tan, Wang and Chen. This is an open-access article distributed under the terms of the Creative Commons Attribution License (CC BY). The use, distribution or reproduction in other forums is permitted, provided the original author(s) and the copyright owner(s) are credited and that the original publication in this journal is cited, in accordance with accepted academic practice. No use, distribution or reproduction is permitted which does not comply with these terms.
*Correspondence: Zhangrong Chen, Y2hlbnpoYW5ncm9uZzcxQDE2My5jb20=