
95% of researchers rate our articles as excellent or good
Learn more about the work of our research integrity team to safeguard the quality of each article we publish.
Find out more
ORIGINAL RESEARCH article
Front. Med. , 17 April 2023
Sec. Geriatric Medicine
Volume 10 - 2023 | https://doi.org/10.3389/fmed.2023.928285
This article is part of the Research Topic Molecular and Physiological Aspects of Sarcopenia in the Older Person: Mechanisms, Diagnostics and Therapy View all 12 articles
 Zeinab Abdelrahman1,2,3†
 Xiaosheng Wang4,5†
 Daming Wang1
 Tianfang Zhang1
 Yue Zhang6
 Xuhua Wang1,2,3,7*
 Zuobing Chen1*
Introduction: Sarcopenia is a progressive deterioration of skeletal muscle mass strength and function.
Methods: To uncover the underlying cellular and biological mechanisms, we studied the association between sarcopenia's three stages and the patient's ethnicity, identified a gene regulatory network based on motif enrichment in the upregulated gene set of sarcopenia, and compared the immunological landscape among sarcopenia stages.
Results: We found that sarcopenia (S) was associated with GnRH, neurotrophin, Rap1, Ras, and p53 signaling pathways. Low muscle mass (LMM) patients showed activated pathways of VEGF signaling, B-cell receptor signaling, ErbB signaling, and T-cell receptor signaling. Low muscle mass and physical performance (LMM_LP) patients showed lower enrichment scores in B-cell receptor signaling, apoptosis, HIF-1 signaling, and the adaptive immune response pathways. Five common genes among DEGs and the elastic net regression model, TTC39DP, SLURP1, LCE1C, PTCD2P1, and OR7E109P, were expressed between S patients and healthy controls. SLURP1 and LCE1C showed the highest expression levels among sarcopenic Chinese descent than Caucasians and Afro-Caribbeans. Gene regulatory analysis of top upregulated genes in S patients yielded a top-scoring regulon containing GATA1, GATA2, and GATA3 as master regulators and nine predicted direct target genes. Two genes were associated with locomotion: POSTN and SLURP1. TTC39DP upregulation was associated with a better prognosis and stronger immune profile in S patients. The upregulation of SLURP1 and LCE1C was associated with a worse prognosis and weaker immune profile.
Conclusion: This study provides new insight into sarcopenia's cellular and immunological prospects and evaluates the age and sarcopenia-related modifications of skeletal muscle.
Sarcopenia is a syndrome characterized by a progressive deterioration of the skeletal muscle mass strength and function with a risk of developing adverse outcomes, such as motor disability and death (1). The study of sarcopenia and the development of preventive or therapeutic approaches represent public health priorities. The European Working Group on Sarcopenia in Older People (EWGSOP) recommends categorizing sarcopenia into three groups, namely pre-sarcopenia, sarcopenia, and severe sarcopenia (1). They proposed that the pre-sarcopenia stage is characterized by low muscle mass with no impact on muscle strength or physical performance, whereas the sarcopenia stage is characterized by low muscle mass with low muscle strength or low physical performance, and severe sarcopenia is characterized by the presence of all three criteria (1). Low physical performance is defined as a gait speed of <0.8 m/s, while low muscle strength is defined by handgrip strength of <30 kg for men and <20 kg for women (1). Low muscle mass is measured by a skeletal muscle mass index from 7.23 to 8.87 kg/m2 in men and from 5.45 to 6.42 kg/m2 in women (2). The pathophysiology of sarcopenia stages is still complex and partially characterized. There is an inadequate understanding of the underlying cellular and biological mechanisms driving the development of this disease. Till today, the current understanding of the regulation of muscle mass is mainly derived from animal studies data, with limited knowledge of the key regulatory processes in human muscle or blood. Animal studies suggested that the PI3k-Akt pathway is strongly linked to muscle synthesis (3). Most studies on sarcopenia in humans have suggested that a reduced synthetic response primarily drives the loss of muscle mass termed as anabolic resistance (4, 5).
The decline in immune function with age, known as immunosenescence, has been well-documented (6, 7). Immunosenescence includes inflammaging, which is the presence of a chronic proinflammatory state with age (8). Inflammaging is characterized by increased levels of proinflammatory cytokines, such as interleukin 1β (IL1β), interleukin 6 (IL6), tissue necrosis factor-alpha (TNFα), C-reactive protein (CRP), and a reduced level of anti-inflammatory cytokines, such as interleukin 10 (IL10) (8). Investigation of the immune system's role in different sarcopenia stages shows that the immune system's dysregulation may play a role in disease progression (8).
The current knowledge on the available sarcopenia biomarkers, such as functional, biological, or imaging-related biomarkers, that could be utilized in clinical trials remains inadequate. This study aimed to uncover the underlying cellular and biological mechanisms driving the development of sarcopenia and identify novel pathways and biomarkers that differentiate between different sarcopenia stages using unsupervised and supervised machine learning methods. Then, we studied the association of sarcopenia's three stages with the patient's ethnicity. In addition, we identified gene regulatory network mapping based on motif enrichment in the upregulated gene set of sarcopenia and identified the gene modules of coexpressed genes among the three sarcopenia stages. Finally, we compared the immunological landscape among sarcopenia stages based on their gene expression profiles. This study aimed to provide new insight into sarcopenia's cellular and immunological prospects, which is considered reliable and promising to evaluate the age and sarcopenia-related modifications of skeletal muscle.
We downloaded the RNA-Seq gene expression in human muscle biopsies of 119 older adults (GSE111017) from the Gene Expression Omnibus (GEO) (https://www.ncbi.nlm.nih.gov/geo/). This dataset includes three individual datasets: Hertfordshire Sarcopenia, Jamaica Sarcopenia, and Singapore Sarcopenia. Hertfordshire's Caucasian dataset includes four sarcopenia patients with low muscle strength and physical performance, five with low muscle mass strength, three with low physical performance, and 28 healthy individuals (aged 68–77 years). The inclusion criteria of the Hertfordshire Caucasian dataset were the availability of birth records detailing birth weight, and men were excluded if they had heart disease, myositis, neuromuscular conditions, or diabetes. The diagnosis of sarcopenia among Caucasians was based on the EWGSOP algorithm (1, 9). Jamaica's Afro-Caribbean dataset includes nine sarcopenia patients with low muscle strength and physical performance, five with low muscle mass strength, 11 with low physical performance, and 14 healthy individuals, and all participants were of at least three grandparents of African origin (aged 63–89 years) (9). The diagnosis of sarcopenia among Afro-Caribbeans was also based on the EWGSOP definition (1). Singapore's Chinese dataset includes 20 sarcopenia patients and 20 healthy individuals without information on low muscle mass strength and the physical performance of older adults (aged 65–79 years). Each Chinese participant gave written self-reported ethnicity, and the diagnosis of sarcopenia was based on the AWGSOP definition (10). Lean mass was measured using DXA scanning (9). We merged the three datasets using the “merge” function in the R package “base”, performed batch effects adjustment, and normalized the combined data for further analyses.
We used the single-sample gene-set enrichment analysis (ssGSEA) score (11) to evaluate the enrichment level of an immune signature in older adults based on the expression profiles of its marker genes. The ssGSEA score represents the enrichment score of a gene set in a sample based on the degree to which the gene set is coordinately upregulated/downregulated in the sample. We analyzed 30 immune signatures, including anti-inflammatory cytokines, B cells, CD4+ Regulatory T cells, CD8+ T cells, central memory T cells, cytolytic activity, cytolytic protein perforin, dendritic cells, effector memory T cell, effector T cell, effector Treg T cells, exhausted T cell, granulocyte, IGF1, immune-modulatory molecules, macrophages, MHC Class I, myokines, naive T cell, NK antimicrobial protein granulysin, NK encoded activating receptors, NK encoded inhibitory receptors, proinflammatory cytokines, resident memory T cell, resting Treg T cells, senescence-associated secretory phenotype (SASP), Th1 cells, Th2 cells, Type I IFN response, and Type II IFN response. The gene sets representing these immune signatures are listed in Supplementary material S1.
We identified differentially expressed genes (DEGs) between sarcopenia (S) and non-sarcopenia, low muscle mass (LMM)/non, and low physical performance (LMM_LP)/non using Student's t-test with a threshold of adjusted P-value [false discovery rate (FDR)] of <0.05 and fold change (FC) of mean expression levels of >1.3. Based on the DEGs, we identified KEGG (12) and GO (13) pathways differentially enriched between the identified groups using the “pathfindR” R package (14), with a threshold of FDR <0.05. The FDR was calculated by using the Bonferroni method (15).
We predicted sarcopenia (S) patients vs. non-sarcopenia control individuals based on the combined gene expression profiles. We performed 3-fold cross-validation (CV) in 33 sarcopenia patients and 86 control individuals. We trained the elastic net regression model classifier and predicted sarcopenia patients vs. non-sarcopenia control individuals. We used the CV to select the best λ with a fixed α parameter of 0.5. We reported the prediction performance (accuracy, specificity, balanced accuracy, and the Kappa statistic) in the 3-fold CV. We carried out the class prediction algorithm in the “caret” R package (16).
We used iRegulon software (17) to directly enable gene regulatory network mapping based on motif enrichment in the upregulated gene set of S patients. The library of motifs used was 10K [9,713 position weight matrices (PWMs)], track collection of 1,120 ChiP-seq tracks, the putative regulatory region of 20 kb centered around transcription start site (TSS), motif ranking database 20 kb centered around TSS (seven species), and track ranking database of 20 kb centered around TSS (ChiP-seq-derived). In addition, we used an enrichment score threshold of 3.0, a ROC threshold for AUC calculation of 0.03, and a rank threshold of 5,000. For transcription factor (TF) prediction, the maximum FDR on the motif similarity threshold was 0.001. The weighted gene coexpression network analysis (WGCNA) was used to identify the gene modules of coexpressed genes among the three sarcopenia stages (LMM, LMM_LP, and S). Based on the expression correlations between the hub genes in gene modules, we identified the enriched GO pathways that have significant correlations with specific traits. We analyzed the WGCNA using the R package “WGCNA” (18).
We used Student's t-tests (two-tailed) to compare two classes of samples. In comparisons among three classes of samples, we used ANOVA tests (two-tailed). In evaluating correlations between gene expression levels and immune signatures' enrichment levels and between expression correlations between two genes, we used Pearson's correlation coefficients (R). We employed FDR to adjust P-values in multiple tests. The FDR was calculated using the Benjamini–Hochberg methods. We used abbreviations of S, LMM, and LMM_LP to represent sarcopenia, low muscle mass, and low muscle mass with low physical performance but without sarcopenia, respectively.
We first identified the transcriptional signature of S patients compared to healthy individuals. This analysis revealed significant expression differences in sarcopenia patients in 459 unique protein-coding transcripts (419 upregulated and 40 downregulated genes, Supplementary material S1). In LMM patients, we found 74 unique protein-coding transcripts (60 upregulated and 14 downregulated genes, Supplementary material S1). In LMM_LP patients, we found 27 unique protein-coding transcripts (20 upregulated and seven downregulated genes, Supplementary material S1). There were five common genes among the three sets of DEGs, including AC092184.1 (uncategorized gene); FAM239B (family with sequence similarity 239 member B pseudogene); HSFX2 (heat shock transcription factor family, X-linked 2); PTCD2P1 (pentatricopeptide repeat domain 2 pseudogene 1); and SLURP1 (secreted LY6/PLAUR domain containing 1).
We analyzed pathway enrichment on significant genes to identify activated or repressed pathways in a given sample or group. We calculated the agglomerated z-score of each enriched pathway per sample, followed by unsupervised hierarchical clustering of the most significant KEGG and GO pathways between the pre-defined groups. We found that sarcopenia was associated with increased expression of genes related to the GnRH, neurotrophin, Rap1, Ras, and p53 signaling pathways (Figure 1A). In addition, we found that sarcopenia patients showed significant enrichment in RNA polymerase II-specific DNA-binding transcription factor binding and negative regulation of cyclin-dependent protein serine/threonine kinase activity pathways (Figure 1B). Furthermore, the significantly activated pathways in LMM patients included the VEGF, B-cell receptor, ErbB, and T-cell receptor signaling pathways (Figures 1C, D). Interestingly, LMM_LP patients showed lower enrichment scores in the B-cell receptor signaling, apoptosis, HIF-1 signaling, and the adaptive immune response pathways than LMM patients (Figures 1E, F). These results indicate that immune responses and biological and metabolic dysregulation occurred simultaneously with the patient's muscle mass and function deterioration.
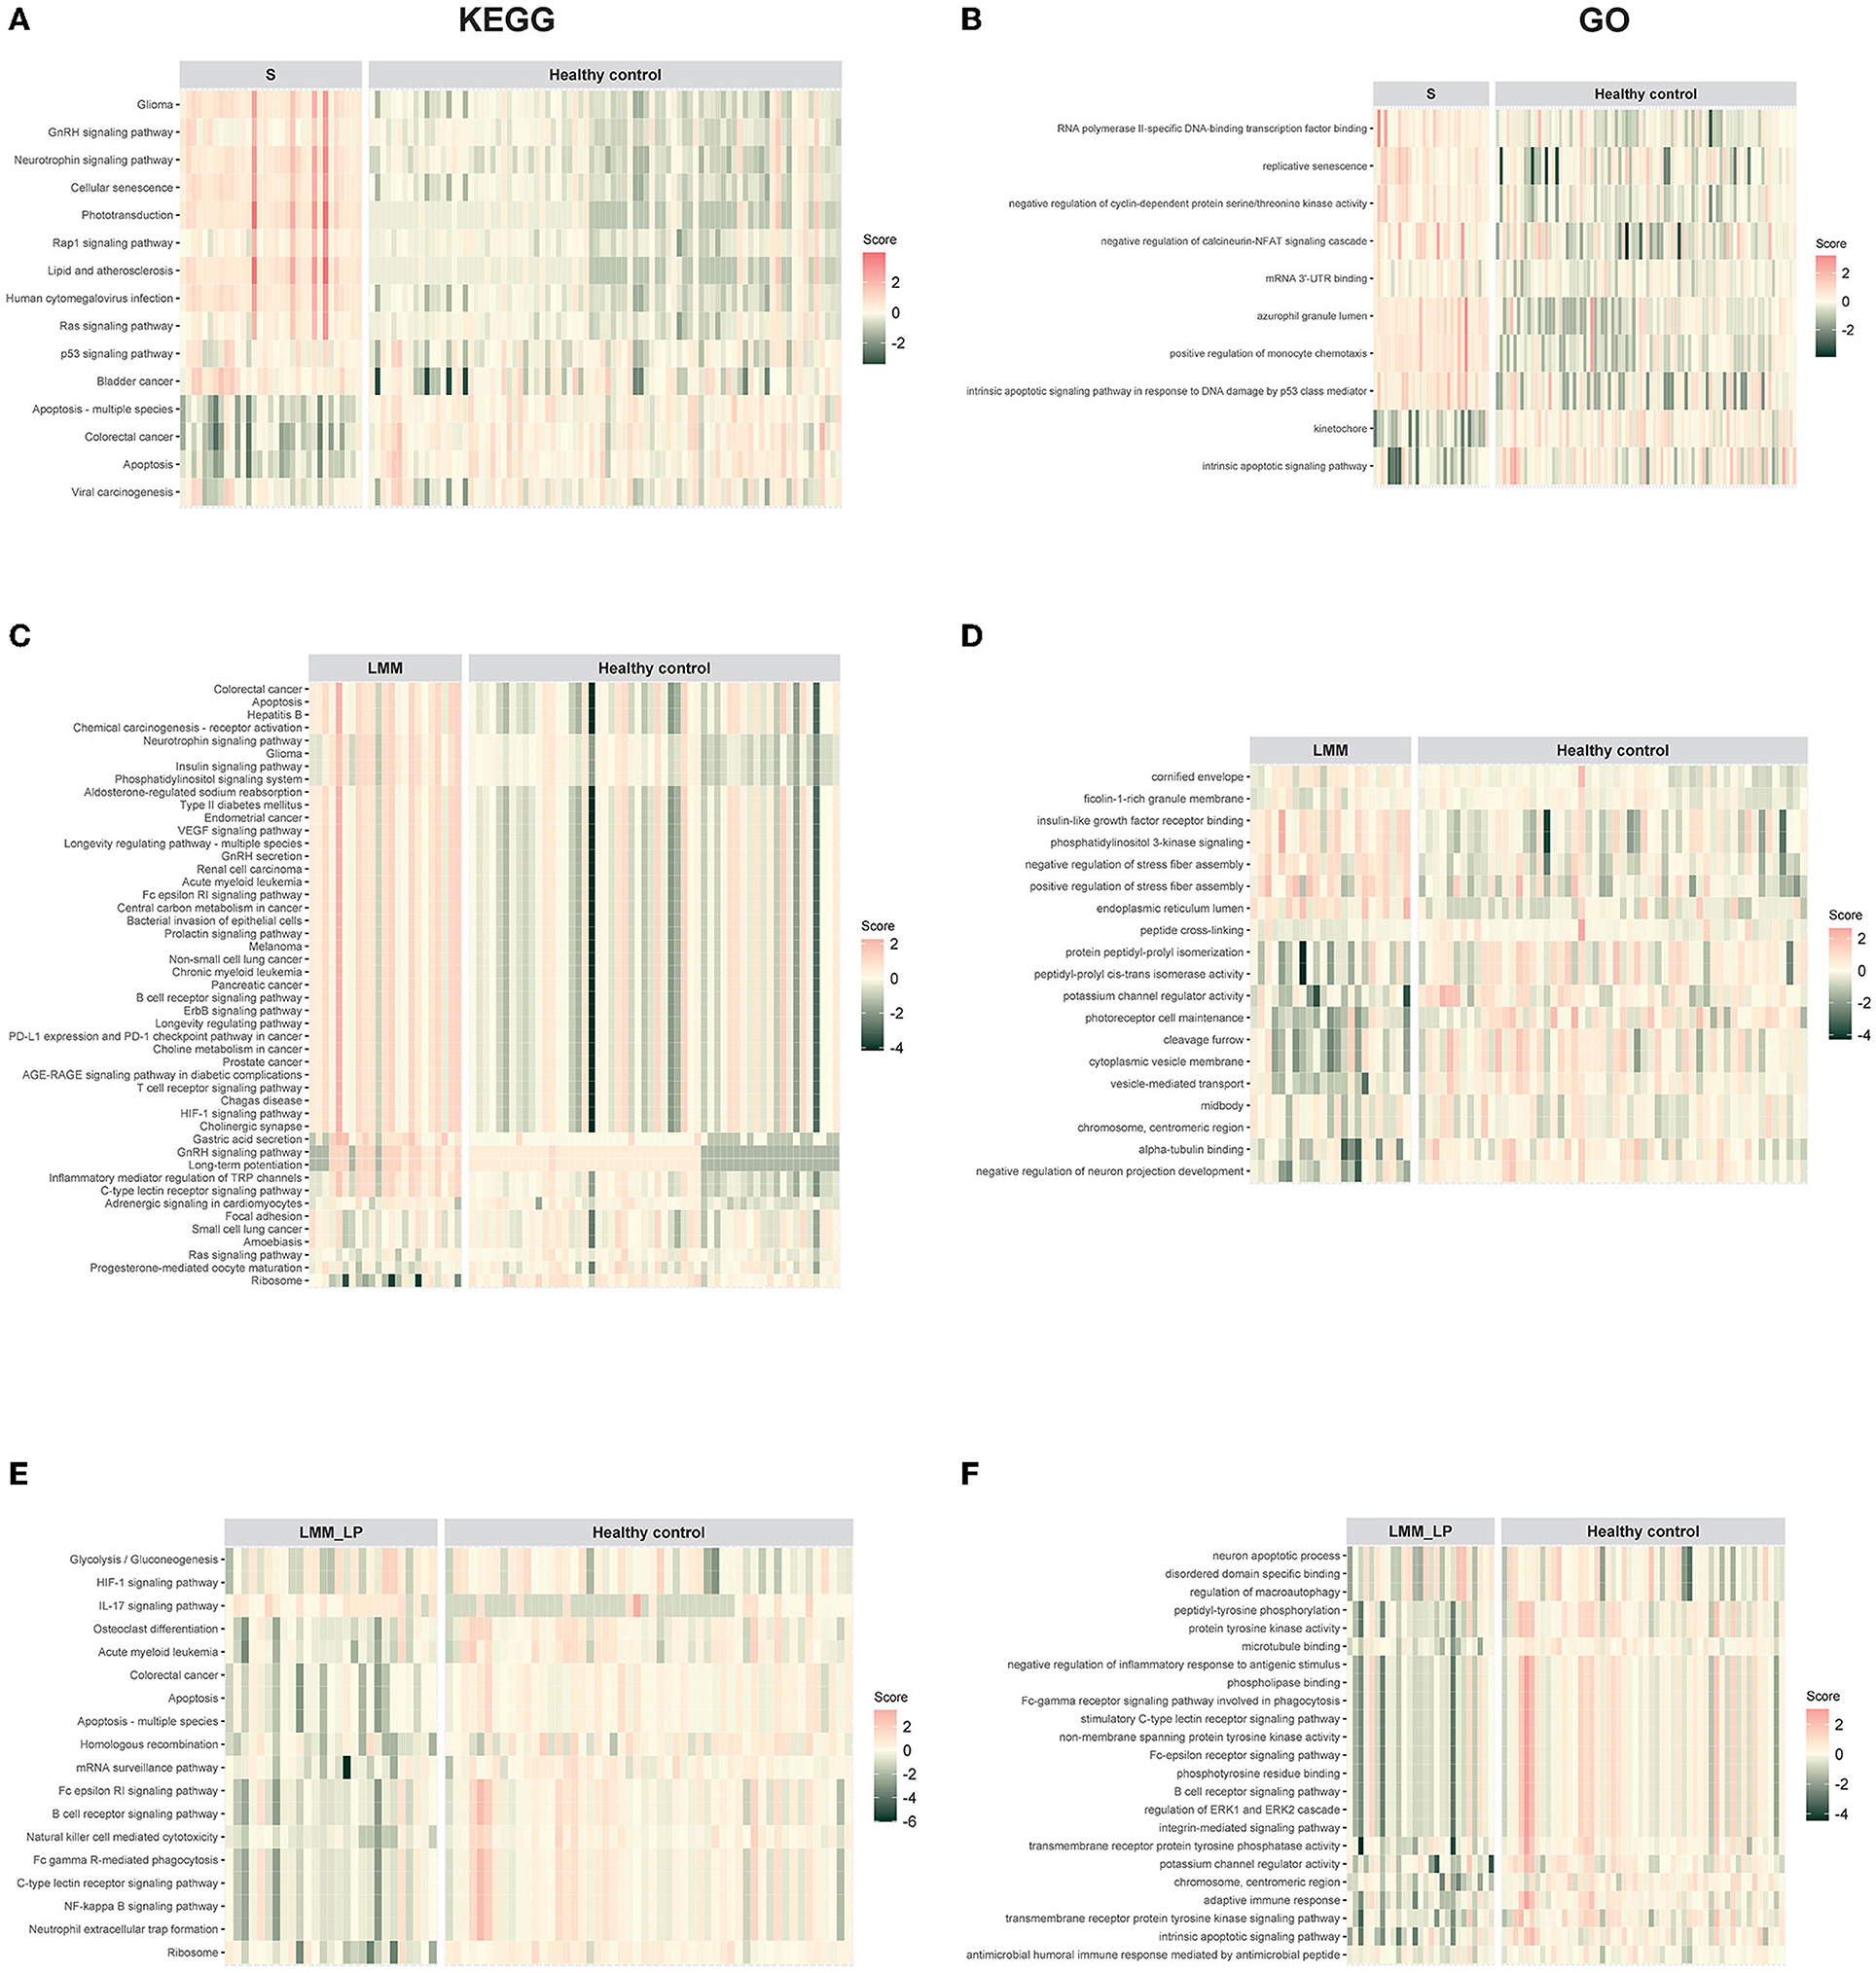
Figure 1. Pathway enrichment analysis for sarcopenia (S), low muscle mass (LMM), and low muscle mass with physical performance (LMM_LP) by unsupervised hierarchical clustering. (A) KEGG and (B) GO pathways enrichment analysis for sarcopenia (S) vs. healthy controls. (C) KEGG and (D) GO pathways enrichment analysis for low muscle mass (LMM) vs. healthy controls. (E) KEGG and (F) GO pathways enrichment analysis for low muscle mass with physical performance (LMM_LP) vs. healthy controls. The enrichment agglomerated z-score was calculated for each enriched term per sample.
To identify the fewest transcripts as diagnostic biomarkers for S patients, we used the elastic net regression to derive a discriminating model in the transcriptomic data from S patients and healthy controls. We trained this model on multiple random samples of the transcriptomic data using CV and ranked all the genes based on their regression coefficients (Figure 2A). Among deferentially expressed genes (DEGs) and the elastic net regression model, we found five common genes (TTC39DP, SLURP1, LCE1C, PTCD2P1, and OR7E109P) that discriminated between sarcopenia patients and healthy controls with a different range (Figure 2A). The relative expressions of these genes were generally upregulated or downregulated in sarcopenia patients than in healthy controls (Figure 2B). To alleviate sampling error, we performed 3-fold CV train/test sequences to obtain an average accuracy of 0.97, 95% CI of 0.8871 and 0.9995, kappa of 0.95, a sensitivity of 0.97, a specificity of 1.00, and a balanced accuracy of 0.98. Among these top-ranked genes, we found that SLURP1 and LCE1C were upregulated in S patients, while TTC39DP, OR7E109P, and PTCD2P1 were downregulated in them (Figure 2B). TTC39DP (tetratricopeptide repeat domain 39D, pseudogene) was the highest ranked among the five genes and discriminated between S patients and healthy controls with a regression coefficient of 95.99. SLURP1 and LCE1C discriminated between S patients and healthy controls with regression coefficients of 62.45 and 34.54, respectively (Figure 2A).
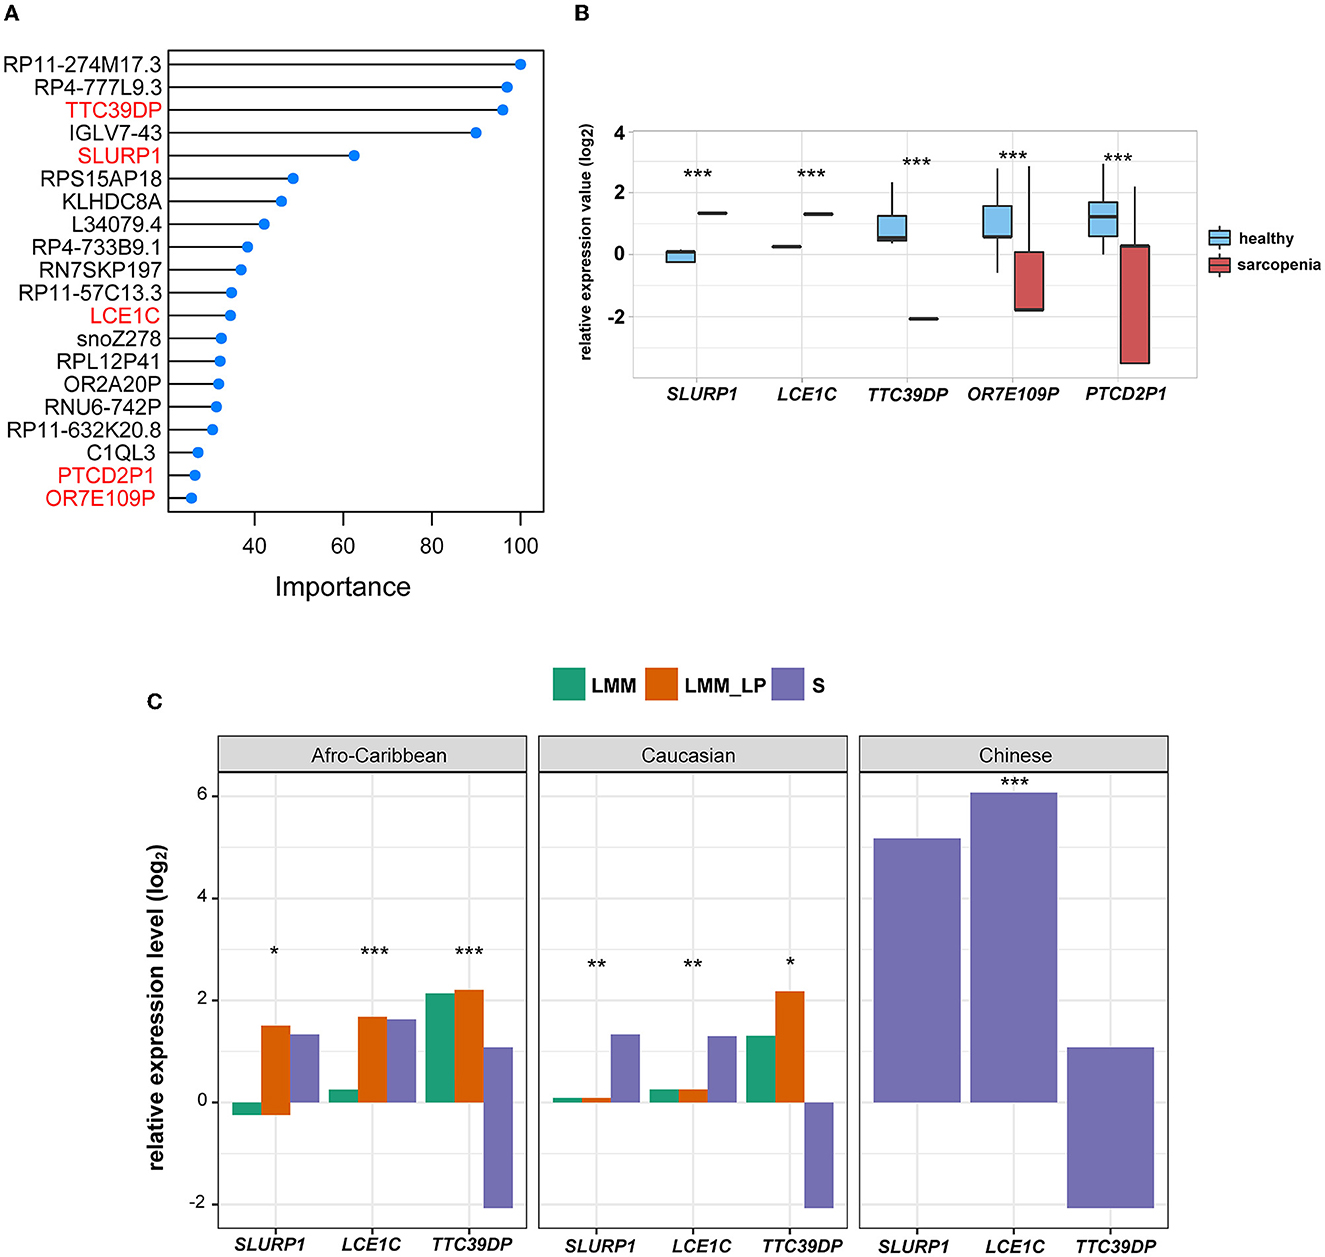
Figure 2. Discrimination of sarcopenia from healthy states using elastic net regression model and the association of the novel biomarkers with patient's ethnicity. (A) The elastic regression model discriminates sarcopenia from a healthy control based on gene expression profile. Model importance was identified as regression coefficients. (B) Comparison of the expression levels of the top-ranked genes between sarcopenia and the healthy controls between differentially expressed gene analysis and the elastic net regression model (t-test, p-values are shown. *p < 0.5, **p < 0.01, and ***p < 0.001). (C) Comparison of the expression levels of SLURP1, LCE1C, and TTC39DP among the S, LMM, and LMM_LP groups (ANOVA test, p-values are shown. *p < 0.5, **p < 0.01, and ***p < 0.00).
We further analyzed the expression differences of TTC39DP, SLURP1, and LCE1C in S, LMM, and LMM_LP among Caucasian, Afro-Caribbean, and Chinese descents (Figure 2C). SLURP1 and LCE1C showed the highest expression levels in sarcopenic Chinese descent. In addition, SLURP1 expression levels were higher in the S group of Caucasian descent than in the LMM and LMM_LP groups. SLURP1 expression levels were higher in the LMM_LP group of Afro-Caribbean descent than in the S and LMM groups. TTC39DP showed the maximum expression levels among the LMM_LP group of Caucasian and Afro-Caribbean descent. These results indicate that different expression levels of TTC39DP, SLURP1, and LCE1C among the pre-defined groups depend on the patient's ethnicity.
We analyzed 96 significantly upregulated genes under S status using iRegulon software. The analysis yields a top-scoring regulon containing GATA1, GATA2, and GATA3 as master regulators and nine predicted direct target genes, namely EHF, SLURP1, MYEOV, SERPINB2, SERPINA12, ARHGAP40, PCDH15, SULT2B1, and POSTN (Figure 3A). The predicted GATA1, GATA2, and GATA3 targets are likely functional targets associated with the different pathways, including signaling, response to stimulus, regulation of the biological process, multicellular organismal process, metabolic process, locomotion, localization, growth, developmental process, cellular process, biological regulation, and biological adhesion behavior (Figure 3B). Interestingly, two genes were associated with locomotion: POSTN and SLURP1. POSTN has been associated with metastatic outgrowth in melanoma (19), while the association of SLURP1 with locomotion remains limited.
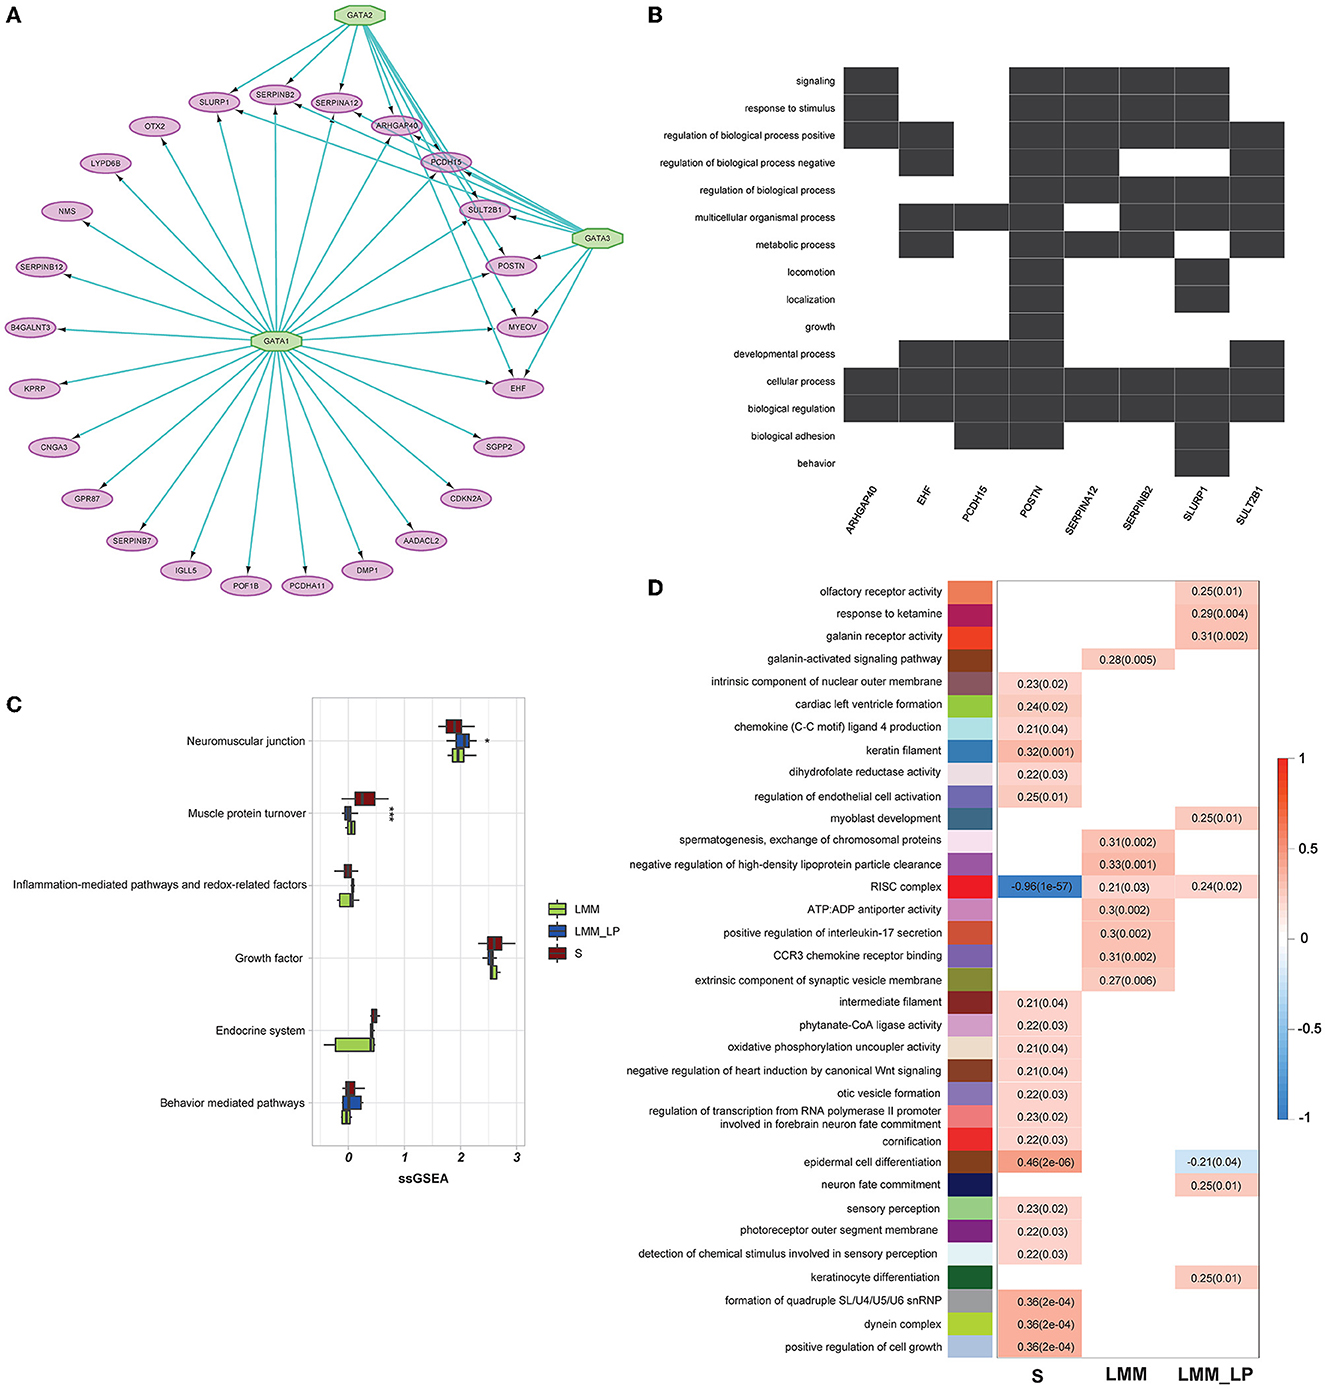
Figure 3. Gene regulatory, weighted correlation networks, and pathophysiological mechanisms of different sarcopenia stages, low muscle mass, and low physical performance patients. (A) Gene regulatory network of the top upregulated genes under sarcopenia using iRegulon software. Results show GATA1, 2, and 3 as top regulators and their relationship with the nine predicted direct targets. (B) Heatmap-like functional classification depicts the linkages of predicted genes and biological concepts (e.g., GO terms or KEGG pathways). (C) Comparison of the pathophysiological mechanisms between the S, LMM, and LMM_LP groups (ANOVA test, p-values are shown. *p < 0.5, **p < 0.01, and ***p < 0.00). (D) Significant gene modules and their representative gene ontology differentially enriched between sarcopenia (S), low muscle mass (LMM), and low muscle mass with physical performance (LMM_LP), which were identified by WGCNA. The P-values are shown in parentheses.
Furthermore, we conducted further analysis to investigate biomarkers of different sarcopenia stages, according to different pathophysiologic mechanisms. These mechanisms include the neuromuscular junction, endocrine system, growth factor, muscle protein turnover, behavior-mediated pathways, inflammation-mediated pathways, and redox-related factors (20). However, due to the small sample size, significant results were found only in muscle protein turnover and neuromuscular junction pathways (Figure 3C). As expected, muscle protein turnover and neuromuscular junction pathways were higher and lower with severe sarcopenic patients than with LMM and LMM_LP, respectively. These results indicate the association of sarcopenia with the impairment of neurophysiological functions, alteration in the transduction of the action potentials of muscle, and structural alterations of the muscles.
In addition, WGCNA identified 34 significant gene modules differentially enriched between the S, LMM, and LMM_LP groups (Figure 3D). The 34 representative colors of these modules are indicated in salmon2, maroon, orangered1, sienna4, lightpink4, yellowgreen, paleturquoise, steelblue, lavenderblush2, lightslateblue, skyblue4, thistle1, mediumorchid, red, violet, coral3, mediumpurple3, yellow4, indianred4, plum, antiquewhite2, mediumpurple4, salmon4, mediumpurple2, lightcoral, brown2, saddle brown, lightgreen, darkmagenta, lightcyan, darkgreen, grey60, greenyellow, and lightsteelblue. The representative GO terms for these gene modules were olfactory receptor activity, response to ketamine, galanin receptor activity, galanin-activated signaling pathway, intrinsic component of nuclear outer membrane, cardiac left ventricular formation, chemokine (C-C motif) ligand 4 production, keratin filament, dihydrofolate reductase activity, regulation of endothelial cell activation, myoblast development, spermatogenesis exchange of chromosomal protein, negative regulation of high-density lipoprotein particle clearance, RISC complex, ATP:ADP antiporter activity, positive regulation of interleukin-17 secretion, CCR3 chemokine receptor binding, extrinsic component of synaptic vesicle membrane, intermediate filament, phytanate-CoA ligase activity, oxidative phosphorylation uncoupler activity, negative regulation of heart induction by canonical Wnt signaling, otic vesicle formation, regulation of transcription from RNA polymerase II promoter involved in forebrain neuron fate commitment, cornification, epidermal cell differentiation, neuron fate commitment, sensory perception, photoreceptor outer segment membrane, detection of chemical stimulus involved in sensory perception, keratinocyte differentiation, formation of quadruple SL/U4/U5/U6 snRNP, dynein complex, and positive regulation of cell growth, respectively.
The S group was associated with enriched pathways of intrinsic component of the nuclear outer membrane, cardiac left ventricle formation, chemokine (C-C motif) ligand 4 production, keratin filament, dihydrofolate reductase activity, regulation of endothelial cell activation, intermediate filament, phytanate-CoA ligase activity, oxidative phosphorylation uncoupler activity, negative regulation of heart induction by canonical Wnt signaling, otic vesicle formation, regulation of transcription from RNA polymerase II promoter involved in forebrain neuron fate commitment, cornification, epidermal cell differentiation, sensory perception, photoreceptor outer segment membrane, detection of chemical stimulus involved in sensory perception, formation of quadruple SL/U4/U5/U6 snRNP, dynein complex, and positive regulation of cell growth (Figure 3D). In contrast, the red RISC complex module was negatively associated with the S group. Moreover, the LMM and LMM_LP groups shared two common pathways with the S group, namely epidermal cell differentiation and the RISC complex. The RISC complex pathway was highly enriched in the LMM and LMM_LP groups, while the S group observed the opposite. Interfering RNAs (siRNAs) and microRNAs (miRNAs) act via RNA-induced silencing complexes (RISC) and can regulate gene transcripts negatively (21). RISC involves many biological processes, such as brain aging (21). It has been proven that the dysregulation of miRNA expression has been associated with reduced muscle plasticity (22), as observed in our results, and, as a consequence, will impair skeletal muscle adaptations to exercise (22).
We analyzed the association of different immune signatures with patients' muscle mass and function deterioration. First, we conducted a t-test analysis to identify the immune signatures (30 immune signatures) differentiating sarcopenia from healthy individuals. A total of 14 immune signatures significantly differentiated sarcopenia from healthy individuals (Figure 4A). Only proinflammatory cytokines were significantly upregulated in sarcopenia than in healthy controls. In contrast, Th1&Th2 cells, resident memory T cells, NK activating receptor, NK antimicrobial protein granulysin, granulocytes, exhausted T cells, effector memory T cells, cytolytic protein perforin, cytolytic activity, CD4+ T cells, B cells, and anti-inflammatory cytokines were less enriched in sarcopenia patients than in healthy controls. Second, we used the ANOVA test to compare immune signatures' expression levels among the S, LMM, and LMM_LP groups. In total, nine immune signatures significantly differentiate the three groups (Figure 4B). Type I IFN response and dendritic cells were higher in sarcopenia patients than in the other two groups. However, signatures of Th1&Th2 cells, resident memory T cells, granulocytes, CD4+ T cells, B cells, and anti-inflammatory cytokines declined with worsening muscle function and disease progression. These results strongly correlate immune system dysregulation with disease progression and muscle function deterioration.
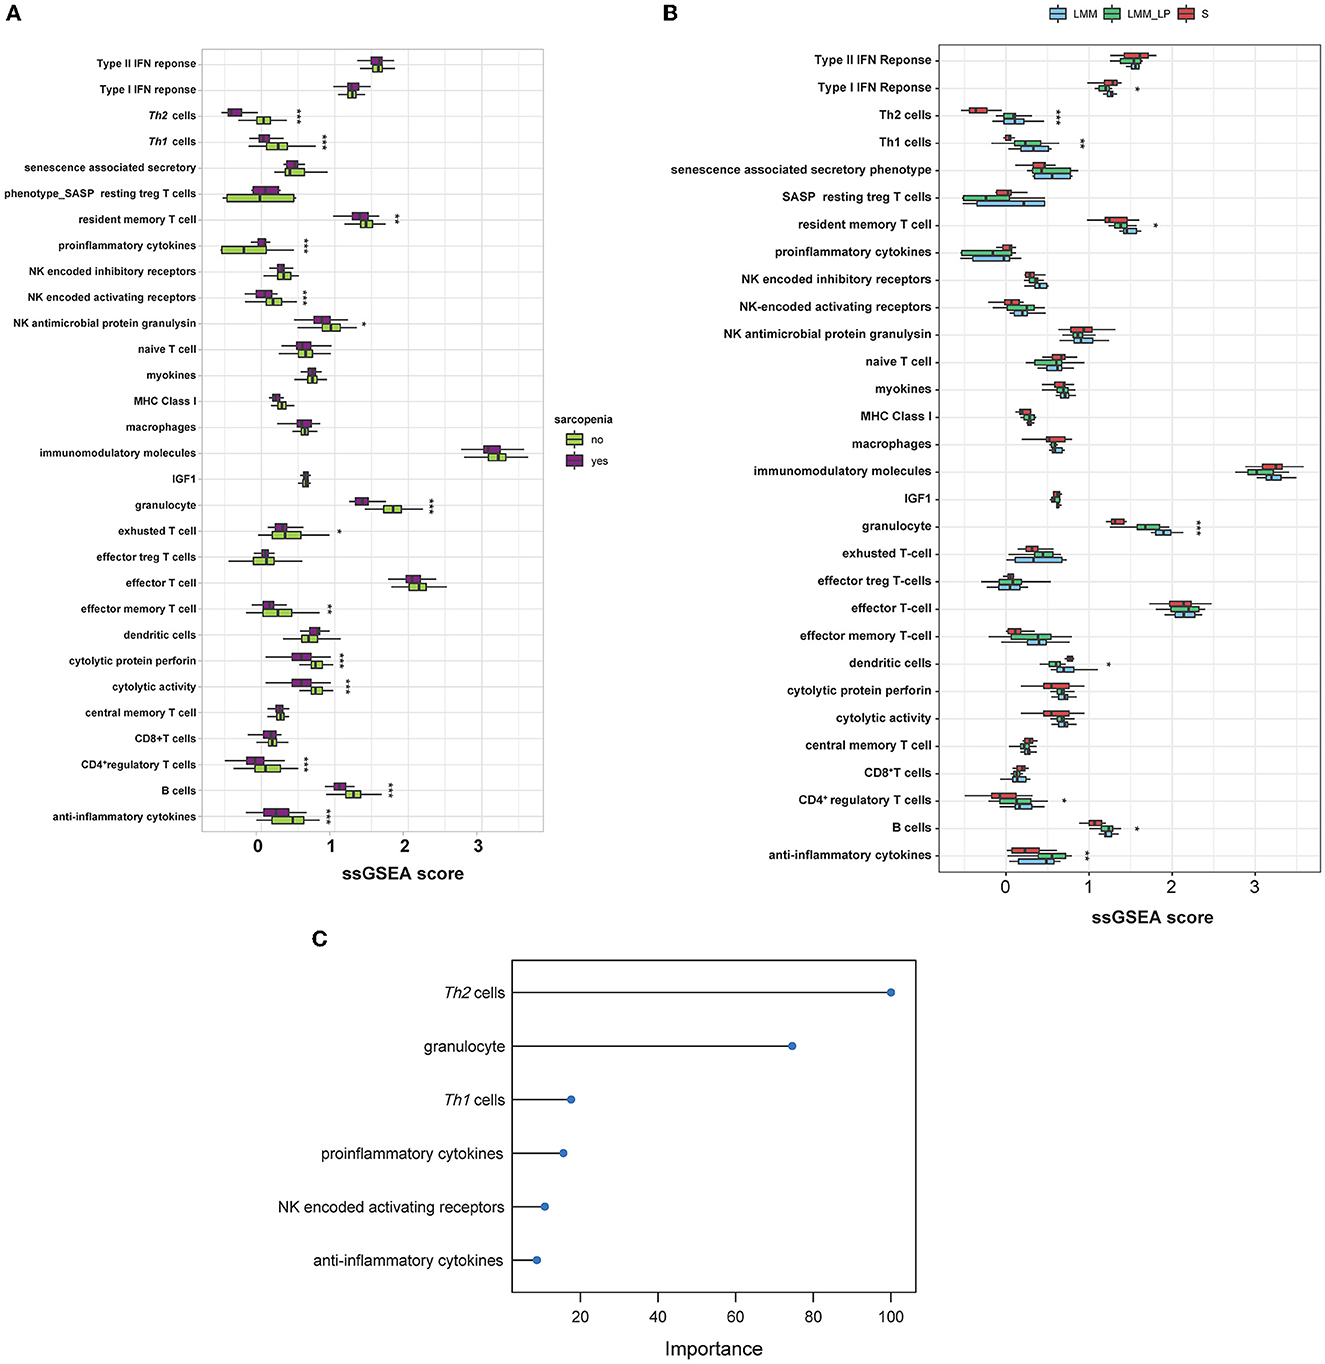
Figure 4. Immunological landscape of the S, LMM, and LMM_LP groups. (A) Comparison of 30 immune signature expression levels between sarcopenia and healthy controls (t-test, p-values are shown. *p < 0.5, **p < 0.01, and ***p < 0.00). (B) Comparison of 30 immune signature expression levels between the S, LMM, and LMM_LP groups (ANOVA test, p-values are shown. *p < 0.5, **p < 0.01, and ***p < 0.00). (C) The elastic regression model discriminates sarcopenia from a healthy control based on 30 immune signature expression profiles. Model importance was identified as regression coefficients.
Furthermore, we used the elastic net regression to derive a discriminating model of the 30 immune signatures based on patients with and without sarcopenia after training this model on multiple random samples of the immune signatures using CV. We ranked all the immune signatures based on their regression coefficients. We found that Th2 cells and granulocytes could discriminate between sarcopenia and healthy individuals with a regression coefficient of 100 and 77.9, respectively (Figure 4C). Figures 4A, B show that the Th2 cells were significantly downregulated in sarcopenia patients relative to healthy controls, LMM, and LMM_LP. These results indicate that sarcopenia patients have weaker immune responses than other pre-defined groups.
In addition, we analyzed the association of various immune signatures with the pre-defined top-ranked genes (TTC39DP, SLURP1, and LCE1C) that discriminated sarcopenia from healthy individuals. TTC39DP has shown a significant positive correlation with 11 immune signatures and one negative correlation with proinflammatory cytokines (Figure 5A). The highest positive correlations were observed in granulocytes and B cells. In contrast, SLURP1 and LCE1C significantly negatively correlated with immunomodulatory molecules and exhausted T cells (Figures 5B–E). Interestingly, TTC39DP expression levels were much lower in sarcopenia patients than in healthy controls, and its upregulation correlated with a better prognosis and stronger immune profile in older people. In contrast, SLURP1 and LCE1C expression levels were much higher in sarcopenia patients and associated with a worse prognosis and weaker immune profile.
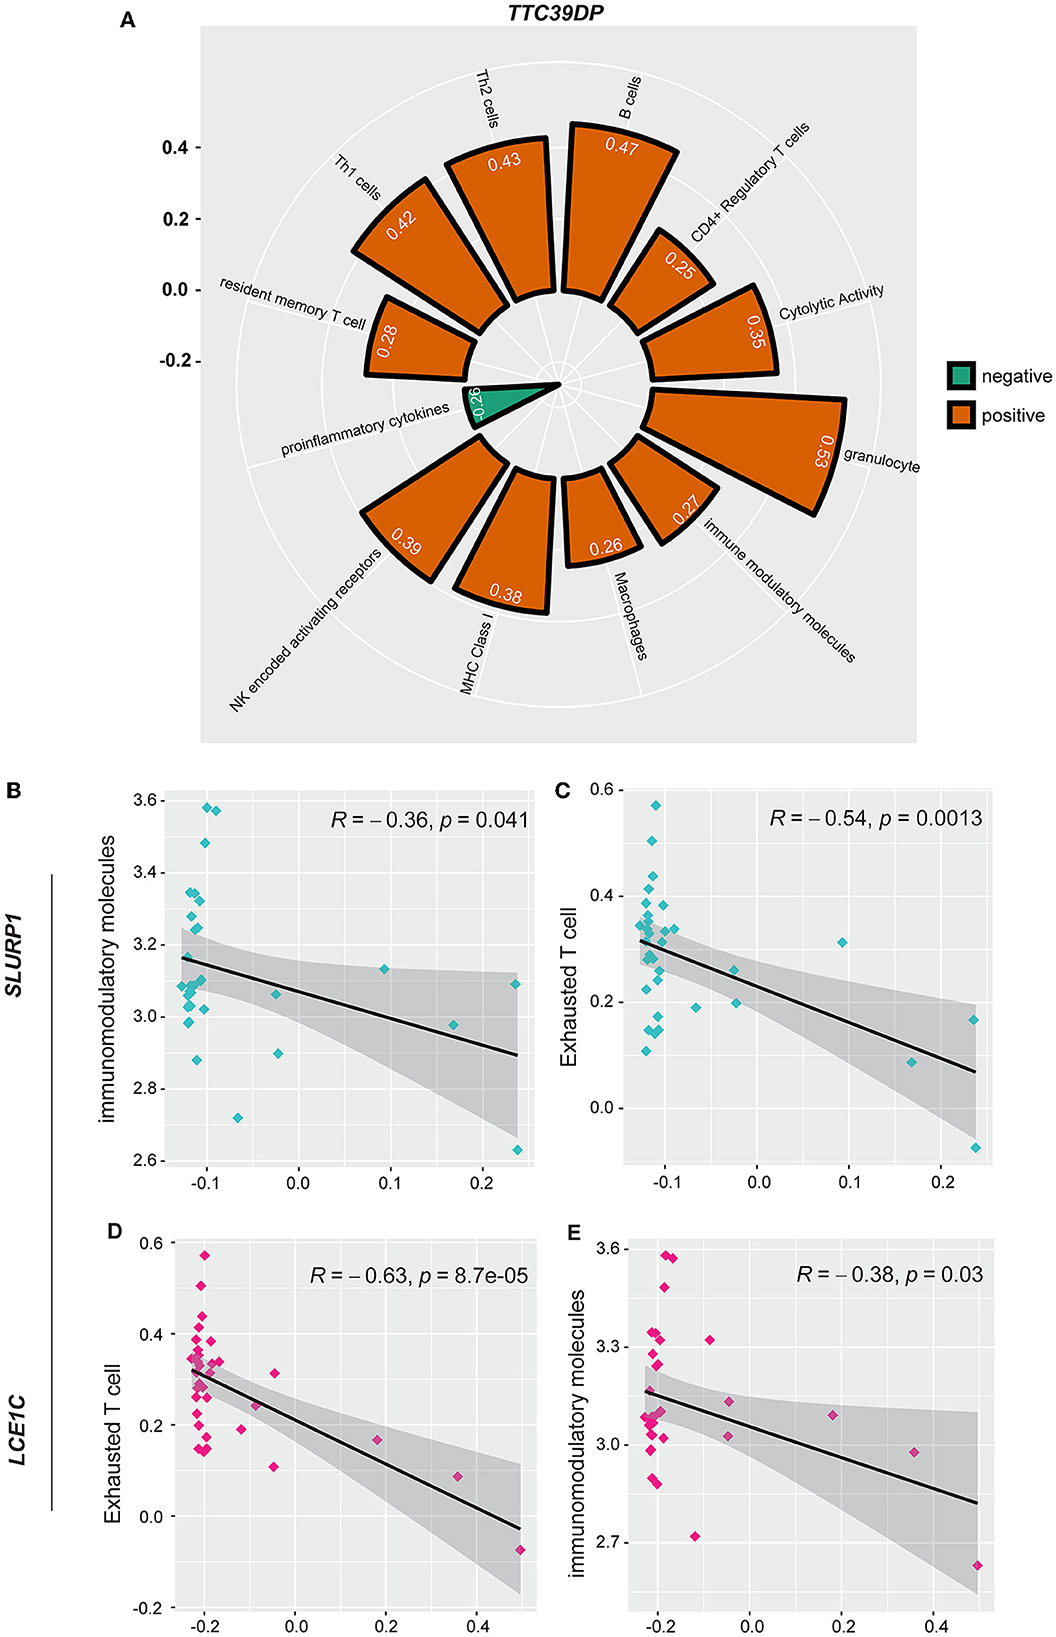
Figure 5. Association between SLURP1, LCE1C, and TTC39DP expression levels and immune signatures. (A) Significant correlation between TTC39DP expression levels and 12 immune signatures. (B) Significant correlation between SLURP1 expression levels with immunomodulatory molecules and (C) exhausted T cell. (D) Significant correlation between LCE1C expression levels with an exhausted T cell. (E) Immunomodulatory molecules. Pearson's correlation coefficients (R) and P-values are shown.
We identified 103, 57, and 66 genes with strong positive expression correlations with TTC39DP, SLURP1, and LCE1C, respectively (R > 0.5). Interestingly, SLURP1 and LCE1C showed a strong positive expression correlation (R = 0.9, p < 0.001, Figure 6A). In contrast, no significant correlations existed between SLURP1 and LCE1C with TTC39DP (Figures 6B, C). Pathway enrichment analysis identified several significant KEGG pathways associated with SLURP1 and LCE1C expression, including Renin secretion, Ras signaling pathway, Rap1 signaling pathway, Parkinson's disease, inflammatory mediator regulation of TRP channels, GnRH signaling pathway, gastric acid secretion, cGMP-PKG signaling pathway, cAMP signaling pathway, calcium signaling pathway, p53 signaling pathway, neurotrophin signaling pathway, and C-type lectin receptor signaling pathway. These pathways were associated with the 57 and 66 genes strongly correlated with SLURP1 and LCE1C, respectively (Figures 6D, E, FDR < 0.05). However, pathway enrichment analysis with 103 correlated genes with TTC39DP did not show significantly enriched pathways.
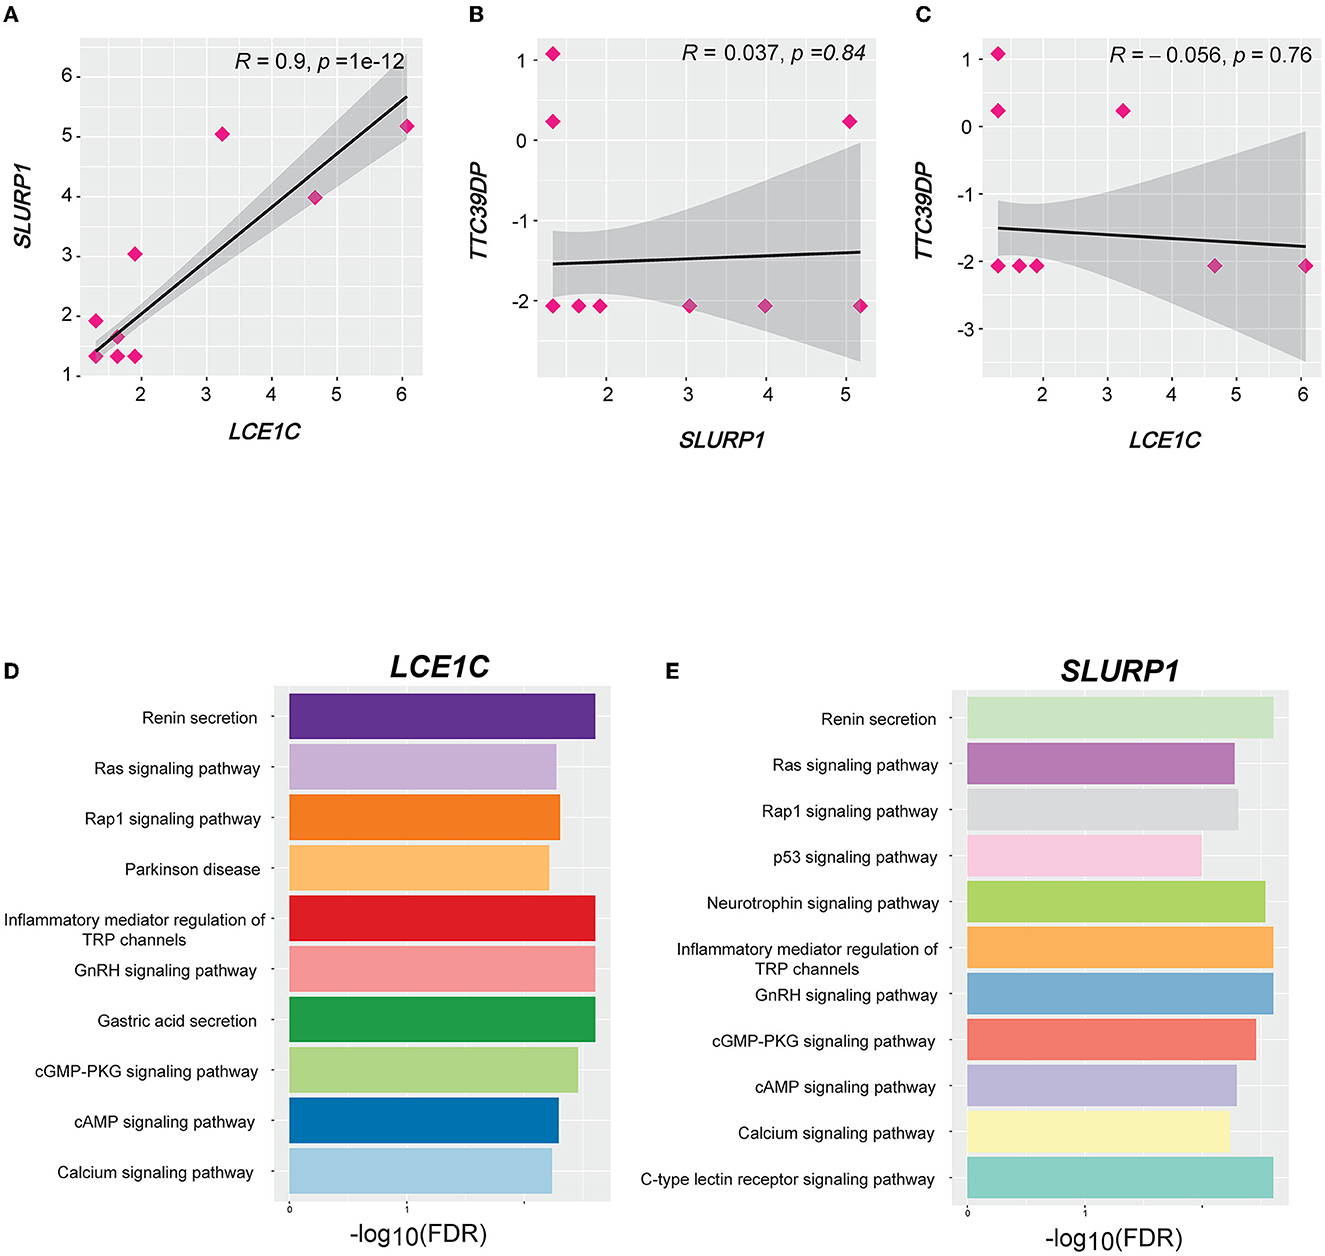
Figure 6. Correlation and pathways associated with LCE1C, SLURP1, and TTC39DP expression levels. (A) Correlation between LCE1C and SLURP1 expression levels. (B) Correlation between TTC39DP with SLURP1 and (C) LCE1C expression levels. Pearson's correlation coefficients (R) and P-values are shown. (D) The KEGG pathways enriched with LCE1C and (E) SLURP1 highly correlated genes (R > 0.5) were identified by GSEA (53).
Sarcopenia is a progressive and generalized skeletal muscle disorder, including the accelerated loss of muscle mass function (23). However, identifying biomarkers that reflect the central pathogenic processes of sarcopenia has remained lacking. The main problem in the diagnosis of sarcopenia is its complex genesis. The pathophysiology of sarcopenia includes inflammatory conditions, endocrine dysfunctions, and glycogen, glucose, and lipid metabolism dysregulation (24). Similarly, muscle-related cytokines and myokines show endocrine actions between muscle and tissues. In addition, many factors related to chronic diseases and lifestyles, such as obesity and low physical activity, may define the development of sarcopenia (25). Regardless of hopeful advances in assessing muscle mass and strength, various mechanisms of sarcopenia have not been fully distinguished, although several biomarkers may be found in both blood and tissue samples (26). Even though histology is the primary standard for recognizing the pathological mechanisms of different sarcopenic stages, biopsy samples are often a complicated process and not acceptable to older adult patients, especially during the follow-up of sarcopenic patients. Therefore, the emerging importance is identifying potential biomarkers for sarcopenia. In this study, we attempted to provide promising biomarkers and pathways that can detect sarcopenia at its early stages.
We found that sarcopenia is associated with increased expression levels of genes related to the neurotrophin, Rap1, Ras, and p53 signaling pathways. Neurotrophin signaling is involved in synaptic plasticity, memory, and neuronal health (27). In addition to sarcopenia and neurotrophin signaling during aging, the accumulation of proinflammatory cytokines generates neurotrophin resistance, increasing cognitive decline and dementia risk (27). In vivo studies showed that mice deficient for the tissue-specific Ras signaling, RasGrf1, mainly expressed within the pancreatic islets and the hippocampus and hypothalamus regions of the brain, were long-lasting and exhibited better motor coordination in elder animals than in their control (28). In addition, human studies showed that Ras signaling activation is associated with premature aging, including osteoporosis and osteopenia (28). p53 signaling has also been shown to contribute to aging. Preclinical studies showed that naturally aged mice had longevity linked with diminished p53 function, and p53 activation or dysregulation can accelerate aging (29).
In addition, we found that LMM_LP patients showed lower enrichment scores in B-cell receptor signaling, apoptosis, HIF-1 signaling, and adaptive immune response pathways than LMM patients, indicating that immune response and metabolic and biological dysregulation occurred simultaneously with the patient's muscle mass and function deterioration. B cells are involved in the immunosuppressive regulatory process, and during aging, the depletion of the secretion of IL7 and IGF1 causes alterations in the number and function of B cells. Dysfunctional B cells were correlated with the dysregulation of immune aging, affecting the regeneration and strength of the skeletal muscle. It has been suggested that B-cell accumulation in tissues plays a role in sarcopenia obesity, which is related to skeletal muscle inflammation (30). HIF-1 is vital as a mediator in adaptation to hypoxia, which increases oxygen delivery and glucose transporters expression during hypoxia. During sarcopenia, HIF-1 impairs oxidative metabolism and mitochondrial biogenesis, causing muscle mass function deterioration (31).
Furthermore, we found five common genes, TTC39DP, SLURP1, LCE1C, PTCD2P1, and OR7E109P, that can differentiate between sarcopenia patients and healthy controls. SLURP1 and LCE1C show the highest expression levels among sarcopenic Chinese descent than Caucasian and Afro-Caribbean. TTC39DP was the highest in LMM_LP than SLURP1 and LCE1C in Afro-Caribbean and Caucasian descents. SLURP1 is an immunomodulatory protein that promotes corneal immune and angiogenic processes (32). It is expressed in tissues such as skin, palms, soles, and oral and bronchial cells (32). SLURP1 suppresses TNFα production from T cells and IL1β, IL6, IFNγ, and IL8 secretion, which mimic the anti-inflammatory effect (33). Although we found that proinflammatory cytokines were higher in sarcopenia patients than in healthy control, this could trigger SLURP1 activation. SLURP1 was also identified as an epidermal neuromodulator essential for epidermal homeostasis, which indicates this gene's crucial role in aging (34). LCE1C and TTC39DP's role in aging and sarcopenia development remains lacking, even though reports have identified LCE1C as essential in epithelial development (35) and the identification of the skin (36). Although the results report a strong correlation between LCE1C and aging, the correlation of this gene with sarcopenia and muscle function deterioration is still needed.
Gene regulatory analysis yields a top-scoring regulon containing GATA1, GATA2, and GATA3 as master regulators and nine predicted direct target genes, and these predicted targets were associated with different pathways. Among these nine targeted genes, POSTN and SLURP1 showed strong associations with locomotion. POSTN (periostin) is an extracellular matrix protein crucial in myocardial fibrosis and heart inflammatory processes (37). Periostin was associated with heart aging, and excessive periostin expression contributed to cardiomyocyte senescent (37). In addition, periostin was found to have a maintenance role in muscle mass during muscle regeneration (38). Furthermore, upregulation and secretion of periostin increase muscular dystrophy in mice, and deletion of periostin led to the improvement in skeletal muscle structure and function, suggesting its importance in muscle strength and function (39). However, although our results showed an association of SLURP1 with locomotion and disease progression, supporting data regarding the role of this gene in muscle function and sarcopenia remain lacking, and further studies are recommended.
As mentioned, sarcopenia is a disease of muscle constrictive dysfunction, metabolic abnormalities, and systemic inflammation (40). Thus, sarcopenia is a disease of more complex networks involving different pathophysiologic mechanisms from dysfunction of neuromuscular junctions, a decline of the endocrine system, imbalance of growth enhancer and suppressor factors, structural alteration of protein synthesis, behavior-mediated pathways (e.g., physical activity and obesity), and inflammation (20). Neuromuscular junction dysfunction could gradually alter muscle action potentials during exercise and be associated with neuromuscular weakness, as shown in Figure 3C (41). In addition, one of the earlier signs of sarcopenic damage would be the early structural alterations of the muscle protein. The essential biomarkers in the evaluation of muscle mass are serum sarcomeric proteins, such as actin, troponin, creatinine, and extracellular matrix proteins (42); in addition, type VI collagen (IC6), MMP-generated degradation fragment of collagen 6 (C6M) (43), the N-terminal peptide (P3NP) (44), and 3-methylhistidine (3MH) (45) are also associated with the pathophysiology of sarcopenia.
In addition, WGCNA analysis revealed that sarcopenia was associated with multiple enriched pathways and was negatively associated with the RISC complex. We also found that the LMM and LMM_LP groups shared two common pathways with the S group, epidermal cell differentiation, and the RISC complex. As observed in sarcopenia, the RISC complex pathway was associated with muscle mass deterioration and function. The RISC pathway involves many biological processes, such as brain aging (21). It has been proven that the dysregulation of miRNA expression (act via RISC complex) has been associated with reduced muscle plasticity (22) and will impair skeletal muscle adaptations to exercise (22).
From the immunological perspective, we found that proinflammatory cytokines, type I IFN response, and dendritic cells were significantly upregulated in sarcopenia patients. These cytokines are known to play a critical role in sarcopenia development by causing destructive effects on the skeletal muscle, declined physical performance and muscle strength, and disability in older adults (46). Similarly, inflammatory cytokines such as IL-1 can block the differentiation of myoblasts in the presence of overexpressed activin, and this synergic activity was confirmed in models related to sarcopenia (47). In addition, proinflammatory cytokines highlight the complexity of the inflammaging process. It was shown that patients suffering from obesity who develop sarcopenic obesity in older age show elevated levels of proinflammatory cytokines, indicating the strong association between endocrine, metabolic, and inflammaging (48).
In contrast, Th1&Th2 cells, resident memory T cells, NK activating receptor, NK antimicrobial protein granulysin, granulocytes, exhausted T cells, effector memory T cells, cytolytic protein perforin, cytolytic activity, CD4+ T cells, B cells, and anti-inflammatory cytokines were lower in sarcopenia patients than healthy controls, indicating the strong association of immune system dysregulation with disease progression (49). During immune aging, the reservoir of NK cells in the thymus is nearly depleted, and depleted NK cells were found to be associated with muscle loss in sarcopenia and mortality (50). Furthermore, dendritic cells are related to immune cells' maturation and differentiation, such as Th1 and Th2 cells, and develop an inflammatory environment during immune aging, affecting skeletal muscle regeneration (51). However, there is still a lack of knowledge on the particular role of each immune cell subtype in sarcopenia, but their whole function may work in the skeletal muscle environment modification and affect the physiological homeostasis of skeletal muscle (52).
This study has several limitations. First, because sarcopenia is a complex disease, obtaining biopsy samples is not usually acceptable to older adult patients, which is why patients' samples are relatively small. Second, we obtained the results by bioinformatics analyses without experimental justification, so further experimental and clinical investigations are required to assess these biomarkers' activity and beneficial effects. In conclusion, this study identified the association between immune responses and biological dysregulation with the patient's muscle mass and function deterioration. Three biomarkers were identified, TTC39DP, SLURP1, and LCE1C, and their expression levels depend on the patient's ethnicity and immune profile. TTC39DP was correlated with a better prognosis and stronger immune profile, while SLURP1 and LCE1C were associated with a bad prognosis and weaker immune profile. In addition, a strong association between immune system dysregulation with disease progression and muscle function deterioration was observed. This study provides new insight into sarcopenia's cellular and immunological prospects, which is considered reliable and promising to evaluate the age and sarcopenia-related modifications of skeletal muscle.
Publicly available datasets were analyzed in this study. This data can be found here: https://www.ncbi.nlm.nih.gov/geo/query/acc.cgi?acc=GSE111017.
Ethics approval was waived since we used only publicly available data and materials in this study.
ZA: conceptualization, methodology, software, validation, formal analysis, investigation, resources, data curation, writing—original draft, writing—review and editing, and visualization. XiW: conceptualization, methodology, software, validation, formal analysis, investigation, resources, data curation, writing—original draft, writing—reviewing and editing, visualization, and supervision. DW and TZ: formal analysis and investigation. YZ: methodology and investigation. XuW and ZC: conceptualization, methodology, investigation, writing—reviewing and editing, supervision, project administration, and funding acquisition. All authors contributed to the article and approved the submitted version.
This study was supported by the National Key R&D Program of China (2021YFA1301102), the Scientific and Technological Innovation 2030 Program of China—major projects (2021ZD0200408 to XuW), the Natural Science Foundation of Zhejiang Province (LR20H090002 to XuW), the National Natural Science Foundation of China (81971866 to XuW), the Leading Innovative and Entrepreneur Team Introduction Program of Zhejiang (2019R01007 to XuW), and the Fundamental Research Funds for the Central Universities (K20210195 to XuW).
The authors declare that the research was conducted in the absence of any commercial or financial relationships that could be construed as a potential conflict of interest.
All claims expressed in this article are solely those of the authors and do not necessarily represent those of their affiliated organizations, or those of the publisher, the editors and the reviewers. Any product that may be evaluated in this article, or claim that may be made by its manufacturer, is not guaranteed or endorsed by the publisher.
The Supplementary Material for this article can be found online at: https://www.frontiersin.org/articles/10.3389/fmed.2023.928285/full#supplementary-material
1. Cruz-Jentoft AJ, Baeyens JP, Bauer JM, Boirie Y, Cederholm T, Landi F, et al. Sarcopenia: European consensus on definition and diagnosis: Report of the European Working Group on Sarcopenia in Older People. Age Ageing. (2010) 39:412–23. doi: 10.1093/ageing/afq034
2. Wilson D, Jackson T, Sapey E, Lord JM. Frailty and sarcopenia: the potential role of an aged immune system. Ageing Res Rev. (2017) 36:1–10. doi: 10.1016/j.arr.2017.01.006
3. Schiaffino S, Mammucari C. Regulation of skeletal muscle growth by the IGF1-Akt/PKB pathway: insights from genetic models. Skelet Musc. (2011) 1:1–14. doi: 10.1186/2044-5040-1-4
4. Markofski MM, Dickinson JM, Drummond MJ, Fry CS, Fujita S, Gundermann DM, et al. Effect of age on basal muscle protein synthesis and mTORC1 signaling in a large cohort of young and older men and women. Exp Gerentol. (2015) 65:1–7. doi: 10.1016/j.exger.2015.02.015
5. Wall BT, Gorissen SH, Pennings B, Koopman R, Groen BBL, Verdijk LB, et al. Aging is accompanied by a blunted muscle protein synthetic response to protein ingestion. PLoS ONE. (2015) 10:e0140903. doi: 10.1371/journal.pone.0140903
6. Goronzy JJ, Weyand CM. Understanding immunosenescence to improve responses to vaccines. Nat Immunol. (2013) 14:428–36. doi: 10.1038/ni.2588
7. Shaw AC, Joshi S, Greenwood H, Panda A, Lord JM. Aging of the innate immune system. Curr Opinion Immunol. (2010) 22:507–13. doi: 10.1016/j.coi.2010.05.003
8. Baylis D, Bartlett DB, Patel HP, Roberts HC. Understanding how we age: insights into inflammaging. Longevity & healthspan. (2013) 2:1–8. doi: 10.1186/2046-2395-2-8
9. Migliavacca E, Tay SKH, Patel HP, Sonntag T, Civiletto G, McFarlane C, et al. Mitochondrial oxidative capacity and NAD(+) biosynthesis are reduced in human sarcopenia across ethnicities. Nat Commun. (2019) 10:5808. doi: 10.1038/s41467-019-13694-1
10. Chen L-K, Liu L-K, Woo J, Assantachai P, Auyeung T-W, Bahyah KS, et al. Sarcopenia in Asia: consensus report of the Asian Working Group for Sarcopenia. J Am Med Direct Assoc. (2014) 15:95–101. doi: 10.1016/j.jamda.2013.11.025
11. Hänzelmann S, Castelo R, Guinney J. GSVA: gene set variation analysis for microarray and RNA-seq data. BMC Bioinformat. (2013) 14:7. doi: 10.1186/1471-2105-14-7
12. Kanehisa M, Goto S. KEGG: kyoto encyclopedia of genes and genomes. Nucleic Acids Res. (2000) 28:27–30. doi: 10.1093/nar/28.1.27
13. Ashburner M, Ball CA, Blake JA, Botstein D, Butler H, Cherry JM, et al. Gene ontology: tool for the unification of biology. The Gene Ontology Consortium. Nat Genet. (2000) 25:25–9. doi: 10.1038/75556
14. Ulgen E, Ozisik O, Sezerman OU. pathfindR: An R package for comprehensive identification of enriched pathways in omics data through active subnetworks. Front Genet. (2019) 10:858. doi: 10.3389/fgene.2019.00858
15. Bland JM, Altman DG. Multiple significance tests: the Bonferroni method. BMJ. (1995) 310:170. doi: 10.1136/bmj.310.6973.170
16. Kuhn M. Building predictive models in R using the caret package. J Stat Softw. (2008) 28:1–26. doi: 10.18637/jss.v028.i05
17. Janky RS, Verfaillie A, Imrichová H, Van de Sande B, Standaert L, Christiaens V, et al. iRegulon: from a gene list to a gene regulatory network using large motif and track collections. PLoS Comp Biol. (2014) 10:e1003731. doi: 10.1371/journal.pcbi.1003731
18. Langfelder P, Horvath S, WGCNA. an R package for weighted correlation network analysis. BMC Bioinformat. (2008) 9:1–13. doi: 10.1186/1471-2105-9-559
19. Soikkeli J, Podlasz P, Yin M, Nummela P, Jahkola T, Virolainen S, et al. Metastatic outgrowth encompasses COL-I, FN1, and POSTN up-regulation and assembly to fibrillar networks regulating cell adhesion, migration, and growth. Am J Pathol. (2010) 177:387–403. doi: 10.2353/ajpath.2010.090748
20. Curcio F, Ferro G, Basile C, Liguori I, Parrella P, Pirozzi F, et al. Biomarkers in sarcopenia: a multifactorial approach. Exp Gerontol. (2016) 85:1–8. doi: 10.1016/j.exger.2016.09.007
21. Grigoriev A, Bonini NM. Age-dependent patterns of microRNA RISC loading. Aging. (2014) 6:705–6. doi: 10.18632/aging.100692
22. Margolis LM, Rivas DA. Potential role of microRNA in the anabolic capacity of skeletal muscle with aging. Exerc Sport Sci Rev. (2018) 46:86–91. doi: 10.1249/JES.0000000000000147
23. Cruz-Jentoft AJ, Sayer AA. Sarcopenia. Lancet. (2019) 393:2636–46. doi: 10.1016/S0140-6736(19)31138-9
24. Malafarina V, Úriz-Otano F, Iniesta R, Gil-Guerrero LJM. Sarcopenia in the elderly: diagnosis, physiopathology and treatment. Maturitas. (2012) 71:109–14. doi: 10.1016/j.maturitas.2011.11.012
25. Biolo G, Cederholm T, Muscaritoli M. Muscle contractile and metabolic dysfunction is a common feature of sarcopenia of aging and chronic diseases: from sarcopenic obesity to cachexia. Clin Nutr. (2014) 33:737–48. doi: 10.1016/j.clnu.2014.03.007
26. Kalinkovich A, Livshits G. Sarcopenia–The search for emerging biomarkers. Ageing Res Rev. (2015) 22:58–71. doi: 10.1016/j.arr.2015.05.001
27. Cotman CW. The role of neurotrophins in brain aging: a perspective in honor of Regino Perez-Polo. Neurochem Res. (2005) 30:877–81. doi: 10.1007/s11064-005-6960-y
28. Slack C. Ras signaling in aging and metabolic regulation. Nutr Healthy Aging. (2017) 4:195–205. doi: 10.3233/NHA-160021
29. Wu D, Prives C. Relevance of the p53–MDM2 axis to aging. Cell Death Different. (2018) 25:169–79. doi: 10.1038/cdd.2017.187
30. Fan J, Kou X, Yang Y, Chen N. MicroRNA-regulated proinflammatory cytokines in sarcopenia. Mediat Inflamm. (2016) 2016. doi: 10.1155/2016/1438686
31. Lee T-W, Liu H-W, Lin Y-F, Lee T-I, Kao Y-H, Chen Y-J. Histone deacetylase inhibition improves metabolism and mitochondrial dynamics: a potential novel therapeutic strategy for sarcopenia coexisting with diabetes mellitus. Med Hypotheses. (2022) 158:110724. doi: 10.1016/j.mehy.2021.110724
32. Swamynathan S, Tiwari A, Loughner CL, Gnalian J, Alexander N, Jhanji V, et al. The secreted Ly6/uPAR-related protein-1 suppresses neutrophil binding, chemotaxis, and transmigration through human umbilical vein endothelial cells. Sci Rep. (2019) 9:5898. doi: 10.1038/s41598-019-42437-x
33. Chernyavsky AI, Galitovskiy V, Shchepotin IB, Grando SA. Anti-inflammatory effects of the nicotinergic peptides SLURP-1 and SLURP-2 on human intestinal epithelial cells and immunocytes. BioMed Res Int. (2014) 2014:609086. doi: 10.1155/2014/609086
34. Chimienti F, Hogg RC, Plantard L, Lehmann C, Brakch N, Fischer J, et al. Identification of SLURP-1 as an epidermal neuromodulator explains the clinical phenotype of Mal de Meleda. Hum Mol Genet. (2003) 12:3017–24. doi: 10.1093/hmg/ddg320
35. Yabuta N, Ota C, Sasakura T, Naito Y, Okuzaki D, Fukushima K, et al. Late cornified envelope 1C (LCE1C), a transcriptional target of TAp63 phosphorylated at T46/T281, interacts with PRMT5. Sci Rep. (2018) 8:4892. doi: 10.1038/s41598-018-23045-7
36. Hanson E, Haas C, Jucker R, Ballantyne J. Identification of skin in touch/contact forensic samples by messenger RNA profiling. For Sci Int Genet Suppl Ser. (2011) 3:e305–6. doi: 10.1016/j.fsigss.2011.09.015
37. Li Q, Liu X, Wei J. Ageing related periostin expression increase from cardiac fibroblasts promotes cardiomyocytes senescent. Biochem Biophys Res Commun. (2014) 452:497–502. doi: 10.1016/j.bbrc.2014.08.109
38. Ito N, Miyagoe-Suzuki Y, Takeda Si, Kudo A. Periostin is required for the maintenance of muscle fibers during muscle regeneration. Int J Mol Sci. (2021) 22:3627. doi: 10.3390/ijms22073627
39. Lorts A, Schwanekamp JA, Baudino TA, McNally EM, Molkentin JD. Deletion of periostin reduces muscular dystrophy and fibrosis in mice by modulating the transforming growth factor-β pathway. Proc Natl Acad Sci USA. (2012) 109:10978–83. doi: 10.1073/pnas.1204708109
40. Ilich JZ, Kelly OJ, Inglis JE, Panton LB, Duque G, Ormsbee MJ. Interrelationship among muscle, fat, and bone: connecting the dots on cellular, hormonal, and whole body levels. Ageing Res Rev. (2014) 15:51–60. doi: 10.1016/j.arr.2014.02.007
41. Rudolf R, Khan MM, Labeit S, Deschenes MR. Degeneration of neuromuscular junction in age and dystrophy. Front Ageing Neurosci. (2014) 6:99. doi: 10.3389/fnagi.2014.00099
42. Nedergaard A, Karsdal MA, Sun S, Henriksen K. Serological muscle loss biomarkers: an overview of current concepts and future possibilities. J Cachexia Sarcop Muscle. (2013) 4:1–17. doi: 10.1007/s13539-012-0086-2
43. Nedergaard A, Sun S, Karsdal MA, Henriksen K, Kjær M, Lou Y, et al. Type VI collagen turnover-related peptides—novel serological biomarkers of muscle mass and anabolic response to loading in young men. J Cachexia Sarcop Muscle. (2013) 4:267–75. doi: 10.1007/s13539-013-0114-x
44. Bhasin S, He EJ, Kawakubo M, Schroeder ET, Yarasheski K, Opiteck GJ, et al. N-terminal propeptide of type III procollagen as a biomarker of anabolic response to recombinant human GH and testosterone. J Clin Endocrinol Metab. (2009) 94:4224–33. doi: 10.1210/jc.2009-1434
45. Young VR, Munro HN. Ntau-methylhistidine (3-methylhistidine) and muscle protein turnover: An overview. Fed Proc. (1978) 37:2291–300.
46. Cesari M, Penninx BWJH, Pahor M, Lauretani F, Corsi AM, Williams GR, et al. Inflammatory markers and physical performance in older persons: the InCHIANTI study. J Gerontol Ser A Biol Sci Med Sci. (2004) 59:M242–8. doi: 10.1093/gerona/59.3.M242
47. Trendelenburg AU, Meyer A, Jacobi C, Feige JN, Glass D. TAK-1/p38/nNFκB signaling inhibits myoblast differentiation by increasing levels of Activin A. Skelet Muscle. (2012) 2:1–14. doi: 10.1186/2044-5040-2-3
48. Sell H, Habich C, Eckel J. Adaptive immunity in obesity and insulin resistance. Nat Rev Endocrinol. (2012) 8:709–16. doi: 10.1038/nrendo.2012.114
49. Nelke C, Dziewas R, Minnerup J, Meuth SG, Ruck TJE. Skeletal muscle as potential central link between sarcopenia and immune senescence. EBioMedicine. (2019) 49:381–8. doi: 10.1016/j.ebiom.2019.10.034
50. Tilg H, Moschen AR. Adipocytokines: mediators linking adipose tissue, inflammation and immunity. Nat Rev Immunol. (2006) 6:772–83. doi: 10.1038/nri1937
51. Rodrigues LP, Teixeira VR, Alencar-Silva T, Simonassi-Paiva B, Pereira RW, Pogue R, et al. Hallmarks of aging and immunosenescence: Connecting the dots. Cytokine Growth Factor Rev. (2021) 59:9–21. doi: 10.1016/j.cytogfr.2021.01.006
52. Zhang X, Li H, He M, Wang J, Wu Y, Li Y. Immune system and sarcopenia: Presented relationship and future perspective. Exp Gerontol. (2022) 164:111823. doi: 10.1016/j.exger.2022.111823
Keywords: sarcopenia, low muscle mass, low physical performance, immunology, pathway analysis, bioinformatics, machine learning
Citation: Abdelrahman Z, Wang X, Wang D, Zhang T, Zhang Y, Wang X and Chen Z (2023) Identification of novel pathways and immune profiles related to sarcopenia. Front. Med. 10:928285. doi: 10.3389/fmed.2023.928285
Received: 06 May 2022; Accepted: 10 March 2023;
Published: 17 April 2023.
Edited by:
Tzvi Dwolatzky, Technion Israel Institute of Technology, IsraelReviewed by:
Alaa Abdelatty, Nanjing Medical University, ChinaCopyright © 2023 Abdelrahman, Wang, Wang, Zhang, Zhang, Wang and Chen. This is an open-access article distributed under the terms of the Creative Commons Attribution License (CC BY). The use, distribution or reproduction in other forums is permitted, provided the original author(s) and the copyright owner(s) are credited and that the original publication in this journal is cited, in accordance with accepted academic practice. No use, distribution or reproduction is permitted which does not comply with these terms.
*Correspondence: Zuobing Chen, Y3piMTk3MUB6anUuZWR1LmNu; Xuhua Wang, eGh3QHpqdS5lZHUuY24=
†These authors have contributed equally to this work
Disclaimer: All claims expressed in this article are solely those of the authors and do not necessarily represent those of their affiliated organizations, or those of the publisher, the editors and the reviewers. Any product that may be evaluated in this article or claim that may be made by its manufacturer is not guaranteed or endorsed by the publisher.
Research integrity at Frontiers
Learn more about the work of our research integrity team to safeguard the quality of each article we publish.