
95% of researchers rate our articles as excellent or good
Learn more about the work of our research integrity team to safeguard the quality of each article we publish.
Find out more
ORIGINAL RESEARCH article
Front. Med. , 05 October 2023
Sec. Pulmonary Medicine
Volume 10 - 2023 | https://doi.org/10.3389/fmed.2023.1276422
This article is part of the Research Topic Pulmonary Hypertension in the Modern Era: Science and Clinical Practice, Volume III View all 5 articles
 Megha Talati1*
 Evan Brittain2
 Vineet Agrawal2Niki Fortune1Katie Simon1
 Sheila Shay1Xiaofang Zeng3Michael L. Freeman4James West1
 Anna Hemnes1
Introduction: Pulmonary arterial hypertension is a fatal cardiopulmonary disease. Leptin, a neuroendocrine hormone released by adipose tissue, has a complex relationship with cardiovascular diseases, including PAH. Leptin is thought to be an important factor linking metabolic syndrome and cardiovascular disorders. Given the published association between metabolic syndrome and RV dysfunction in PAH, we sought to determine the association between leptin and RV dysfunction. We hypothesized that in PAH-RV, leptin influences metabolic changes via leptin receptors, which can be manipulated by metformin.
Methods: Plasma leptin was measured in PAH patients and healthy controls from a published trial of metformin in PAH. Leptin receptor localization was detected in RV from PAH patients, healthy controls, animal models of PH with RV dysfunction before and after metformin treatment, and cultured cardiomyocytes with two different BMPR2 mutants by performing immunohistochemical and cell fractionation studies. Functional studies were conducted in cultured cardiomyocytes to examine the role of leptin and metformin in lipid-driven mitochondrial respiration.
Results: In human studies, we found that plasma leptin levels were higher in PAH patients and moderately correlated with higher BMI, but not in healthy controls. Circulating leptin levels were reduced by metformin treatment, and these findings were confirmed in an animal model of RV dysfunction. Leptin receptor expression was increased in PAH-RV cardiomyocytes. In animal models of RV dysfunction and cultured cardiomyocytes with BMPR2 mutation, we found increased expression and membrane localization of the leptin receptor. In cultured cardiomyocytes with BMPR2 mutation, leptin moderately influences palmitate uptake, possibly via CD36, in a mutation-specific manner. Furthermore, in cultured cardiomyocytes, the Seahorse XFe96 Extracellular Flux Analyzer and gene expression data indicate that leptin may not directly influence lipid-driven mitochondrial respiration in BMPR2 mutant cardiomyocytes. However, metformin alone or when supplemented with leptin can improve lipid-driven mitochondrial respiration in BMPR2 mutant cardiomyocytes. The effect of metformin on lipid-driven mitochondrial respiration in cardiomyocytes is BMPR2 mutation-specific.
Conclusion: In PAH, increased circulating leptin can influence metabolic signaling in RV cardiomyocytes via the leptin receptor; in particular, it may alter lipid-dependent RV metabolism in combination with metformin in a mutation-specific manner and warrants further investigation.
Pulmonary arterial hypertension (PAH) is a rare but fatal disease characterized by increased muscularization of small arteries leading to elevated pulmonary arterial pressure, which ultimately leads to right ventricular (RV) dysfunction and failure. In PAH, lipotoxicity and impaired fatty acid oxidation are common features of the dysfunctional RV, and RV failure has been linked to metabolic disease (1). Leptin (Ob) is a 16 kDa non-glycosylated protein encoded by the obese (ob) gene and produced primarily by adipocytes (2). It is classically known as a key regulator of energy balance, including appetite (3, 4), though it can also have a wide range of effects that affect the cardiovascular, nervous, immune, and reproductive systems (5). In the left ventricle, leptin regulates cardiomyocyte contractility, apoptosis, and metabolism (6–9). Although leptin has the potential to alter metabolism in the RV and contribute to the metabolic phenotype of the failing RV, little is known about whether or how leptin may alter the RV in PAH.
Leptin may contribute to cardiovascular pathogenesis by altering fatty acid oxidation and cardiac hypertrophy, as well as increasing oxidative stress, vascular inflammation, endothelial dysfunction, and vascular proliferation (8, 10–12). Leptin mediates its effects by binding to leptin receptors (Ob-R), which are present in the heart, liver, kidney, brain, and pancreas. There are six isoforms of Ob-R (a–f) largely classified into three large groups: a long form (Ob-Rb), a short form (Ob-Ra, c, d, f), and a secretory form (Ob-Re). Ob-Rb is the dominant isoform in the heart, primarily responsible for leptin signaling and leptin resistance (10, 13, 14). In PAH, plasma leptin levels are increased (15, 16), and pulmonary endothelial cells (P-ECs) cultured from idiopathic PAH (IPAH) patients secrete more leptin than controls (15). In IPAH, leptin signaling contributes to regulatory T-cell dysfunction and may contribute to the development and progression of the PAH (17). In addition, in chronic hypoxia-induced rodent models of pulmonary hypertension (PH), abnormal activation of the Ob/Ob-Rb axis in the pulmonary vascular wall is required for increased leptin secretion by P-ECs and increased Ob-Rb expression in pulmonary artery smooth muscle cells (PASMCs) for PASMC proliferation (18, 19). In contrast, leptin-deficient mice are shown to recapitulate the histological features of PAH in the lung and heart (20), and lower leptin levels, when adjusted by BMI, are associated with increased overall mortality (21). These data show that the role of leptin is not well understood in the pulmonary vasculature, as there are conflicting data on its effects. Importantly, all these animal studies focused on the effect of the Ob/Ob-Rb axis specifically on pulmonary vascular cells but not on cardiomyocytes, which are responsible for RV dysfunction. The role of leptin in the RV is thus far understudied but may be relevant given the capacity of leptin to regulate organ-specific metabolism (17, 19).
In an open-label, phase II trial of metformin, an antidiabetic drug, in PAH patients, we have shown that metformin therapy is associated with improved RV function and, in a subset of patients, reduced RV triglyceride content that correlates with improved lipid and glucose metabolism markers (1). Furthermore, we and others have also shown that in animal models of RV load stress, metformin can improve RV function (22, 23). Prior publications have demonstrated a reduction in plasma leptin levels and liver steatosis with metformin administration (24). We, therefore, hypothesized that metformin administration in PAH may reduce elevated plasma leptin levels and sought to explore a role for leptin in the PAH-RV. Given the multiple metabolic derangements that occur in the PAH-RV including increased glycolysis and reduced fatty acid oxidation (25), it is possible that multiple metabolic interventions may be required to have maximal improvement in the failing RV. We, therefore, sought (1) to determine if metformin alters leptin abundance in the plasma in our human metformin trial and rodent models of PAH, suggesting that it is modifiable; (2) to test the role of leptin in regulating metabolism in PAH in our two animal models of RV load stress; and (3) to test for synergism in cardiomyocyte lipid-stimulated metabolism with multiple metabolic interventions.
Fasting blood samples before and after metformin were collected as part of a pilot study of metformin in PAH that has been previously published, including patient demographics (1) (NCT01884051). Control and PAH fasting plasma were also collected as part of the Vanderbilt Prospective Pulmonary Hypertension Registry (26) and used for analyses. In each study, before study procedures, subjects provided written informed consent (VUMC IRB #9401, 140,608).
H9c2 (ATCC CRL-1446), a rat (Rattus norvegicus) myoblast adherent cell line, was purchased from the American Type Culture Collection (ATCC, Manassas, VA, United States), and maintained in a growth medium comprising supplemented Dulbecco’s modified Eagle’s medium (DMEM), 10% fetal bovine serum (FBS), 2 mM glutamine, 1 mM pyruvate, 100 U/mL penicillin, and 100 mg/mL streptomycin in humidified air (5% CO2) at 37°C. To induce the differentiation into cardiac myocytes, the H9c2 myoblasts were transferred to a differentiating medium, which was composed of DMEM, 1% FBS, 2 mM glutamine, 1 mM pyruvate, 100 U/mL penicillin, and 100 mg/mL streptomycin. Cells starved in a differentiation medium for 48 h were used for experiments (27). These H9c2 cells were stably transfected with mutant BMPR2 plasmids [mutant 1 (M1), BMPR2 gene with a 2579-2580delT resulting in a frameshift at amino acid 859 resulting in 10 missense amino acids and a stop, and mutant 2 (M2), BMPR2 gene with a C993T mutation resulting in R332X], or empty vector (control) was used (28). G418 was used for the selection of positive clones. H9c2 cells from passages 8 to 12 were used for experiments. H9c2 cardiomyocytes were maintained in Dulbecco’s modified Eagle’s medium (DMEM) supplemented with 10% fetal bovine serum (FBS), 4.5 g/L D-glucose, 2 mM glutamine, 1 mM pyruvate, 100 U/mL penicillin, and 100 mg/mL streptomycin in humidified air (5% CO2) at 37°C. To induce the differentiation into cardiac myocytes, the H9c2 myoblasts were transferred to a differentiating medium, which was composed of DMEM, 1% FBS, 2 mM glutamine, 1 mM pyruvate, 100 U/mL penicillin, and 100 mg/mL streptomycin. Cells starved in a differentiation medium for 48 h were used for experiments. All the H9c2 clones expressed cardiac-specific markers (Acta1; Acta2; desmin; troponin T2, cardiac type; tropomyosin 1α) and demonstrated immunoreactivity for cardiac troponin T, markers of classical adult cardiomyocyte phenotype (27). For leptin stimulation, H9c2 cells in differentiation media were stimulated with 6 ng/mL Leptin (PeproTech, Cranbury, NJ) for 1 or 24 h.
An XFe96 analyzer (Seahorse Biosciences, North Billerica, MA) was used to measure bioenergetic function in intact H9c2 cells in real time (29). Briefly, H9c2 cells were seeded at a density of 20,000 cells/well in Seahorse Bioscience XFe96 cell culture plates in 100 μL of cardiomyocyte differentiation media. The plates were incubated in a 37°C humidified incubator with 5% CO2 for 24 h to reach 70%–80% confluency. The next day, the cells were incubated for 2 h in cell starvation media (pH 7.4), followed by pretreatment with 6 ng/mL leptin or 6 ng/mL leptin +5 mM metformin for 1 h in fatty acid oxidation media (pH 7.4). Palmitate (100 μL) was added just before starting the assay. Normalization of the total number of nuclei per well following the experiment was used to control for variation in cell number. On completion of the assay, the cells were stained with Coomassie blue, and cell nuclei were counted using a cell counter. Oxygen consumption rate (OCR) data are expressed as pmol/min.
H9c2 cells were homogenized in RIPA buffer (PBS, 1% Ipegal, 0.5% sodium deoxycholate, and 0.1% SDS) with proteinase and phosphatase inhibitor cocktails (Sigma-Aldrich, St. Louis, MO). Protein concentration was determined by the Bradford assay (Pierce, Rockford, IL) and stored at −70°C until use. Primary antibodies used for Western blot included CD36 [3313; Cell Signaling Technologies (CSTs), Danvers, MA], Leptin Ab, and Na-ATPase, cell membrane-specific. Donkey anti-rabbit (711-035-152; Jackson ImmunoResearch Laboratories, West Grove, PA) was used as the secondary antibody.
All animal procedures were approved by the Institutional Animal Care and Use Committee of the Vanderbilt University School of Medicine. We used a mouse model of mutant BMPR2 expression (30): the Rosa26-rtTA2 Å ~TetO7-BMPR2R899X FVB/N mice previously described (31, 32), called BMPR2R899X for brevity (33), in which mutant BMPR2 is universally expressed. Expression of transgene occurs only after the initiation of doxycycline. Transgene-negative mice were used as littermate controls and were administered doxycycline as well. BMPR2R899X mice were fed a high-fat chow (60% lard, western diet) with 1 g/kg doxycycline beginning at 6 weeks of age. Western diet has been shown to increase the penetrance of PH in this model (34). This diet was continued for 6 weeks, at which time mice were euthanized and tissue was harvested.
Male C57/Bl6 mice were fed a WD consisting of 60% lard for 8 weeks (n¼16), beginning at 3 weeks of age, and weighed weekly. A subset of mice underwent pulmonary artery banding (PAB) as previously described (35) at 11 weeks of age and remained in place for 2 weeks, after which animals were sacrificed, with tissue harvested and preserved in formalin. Treated mice were given 2.5 g/kg metformin mixed in food (Bioserv, San Diego, CA, United States) beginning at 3 weeks of age and continuing until sacrifice at 13 weeks.
RNA was isolated from the H9c2 cells using the Qiagen RNeasy Maxi Kit (Qiagen, Valencia, CA, United States), and first-strand complementary DNA (cDNA) was made using the QuantiTect® Reverse Transcription Kit (Qiagen), both according to the manufacturer’s protocols. Quantitative real-time PCR analysis was performed using a total reaction volume of 25 μL, containing 5 μL of diluted cDNA, 12.5 μL SYBR Green Supermix (Applied Biosystems Foster City, CA, United States), and 0.03 μL of each oligonucleotide primer (250 mM). PCR was completed in the StepOnePlus Real-Time PCR System (Applied Biosystems) with HPRT as the housekeeping gene (Table 1).
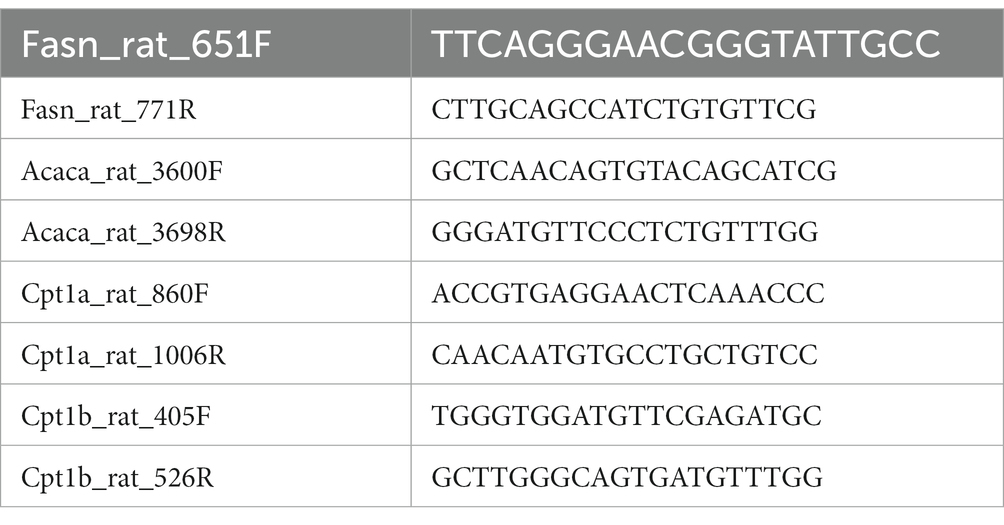
Table 1. Primers sequence for genes used for RT-PCR in H9c2 cells.
Immunolocalization was performed on archival paraffin-embedded human RV tissue obtained from controls (n = 5; Cooperative Human Tissue Network) and HPAH patients (n = 4; Vanderbilt University Medical Center). The study protocol was approved by the Institutional Review Board of Vanderbilt University Medical Center (IRB 9401). Human and mouse RV tissue sections were deparaffinized, rehydrated, and blocked with 5% normal goat serum, followed by overnight incubation with leptin receptor antibody (1 μg/mL, Abcam, Waltham, MA) at 4°C. H9c2 cells were plated in four-well chamber slides (Catalog No.: 354104; Falcon) and grown until they reached 70% confluency and differentiated. Following stimulation with leptin (6 ng/mL; PeproTech, Cranbury, NJ), H9c2 cells were fixed with 4% paraformaldehyde for 15 min at 37°C and permeabilized (permeabilization buffer: 20 mM HEPES, pH 7.4, E8 300 mM sucrose, 50 mM NaCl, 3 mM MgCl2) for 10 min at room temperature, followed by incubation with leptin receptor antibody overnight at 4°C. The next day, RV tissue sections and H9c2 cells were incubated with Alexa Fluor 594-labeled secondary antibody (Sigma-Aldrich). The slides were mounted using Vectashield mounting media containing DAPI (Vector Laboratories, Burlingame, CA) for confocal microscopy. Semiquantitative analysis of immunofluorescence staining was conducted using NIS-Elements AR 4.11.00 64-bit software. All images were collected at the same time under the same conditions and were subjected to the same exposure time for images to be taken. The immunofluorescence intensity was calculated by dividing the sum of the immunofluorescence intensity measured per slice by the number of nuclei in that slice.
Palmitate uptake by H9c2 cardiomyocytes with and without mutant BMPR2 was quantified using the methods described by Stuck et al. (36) and Ha and Pak (37). Briefly, control, M1, and M2 cells were plated (2 × 10⁴ cells/well) in six-well plates in two sets of triplicates. After differentiation into cardiac myocytes, for a 24 h timepoint, the cells were incubated with or without leptin (6 ng/mL) for 24 h before adding radioactive palmitate. For incubation with leptin for a 1 h timepoint, the cells were incubated with leptin (6 ng/mL) along with 0.75 μCi/mL of [14C] palmitate for 60 min at 37°C. The uptake reaction was terminated by rapid washing with 1 mL of ice-cold PBS. Cells were disrupted with 1 mL of lysis buffer and scraping, and cell-associated radioactivity was determined by scintillation counting.
Human serum and mouse plasma samples were used for ELISA. Leptin ELISA for human samples was done using an Invitrogen ELISA kit (Cat. #KAC2281), and for mouse samples, it was done using an R&D Systems ELISA kit (Cat. #MOB00B). ELISA was performed following the manufacturer’s protocol.
Statistical analyses for continuous variables were carried out using either one-way ANOVA, unpaired two-tailed t-tests, or Wilcoxon matched-pairs signed rank test (GraphPad Prism Software, La Jolla, CA). Data are expressed as means ± SE. p < 0.05 was considered significant.
First, we observed that plasma leptin levels were significantly higher (p < 0.05) in PAH compared to healthy controls despite similar BMI (Figure 1A, BMI 29.11 ± 7.9 control vs. 29.38 ± 3.7 PAH, p = 0.9). In addition, plasma leptin levels were significantly reduced (p < 0.0001) following 8 weeks of metformin therapy (Figure 1B; Supplementary Figure S1A), despite a relatively modest weight loss of approximately 2 kg (1). Using the SomaLogic proteomic platform, we found that in PAH patients, leptin (9133.93 ± 8,245) was moderately correlated (r 2 = 0.43, slope = 0.001) (p < 0.001) with body mass index (BMI) (29.8 ± 8) (Figure 1C). Furthermore, when we stratified leptin based on BMI, PAH patients with BMI >25 had more than two-fold higher (p < 0.03) plasma leptin (11,719 ± 8,989) than patients with BMI <25 (4,251 ± 3,128) (Figure 1D). In addition, leptin showed a correlation with BMI in both BMI groups (Supplementary Figures S1B,C) (*p < 0.0001). Taken together, the data show that PAH patients have higher leptin levels in circulation than controls, despite having a similar BMI to controls, and that plasma leptin abundance correlates with higher BMI and is reduced by metformin treatment.
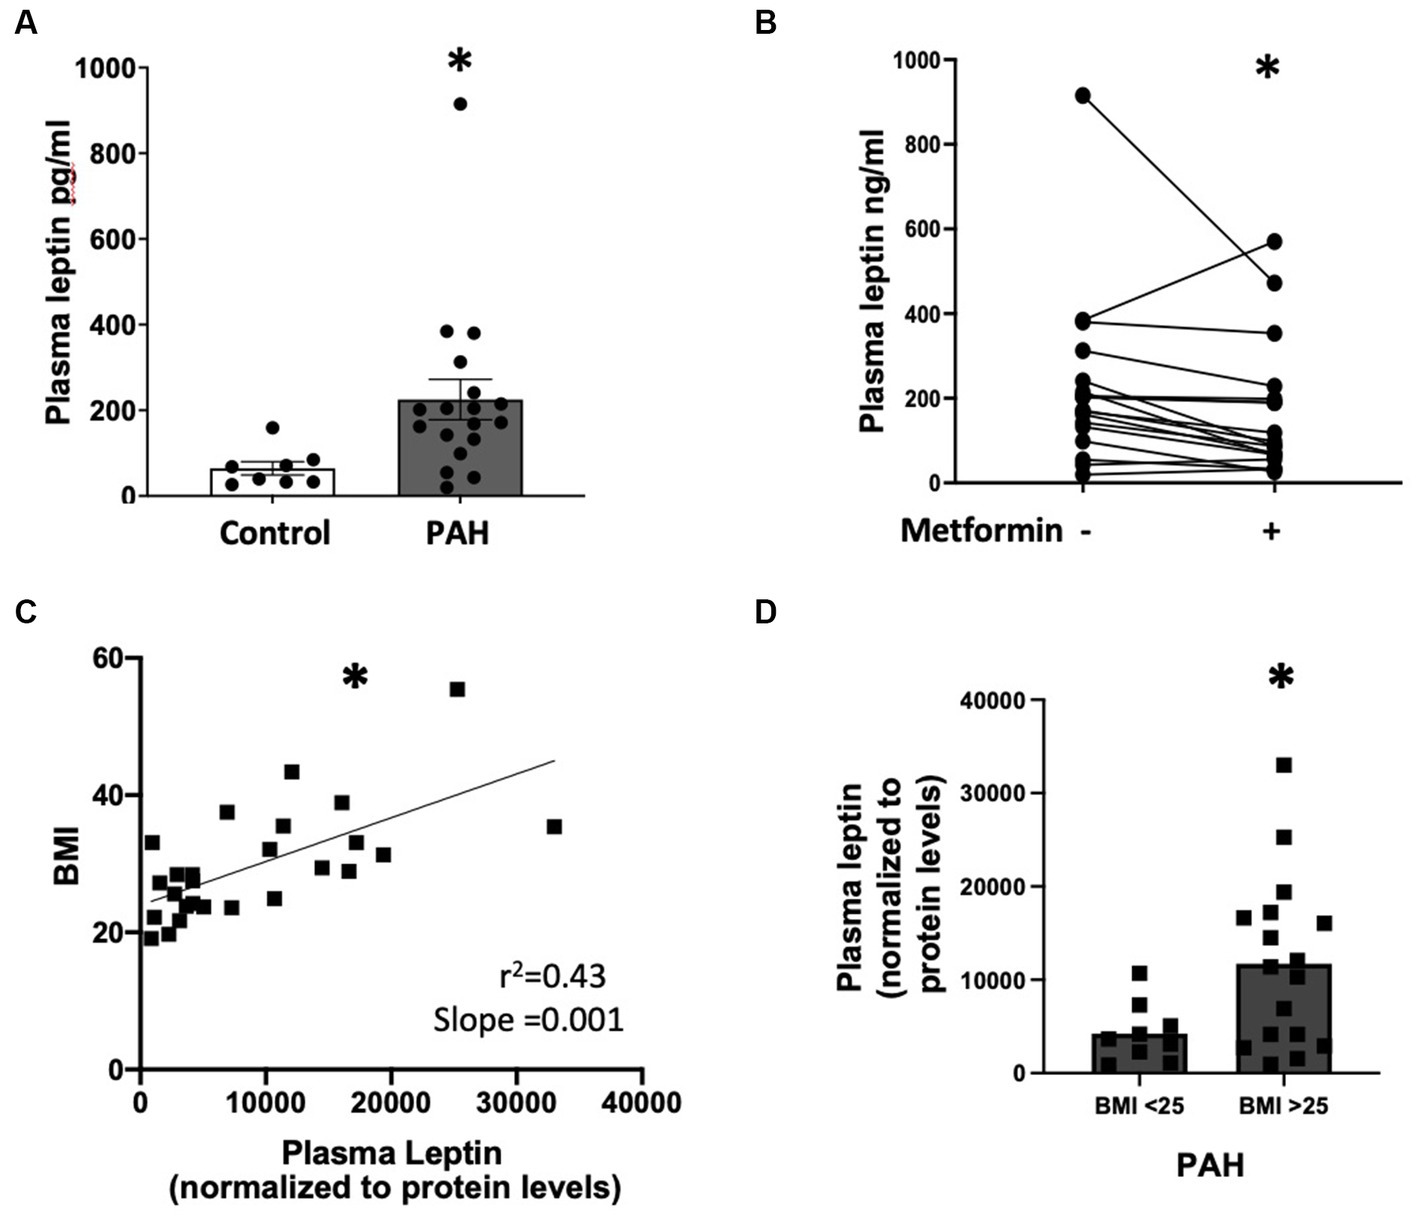
Figure 1. (A) Plasma leptin levels in controls (n = 8) and PAH (n = 18) patients *p < 0.05. (B) Graph showing the change in plasma leptin from baseline after 8 weeks of metformin therapy for each patient (n = 18). *p < 0.001. (C) Correlation between plasma leptin and BMI (n = 26) in PAH patients *p < 0.001. (D) Plasma leptin in PAH patients with BMI <25 and BMI >25 *p < 0.03. Samples used in (A,B) are from the metformin trial (NCT01884051). Samples used for (C,D) are from the Vanderbilt Prospective Pulmonary Hypertensive Registry (VUMC IRB #9401, 140608).
We next sought to determine if the PAH-RV has differences in the expression of leptin receptors, which are important in other forms of left heart failure (6, 7, 38–40) and may be targets for increased plasma leptin levels in PAH. In RV cardiomyocytes from human non-diseased controls, leptin receptor localization was mainly observed in the cytoplasm, whereas in RV cardiomyocytes from PAH patients, leptin receptor localization was observed both on the cell membrane (white arrow) and in the cytoplasm (Figure 2A). Semiquantitative analysis of leptin receptor staining indicated a significant increase (p < 0.01) in the expression of leptin receptors in PAH-RV cardiomyocytes (Figure 2B). We sought to recapitulate these findings using two rodent models of RV dysfunction: (1) mice with universal expression of BMPR2 mutation associated with heritable forms of PAH (BMPR2R899X), which we have previously shown to develop disproportional RV dysfunction to pulmonary vascular disease (35) and (2) pulmonary artery banding (PAB), a pure RV load-stress model. We found that in the RV cardiomyocytes from the BMPR2R899X mutant mouse, both cytoplasmic and cell membrane localization of leptin receptor was strikingly increased (p < 0.05) compared to RV cardiomyocytes from the control mouse (Figures 2C,D). In PAB, we tested whether pure load stress could similarly alter the localization of leptin receptors in the RV. As shown in Figure 2E,F, the localization of the leptin receptor was significantly increased both in the cytoplasm and on the cell membrane in RV cardiomyocytes in PAB (p < 0.05) mice compared to control mice. Taken together, these data show a consistent increase in RV leptin receptor expression in humans with PAH and rodent models of RV dysfunction and stress.
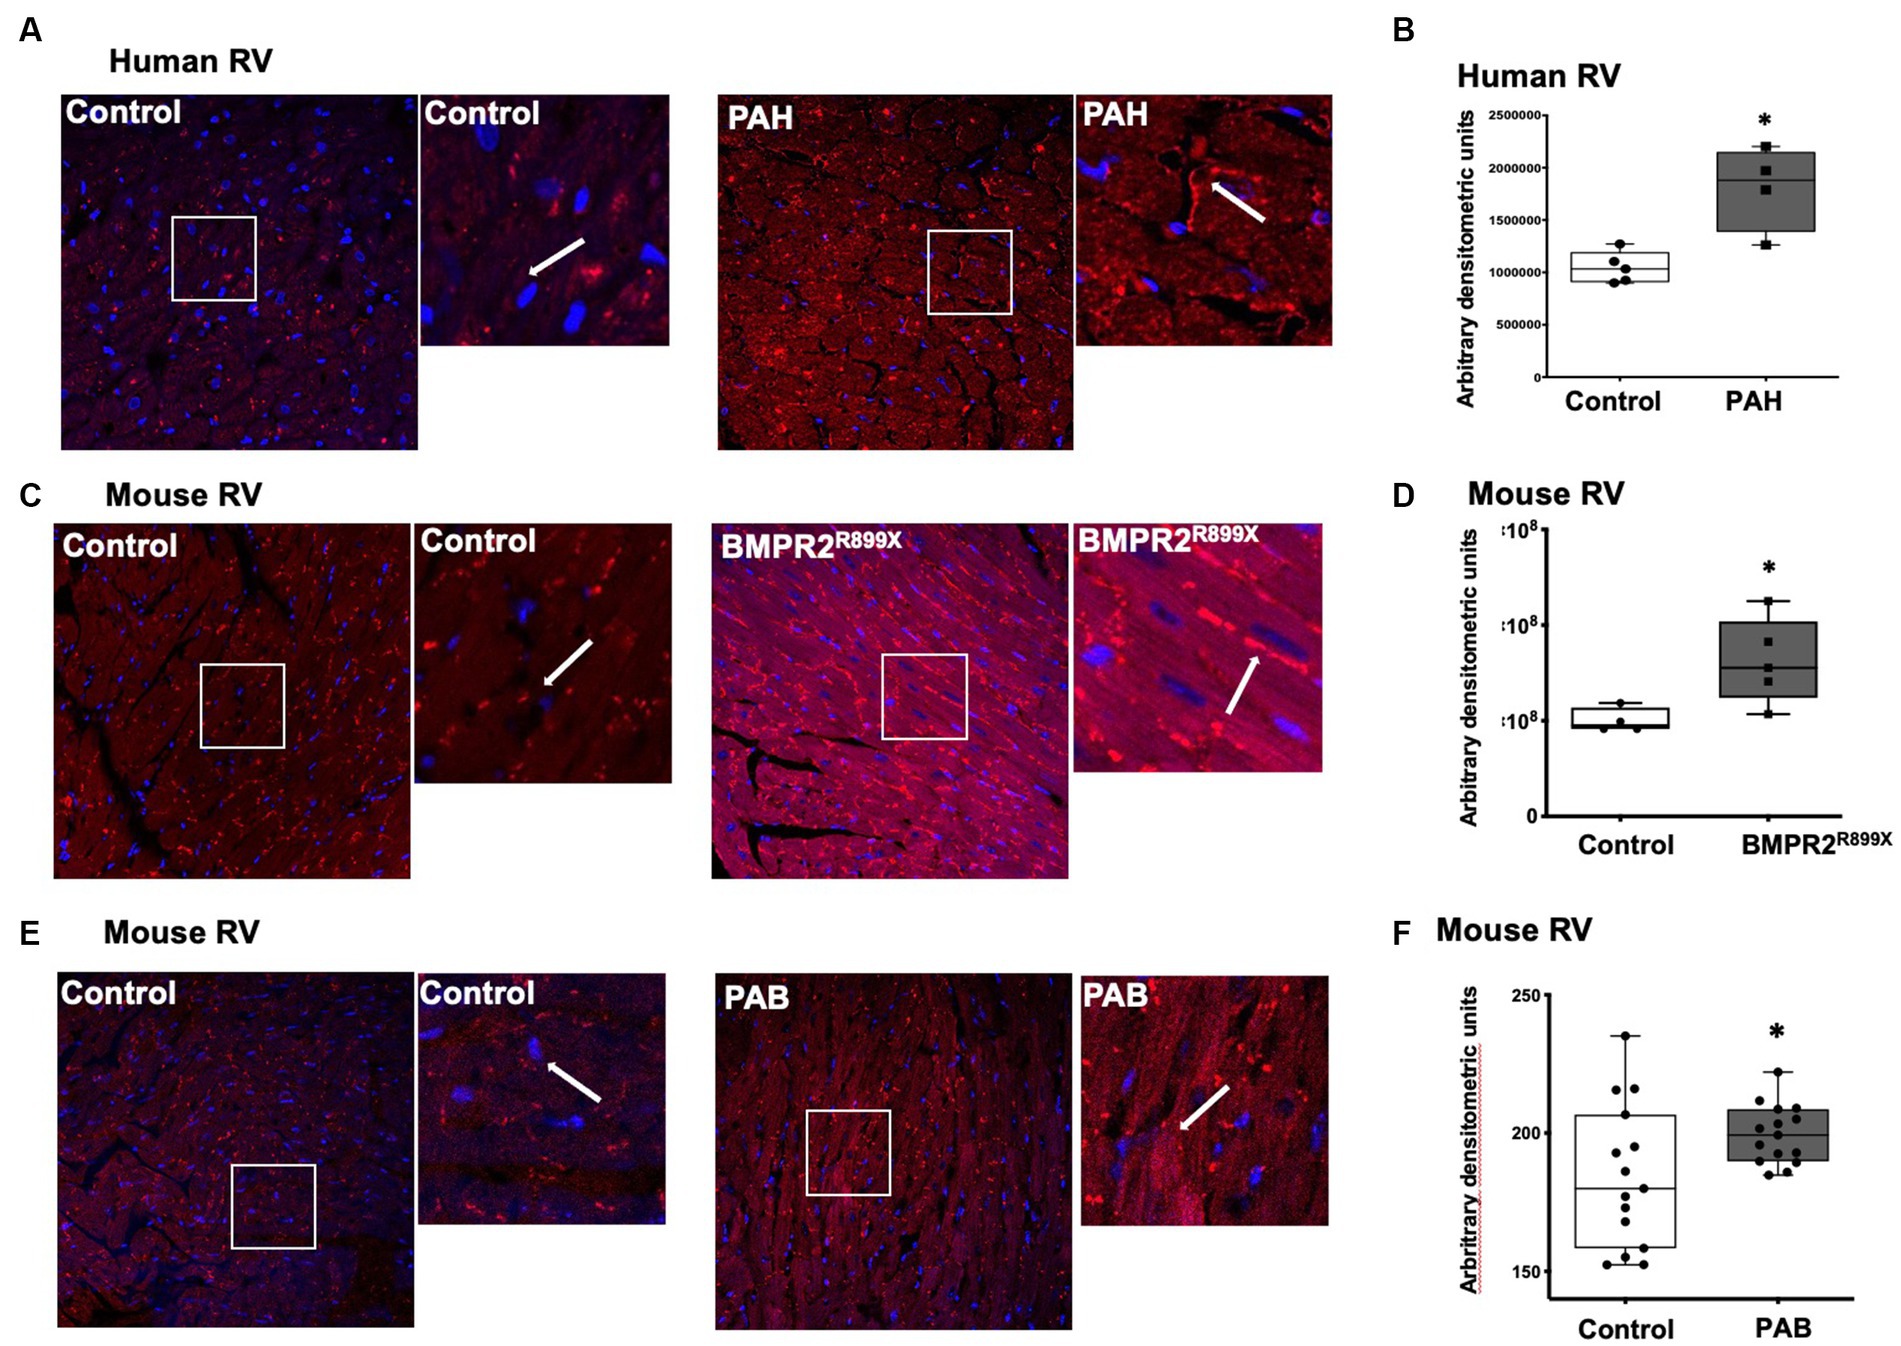
Figure 2. (A) Immunolocalization of leptin receptor in human RV from control (n = 5) and PAH (n = 4) patients. Magnification 400×. Magnified white box from the original picture on the right of control and PAH-RV tissue: leptin receptor immunolocalization in the cytoplasm and/or in the cell membrane (in red color), as indicated by the white arrow. (B) Bar graph showing leptin receptor staining intensity in control and PAH-RV tissue calculated using arbitrary densitometric units. (C) Immunolocalization of leptin receptor in RV tissue from control (n = 4) and BMPR2R899X (n = 5) mice. Magnification 400×. Magnified white box from the original picture on the right of control and BMPR2R899X mouse RV tissue: leptin receptor immunolocalization in the cytoplasm and/or in the cell membrane (in red color), as indicated by white arrow. (D) Bar graph showing leptin receptor staining intensity in control and BMPR2 mutant mouse RV tissue calculated using arbitrary densitometric units. (E) Immunolocalization of leptin receptor in RV tissue from control (n = 4) and PAB (n = 3). Magnification 400×. Magnified white box from the original picture on the right of control and PAB mouse RV tissue: leptin receptor immunolocalization in the cytoplasm and/or in the cell membrane (in red color), as indicated by white arrow. (F) Bar graph showing leptin receptor staining intensity in 4–5 random fields per mouse calculated using arbitrary densitometric units.
In our human data, we found increased plasma leptin in PAH compared to controls, as well as increased RV leptin receptor abundance. We next sought to recapitulate these findings in a mouse model of RV dysfunction with BMPR2 mutation and test the hypothesis that reduced plasma leptin expression is accompanied by lower RV leptin receptors after metformin exposure. At baseline, plasma leptin levels were significantly increased (p < 0.01) in BMPR2R899X mice compared to controls (Figure 3A). Following 6 weeks of metformin treatment, plasma leptin levels were significantly decreased (p < 0.05) in BMPR2R899X mice compared to controls. In RVs from BMPR2R899X mice, leptin receptor was also significantly increased (p < 0.01) at baseline compared to controls (Figures 3B,C). Following 6 weeks of metformin treatment, leptin receptor expression was significantly reduced (p < 0.0001) in BMPR2R899X mice compared to controls (Figures 3B,C). These findings are consistent with our human data. We have previously shown a reduction in RV lipid content after metformin exposure in humans (1) and in RV dysfunction (22). These data indicate that metformin treatment leads to a reduction in plasma leptin levels and reduces elevated leptin receptor expression in BMPR2 mutant RV cardiomyocytes.
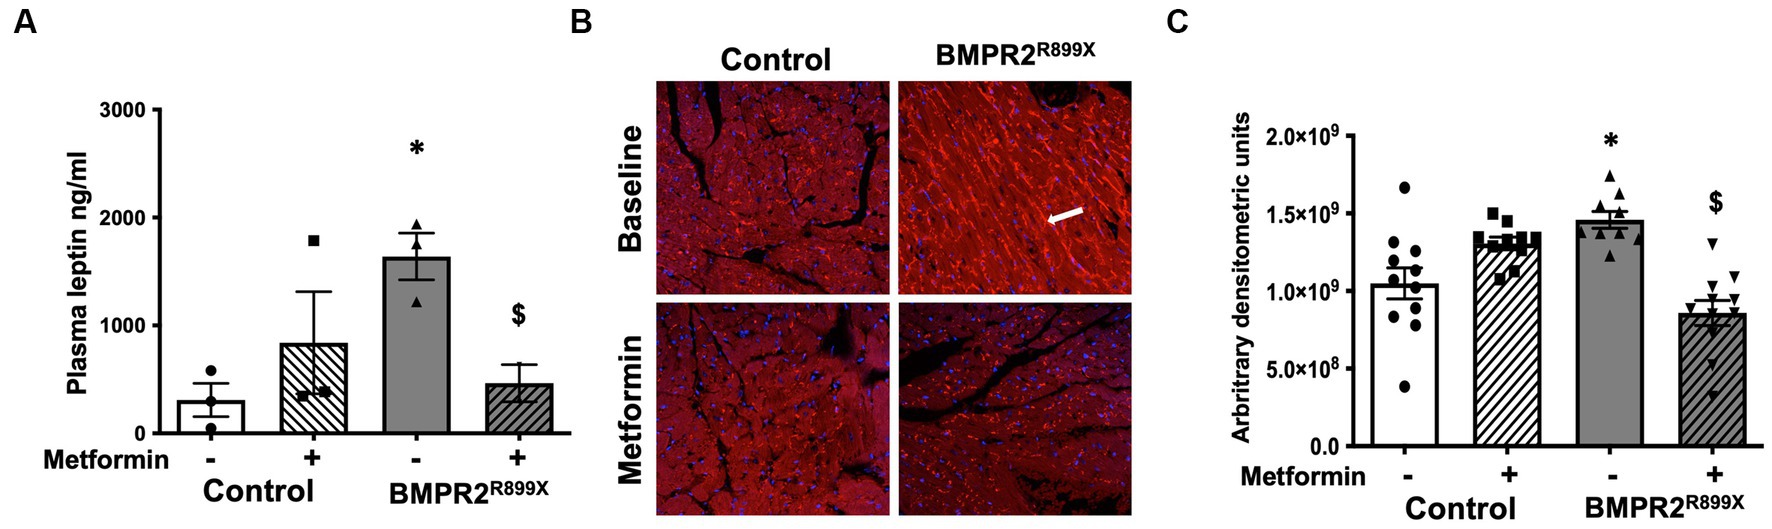
Figure 3. (A) Plasma leptin levels in control and BMPR2R899X mice at baseline and following metformin treatment. *p < 0.05 plasma leptin levels in control vs. BMPR2 mutant mice, $p < 0.05 plasma leptin levels in BMPR2 mutant mice at baseline and following metformin treatment. (B) Immunolocalization of leptin receptor (red color immunofluorescence in the cytoplasm and cell membrane, as depicted by white arrow) in RV tissue from control (n = 4) and BMPR2R899X (n = 5) mice at baseline and after metformin treatment. Magnification 200×. (C) Bar graph shows leptin receptor staining intensity in control and BMPR2R899X mouse RV tissue at baseline and after metformin treatment calculated using arbitrary densitometric units. *p < 0.05 protein expression in control vs. BMPR2 mutant mice, $p < 0.05 protein expression in BMPR2 mutant mice at baseline and following metformin treatment. The statistical test used was a t-test.
In PAH, lipid accumulation in RV cardiomyocytes was previously published by our group and others (22, 28, 35). Leptin exposure can increase the delivery of free fatty acid substrates to left ventricular cardiomyocytes, which can lead to lipid accumulation and cardiac lipotoxicity (41, 42). It is unknown if leptin may, in part, mediate increased lipid uptake and accumulation in the PAH-RV. We, therefore, sought to understand the role of leptin and leptin receptors in free fatty acid uptake in PAH-RV cardiomyocytes using cultured cardiomyocytes (H9C2) with two different BMPR2 mutations: M1, a cytoplasmic tail domain mutation, and M2, a kinase domain mutation (Figure 4). In control and BMPR2 mutant cultured cardiomyocytes, the leptin receptor was localized in the cytoplasm as well as on the cell membrane. In the BMPR2 mutant cells, the localization of the leptin receptor appeared to be more intense (bright red immunofluorescent staining, as indicated by a white arrow) on the cell membrane compared to controls. Leptin stimulation for 1 and 24 h did not change the intensity or localization of leptin receptors in either control or BMPR2 mutant cells (Figure 4A). We, therefore, sought to define the sub-cellular localization of leptin receptors in mutant cells by enriching the cell membrane fraction. At baseline, there was no significant difference in the abundance of leptin receptors in the cell membrane fraction between mutant cells and controls (Figure 4B). While 1 h of leptin stimulation did not affect leptin receptor protein in the plasma membrane in either mutant or control cells, 24 h of leptin stimulation significantly decreased (p < 0.05) leptin receptor protein in control and M2 cells compared to baseline. In contrast, M1 cells had no change in leptin receptor abundance in the plasma membrane fraction despite 24 h of leptin exposure, suggesting that in the presence of this specific mutation, leptin does not downregulate cell membrane localization of leptin receptor. Next, we tested the effect of leptin on fatty acid uptake in these cultured cardiomyocytes with BMPR2 mutation using radioactive palmitate. As previously published (28), at baseline, there was a significant increase in palmitate uptake in cultured cardiomyocytes with BMPR2 mutation (Figure 4C). Consistent with leptin receptor data (Figure 4B), 1 h leptin stimulation did not show any effect on palmitate uptake in control or mutant cells, but leptin stimulation for 24 h demonstrated a trend toward (p = 0.06) an increase in palmitate uptake in M1 mutant cells (Figure 4C) but not M2 cells. We further explored the effect of leptin on the localization of CD36, a key fatty acid transporter molecule, at the cell membrane in mutants and controls (Figure 4D). At baseline, membrane localization of CD36 was significantly increased (p < 0.05) in both BMPR2 mutant cell lines compared to controls. In control cells, CD36 expression increased numerically (p = 0.05) 24 h after leptin stimulation but remained unchanged in both mutant cells following leptin stimulation for 1 and 24 h (Figure 4D). These data suggest that in cultured cardiomyocytes, leptin stimulation has a BMPR2 mutation-specific effect. M1, a cytoplasmic tail domain mutation, appears to ineffectively downregulate leptin receptors after 24 h of leptin stimulation coupled with a mild increase in palmitate uptake, which could potentiate lipid accumulation in a mutation-specific manner. Increased CD36 membrane localization likely does not mediate the M1 effects of leptin stimulation.
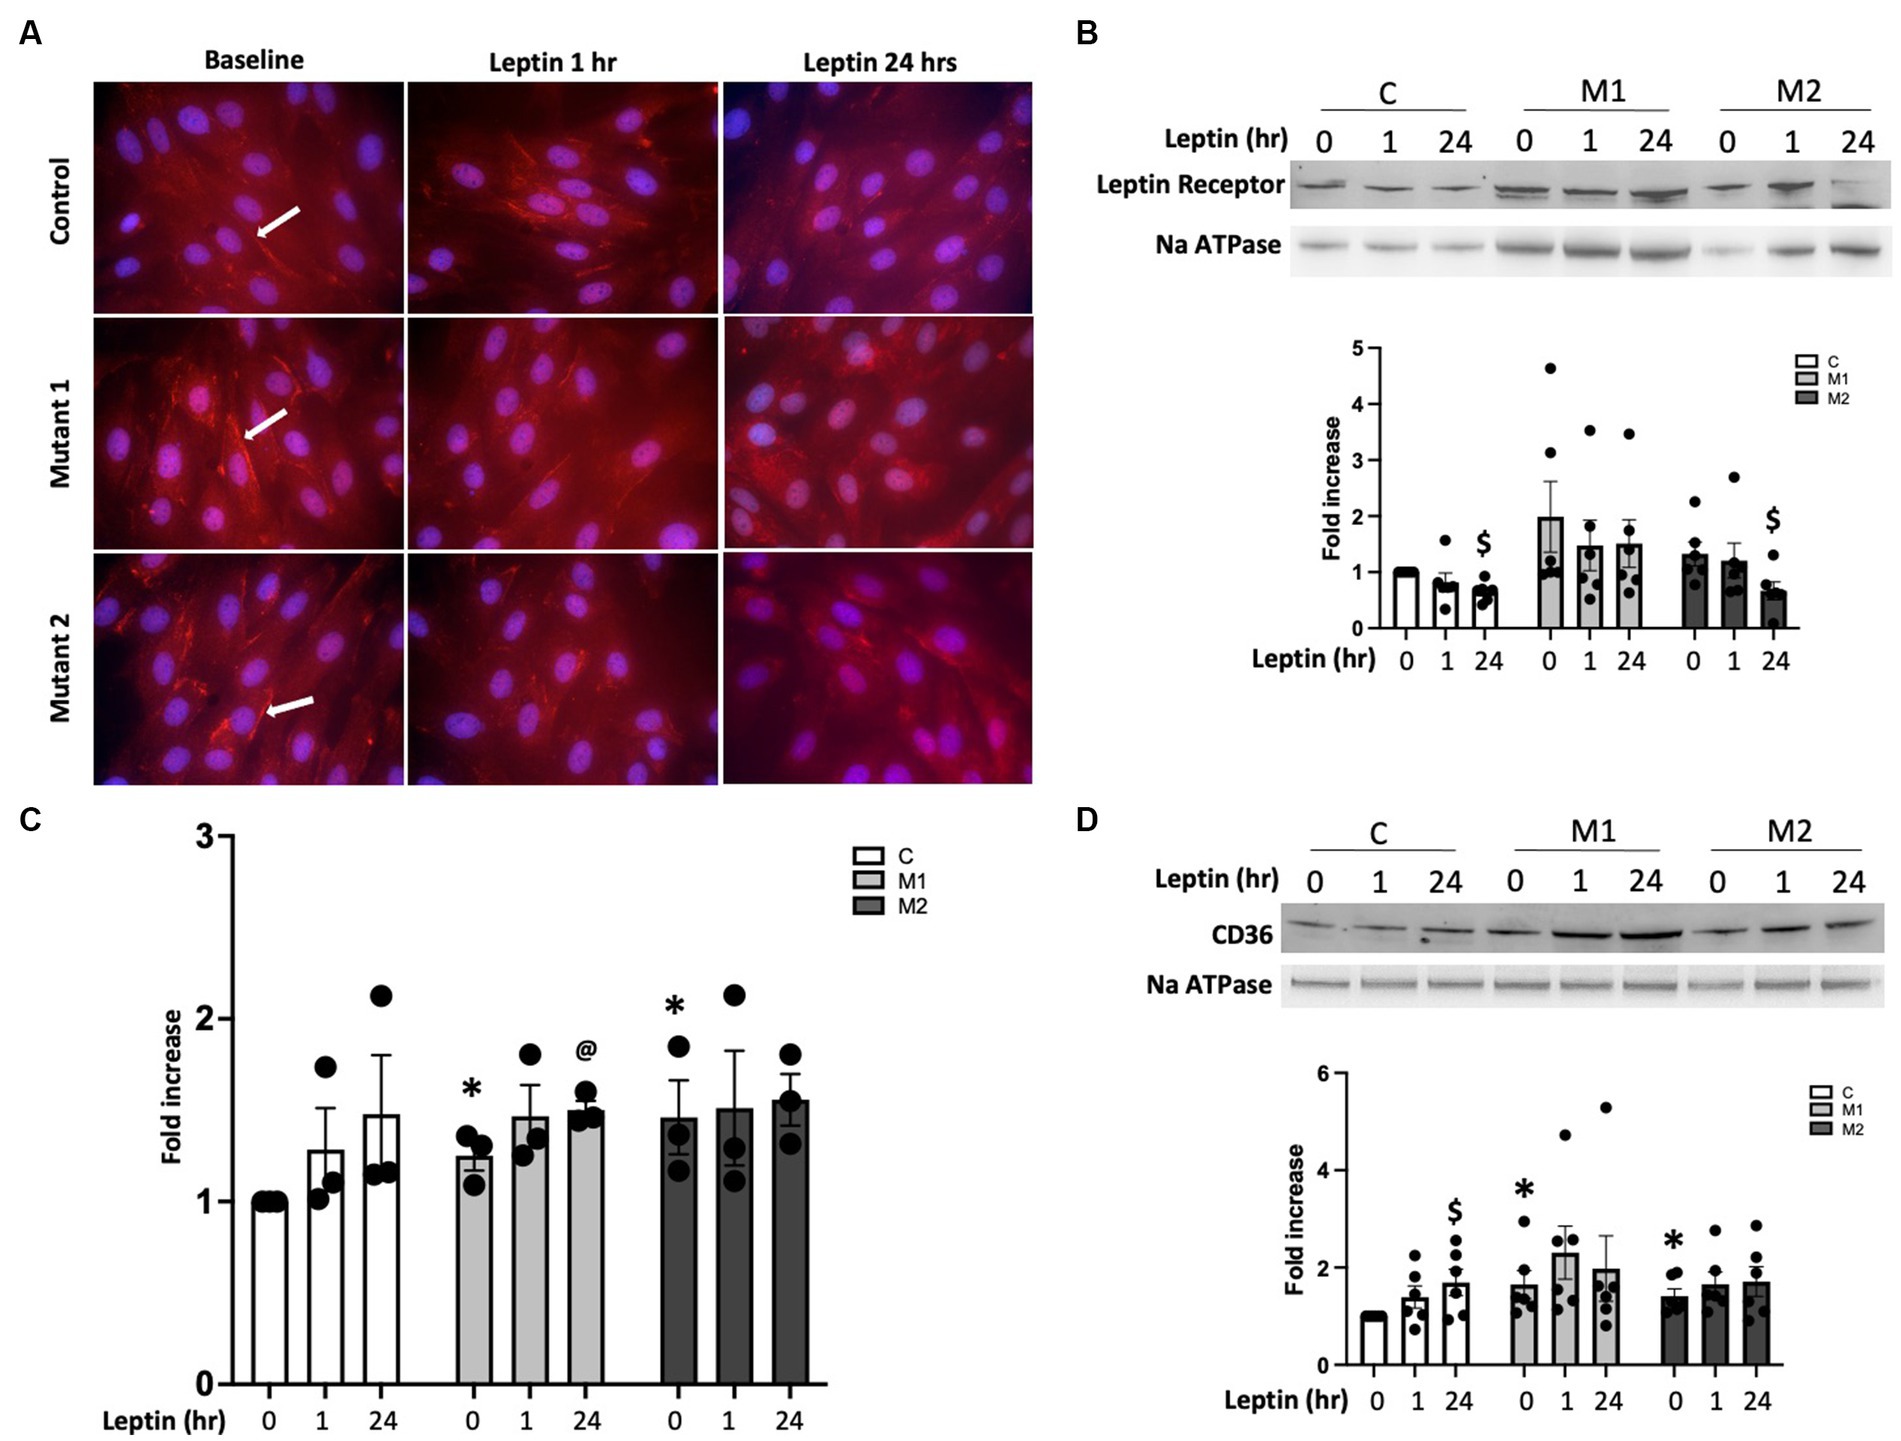
Figure 4. (A) Immunolocalization of leptin receptor in the cytoplasm and on the cell membrane (immunofluorescence staining in red, arrow depicting cell membrane localization of leptin receptor) in cultured cardiomyocytes from control, mutant 1 (M1), and mutant 2 (M2) cells at baseline and following leptin treatment for one and 24 h. Magnification 600×. (B) Western blot gels and bar graphs representing leptin receptor protein in cell membrane fraction in cultured cardiomyocytes from mutant and control cells at baseline and following leptin treatment (n = 6). $p < 0.05, protein expression in control and M2 cells at baseline and 24 h of leptin treatment. (C) [14C] palmitate uptake in cultured cardiomyocytes from control and mutant cells following leptin treatment for 1 and 24 h (n = 6). *p < 0.01, fold increase in palmitate uptake in mutant cells compared with control. @p = 0.06, fold increase in palmitate uptake in mutant cells following 24 h of leptin treatment. (D) Western blot gels and bar graphs representing CD36 protein in cell membrane fraction in mutant and control at baseline and following leptin treatment (n = 6). $p < 0.05, protein expression in control cells at baseline and 24 h leptin treatment. *p < 0.05, protein expression in M1 vs. control cells and M2 vs. control cells. The statistical test used was a t-test.
Leptin is a liporegulatory hormone that controls lipid homeostasis in the heart (43) and can stimulate fatty acid oxidation (FAO) in muscle and the left ventricle (44). Metformin is also known to increase FAO in several tissues (45, 46), so we hypothesized that there may be an interaction between leptin and metformin in RV metabolism. We next tested the effect of leptin, metformin, or both on palmitate-driven mitochondrial respiration by measuring oxygen consumption rate (OCR) in cultured cardiomyocytes with and without BMPR2 mutation using the Seahorse XFe96 Extracellular Flux Analyzer (Figure 5). At baseline, as expected (28), basal and maximal OCR were significantly decreased (p < 0.01) in mutant cells compared to controls (Figures 5A–C). Following leptin stimulation, in control and mutant cells, there was a modest but not significant increase in basal and maximal OCR, especially in M2 cells compared to baseline. Furthermore, following leptin treatment in mutant cells, basal OCR remained significantly lower (p < 0.001) and maximal OCR trended lower than the controls (Supplementary Figure S2A). With metformin treatment, there was a modest (not significant) increase in basal OCR in control and mutant cells and a significant increase in maximal OCR in M2 but not M1 cells compared to controls (Figure 5B). Finally, when control cells were exposed to both leptin and metformin, there was no change in either basal or maximal OCR. While there was no significant change in basal OCR in either mutant cell line, maximal OCR was significantly increased (p < 0.001) in M1 cells but not M2 cells compared to controls (Figure 5C; Supplementary Figure S2C). These data show that leptin alone does not increase lipid-driven mitochondrial respiration in control or BMPR2 mutant cardiomyocytes, while metformin exposure increases maximal OCR in M2 cells selectively. Metformin and leptin exposure together in M1 cells alone increased lipid-stimulated mitochondrial respiration. These data further support a BMPR2 mutation-specific effect of metformin on mitochondrial function.
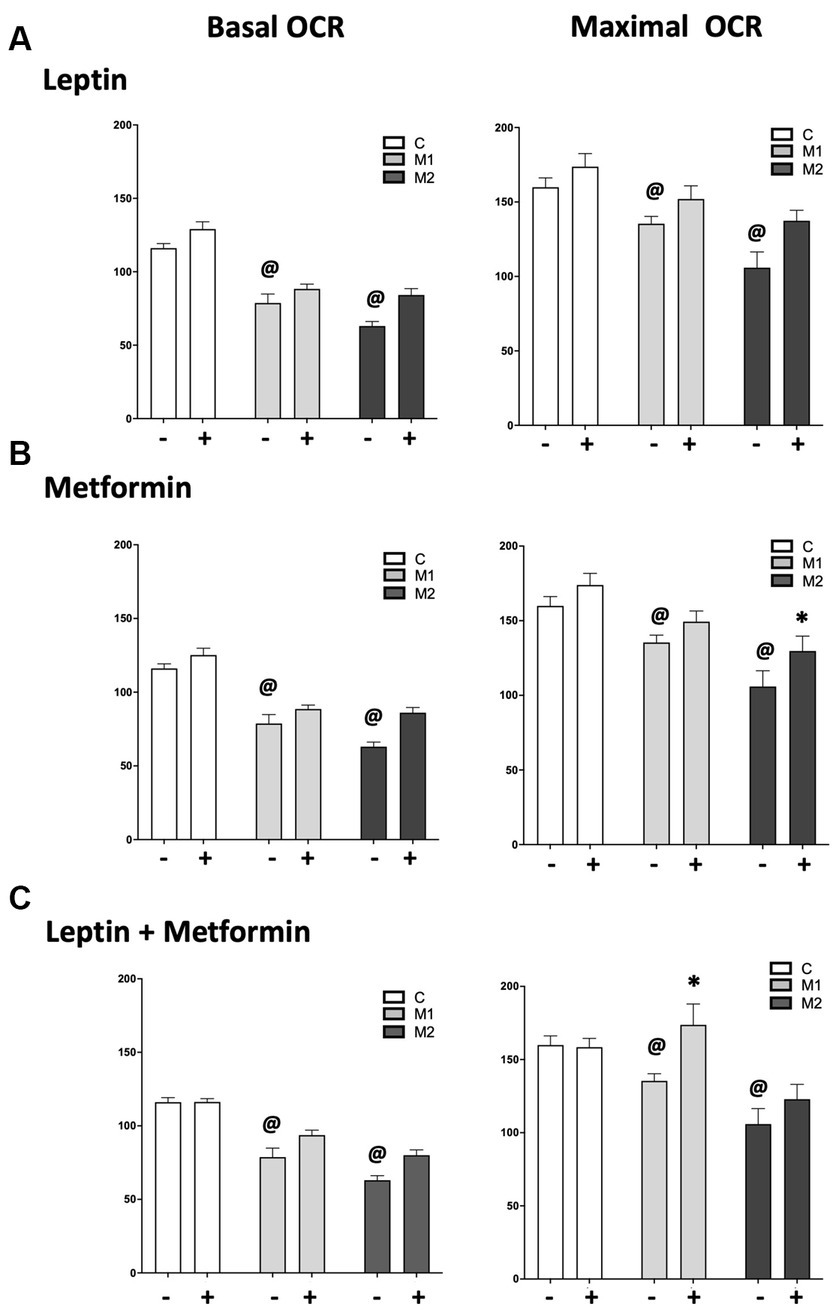
Figure 5. Oxygen consumption rate (OCR) measured following the addition of inhibitors of electron transport chain in the presence of palmitate in cultured cardiomyocytes from control and mutant cells grown in fatty acid oxidation (FAO) media, FAO media with leptin (6 ng/mL), FAO media with metformin (0.1 mM/mL) and FAO media with leptin (6 ng/mL) and metformin (0.1 mM/mL). (A) Basal and maximal OCR in control and mutant cells at baseline and following leptin treatment for 1 h. (B) Basal and maximal OCR in control and mutant cells at baseline and following metformin treatment for 1 h. p < 0.01 maximal OCR in M2 cells at baseline vs. metformin treatment. (C) Basal and maximal OCR in control and mutant cells at baseline and following leptin plus metformin treatment for 1 h. p < 0.01 maximal OCR in M1 cells at baseline vs. leptin plus metformin treatment. The statistical test used was a two-way ANOVA. @p < 0.01 Change in basal and maximal OCR in mutant cells compared to controls.
We next sought to understand potential mechanisms that may explain the BMPR2 mutation-specific metabolic findings identified in response to leptin stimulation and metabolic interventions. In cultured cardiomyocytes with two forms of BMPR2 mutation and controls, we assayed gene expression by quantitative real-time polymerase chain reaction (RT-PCR) key genes regulating lipid accumulation and mitochondrial respiration following 1 h of either leptin or metformin or both treatments. We found that leptin treatment alone does not alter genes involved in fatty acid oxidation or fatty acid synthesis in both control and mutant cells (Figures 6A–D). However, metformin alone significantly decreases (p < 0.05) the expression of the fatty acid synthase (FASN) gene in M2 but not M1 cells compared to control cells (Figure 6A). This gene is responsible for the synthesis of long-chain fatty acids such as palmitate from acetyl- and malonyl-CoA; thus, metformin may potentially limit fatty acid synthesis only in M2 cells. Furthermore, metformin and leptin significantly decreased (p < 0.01) the expression of the acetyl-CoA carboxylase gene in M1 but not M2 cells compared to controls (Figure 6B). This gene is responsible for catalyzing the carboxylation of acetyl-CoA, the rate-limiting step in fatty acid synthesis, suggesting that in the presence of leptin and metformin, acetyl-CoA may be available for fatty acid oxidation in M1 cells. In M2 cells, metformin together with leptin significantly reduced (p < 0.05) the expression of carnitine palmitoyltransferase 1A (CPT1A) and showed a trend toward reduction (p = 0.07) in the expression of the CPT1B gene compared to control cells (Figures 6C,D). Both of these genes are essential for the net transport of long-chain fatty acids from the cytoplasm to the mitochondria, suggesting acetyl-CoA may not be available for FAO in these cells. Taken together, these data indicate that metformin influences genes involved in fatty acid synthesis, and metformin, together with leptin, can influence genes involved in fatty acid oxidation in a BMPR2 mutation-specific manner.
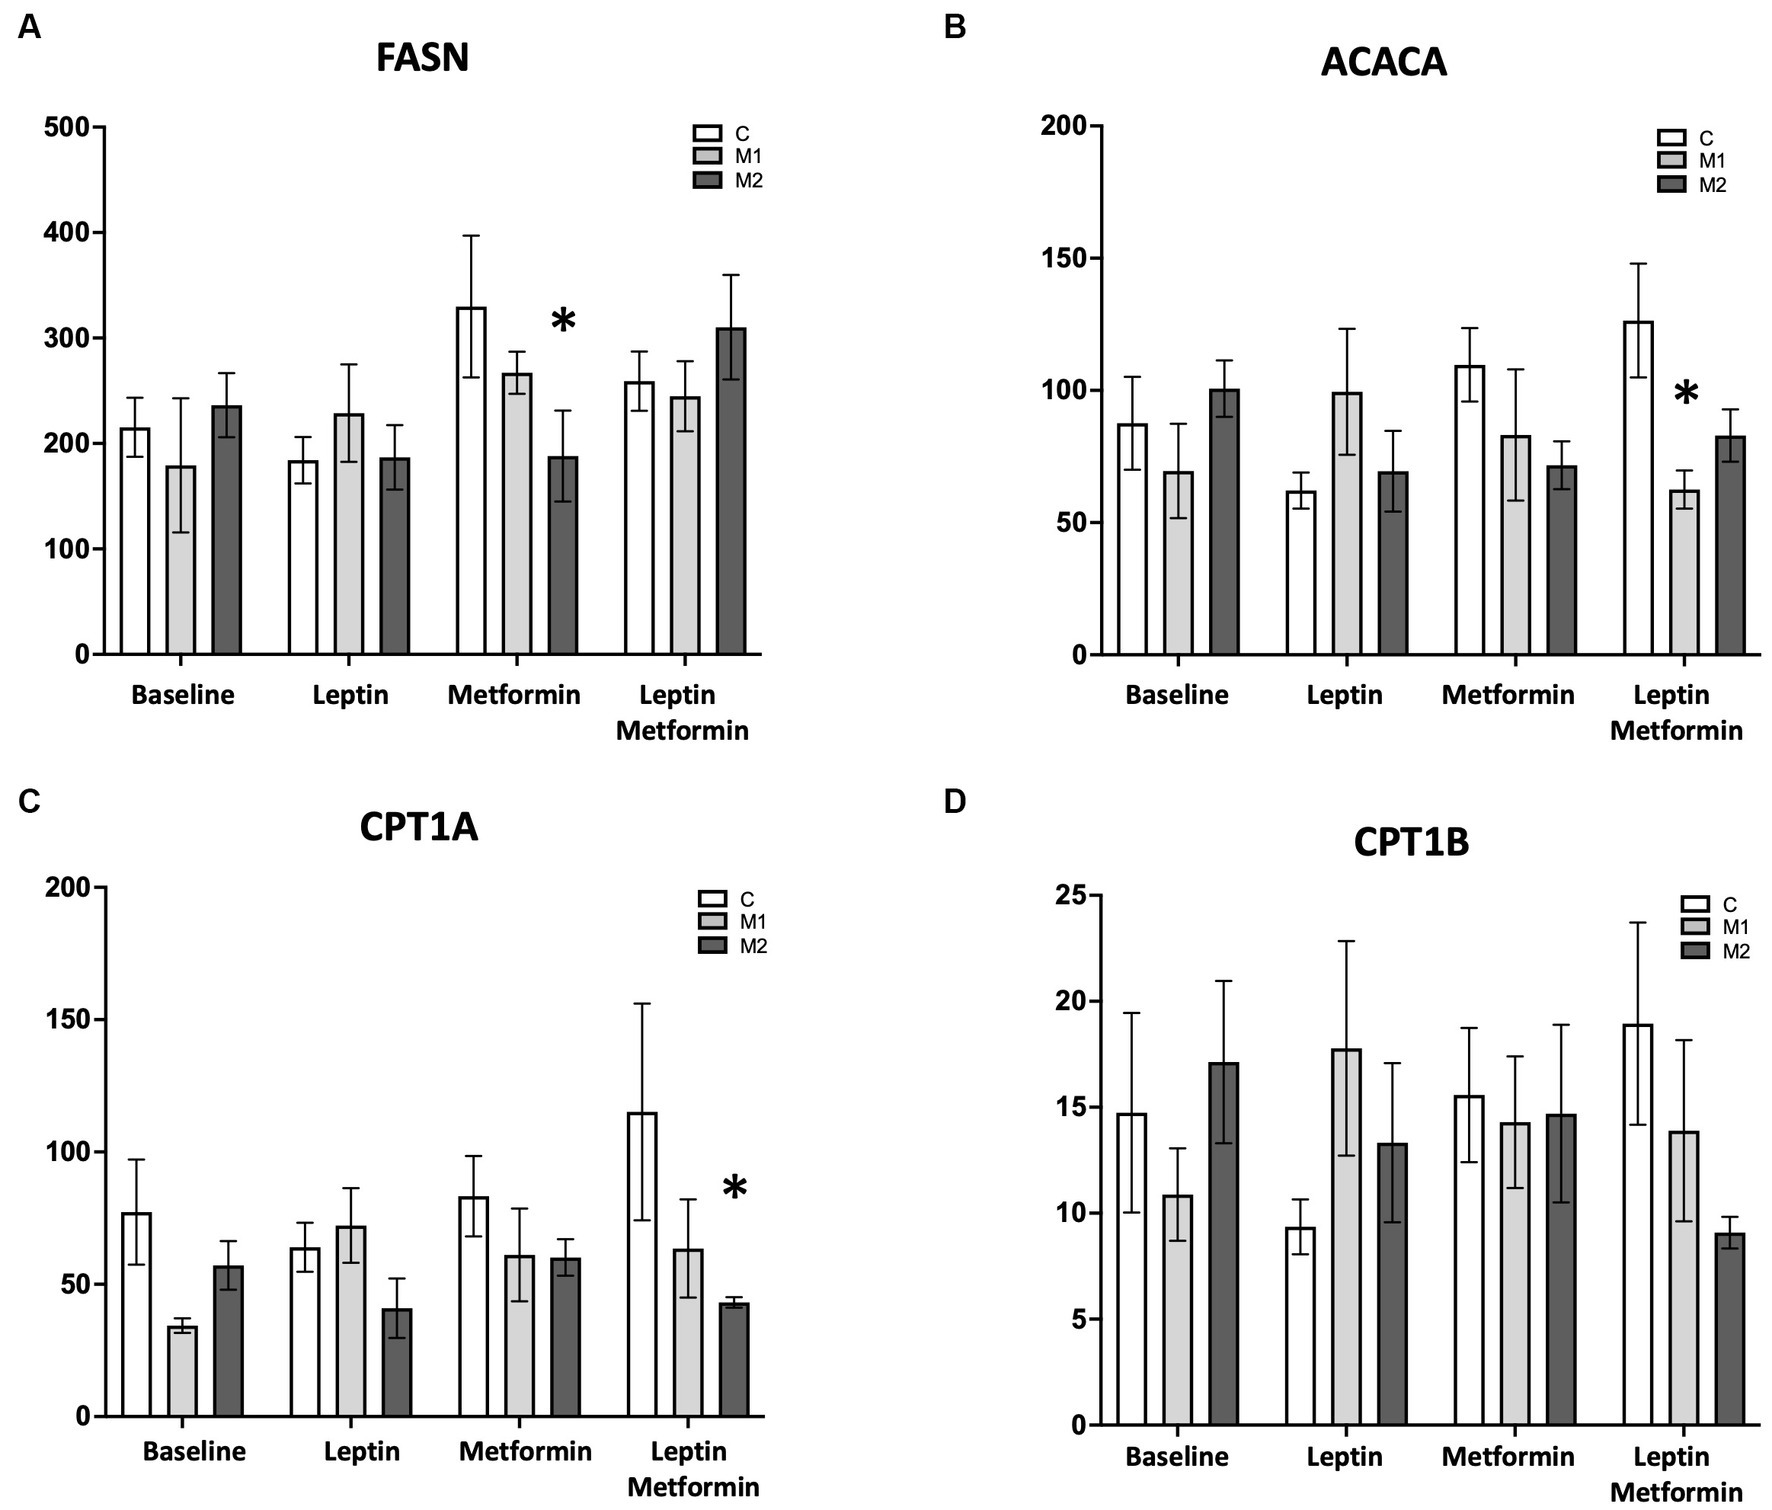
Figure 6. Gene expression profile in the presence of palmitate in cultured cardiomyocytes from control and mutant cells at baseline, with leptin (6 ng/mL), with metformin (0.1 mM/mL), and with leptin (6 ng/mL) and metformin (0.1 mM/mL). (A) FASN, (B) ACACA, (C) CPT1A, and (D) CPT1B *p < 0.01. The statistical test used was a two-way ANOVA.
In this study, we sought to understand how leptin and leptin signaling may impact the RV in PAH and whether this may be altered by a metabolic intervention that is being explored in PAH, metformin (NCT03617458). Using human samples and rodent models of the RV in PAH, we show that leptin levels in circulation and leptin receptor expression in RV cardiomyocytes are both increased in PAH compared to controls. We further show that metformin therapy reduced both plasma leptin abundance and RV leptin receptor expression. In a cardiomyocyte cell line with two different BMPR2 mutations that recapitulate metabolic features of the PAH-RV (28), we found a mutation-specific effect of leptin on metabolism. Specifically, exposure to leptin increased palmitate uptake without affecting leptin receptor expression or mitochondrial respiration in a cytoplasmic domain BMPR2 mutation, which has implications for the well-described RV steatosis in PAH. Furthermore, we observed that when cultured cardiomyocytes with BMPR2 mutation are exposed to leptin and metformin together, there is an improvement in mitochondrial respiration, suggesting that metformin may counteract the enhanced fat uptake stimulated by leptin by influencing genes involved in fatty acid oxidation, again in a BMPR2 mutation-specific manner. These data suggest that leptin may play a role in RV metabolism, and leptin-mediated RV metabolic changes can be altered by metformin in a mutation-specific manner.
There have been other publications focused on the role of leptin in pulmonary vascular disease (PAH). In accordance with prior publications in PAH patients (15, 16, 21), our data also shows an increase in the circulating levels of leptin in PAH patients and a moderately significant correlation with BMI. Similarly, our data showing increased leptin in circulation in the mouse model of PAH with BMPR2 mutation is consistent with the published data in hypoxia and the monocrotaline mouse model of PH (18), although this has never been confirmed in BMPR2 mutant mice, which have a strong recapitulation of human metabolic features (28, 47, 48). Finally, an increase in leptin receptor expression in lung tissue and circulating cells from both PAH patients and animal models of PH has previously been demonstrated (15, 19), but we, for the first time, demonstrate an increase in leptin receptor localization in PAH-RV cardiomyocytes and RV cardiomyocytes from mouse models of RV stress load. Thus, the leptin-signaling pathway may have an important role to play in the development of PAH, but these data are novel in that they suggest leptin may not just promote pulmonary vascular disease in PAH (18) but may also affect the RV in PAH.
Leptin and leptin receptors are shown to be increased more than four-fold in the failing human left ventricle (8), and in ischemic cardiac injury, leptin receptor expression is significantly increased in the RV (49). Similarly, pressure-mediated left ventricular hypertrophy and mechanical stretch also upregulate leptin receptor gene expression (39). Thus, in cardiomyocytes, the leptin receptor is an important component of the leptin-signaling pathway (39). Our study adds to this body of literature by demonstrating that in the RV of PAH patients and two mouse models of RV dysfunction, leptin receptor expression is significantly increased.
Leptin can elevate cellular lipid pools by increasing the uptake of exogenous fatty acids (42, 50). This effect is mediated via increased expression and membrane translocation of CD36, which plays a critical role in fatty acid import (44, 51). In HL-1 (a mouse cultured cardiomyocyte cell line), Palanivel et al. (42) have shown an increase in leptin-stimulated palmitate uptake trended higher compared to baseline, it is not significant. M2 mutant cells, in which the mutation is in the BMPR2 kinase domain, behaved similarly to control cells in leptin-stimulated palmitate uptake and reduction in cell surface leptin receptor. Interestingly, in M1 mutant cells with a cytoplasmic domain BMPR2 mutation, we observed a further increase in leptin-stimulated palmitate uptake, corresponding to no reduction in cell surface leptin receptor and complemented by a significant increase in leptin-stimulated palmitate uptake. In HL-1, leptin-stimulated palmitate uptake is shown to correspond with increased cell surface CD36 protein content (42, 44). Our findings in control cells show a similar increase in leptin-stimulated cell surface CD36 protein, but not in mutant cells. This could be because cell surface CD36 protein is already increased in mutant cells as a result of BMPR2 mutation. In past studies, we have demonstrated pleiotropic effects of these BMPR2 mutations in cell culture and animal studies (48, 52–54), which is consistent with the differences we observe with regard to palmitate uptake in response to leptin in these cultured BMPR2 mutant cardiomyocytes. Differences in cytoplasmic tail signaling may underlie some of our observed variability in cell culture and likely underlie the clinical heterogeneity across HPAH families.
Metformin is an antidiabetic medication with multiple potential mechanisms of action that has been shown to reduce RV lipids in PAH patients (55) and is presently under study as a therapy for PAH in a multicenter trial. In animal models of PH, metformin has been shown to prevent the deleterious effects of high fat on RV function and myocardial steatosis (22). We, therefore, sought to understand if there might be an interaction between metformin and leptin in the RV. In concordance with published findings (56–58), our data also shows that metformin reduces circulating levels of leptin in humans and in a mouse model of PH. In the PAH-RV, metformin is shown to reduce lipid deposition, which is in the form of ceramides (22), probably through inhibition of ceramide synthesis (59). In dysfunctional cardiomyocytes at the cellular level, metformin is shown to improve mitochondrial function (60) and mitochondrial biogenesis (61), promote B-oxidation of fatty acids (62), and decrease mitochondrial permeability transition pore (mPTP) opening (63, 64). Here we add the novel observation that metformin treatment also reduces RV leptin receptor protein in the PAH-RV. In cultured cardiomyocytes as well, we show a metformin-dependent improvement in maximal mitochondrial oxygen consumption rate and a decrease in FASN gene expression (a multifunctional enzyme that catalyzes the de novo biosynthesis of long-chain saturated fatty acids starting from acetyl-CoA and malonyl-CoA in the presence of NADPH) in the presence of available free fatty acids in BMPR2 mutation-specific manner. Metformin is also shown to enhance leptin sensitivity and correct leptin resistance in high-fat-fed obese rats, and a combination therapy including metformin and leptin is helpful in the treatment of obesity (65). In cultured cardiomyocytes, we have shown that metformin in combination with leptin can improve mitochondrial function by increasing lipid-dependent mitochondrial respiration and decreasing ACACA gene expression (the cytosolic enzyme that catalyzes the carboxylation of acetyl-CoA to malonyl-CoA, the first and rate-limiting step of de novo fatty acid biosynthesis) in BMPR2 mutation-specific manner, suggesting a combination of leptin and metformin may have a beneficial effect.
In conclusion, in PAH, increased circulating leptin can influence metabolic signaling in RV cardiomyocytes via leptin receptors. This pathway may play a role in altering lipid-dependent RV metabolism at the cellular level in combination with metformin in a mutation-specific manner, hence warranting further studies.
The original contributions presented in the study are included in the article/Supplementary material, further inquiries can be directed to the corresponding author.
The studies involving humans were approved by Vanderbilt University Medical Center. The studies were conducted in accordance with the local legislation and institutional requirements. The participants provided their written informed consent to participate in this study. The animal study was approved by Institutional Animal Care and Use Committee. The study was conducted in accordance with the local legislation and institutional requirements.
MT: Conceptualization, Data curation, Formal analysis, Investigation, Methodology, Resources, Supervision, Writing – original draft, Writing – review & editing. EB: Funding acquisition, Writing – review & editing. VA: Funding acquisition, Methodology, Writing – review & editing. NF: Writing – review & editing. KS: Writing – review & editing. SS: Writing – review & editing. XZ: Writing – review & editing. MF: Formal analysis, Methodology, Writing – review & editing. JW: Conceptualization, Methodology, Writing – review & editing. AH: Conceptualization, Data curation, Formal analysis, Funding acquisition, Methodology, Resources, Writing – review & editing.
The author(s) declare financial support was received for the research, authorship, and/or publication of this article. This study was supported by P01 HL 108800-01A1, 1R01 HL122417-01A1, K08 HL121174, R01 HL146588 (EB), R01 HL155278 (EB), 1K08HL153956 (VA), and 1IK2BX005828 (VA).
The Agilent Seahorse Extracellular Flux Analyzer is housed and managed within the Vanderbilt High-Throughput Screening Core Facility, an institutionally supported core, and was funded by NIH Shared Instrumentation Grant 1S10OD018015.
AH has done consulting work for Janssen, Merck, United Therapeutics, Gossamer, and Bayer. She holds stock in Tenax Therapeutics.
The remaining authors declare that the research was conducted in the absence of any commercial or financial relationships that could be construed as a potential conflict of interest.
All claims expressed in this article are solely those of the authors and do not necessarily represent those of their affiliated organizations, or those of the publisher, the editors and the reviewers. Any product that may be evaluated in this article, or claim that may be made by its manufacturer, is not guaranteed or endorsed by the publisher.
The Supplementary material for this article can be found online at: https://www.frontiersin.org/articles/10.3389/fmed.2023.1276422/full#supplementary-material
SUPPLEMENTARY FIGURE S1 | (A) Plasma leptin levels in PAH patients (n=18) at baseline and after 8 weeks of metformin treatment. *p<0.0001 (Wilcoxon matched-pairs signed rank test). (B) Correlation between plasma leptin and BMI <25 in PAH patients (n=9) *p<0.0001. (C) Correlation between plasma leptin and BMI 25< in PAH patients (n=17) *p<0.0001.
Supplementary Figure S2 | Oxygen consumption rate (OCR) measured over time following the addition of inhibitors of electron transport chain in the presence of palmitate in cultured cardiomyocytes from control and mutant cells grown in fatty acid oxidation (FAO) media, (A) FAO media with leptin (6ng/ml), (B) FAO media with metformin (0.1mM/ml); p< 0.001 Maximal OCR in M2 cells at baseline vs metformin treatment and (C) FAO media with leptin (6ng/ml) and metformin (0.1mM/ml); *p< 0.05 Maximal OCR in M1 cells at baseline vs leptin plus metformin treatment. Control cells at baseline: Black circles; Control cells with leptin: Black squares; Control cells with metformin: Black triangles; Control cells with leptin and metformin: black diamonds; M1 cells at baseline: Blue circles; M1 cells with leptin: Blue squares; M1 cells with metformin: Blue triangles; M1 cells with leptin and metformin: Blue diamonds; M2 cells at baseline: Red circles; M2 cells with leptin: Red squares; M2 cells with metformin: Red triangles; M2 cells with leptin and metformin: Red diamonds. @p< 0.01 Basal OCR in control vs M1 and M2 cells in leptin and metformin treated cells. $p< 0.05 Maximal OCR in control vs M2 cells in metformin treated cells. %p< 0.001 Maximal OCR in M1 vs M2 cells in leptin plus metformin treated cells.
1. Brittain, EL, Niswender, K, Agrawal, V, Chen, X, Fan, R, Pugh, ME, et al. Mechanistic phase II clinical trial of metformin in pulmonary arterial hypertension. J Am Heart Assoc. (2020) 9:e018349. doi: 10.1161/JAHA.120.018349
2. Zhang, Y, Proenca, R, Maffei, M, Barone, M, Leopold, L, and Friedman, JM. Positional cloning of the mouse obese gene and its human homologue. Nature. (1994) 372:425–32. doi: 10.1038/372425a0
3. Elmquist, JK, Coppari, R, Balthasar, N, Ichinose, M, and Lowell, BB. Identifying hypothalamic pathways controlling food intake, body weight, and glucose homeostasis. J Comp Neurol. (2005) 493:63–71. doi: 10.1002/cne.20786
4. Friedman, JM, and Halaas, JL. Leptin and the regulation of body weight in mammals. Nature. (1998) 395:763–70. doi: 10.1038/27376
5. Sainz, N, Barrenetxe, J, Moreno-Aliaga, MJ, and Martinez, JA. Leptin resistance and diet-induced obesity: central and peripheral actions of leptin. Metabolism. (2015) 64:35–46. doi: 10.1016/j.metabol.2014.10.015
6. McGaffin, KR, Witham, WG, Yester, KA, Romano, LC, O’Doherty, RM, McTiernan, CF, et al. Cardiac-specific leptin receptor deletion exacerbates ischaemic heart failure in mice. Cardiovasc Res. (2011) 89:60–71. doi: 10.1093/cvr/cvq288
7. McGaffin, KR, Moravec, CS, and McTiernan, CF. Leptin signaling in the failing and mechanically unloaded human heart. Circ Heart Fail. (2009) 2:676–83. doi: 10.1161/CIRCHEARTFAILURE.109.869909
8. Hall, ME, Harmancey, R, and Stec, DE. Lean heart: role of leptin in cardiac hypertrophy and metabolism. World J Cardiol. (2015) 7:511–24. doi: 10.4330/wjc.v7.i9.511
9. Smith, CC, Mocanu, MM, Davidson, SM, Wynne, AM, Simpkin, JC, and Yellon, DM. Leptin, the obesity-associated hormone, exhibits direct cardioprotective effects. Br J Pharmacol. (2006) 149:5–13. doi: 10.1038/sj.bjp.0706834
10. Hou, N, and Luo, JD. Leptin and cardiovascular diseases. Clin Exp Pharmacol Physiol. (2011) 38:905–13. doi: 10.1111/j.1440-1681.2011.05619.x
11. Frühbeck, G, Catalán, V, Rodríguez, A, Ramírez, B, Becerril, S, Salvador, J, et al. Involvement of the leptin-adiponectin axis in inflammation and oxidative stress in the metabolic syndrome. Sci Rep. (2017) 7:6619. doi: 10.1038/s41598-017-06997-0
12. Kim, LJ, Shin, MK, Pho, H, Otvos, L Jr, Tufik, S, Andersen, ML, et al. Leptin receptor blockade attenuates hypertension, but does not affect ventilatory response to hypoxia in a model of polygenic obesity. Front Physiol. (2021) 12:688375. doi: 10.3389/fphys.2021.688375
13. Yang, R, and Barouch, LA. Leptin signaling and obesity: cardiovascular consequences. Circ Res. (2007) 101:545–59. doi: 10.1161/CIRCRESAHA.107.156596
14. Allison, MB, and Myers, MG Jr. 20 years of leptin: connecting leptin signaling to biological function. J Endocrinol. (2014) 223:T25–35. doi: 10.1530/JOE-14-0404
15. Huertas, A, Tu, L, Gambaryan, N, Girerd, B, Perros, F, Montani, D, et al. Leptin and regulatory T-lymphocytes in idiopathic pulmonary arterial hypertension. Eur Respir J. (2012) 40:895–904. doi: 10.1183/09031936.00159911
16. Tonelli, AR, Fares, WH, Dakkak, W, Rao, Y, Zhou, X, and Dweik, RA. Do single or sequential measurements of leptin and adiponectin in plasma have prognostic value in pulmonary arterial hypertension? Pulm Circ. (2017) 7:727–9. doi: 10.1177/2045893217717219
17. Huertas, A, Phan, C, Bordenave, J, Tu, L, Thuillet, R, Le Hiress, M, et al. Regulatory T cell dysfunction in idiopathic, heritable and connective tissue-associated pulmonary arterial hypertension. Chest. (2016) 149:1482–93. doi: 10.1016/j.chest.2016.01.004
18. Chai, S, Wang, W, Liu, J, Guo, H, Zhang, ZF, Wang, C, et al. Leptin knockout attenuates hypoxia-induced pulmonary arterial hypertension by inhibiting proliferation of pulmonary arterial smooth muscle cells. Transl Res. (2015) 166:772–82. doi: 10.1016/j.trsl.2015.09.007
19. Huertas, A, Tu, L, Thuillet, R, le Hiress, M, Phan, C, Ricard, N, et al. Leptin signalling system as a target for pulmonary arterial hypertension therapy. Eur Respir J. (2015) 45:1066–80. doi: 10.1183/09031936.00193014
20. Aytekin, M, Tonelli, AR, Farver, CF, Feldstein, AE, and Dweik, RA. Leptin deficiency recapitulates the histological features of pulmonary arterial hypertension in mice. Int J Clin Exp Pathol. (2014) 7:1935–46.
21. Tonelli, AR, Aytekin, M, Feldstein, AE, and Dweik, RA. Leptin levels predict survival in pulmonary arterial hypertension. Pulm Circ. (2012) 2:214–9. doi: 10.4103/2045-8932.97607
22. Brittain, EL, Talati, M, Fortune, N, Agrawal, V, Meoli, DF, West, J, et al. Adverse physiologic effects of western diet on right ventricular structure and function: role of lipid accumulation and metabolic therapy. Pulm Circ. (2019) 9:1–9. doi: 10.1177/2045894018817741
23. Liu, Y, Xu, Y, Zhu, J, Li, H, Zhang, J, Yang, G, et al. Metformin prevents progression of experimental pulmonary hypertension via inhibition of autophagy and activation of adenosine monophosphate-activated protein kinase. J Vasc Res. (2019) 56:117–28. doi: 10.1159/000498894
24. Nar, A, and Gedik, O. The effect of metformin on leptin in obese patients with type 2 diabetes mellitus and nonalcoholic fatty liver disease. Acta Diabetol. (2009) 46:113–8. doi: 10.1007/s00592-008-0067-2
25. Talati, M, and Hemnes, A. Fatty acid metabolism in pulmonary arterial hypertension: role in right ventricular dysfunction and hypertrophy. Pulm Circ. (2015) 5:269–78. doi: 10.1086/681227
26. Hemnes, AR, Luther, JM, Rhodes, CJ, Burgess, JP, Carlson, J, Fan, R, et al. Human PAH is characterized by a pattern of lipid-related insulin resistance. JCI Insight. (2019) 4:e123611. doi: 10.1172/jci.insight.123611
27. Nobuhara, M, Saotome, M, Watanabe, T, Urushida, T, Katoh, H, Satoh, H, et al. Mitochondrial dysfunction caused by saturated fatty acid loading induces myocardial insulin-resistance in differentiated H9c2 myocytes: a novel ex vivo myocardial insulin-resistance model. Exp Cell Res. (2013) 319:955–66. doi: 10.1016/j.yexcr.2013.02.004
28. Talati, MH, Brittain, EL, Fessel, JP, Penner, N, Atkinson, J, Funke, M, et al. Mechanisms of lipid accumulation in the bone morphogenetic protein receptor type 2 mutant right ventricle. Am J Respir Crit Care Med. (2016) 194:719–28. doi: 10.1164/rccm.201507-1444OC
29. Dott, W, Mistry, P, Wright, J, Cain, K, and Herbert, KE. Modulation of mitochondrial bioenergetics in a skeletal muscle cell line model of mitochondrial toxicity. Redox Biol. (2014) 2:224–33. doi: 10.1016/j.redox.2013.12.028
30. Archer, SL, Fang, YH, Ryan, JJ, and Piao, L. Metabolism and bioenergetics in the right ventricle and pulmonary vasculature in pulmonary hypertension. Pulm Circ. (2013) 3:144–52. doi: 10.4103/2045-8932.109960
31. Johnson, JA, Hemnes, AR, Perrien, DS, Schuster, M, Robinson, LJ, Gladson, S, et al. Cytoskeletal defects in BMPR2-associated pulmonary arterial hypertension. Am J Physiol Lung Cell Mol Physiol. (2012) 302:L474–84. doi: 10.1152/ajplung.00202.2011
32. Yasuda, T, Tada, Y, Tanabe, N, Tatsumi, K, and West, J. Rho-kinase inhibition alleviates pulmonary hypertension in transgenic mice expressing a dominant-negative type II bone morphogenetic protein receptor gene. Am J Physiol Lung Cell Mol Physiol. (2011) 301:L667–74. doi: 10.1152/ajplung.00423.2010
33. West, J, Harral, J, Lane, K, Deng, Y, Ickes, B, Crona, D, et al. Mice expressing BMPR2R899X transgene in smooth muscle develop pulmonary vascular lesions. Am J Physiol Lung Cell Mol Physiol. (2008) 295:L744–55. doi: 10.1152/ajplung.90255.2008
34. West, J, Niswender, KD, Johnson, JA, Pugh, ME, Gleaves, L, Fessel, JP, et al. A potential role for insulin resistance in experimental pulmonary hypertension. Eur Respir J. (2013) 41:861–71. doi: 10.1183/09031936.00030312
35. Hemnes, AR, Brittain, EL, Trammell, AW, Fessel, JP, Austin, ED, Penner, N, et al. Evidence for right ventricular lipotoxicity in heritable pulmonary arterial hypertension. Am J Respir Crit Care Med. (2014) 189:325–34. doi: 10.1164/rccm.201306-1086OC
36. Ryan, J, Dasgupta, A, Huston, J, Chen, KH, and Archer, SL. Mitochondrial dynamics in pulmonary arterial hypertension. J Mol Med. (2015) 93:229–42. doi: 10.1007/s00109-015-1263-5
37. Ha, H, and Pak, Y. Modulation of the caveolin-3 and Akt status in caveolae by insulin resistance in H9c2 cardiomyoblasts. Exp Mol Med. (2005) 37:169–78. doi: 10.1038/emm.2005.23
38. Karmazyn, M, Gan, XT, and Rajapurohitam, V. The potential contribution of circulating and locally produced leptin to cardiac hypertrophy and failure. Can J Physiol Pharmacol. (2013) 91:883–8. doi: 10.1139/cjpp-2013-0057
39. Matsui, H, Yokoyama, T, Tanaka, C, Sunaga, H, Koitabashi, N, Takizawa, T, et al. Pressure mediated hypertrophy and mechanical stretch up-regulate expression of the long form of leptin receptor (Ob-Rb) in rat cardiac myocytes. BMC Cell Biol. (2012) 13:37. doi: 10.1186/1471-2121-13-37
40. Lin, YC, Huang, J, Hileman, S, Martin, KH, Hull, R, Davis, M, et al. Leptin decreases heart rate associated with increased ventricular repolarization via its receptor. Am J Physiol Heart Circ Physiol. (2015) 309:H1731–9. doi: 10.1152/ajpheart.00623.2015
41. Sloan, C, Tuinei, J, Nemetz, K, Frandsen, J, Soto, J, Wride, N, et al. Central leptin signaling is required to normalize myocardial fatty acid oxidation rates in caloric-restricted Ob/Ob mice. Diabetes. (2011) 60:1424–34. doi: 10.2337/db10-1106
42. Palanivel, R, Eguchi, M, Shuralyova, I, Coe, I, and Sweeney, G. Distinct effects of short- and long-term leptin treatment on glucose and fatty acid uptake and metabolism in HL-1 cardiomyocytes. Metabolism. (2006) 55:1067–75. doi: 10.1016/j.metabol.2006.03.020
43. Unger, RH. Lipotoxic diseases. Annu Rev Med. (2002) 53:319–36. doi: 10.1146/annurev.med.53.082901.104057
44. Momken, I, Chabowski, A, Dirkx, E, Nabben, M, Jain, SS, McFarlan, JT, et al. A new leptin-mediated mechanism for stimulating fatty acid oxidation: a pivotal role for sarcolemmal FAT/CD36. Biochem J. (2017) 474:149–62. doi: 10.1042/BCJ20160804
45. Katsiki, N, Mikhailidis, DP, and Banach, M. Leptin, cardiovascular diseases and type 2 diabetes mellitus. Acta Pharmacol Sin. (2018) 39:1176–88. doi: 10.1038/aps.2018.40
46. Mallik, R, and Chowdhury, TA. Metformin in cancer. Diabetes Res Clin Pract. (2018) 143:409–19. doi: 10.1016/j.diabres.2018.05.023
47. Johnson, JA, West, J, Maynard, KB, and Hemnes, AR. ACE2 improves right ventricular function in a pressure overload model. PLoS One. (2011) 6:e20828. doi: 10.1371/journal.pone.0020828
48. Hemnes, AR, Fessel, JP, Chen, X, Zhu, S, Fortune, NL, Jetter, C, et al. BMPR2 dysfunction impairs insulin signaling and glucose homeostasis in cardiomyocytes. Am J Physiol Lung Cell Mol Physiol. (2020) 318:L429–41. doi: 10.1152/ajplung.00555.2018
49. Purdham, DM, Zou, MX, Rajapurohitam, V, and Karmazyn, M. Rat heart is a site of leptin production and action. Am J Physiol Heart Circ Physiol. (2004) 287:H2877–84. doi: 10.1152/ajpheart.00499.2004
50. Pham, DV, and Park, PH. Tumor metabolic reprogramming by adipokines as a critical driver of obesity-associated cancer progression. Int J Mol Sci. (2021) 22:1444. doi: 10.3390/ijms22031444
51. Blanquer-Rossello, MDM, Oliver, J, Sastre-Serra, J, Valle, A, and Roca, P. Leptin regulates energy metabolism in MCF-7 breast cancer cells. Int J Biochem Cell Biol. (2016) 72:18–26. doi: 10.1016/j.biocel.2016.01.002
52. Majka, S, Hagen, M, Blackwell, T, Harral, J, Johnson, JA, Gendron, R, et al. Physiologic and molecular consequences of endothelial BMPR2 mutation. Respir Res. (2011) 12:84. doi: 10.1186/1465-9921-12-84
53. Talati, M, West, J, Zaynagetdinov, R, Hong, CC, Han, W, Blackwell, T, et al. BMP pathway regulation of and by macrophages. PLoS One. (2014) 9:e94119. doi: 10.1371/journal.pone.0094119
54. West, J, Austin, E, Fessel, JP, Loyd, J, and Hamid, R. Rescuing the BMPR2 signaling axis in pulmonary arterial hypertension. Drug Discov Today. (2014) 19:1241–5. doi: 10.1016/j.drudis.2014.04.015
55. Morrison, AM, Huang, S, Annis, JS, Garry, JD, Hemnes, AR, Freiberg, MS, et al. Cardiometabolic risk factors associated with right ventricular function and compensation in patients referred for echocardiography. J Am Heart Assoc. (2023) 12:e028936. doi: 10.1161/JAHA.122.028936
56. Fruehwald-Schultes, B, Oltmanns, KM, Toschek, B, Sopke, S, Kern, W, Born, J, et al. Short-term treatment with metformin decreases serum leptin concentration without affecting body weight and body fat content in normal-weight healthy men. Metabolism. (2002) 51:531–6. doi: 10.1053/meta.2002.31332
57. Li, M, Fang, H, and Hu, J. Apelin-13 ameliorates metabolic and cardiovascular disorders in a rat model of type 2 diabetes with a high-fat diet. Mol Med Rep. (2018) 18:5784–90. doi: 10.3892/mmr.2018.9607
58. Al-Attas, OS, Al-Daghri, NM, Al-Rubeaan, K, da Silva, NF, Sabico, SL, Kumar, S, et al. Changes in endotoxin levels in T2DM subjects on anti-diabetic therapies. Cardiovasc Diabetol. (2009) 8:20. doi: 10.1186/1475-2840-8-20
59. An, D, Kewalramani, G, Chan, JK, Qi, D, Ghosh, S, Pulinilkunnil, T, et al. Metformin influences cardiomyocyte cell death by pathways that are dependent and independent of caspase-3. Diabetologia. (2006) 49:2174–84. doi: 10.1007/s00125-006-0338-9
60. Arinno, A, Maneechote, C, Khuanjing, T, Ongnok, B, Prathumsap, N, Chunchai, T, et al. Cardioprotective effects of melatonin and metformin against doxorubicin-induced cardiotoxicity in rats are through preserving mitochondrial function and dynamics. Biochem Pharmacol. (2021) 192:114743. doi: 10.1016/j.bcp.2021.114743
61. Driver, C, Bamitale, KDS, Kazi, A, Olla, M, Nyane, NA, and Owira, PMO. Cardioprotective effects of metformin. J Cardiovasc Pharmacol. (2018) 72:121–7. doi: 10.1097/FJC.0000000000000599
62. Bai, F, Liu, Y, Tu, T, Li, B, Xiao, Y, Ma, Y, et al. Metformin regulates lipid metabolism in a canine model of atrial fibrillation through AMPK/PPAR-alpha/VLCAD pathway. Lipids Health Dis. (2019) 18:109. doi: 10.1186/s12944-019-1059-7
63. Bhamra, GS, Hausenloy, DJ, Davidson, SM, Carr, RD, Paiva, M, Wynne, AM, et al. Metformin protects the ischemic heart by the Akt-mediated inhibition of mitochondrial permeability transition pore opening. Basic Res Cardiol. (2008) 103:274–84. doi: 10.1007/s00395-007-0691-y
64. Barreto-Torres, G, Parodi-Rullan, R, and Javadov, S. The role of PPARα in metformin-induced attenuation of mitochondrial dysfunction in acute cardiac ischemia/reperfusion in rats. Int J Mol Sci. (2012) 13:7694–709. doi: 10.3390/ijms13067694
Keywords: pulmonary arterial hypertension, BMPR2 mutation, right ventricular dysfunction, RV lipotoxicity, leptin and leptin receptors, H9c2 cultured cardiomyocytes, mitochondrial respiration
Citation: Talati M, Brittain E, Agrawal V, Fortune N, Simon K, Shay S, Zeng X, Freeman ML, West J and Hemnes A (2023) A potential adverse role for leptin and cardiac leptin receptor in the right ventricle in pulmonary arterial hypertension: effect of metformin is BMPR2 mutation-specific. Front. Med. 10:1276422. doi: 10.3389/fmed.2023.1276422
Edited by:
Vinicio De Jesus Perez, Stanford University, United StatesReviewed by:
Wen Tian, Stanford University, United StatesCopyright © 2023 Talati, Brittain, Agrawal, Fortune, Simon, Shay, Zeng, Freeman, West and Hemnes. This is an open-access article distributed under the terms of the Creative Commons Attribution License (CC BY). The use, distribution or reproduction in other forums is permitted, provided the original author(s) and the copyright owner(s) are credited and that the original publication in this journal is cited, in accordance with accepted academic practice. No use, distribution or reproduction is permitted which does not comply with these terms.
*Correspondence: Megha Talati, TWVnaGEuVGFsYXRpQHZ1bWMub3Jn
Disclaimer: All claims expressed in this article are solely those of the authors and do not necessarily represent those of their affiliated organizations, or those of the publisher, the editors and the reviewers. Any product that may be evaluated in this article or claim that may be made by its manufacturer is not guaranteed or endorsed by the publisher.
Research integrity at Frontiers
Learn more about the work of our research integrity team to safeguard the quality of each article we publish.