 Yang Ping
 Su Quanlin
 Hu Yue
 Zhang Jing*
94% of researchers rate our articles as excellent or good
Learn more about the work of our research integrity team to safeguard the quality of each article we publish.
Find out more
ORIGINAL RESEARCH article
Front. Med., 20 December 2023
Sec. Precision Medicine
Volume 10 - 2023 | https://doi.org/10.3389/fmed.2023.1269221
This article is part of the Research TopicMolecular Informatics in Precision MedicineView all 10 articles
Objective: Previous studies have proposed that genetic polymorphisms of CYP2D6*10, ADRB1, NPPA, CYP3A5*3, ACE, CYP2C9*3, and AGTR1 are involved in antihypertensive pharmacogenomics. The purpose of this study is to develop an amplification analysis using double allele-specific (AS) binding primers for accurate measurement of antihypertensive pharmacogenomics.
Methods: To establish a quadruplex quantitative PCR (qPCR) analysis for genotyping of CYP2D6*10, ADRB1 (1165 G>C), NPPA (2238 T>C) and CYP3A5*3, and a triplex qPCR analysis for genotyping of ACE (I/D), CYP2C9*3 and AGTR1 (1166 A>C), mismatch AS F-primers were screened by detection of plasmid/gDNA, and were validated by agreement analysis/reproducibility evaluation, in which the ΔCq (differences in threshold cycles between the wild-type F-primer-based amplification assay and the mutant-type F-primer-based amplification assay) was employed to determine genotypes.
Results: Seven pairs of primers were successfully selected through three rounds of F-primers screening. Except for ADRB1, the robustness assessment showed the amplification efficiency ranging from 0.9 to 1.1. In agreement analysis, two specimens in the training set (n = 203) were defined by the triplex analysis rather than NGS as heterozygotes for ACE, which was evidenced by gel electrophoresis. Reproducibility evaluation demonstrated that the coefficient of variation (CV) was <5%.
Conclusion: Multiplex amplification analysis using screened AS binding primers is a simple, reliable, and accurate tool to guide drug delivery in antihypertensive personalized treatment.
Hypertension is becoming the main cause of cardiovascular disease (1–4). Patients with hypertension reached 1.278 billion worldwide in 2019 (5). A previous study reported that intensive hypertension control could avoid 2.209 million coronary heart disease (CHD) events, 4.409 million stroke events, and 75,100 cardiovascular deaths in 10 years (6). However, hypertension control is still poor because of insufficient clinical experience and apparent drug resistance (2).
Clinical practices have displayed the heterogeneity of patients' responses to antihypertensive drugs (7, 8). Associated with the efficacy of antihypertensive drugs covering beta-blockers, diuretics, calcium channel blockers (CCBs), angiotensin-converting enzyme (ACE) inhibitors, and angiotensin receptor antagonists (ARBs), the hypertensive pharmacogenomics of CYP2D6*10, adrenergic receptor beta 1 (ADRB1, 1165 G>C), natriuretic peptide type A (NPPA, 2238 T>C), CYP3A5*3, ACE (I/D), CYP2C9*3, and angiotensin II receptor 1 (AGTR1, 1166 A>C) have been documented. For example, genetic polymorphisms of AGTR1 and cytochrome P450 oxidase (CYP2C9) impact ARB drug-target affinity and drug metabolism, respectively. ARBs exert their anti-hypertensive effect by blocking the binding of the AGTR1 receptor with angiotensin II ligands. A carrier with a C-type allele for AGTR1 appears more sensitive to ARBs (9–11). Metabolizing most ARBs, CYP2C9 is a member of the cytochrome P450 oxidase superfamily (12). Patients with the CYP2C9*3 (*1/*1) allele extend their fast metabolic response to ARBs (13, 14).
Discrimination of single nucleotide polymorphisms (SNPs) has become a field of intense investigation, and various technologies have been suggested (15). It is not suitable for next-generation sequencing (NGS) technology to measure SNPs due to expensive equipment and time consumption (16). Presenting high sensitivity, high throughput, and high reliability, quantitative PCR (qPCR) analysis has become a mainstream technique for SNP measurement (17–19). Uniplex amplification analysis for CYP2D6*10, ADRB1 (1165 G>C), NPPA (2238 T>C), CYP3A5*3, ACE, CYP2C9*3, and AGTR1 (1166A>C) has been reported (7, 20–23). In this study, we described a multiplex qPCR analysis using double allele-specific (AS) binding F-primers that included wild-type and mutated-type F-primers to discriminate above genetic polymorphisms.
To detect the genotypes of CYP2D6*10, ADRB1 (1165 G>C), NPPA (2238 T>C), CYP3A5*3, ACE (I/D), CYP2C9*3, and AGTR1 (1166 A>C), AS F-primers with the second, third, or fifth mismatched base at the 3′-terminal, co-hydrolysis probe, and reverse primers were designed.
First, F-primers were screened by plasmid determination using uniplex qPCR. Second, selected F-primers were screened by detecting genomic DNA using multiplex qPCR, including a quadruplex analysis for CYP2D6*10, ADRB1, NPPA, and CYP3A5*3 and a triplex analysis for ACE (I/D), CYP2C9*3, and AGTR1. Each of the multiplex analyses contained two reactions: the wild-type F-primer-based amplification assay and the mutant-type F-primer-based amplification assay, in which ΔCq (differences in threshold cycles between the wild-type F-primer-based assay and the mutant-type F-primer-based assay) was employed to determine genotypes. Third, the F-primers were screened by robustness assessment. Finally, the screened F-primer-based assay was validated by concordance analysis, using NGS as the reference method. The sterilized distilled water instead of DNA was used as the negative control during the whole experiment process. The design strategy of this study is shown in Figure 1.
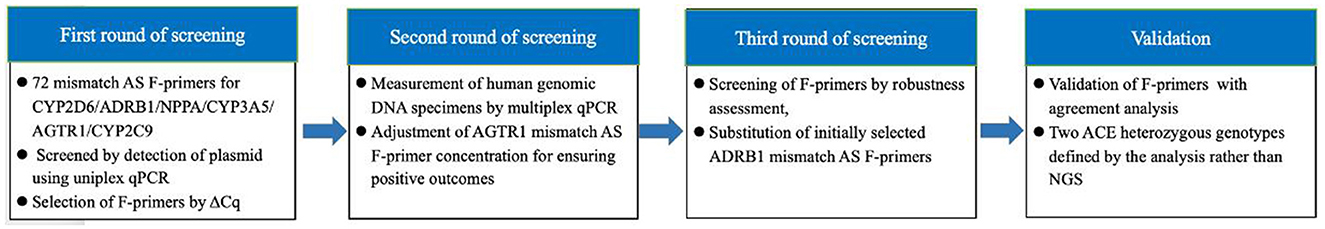
Figure 1. Design strategy of this study. F-primers as polymorphism-binding oligonucleotides were optimized through three rounds of screening and validated with agreement analysis considering next-generation sequencing as a reference method.
A total of 203 oral swab samples were collected from Chinese volunteers. Genomic DNA was isolated using the QIAamp DNA Mini kit (Cat No.51304, QIAGEN, Dusseldorf, Germany), according to the manufacturer's instructions. The quality and quantity of DNA were determined by the NanoPhotometer P360 (Implen GmbH, Munich, Germany). Sanger sequencing was conducted by Personal company (Qingdao Personal Biotechnology Co., Ltd., China). NGS sequencing was conducted by the Center for Molecular Diagnosis at Shandong Provincial Hospital, affiliated with Shandong First Medical University (Jinan, China).
Based on the nucleotide sequences of these seven genes, AS F-primers, co-reverse primers, and hydrolysis probes were designed using Primer Express 3.0. The probes for CYP2D6*10, ADRB1 (1165 G>C), NPPA (2238 T>C), and CYP3A5*3 in the quadruplex analysis were labeled with the fluorescent dyes FAM, VIC, NED, and CY5 at their 5′ ends and the quencher BHQ1, BHQ1, BHQ2, and BHQ3 at their 3′ ends, respectively. The probes for ACE (I/D), CYP2C9*3, and AGTR1 (1166 A>C) in the triplex analysis were labeled with the fluorescent dyes FAM, NED, and CY5 at their 5′ ends, and the quencher BHQ1, BHQ2, and BHQ3 at their 3′ ends, respectively. Primers were synthesized by Sangon Biotech (Shanghai) Co. Ltd. (Shanghai, China), and TaqMan probes were synthesized by Invitrogen Corporation (Shanghai, China). According to NCBI, each approximately 400-bp fragment of CYP2D6*10 (rs1065852), ADRB1 (rs1801253), NPPA (rs5065), CYP3A5*3 (rs776746), ACE (rs4646994), CYP2C9*3 (rs1057910), and AGTR1 (rs5186) was chemically synthesized and cloned into pUC57 plasmid vectors by Sangon Biotech Co., Ltd. (Shanghai, China).
Optimized multiplex AS qPCR was executed in a total of 20 μL reaction mixture containing 10 μL AceQ® Universal U+ Probe Master Mix V2 (Vazyme, Nanjing, China), 0.2 μM of each wild/mutated-type F-primer (0.4 μM for AGTR1), 0.2 μM of each reverse primer, 0.1 μM of each hydrolysis probe, and 10 ng gDNA. The uniplex amplification analysis was conducted according to the same protocol. The qPCR protocols started with a contamination digestion step for 2 min at 37°C, and a pre-denaturation step for 5 min at 95°C, followed by 45 cycles of 95°C for 10 s and 60°C for 35 s. The fluorescence signal was collected at 60°C. These amplifications were performed on the ABI7500 Real-Time PCR Instrument (Thermo Fisher Scientific Inc., MA, USA).
Data analysis and graphing were carried out using GraphPad Prism software version 9 (GraphPad Software, Inc., San Diego, CA).
AS F-primers with the second, third, or fifth 3′-terminal mismatched base, co-hydrolysis probes, and reverse primers were designed for each SNP. Uniplex qPCR analysis and plasmid models covering homozygotes and heterozygotes were employed to screen mismatch AS forward primers (n = 72) to roughly enable maximization of ΔCq (differences in threshold cycles between the wild-type F-primer-based assay and the mutated-type F-primer-based assay) (Supplementary material S1). The originally selected F-primers are shown in Table 1.
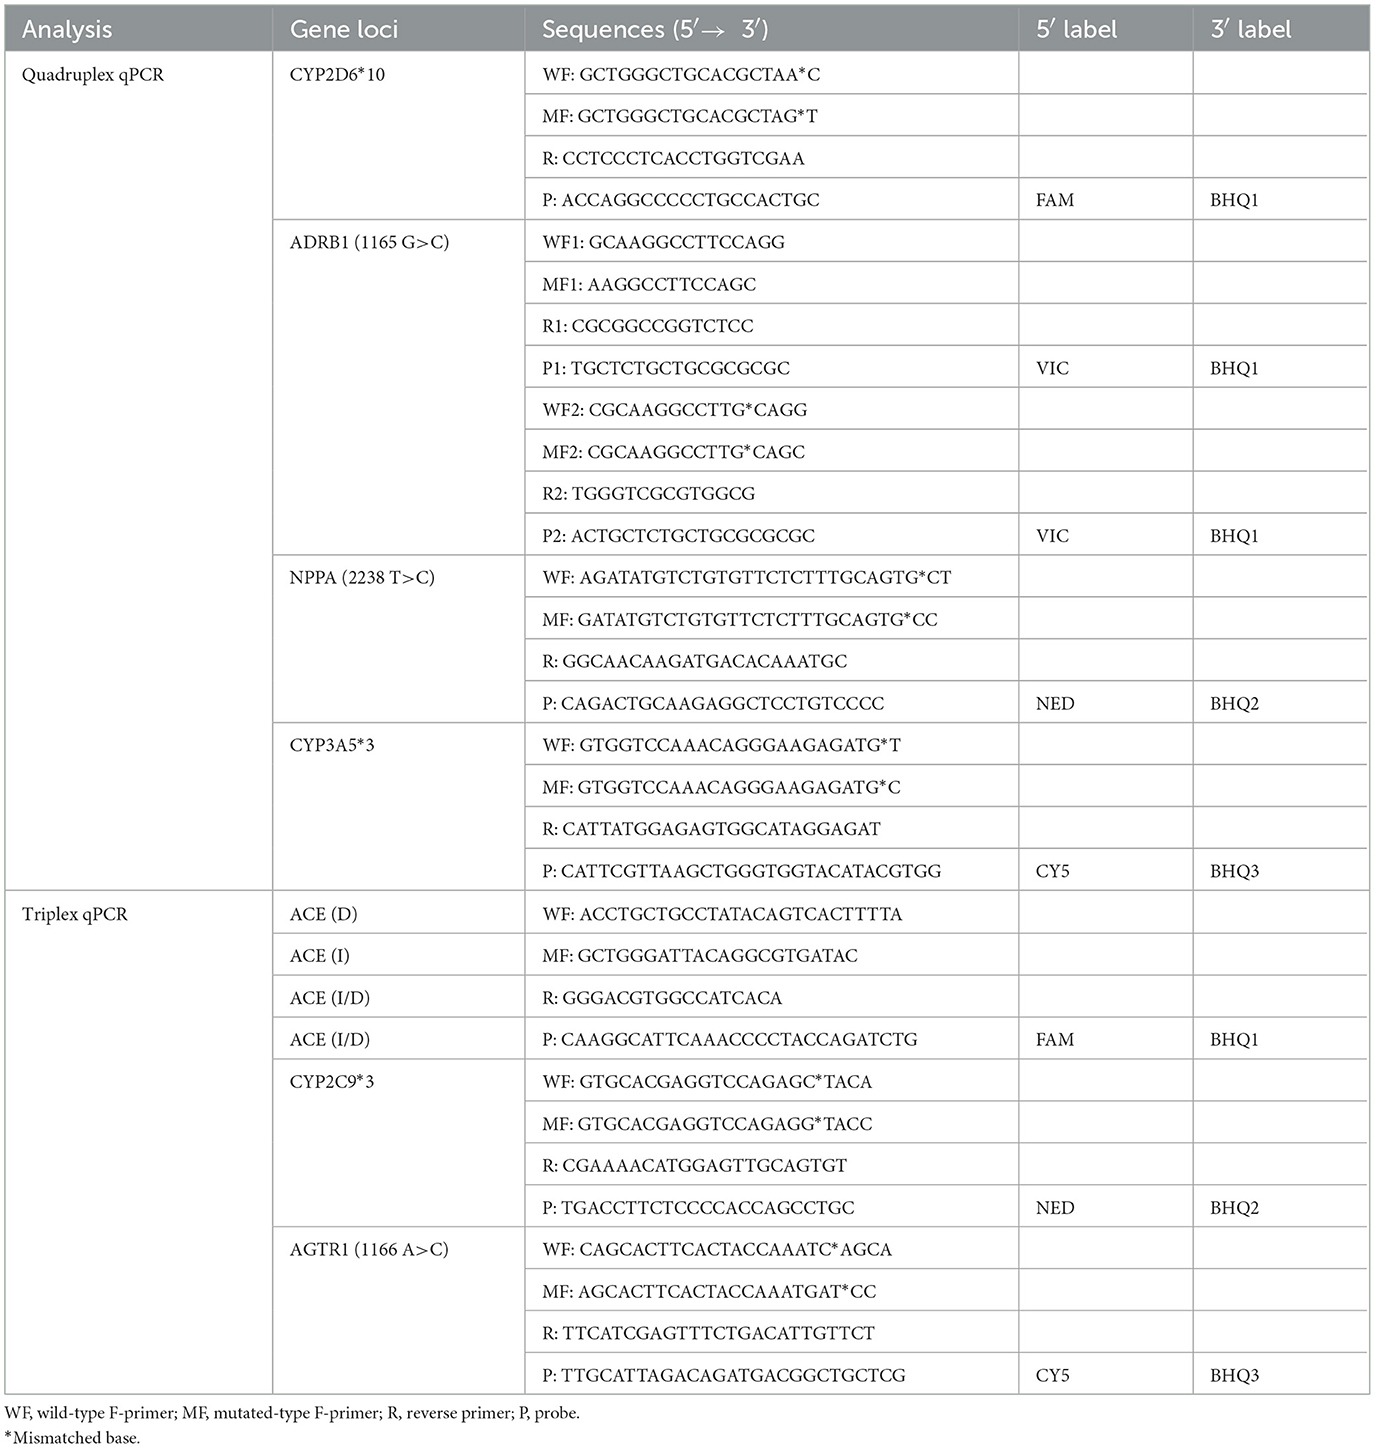
Table 1. Primer and probe sequences.
Selected F-primers were in succession screened by examination of human gDNA, comprising homozygotes and heterozygotes. To omit the positive control set in antihypertensive pharmacogenomic measurement, positive outcomes obtained from the wild- or mutated-type F-primer-based assay were required. Because undetermined results were observed in gDNA scans, the concentration of mutated-type F-primer for AGTR1 was adjusted from 0.2 to 0.4 μM to ensure positive outcomes (Figure 2).
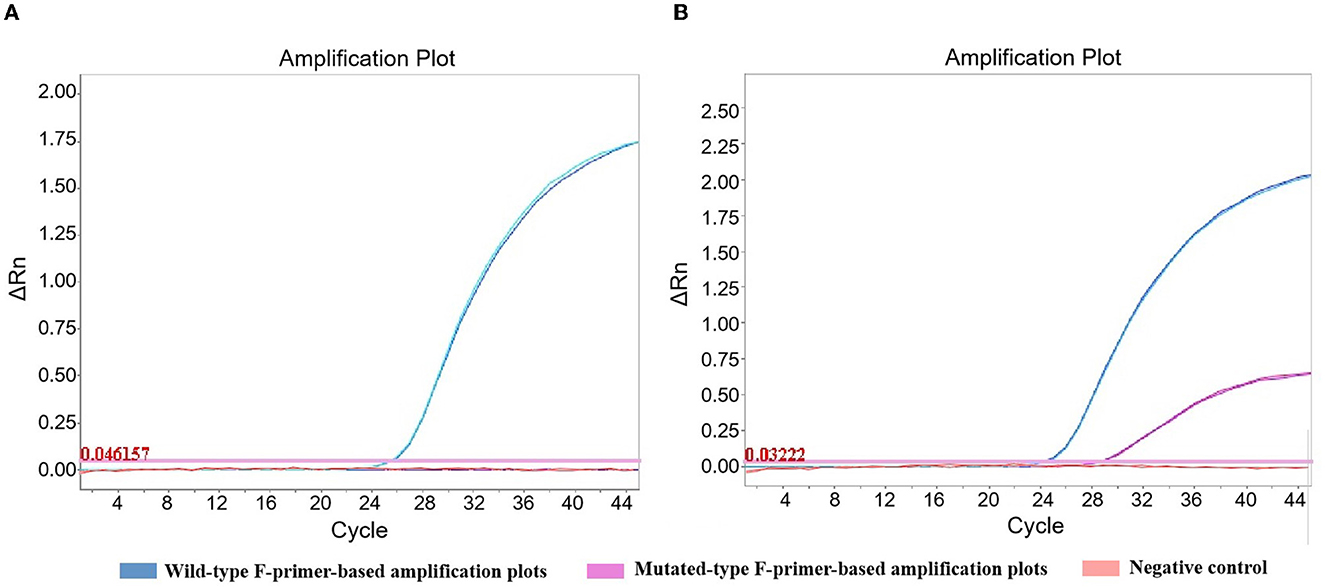
Figure 2. Amplification plots of AGTR1 in the triplex amplification analysis. The concentration of mutated-type F-primer for AGTR1 was adjusted from 0.2 (A) to 0.4 μM (B) to ensure positive outcomes. Wild-type homozygote was detected in duplicate by the triplex amplification analysis.
Six concentrations (40 ng, 20 ng, 10 ng, 5 ng, 2.5 ng, and 1.25 ng) of heterozygotes from oral swabs were prepared. Amplification efficiency was calculated using the generated calibrator curve: 10−1/slope−1, with the logarithm of the template copies plotted on the X-axis and Cq plotted on the Y-axis (24). The reactions were conducted in duplicate with three dependent experiments. As the calibrator curve did not appear in a dose-dependent manner, F-primer WF2/MF2, probe P2, and reverse primer R2 for ADRB1 were substituted for F-primer WF1/MF1, probe P1, and reverse primer R1, respectively, in the quadruplex amplification analysis (Table 1 and Figure 3). Except for ADRB1, optimized calibrator curves demonstrated amplification efficiencies ranging from 0.9 to 1.1 and analytical sensitivities of at least 1.25 ng (Figure 4).
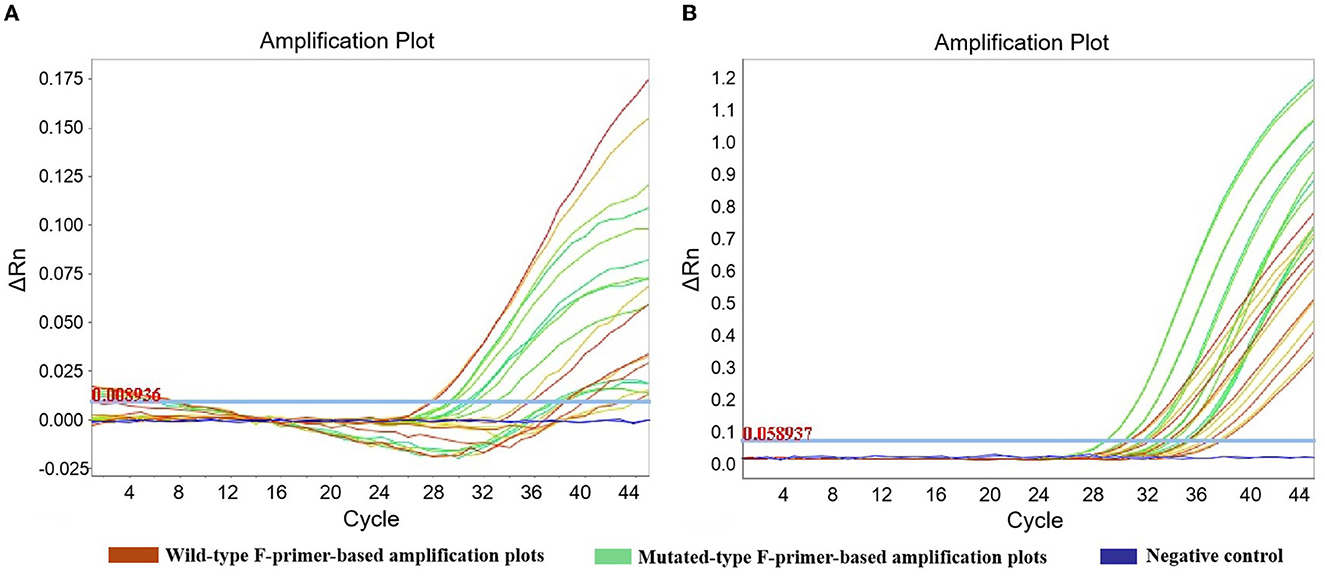
Figure 3. Amplification plots of ADRB1 in robustness assessment. To improve the robustness of ADRB1 measurement, F-primer WF2/MF2, probe P2, and reverse primer R2 were substituted for F-primer WF1/MF1, probe P1, and reverse primer R1, respectively, in the quadruplex amplification analysis. (A) Unoptimized amplification plots. (B) Optimized amplification plots. To assess robustness, serial dilutions of heterozygote (1.25–40 ng) were measured by the quadruplex amplification analysis, including the wild-type F-primer-based amplification assay and the mutated-type F-primer-based amplification assay. Reactions were run in duplicate.
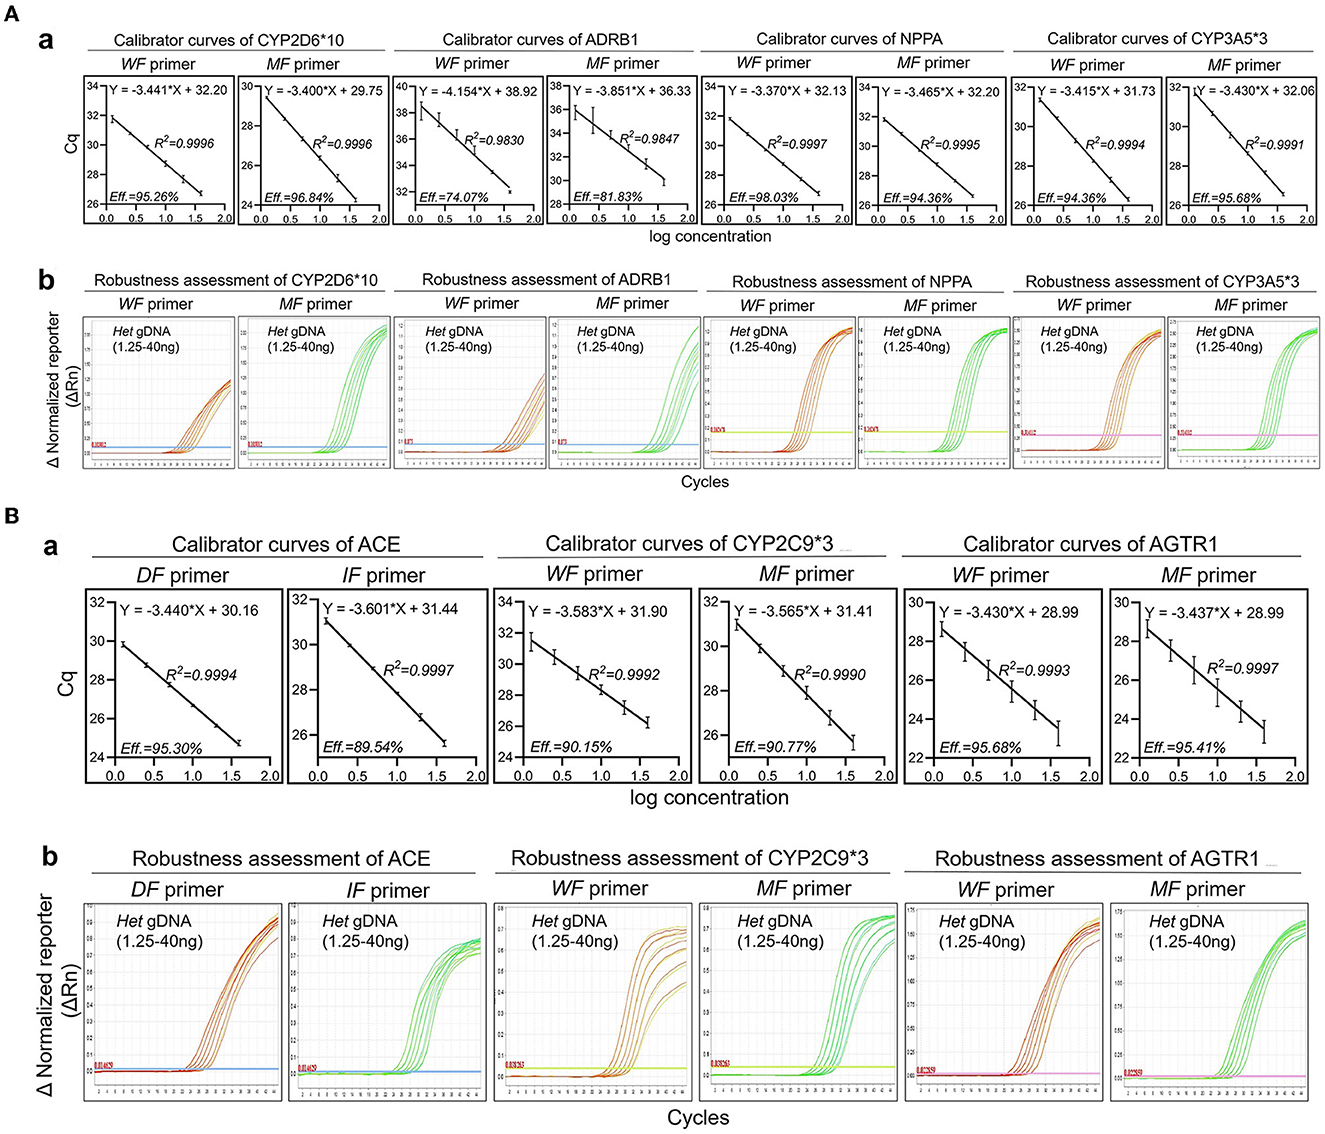
Figure 4. Robustness of optimized amplification analysis. The robustness assessment was executed by employing mismatch allele-specific F-primers targeting single nucleotide polymorphisms to simultaneously detect heterozygotes. Serial dilutions of heterozygotes (1.25–40 ng) were measured by multiplex amplification analysis containing a wild-type F-primer-based amplification assay and a mutated-type F-primer-based amplification assay. (A) (a) Calibrator curves of quadruplex amplification analysis. Amplification efficiency (Eff) % and R2 are shown; (b) Amplification plots of the robustness assessment in quadruplex amplification analysis. Representative amplification plots are shown. (B) (a) Calibrator curves of triplex amplification analysis. Amplification efficiency (Eff) % and R2 are shown; (b) Amplification plots of the robustness assessment in triplex amplification analysis. Representative amplification plots are shown. Reactions were run in duplicate with three independent experiments. Data are expressed as mean ± SE. DF, deletion-type F-primer; IF, insertion-type F-primer; WF primer, wild-type F-primer; MF primer, mutated-type F-primer; Het, heterozygote.
Considering NGS as a reference method, we examined 203 gDNA samples extracted from oral swabs to evaluate the accuracy of the multiplex analyses using double allele-specific binding F-primers. The results showed that, besides ACE, the coincidence rate was 100%. Two specimens (No.001 and No.056) in the training set (n = 203) were defined by the analysis rather than NGS as heterozygotes for ACE, which was evidenced by gel electrophoresis (Figure 5). The cutoff values for genotyping are shown in Table 2.
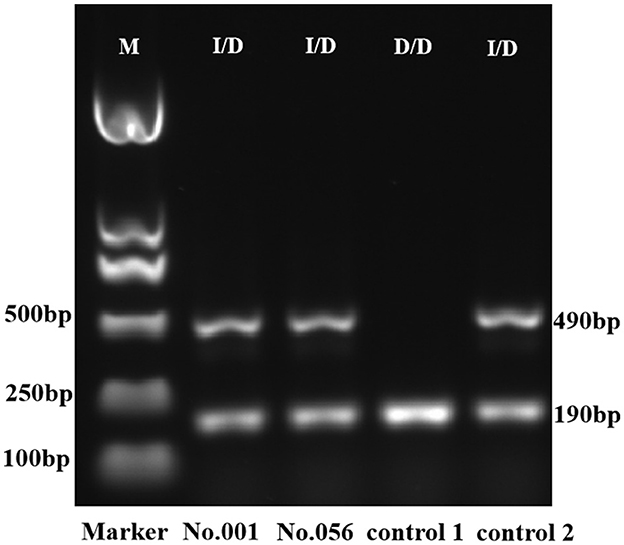
Figure 5. Gel electrophoresis of PCR amplicon for ACE. The D/D genotype was identified by the presence of a single 190-bp amplicon, and the I/D genotype extended both 490-bp and 190-bp amplicons. The ACE genotypes of controls 1 and 2 were D/D and I/D, respectively, defined by Sanger sequencing. M, DNA marker; I/D, heterozygote; D/D, deletion homozygote.

Table 2. Genotyping cutoff values.
To evaluate the producibility of the analysis, each heterozygote was tested in eight-plicates by two operators, using two different reagent lots every 5 days (n = 80/specimen) at one site. A total of 80 Cq values were collected to calculate the coefficient of variation (CV). The results showed that the CV values for reproducibility were within 4.00% for all days, specimens, replicates, operators, and reagent lots combined (Figure 6).
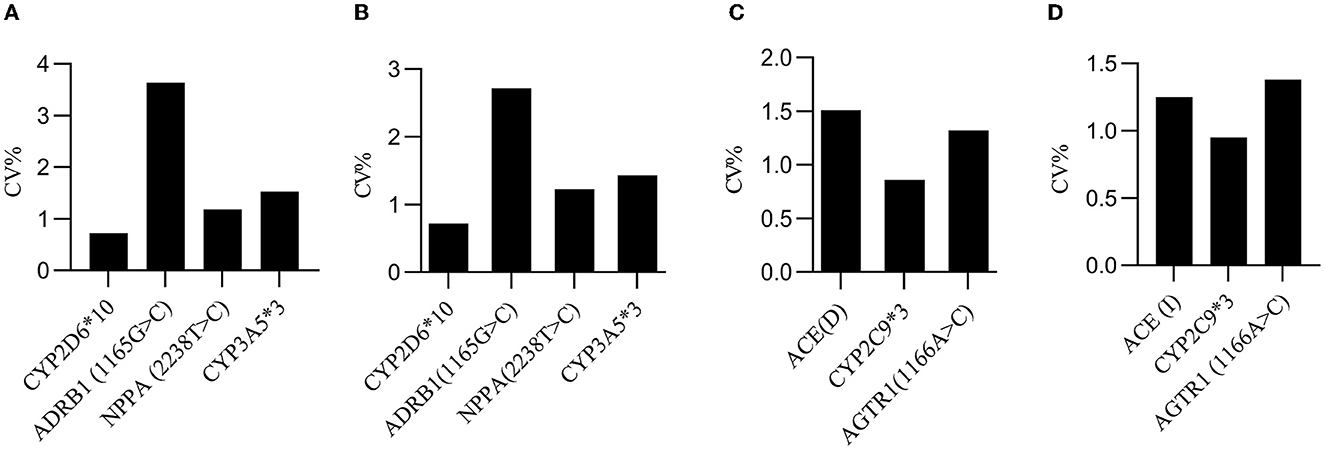
Figure 6. Producibility evaluation. (A) The inter-day CV values for the wild-type F-primers-based amplification assay in quadruplex analysis. (B) The inter-day CV values for the mutated-type F-primers-based amplification assay in quadruplex analysis. (C) The inter-day CV values for the wild-type F-primers-based amplification assay in triplex analysis. (D) The inter-day CV values for the mutated-type F-primers-based amplification assay in triplex analysis. The inter-day CV value was <4% for all days, specimens, replicates, operators, and reagent lots combined.
In this study, multiplex amplification analysis was established for the measurement of hypertensive pharmacogenomics. Due to genetic polymorphism, only about one-third of patients with hypertension accept effective treatment (25–30). Therefore, this study is helpful for hypertension patients to take more effective and well-tolerated medication.
Compared to other methods (31), multiplex qPCR behaves as a simple and effective approach to the detection of pharmacogenomic SNPs (32). Polymorphism-specific binding molecules in PCR-based analysis comprise dsDNA-binding dye, AS probe, and primer (33, 34). The dsDNA-binding dye-based high-resolution dissolution curve (HRM) assay needs a specific equipment module. In addition to the diseconomy, it is time-consuming and laborious to discover an appropriate minor groove binder (MGB) probe (35). The wild-type allele reaction probably outcompetes the mutated-type allele reaction when two AS probes barcoded with different fluorophores are utilized to identify genetic polymorphism (36). Sometimes, it is difficult to accurately discriminate SNPs using single-color melting curve analysis. For enhancement of AS primer specificity, base mismatch is more economical than locked nucleic acid (LNA) decoration (37). In this study, mismatch AS primers were screened and validated. The combination of a wild-type AS F-primer-based amplification assay with a mutated-type AS F-primer-based amplification assay was utilized to obtain ΔCq to define the genotype. The results evidenced that screened F-primer-based amplification analysis is a simple, accurate, and reliable approach to measure antihypertensive pharmacogenomics.
As the definition of ACE (I/D) genotype for two specimens differed between triplex analysis and NGS, we utilized PCR-gel electrophoresis to substantiate the outcomes. Located on chromosome 17, the ACE gene consists of 26 exons and appears as a polymorphism in the form of either insertion (I) or deletion (D) of a 287-bp Alu repeat sequence in intron 16. The ACE (I/D) allele can be detected by PCR using the primers flanking the 287 bp insertion sequence (38). In gel electrophoresis, the I/I genotype can be identified by the presence of a single 490 bp amplicon, the D/D genotype can be recognized by the presence of a single 190 bp product, and the I/D genotype extends both 490 and 190 bp amplicons (39). The results of gel electrophoresis validated the accuracy of the triplex analysis for ACE (I/D) measurement (Figure 5).
Based on hypertensive pharmacogenomics of CYP2C9*3, ADRB1(1165 G>C), AGTR1 (1166 A>C), CYP2D6*10, ACE (I/D), CYP3A5*3, and NPPA (2238 T>C), the principle of personalized drug delivery was proposed as follows: (a) doubling the standard dose is suggested when the hypertension is moderately sensitive to certain anti-hypertensive drugs; and (b) the minimum dose is recommended to initiate treatment when the hypertension is highly sensitive to certain anti-hypertensive drugs (7). Following the above principle, clinical studies evidenced that, compared to clinic experience-guided anti-hypertensive therapy, genotype-guided treatment appeared more effective and had fewer side effects. Herein, we established a simple, efficient, and accurate method for simultaneously detecting the genotypes of CYP2D6*10, ADRB1 (1165 G>C), NPPA (2238 T>C), CYP3A5*3, ACE, CYP2C9*3, and AGTR1 (1166 A>C) by screening and verification of mismatched AS F-primers.
As an accurate and reliable approach, the analysis described in this study is a valuable tool to determine the genotypes for CYP2D6*10, ADRB1, NPPA, CYP3A5*3, ACE, CYP2C9*3, and AGTR1, which can guide drug delivery in antihypertensive treatment to ensure curative effect. Employing the similar technique verified in this study, our laboratory will design and develop a multiplex amplification analysis for guiding aspirin delivery in the future.
The original contributions presented in the study are included in the article/Supplementary material, further inquiries can be directed to the corresponding authors.
This study was performed in accordance with the ethical standards as laid down in the 1964 Declaration of Helsinki and were approved by the Biomedical Research Ethic Committee of Shandong Provincial Hospital.
YP: Data curation, Validation, Writing—original draft, Formal analysis. SQ: Writing—original draft, Data curation. HY: Software, Writing—original draft, Methodology. ZJ: Supervision, Writing—review & editing, Project administration, Methodology. LW: Funding acquisition, Project administration, Supervision, Writing—review & editing, Methodology.
The author(s) declare financial support was received for the research, authorship, and/or publication of this article. This work was supported by grants from the technological development of Yinfeng Biological Engineering Group (YFSW01-2021-B07-235) and the Key Project of International Cooperation of Qilu University of Technology (No. QLUTGJHZ2018008).
The authors wish to acknowledge Dr. Liu Yiqing, Department of Clinical Laboratory, Shandong Provincial Hospital Affiliated to Shandong First Medical University, for his help in NGS sequencing.
LW, ZJ, and HY are inventors of the detection kit for antihypertensive- associated genotyping (China Patent Application Number: 202210835232.3).
The remaining authors declare that the research was conducted in the absence of any commercial or financial relationships that could be construed as a potential conflict of interest.
All claims expressed in this article are solely those of the authors and do not necessarily represent those of their affiliated organizations, or those of the publisher, the editors and the reviewers. Any product that may be evaluated in this article, or claim that may be made by its manufacturer, is not guaranteed or endorsed by the publisher.
The Supplementary Material for this article can be found online at: https://www.frontiersin.org/articles/10.3389/fmed.2023.1269221/full#supplementary-material
1. Roth GA, Johnson C, Abajobir A, Abd-Allah F, Abera SF, Abyu G, et al. Global, regional, and national burden of cardiovascular diseases for 10 causes, 1990 to 2015. J Am Coll Cardiol. (2017) 70:1–25. doi: 10.1016/j.jacc.2017.04.052
2. DiPette DJ, Skeete J, Ridley E, Campbell NRC, Lopez-Jaramillo P, Kishore SP, et al. Fixed-dose combination pharmacologic therapy to improve hypertension control worldwide: Clinical perspective and policy implications. J Clin Hypertens. (2019) 21:4–15. doi: 10.1111/jch.13426
3. Comeau KD, Shokoples BG, Schiffrin EL. Sex differences in the immune system in relation to hypertension and vascular disease. Can J Cardiol. (2022) 38:1828–43. doi: 10.1016/j.cjca.2022.05.010
4. Mills KT, Bundy JD, Kelly TN, Reed JE, Kearney PM, Reynolds K, et al. Global disparities of hypertension prevalence and control: a systematic analysis of population-based studies from 90 countries. Circulation. (2016) 134:441–50. doi: 10.1161/CIRCULATIONAHA.115.018912
5. NCD Risk Factor Collaboration. Worldwide trends in hypertension prevalence and progress in treatment and control from 1990 to 2019: a pooled analysis of 1201 population-representative studies with 104 million participants. Lancet. (2021) 398:957–80. doi: 10.1016/S0140-6736(21)01330-1
6. The writing committee of the report on cardiovascular health and diseases in china. Report on cardiovascular health and diseases in China 2021: an updated summary. Biomed Environ Sci. (2022) 35:573–603. doi: 10.3967/bes2022.079
7. Xiao Z-L, Yang M, Chen X-B, Xie X-M, Chen M-F. Personalized antihypertensive treatment guided by pharmacogenomics in China. Cardiovasc Diagn Ther. (2022) 12:635–45. doi: 10.21037/cdt-22-154
8. Bosch TM. Pharmacogenomics of drug-metabolizing enzymes and drug transporters in chemotherapy. Methods Mol Biol. (2008) 448:63–76. doi: 10.1007/978-1-59745-205-2_5
9. Brown MJ. Heterogeneity of blood pressure response to therapy. Am J Hyperten. (2010) 23:926–8. doi: 10.1038/ajh.2010.139
10. Liu Y, Kong X, Jiang Y, Zhao M, Gao P, Cong X, et al. Association of AGTR1 A1166C and CYP2C9*3 gene polymorphisms with the antihypertensive effect of valsartan. Int J Hypertens. (2022) 2022:7677252. doi: 10.1155/2022/7677252
11. Zotova TY, Kubanova AP, Azova MM, Aissa AA, Gigani OO, Frolov VA. Analysis of polymorphism of angiotensin system genes (ACE, AGTR1, and AGT) and gene ITGB3 in patients with arterial hypertension in combination with metabolic syndrome. Bull Exp Biol Med. (2016) 161:334–8. doi: 10.1007/s10517-016-3408-0
12. Fekete F, Mangó K, Déri M, Incze E, Minus A, Monostory K. Impact of genetic and non-genetic factors on hepatic CYP2C9 expression and activity in Hungarian subjects. Sci Rep. (2021) 11:17081. doi: 10.1038/s41598-021-96590-3
13. Kamide K, Kawano Y, Rakugi H. Pharmacogenomic approaches to study the effects of antihypertensive drugs. Hypertens Res. (2012) 35:796–9. doi: 10.1038/hr.2012.82
14. Kirchheiner J, Seeringer A. Clinical implications of pharmacogenetics of cytochrome P450 drug metabolizing enzymes. Biochim Biophys Acta. (2007) 1770:489–94. doi: 10.1016/j.bbagen.2006.09.019
15. Diakosavvas M, Fasoulakis ZN, Kouroupi M, Theodora M, Inagamova L, Tsatsaris G, et al. Primary malignant melanoma of the cervix: a case report and a review of the literature. Case Rep Oncol Med. (2020) 2020:7206786. doi: 10.1155/2020/7206786
16. De Cario R, Kura A, Suraci S, Magi A, Volta A, Marcucci R, et al. Sanger validation of high-throughput sequencing in genetic diagnosis: still the best practice? Front Genet. (2020) 11:592588. doi: 10.3389/fgene.2020.592588
17. Saijo M, Morikawa S, Kurane I. Real-time quantitative polymerase chain reaction for virus infection diagnostics. Expert Opin Med Diagn. (2008) 2:1155–71. doi: 10.1517/17530059.2.10.1155
18. Zhao K, Shi K, Zhou Q, Xiong C, Mo S, Zhou H, et al. The development of a multiplex real-time quantitative PCR assay for the differential detection of the wild-type strain and the MGF505-2R, EP402R and I177L gene-deleted strain of the african swine fever virus. Animals. (2022) 12:1754. doi: 10.3390/ani12141754
19. Baris I, Etlik O, Koksal V, Ocak Z, Baris ST. SYBR green dye-based probe-free SNP genotyping: introduction of T-Plex real-time PCR assay. Anal Biochem. (2013) 441:225–31. doi: 10.1016/j.ab.2013.07.007
20. Candong W, Yuxiong K, Jianzhong J, Li J. Genotyping of essential hypertension candidate gene-ACE by TaqMan. J Fudan Univ Nat Sci. (2002) 6:614–7. doi: 10.15943/j.cnki.fdxb-jns.2002.06.004
21. Xiuqing L, Yanwu L, Lei H. Establishment of real - time PCR assay for detection of hypertension drug - related gene polymorphism. J Mol Diagnost Therapy. (2021) 13:707–11. (In Chinese). doi: 10.19930/j.cnki.jmdt.2021.05.008
22. Henderson SO, Haiman CA, Mack W. Multiple Polymorphisms in the renin- angiotensin-aldosterone system (ACE, CYP11B2, AGTR1) and their contribution to hypertension in African Americans and Latinos in the multiethnic cohort. Am J Med Sci. (2004) 328:266–73. doi: 10.1097/00000441-200411000-00006
23. Galaviz-Hernández C, Lazalde-Ramos BP, Lares-Assef I, Macías-Salas A, Ortega-Chavez MA, Rangel-Villalobos H, et al. Influence of genetic admixture components on CYP3A5*3 allele-associated hypertension in amerindian populations from Northwest Mexico. Front Pharmacol. (2020) 11:638. doi: 10.3389/fphar.2020.00638
24. Bustin SA, Benes V, Garson JA, Hellemans J, Huggett J, Kubista M, et al. The MIQE guidelines: minimum information for publication of quantitative real-time PCR experiments. Clin Chem. (2009) 55:611–22. doi: 10.1373/clinchem.2008.112797
25. Oliveira-Paula GH, Pereira SC, Tanus-Santos JE, Lacchini R. Pharmacogenomics and hypertension: current insights. Pharmgenomics Pers Med. (2019) 12:341–59. doi: 10.2147/PGPM.S230201
26. Shin J, Johnson JA. Pharmacogenetics of beta-blockers. Pharmacotherapy. (2007) 27:874–87. doi: 10.1592/phco.27.6.874
27. Johnson JA. Advancing management of hypertension through pharmacogenomics. Ann Med. (2012) 44 Suppl 1:S17–22. doi: 10.3109/07853890.2011.653399
28. Arwood MJ, Cavallari LH, Duarte JD. Pharmacogenomics of hypertension and heart disease. Curr Hypertens Rep. (2015) 17:586. doi: 10.1007/s11906-015-0586-5
29. Rysz J, Franczyk B, Rysz-Górzyńska M, Gluba-Brzózka A. Pharmacogenomics of hypertension treatment. Int J Mol Sci. (2020) 21:4709. doi: 10.3390/ijms21134709
30. Cooper-DeHoff RM, Johnson JA. Hypertension pharmacogenomics: in search of personalized treatment approaches. Nat Rev Nephrol. (2016) 12:110–22. doi: 10.1038/nrneph.2015.176
31. Nak-On S, Tejangkura T, Chontananarth T. Multi-detection for paramphistomes using novel manually designed PAR-LAMP primers and its application in a lateral flow dipstick (LAMP-LFD) system. Vet Parasitol. (2023) 317:109905. doi: 10.1016/j.vetpar.2023.109905
32. Lee J, Kim S, Park J, Kang D-H. Detection of Salmonella enterica serovar Montevideo in food products using specific PCR primers developed by comparative genomics. LWT. (2022) 165:113677. doi: 10.1016/j.lwt.2022.113677
33. Nikodem D, Cłapa T, Narozna D. [HRM-PCR in medical diagnostic]. Postepy Biochem. (2021) 67:59–63. doi: 10.18388/pb.2021_373
34. Matsuda K. PCR-based detection methods for single-nucleotide polymorphism or mutation: real-time PCR and its substantial contribution toward technological refinement. Adv Clin Chem. (2017) 80:45–72. doi: 10.1016/bs.acc.2016.11.002
35. Cheng H, Liu Y, Fu M, Liu J, Chen G. Taqman-MGB FQ-PCR for Human GPIIIa, GP1BA and PEAR1 SNPs. Clin Lab. (2022) 68. doi: 10.7754/Clin.Lab.2022.220132
36. Lang AH, Drexel H, Geller-Rhomberg S, Stark N, Winder T, Geiger K, et al. Optimized allele-specific real-time PCR assays for the detection of common mutations in KRAS and BRAF. J Mol Diagn. (2011) 13:23–8. doi: 10.1016/j.jmoldx.2010.11.007
37. Navarro E, Serrano-Heras, G, Castaño MJ, Solera J. Real-time PCR detection chemistry. Clin Chim Acta. (2015) 439:231–50. doi: 10.1016/j.cca.2014.10.017
38. Gupta S, Agrawal BK, Goel RK, Sehajpal PK. Angiotensin-converting enzyme gene polymorphism in hypertensive rural population of Haryana, India. Emerg Trauma Shock. (2009) 2:150–4. doi: 10.4103/0974-2700.55323
Keywords: allele-specific (AS), F-primers, polymorphism, antihypertensive, genotyping
Citation: Ping Y, Quanlin S, Yue H, Jing Z and Wenjun L (2023) Screening and validation of double allele-specific binding F-primers for the measurement of antihypertensive pharmacogenomics. Front. Med. 10:1269221. doi: 10.3389/fmed.2023.1269221
Received: 29 July 2023; Accepted: 28 November 2023;
Published: 20 December 2023.
Edited by:
Abdul Azeez Sayed, Imam Abdulrahman Bin Faisal University, Saudi ArabiaReviewed by:
Fernando Marqués-García, Hospital Germans Trias i Pujol, SpainCopyright © 2023 Ping, Quanlin, Yue, Jing and Wenjun. This is an open-access article distributed under the terms of the Creative Commons Attribution License (CC BY). The use, distribution or reproduction in other forums is permitted, provided the original author(s) and the copyright owner(s) are credited and that the original publication in this journal is cited, in accordance with accepted academic practice. No use, distribution or reproduction is permitted which does not comply with these terms.
*Correspondence: Zhang Jing, emhhbmdqaW5nQHFsdS5lZHUuY24=; Lan Wenjun, bGFud2VuanVuMDUyMkBxbHUuZWR1LmNu
†These authors share first authorship
Disclaimer: All claims expressed in this article are solely those of the authors and do not necessarily represent those of their affiliated organizations, or those of the publisher, the editors and the reviewers. Any product that may be evaluated in this article or claim that may be made by its manufacturer is not guaranteed or endorsed by the publisher.
Research integrity at Frontiers
Learn more about the work of our research integrity team to safeguard the quality of each article we publish.