 Kangrim Cho
 Junggu Choi
 Sanghoon Han
95% of researchers rate our articles as excellent or good
Learn more about the work of our research integrity team to safeguard the quality of each article we publish.
Find out more
ORIGINAL RESEARCH article
Front. Med. , 02 February 2023
Sec. Geriatric Medicine
Volume 10 - 2023 | https://doi.org/10.3389/fmed.2023.1095385
This article is part of the Research Topic Caregivers of Older Individuals: Reflections about Living, Health, Work and Social Conditions View all 9 articles
Introduction: Due to its increasing prevalence, dementia is currently one of the most extensively studied health issues. Although it represents a comparatively less-addressed issue, the caregiving burden for dementia patients is likewise receiving attention.
Methods: To identify determinants of depression in dementia caregivers, using Community Health Survey (CHS) data collected by the Korea Disease Control and Prevention Agency (KDCA). By setting “dementia caregiver's status of residence with patient” as a standard variable, we selected corresponding CHS data from 2011 to 2019. After refining the data, we split dementia caregiver and general population groups among the dataset (n = 15,708; common variables = 34). We then applied three machine learning algorithms: Extreme Gradient Boosting (XGBoost), Logistic Regression (LR), and Support Vector Classifier (SVC). Subsequently, we selected XGBoost, as it exhibited superior performance to the other algorithms. On the feature importance of XGBoost, we performed a multivariate hierarchical regression analysis to validate the depression causes experienced in each group. We validated the results of the statistical model analysis by performing Welch's t-test on the main determinants exhibited within each group.
Results: By verifying the results from machine learning via statistical model analysis, we found “sex” to highly impact depression in dementia caregivers, whereas “status of economic activities” is significantly associated with depression in the general population.
Discussion: The evident difference in causes of depression between the two groups may serve as a basis for policy development to improve the mental health of dementia caregivers.
Owing to its increasing prevalence, dementia is considered one of the most crucial health issues worldwide. Nichols et al. found that the global prevalence of dementia increased by 117% from 1990 to 2016 across 195 countries (1), and they predicted a threefold increase in the number of dementia patients from 2019 to 2050 (2). The socioeconomic costs of dementia have likewise increased. A global study on the economic burden of dementia discovered a total increase from $279.6 billion in 2000 to $946 billion in 2016, with a rapid annual increase rate of 15.94% (3). Furthermore, this economic burden poses a more significant issue in low- and middle-income countries (LMICs). Mattap et al. analyzed the total national costs of dementia in 122 LMICs, and found them to range from 1.04 to $195 million, accounting for 0.45% of each country's GDP on average (4). The impact of dementia has been emphasized by numerous studies analyzing its increasing prevalence and burden. However, research pertaining to dementia caregivers is relatively less prominent.
The burden on dementia caregivers can be investigated in terms of various aspects. Due to the heavy strain of caring for dementia patients, caregivers often suffer a severe psychological burden. In one related study, Givens et al. found a stronger prevalence of high depressive symptoms in caregivers of dementia patients compared to those of patients with other illnesses (5). In addition to its psychological effects, the caregiver burden also has a significant socioeconomic impact. Financial strain, which entails one's “perceived economic stress and lack of economic support” (6), is found to be positively associated with the load of the caregiving role in dementia caregivers (7). The aforementioned studies illustrate the severe impact of caregiver burden in psychological as well as socioeconomic contexts.
The psychological burden of caregivers has generally been analyzed by statistical methods. An ordinary least squares regression was employed to examine the family caregiver burdens among the Chinese population (8), whereas multivariate linear and logistic regressions were applied to determine the variables affecting the domestic dementia caregiver burden in South Korea (9). Recently, machine learning has been employed as an analytical tool to identify relations between diverse variables. For example, Antoniadi et al. employed random forests to predict the psychological burden of amyotrophic lateral sclerosis (ALS) caregivers (10). Subsequently, they employed Extreme Gradient Boosting (XGBoost), an explainable machine learning algorithm, to identify the predictors of the ALS caregivers' quality of life (QoL) indices (11).
Based on the aforementioned studies, we identified and analyzed the factors associated with depression in dementia caregivers using machine learning algorithms. We examined various determinants and features using a large-scale dataset collected nationwide in South Korea. To ensure more accurate analysis, we validated the results obtained from machine learning with a statistical model.
To identify the determinants of depression in dementia caregivers, we compared them against those appearing within the general population. First, we conducted an analysis using data from the Community Health Survey (CHS), collected by the Korea Disease Control and Prevention Agency (KDCA) (12). Because “dementia caregiver's status of residence with the patient” is the standard variable of this study, we selected an appropriate dataset ranging from 2011 to 2019 (Step 1). Subsequently, we preprocessed the collected dataset, wherein any inappropriate data were removed prior to analysis (Step 2). Based on the variables represented in the survey, we applied XGBoost, Logistic Regression (LR), and Support Vector Classifier (SVC) to determine factors associated with depression in dementia caregivers (Step 3). Finally, we validated the results from machine learning by conducting a hierarchical multivariate regression analysis (Step 4). Details of the procedure are illustrated in Figure 1.
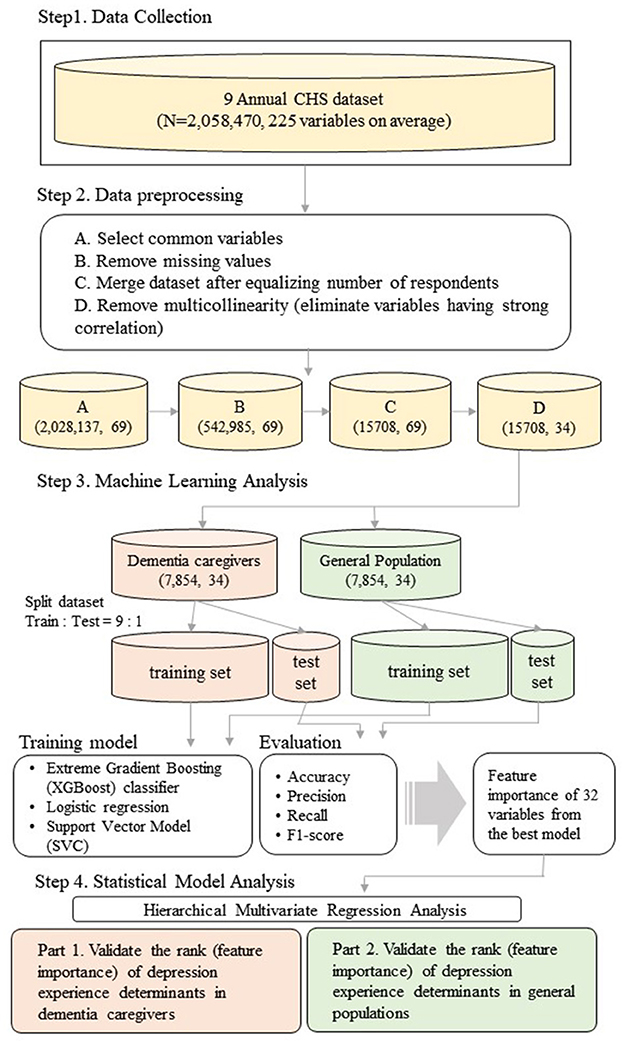
Figure 1. Overview of the research analysis procedure.
The dataset analyzed in this study comprises open-access data from the CHS, a nationwide annual survey conducted by the KDCA to construct a fundamental basis of health policy and compare the health statuses between regions in South Korea (12). This survey examines various health issues affecting South Korean citizens over the age of 19. The questions within the survey pertain to physical as well as mental health, encompassing ~ 225 variables on average. The number of respondents remained similar among all surveys, with an average of ~ 228,719. A detailed description of the dataset is presented in Table 1.
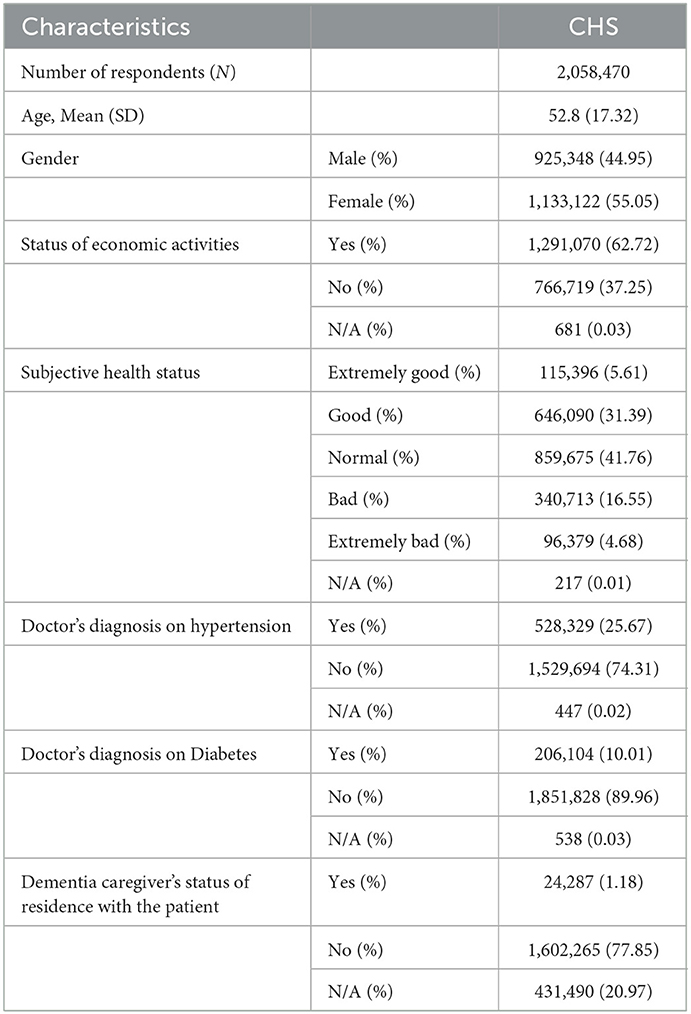
Table 1. Baseline characteristics of the CHS dataset.
Prior to analysis, we preprocessed the dataset in four steps. First, any uncommon variables were eliminated from the set. To ensure that all data reflected the standard variable, the original range from 2008 to 2020 was narrowed down to a span from 2011 to 2019. Consequently, the dataset's dimensionality was reduced to (2,028,137, 69). Certain variables were associated with different variable codes or data types and were appropriately equalized. Next, we eliminated inappropriate responses [i.e., no response, not applicable(N/A)], and this step decreased the total number of respondents from 2,058,470 to 542,985, which is 26.37% of total original respondents. After equalizing the number of respondents on the “dementia caregiver's status of residence with the patient” question, all nine annual datasets were merged. A total of 7,854 respondents answered “yes” to this question, whereas 417,272 participants answered “no.” Due to the significant gap between the two responses, we applied equalization to prevent potential bias prior to analysis. By randomly selecting the larger group, the dataset's dimensionality was reduced to (15,708, 69). Lastly, we eliminated the variables that exhibited strong correlations between themselves, thereby preventing distortion due to multicollinearity. To achieve this, we composed a correlation matrix of variables and eliminated the former variable with a threshold value of 0.4. Consequently, the dimensionality of the final dataset shrunk to (15,708, 34). Variables present in the final dataset are listed in Table 2.
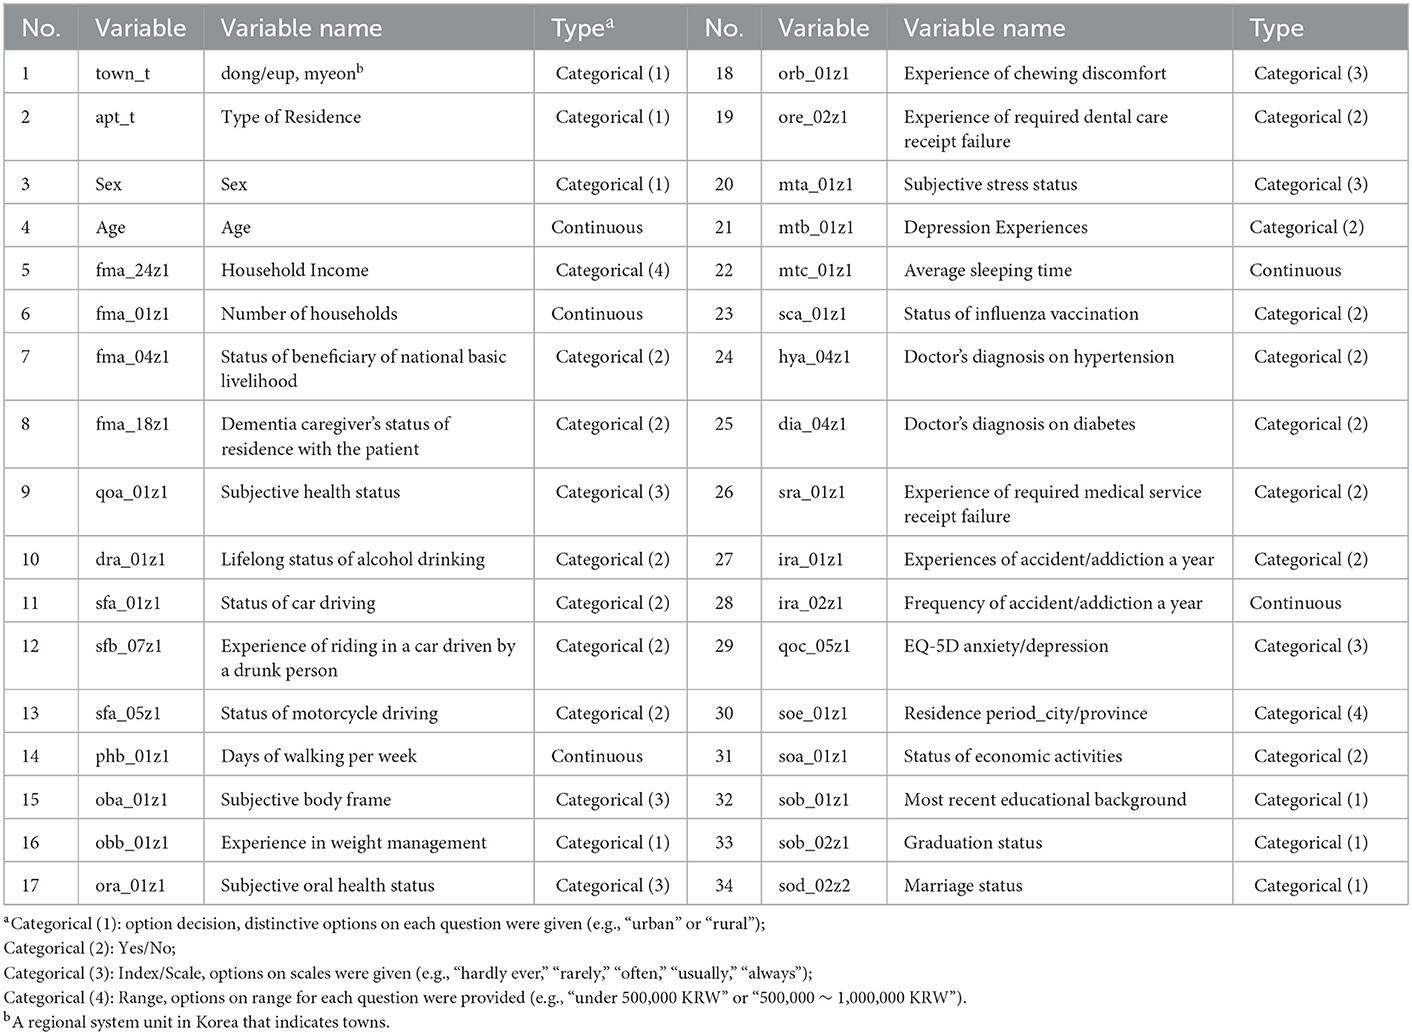
Table 2. List of common variables within the final dataset.
We trained three machine learning models using the preprocessed dataset: XGBoost, LR, and SVC. The XGBoost algorithm is an ensemble model of decision trees. Rather than employing a single strong decision tree, this algorithm weighs several weak decision trees sequentially, thereby constructing a strong integrated model (13). With each newly added classifier, the algorithm works to minimize the loss:
The algorithm trains decision trees with n samples and m features in dimension . In this study, we used two sets comprising 7,854 (n) samples and 32 (m) features to train the model. Formula (1) expresses the loss function of the XGBoost algorithm. To optimize the loss, we minimized the gap between the predicted () and real (yi) values. Formula (2) represents a penalization function that prevents excessive model complexity–which may lead to overfitting–by smoothing the learned weights. We assigned class labels according to depression status and trained the model to predict depression in the dementia caregiver and general population datasets. We applied hyperparameters as default settings while changing a few of them (n_estimators = 3,000, scale_pos_weight = 1.5, nthread = 4, eta = 0.3, gamma = 0).
The LR algorithm classifies variables among binary classes based on a probability value ranging from 0 to 1 (14). This probability is compared to a threshold value, with classes being assigned to variables according to the result. In this study, we used the default threshold of 0.5 for classification. The L2 penalty was assigned in this model, and the solver was assigned as newton-cg.
The SVC algorithm is a clustering method based on the decision boundary, a standard used to cluster datasets into different groups. By setting the support vector, a training data point located closest to the decision boundary, the model attempts to maximize the distance between the support vector and the decision boundary (15). In the case of non-linear datasets, the boundary is set by means of a kernel, which maps the variables to a higher-dimensional feature space, allowing the model to learn the appropriate features. Thus, a kernel enables the clustering of more complex datasets that are not linearly separable. In the present study, the radial basis function (rbf) kernel was employed for mapping, and gamma was set to auto.
To identify the determinants of depression in dementia caregivers, we divided the final dataset into dementia caregiver and general population group each according to the “dementia caregiver's status of residence with the patient.” The size of the dataset of each group then resulted as (7,854, 33) as the standard variable (i.e., “dementia caregiver's status of residence with the patient”) was excluded. Then, we divided each dataset into a 9:1 ratio, 7,086:786. We put the former to train dataset and the latter to test dataset for all three machine learning algorithms. Among 33 variables, “depression experience” was set to the dependent variable, with the remaining 32 variables designated as independent. A 10-fold cross validation (CV) method was applied to each model in the training and test process to prevent overfitting. To ensure easy replicability, all other settings were as default. Upon completion of analyses, we selected the best model based on performance. The evaluation metrics used for model selection were accuracy (4), precision (5), recall (6), and F1-score (7). All metrics were calculated from the confusion matrix, which comprises true positive (TP), true negative (TN), false positive (FP), and false negative (FN) values. The four evaluation metric were calculated using the following formulas:
To validate the accuracy of the results obtained from machine learning algorithms, we performed a hierarchical multivariate regression analysis to examine the effects of certain variables with the change of a statistically significant amount (e.g., R2 score). We validated the obtained ranks of depression causes by ordering the variables according to predicted feature importance. All variables were arranged into blocks of 10 according to significance, and the two least-significant variables were disregarded. The analysis comprised two phases: an in-group analysis, and a between-group analysis. In the former, we validated the ranking within each group by ordering the variables. In the latter, we verified the accuracy of the overall ranking by examining combinations between the groups. Based on the results from a hierarchical multivariate regression analysis, we performed a Welch's t-test on the high impact variables of dementia caregiver and general population each to verify the result of previous analysis.
The entire code for data preprocessing and machine learning algorithms was written in Python (version 3.9.7; scikit-learn, version 0.24.2). The entire code for statistical analyses was written in R (version 4.2.1).
The performance of all classification algorithms is summarized in Tables 3, 4. For both dementia caregiver and general population datasets, XGBoost exhibited optimal performance. Although the model obtained lower recall and F1-score values than the other models in both cases, it achieved the best results in accuracy and precision. Because accuracy represents overall classification, whereas all other metrics only account for TPs, we assigned a higher weight to accuracy (e.g., Group 1+Group 2, Group 1+Group 2+Group 3).
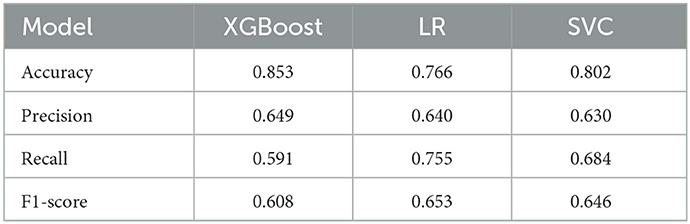
Table 3. Classification performance on dementia caregiver dataset.

Table 4. Classification performance on general population dataset.
The feature importance results obtained by the XGBoost model are graphed in Figure 2. Overall, the rankings appear to be largely similar among the two datasets. However, “sex” and “lifelong status of alcohol drink” are ranked higher within the dementia caregiver dataset, whereas “experience of weight management,” “status of economic activities,” and “type of residence” are ranked higher in the general population dataset.

Figure 2. Feature importance of depression factors in dementia caregivers and general population (XGBoost). (A) Dementia caregiver. (B) General population.
We conducted a hierarchical multivariate regression analysis to validate the results obtained in the previous section. First, we performed an in-group analysis to validate rankings within groups, as shown in Supplementary Tables 1, 2. For each group, the top five determinants were placed in the first block, the following two determinants were added to the second block, and the bottom three determinants were added to the third block. As new variables were introduced, the R2 value increased along with the size of determinants. Thus, we verified the accuracy of ranking within each group.
Subsequently, we performed a between-group analysis to validate the rankings of determinants between groups. Results are listed in Supplementary Tables 3, 4. We considered the five determinants that exhibited variability between the datasets: sex, lifelong status of alcohol drink, experience of weight management, status of economic activities, and type of residence. Within each block, all variables were placed according to rank of feature importance. To prevent the overpowering effect of high-impact variables, our analysis encompassed three iterations, with the number of Group 1 variables changing from the top 5 to the top 10.
Overall, the inter-group ranking was confirmed by a reduction in the increase of R2 scores with the addition of new variables. However, two exceptions exhibited a sizable increase in the R2 scores: “sex” and “status of economic activities.” Likewise, the combination of the two variables produced the highest R2 values. To further analyze the ranks of these variables in both datasets, we compared the change in R2 values between the two. In the dementia caregiver dataset, the change in R2 between “Group1 variables” and “Group1 variables + status of economic activities” was 0.007, and the change between “Group1 variables + status of economic activities” and “Group1 variables + status of economic activities + sex” was 0.0037. In the general population dataset, the change in R2 value between “Group1” variables and “Group1 variables + sex” was 0.0061, and the change between “Group1 variables + sex” and “Group1 variables + sex + status of economic activities” was 0.0053. From these results, we conclude that “sex” has a higher impact on depression than “status of economic activities” in dementia caregivers, whereas the reverse is true for the general population.
Because we found “sex” and “status of economic activities” to have a high impact on depression in dementia caregivers and the general population, respectively, we further verified the results with Welch's t-test, as shown in Supplementary Tables 5, 6. This test was performed to evaluate the difference in depression experiences in each group with respect to variables. As positive and negative responses regarding depression experiences were coded as 1 and 2, respectively, our objective was to determine which group yields a lower sample estimate. The results exhibited a difference among the datasets. In dementia caregiver group, women were found to experience depression more than men (p < 0.01). In general population group, a lack of economic activities was associated with depression (p < 0.01). Thus, the results obtained by XGBoost and the statistical model analysis were verified to be accurate.
This study was conducted to identify determinants of the psychological burden experienced by dementia caregivers in South Korea. Results were obtained by machine learning algorithms and subsequently verified through a statistical model analysis. By allocating the data provided by the KDCA among dementia caregivers and general population groups, we were able to rank the determinants of depression within each group. Studies regarding the predictors of caregiver burden have been conducted for various illnesses. D'Amelio et al. investigated such predictors in Parkinson's Disease caregivers (16), and Coen et al. discovered comparable factors for Alzheimer's Disease (17). Similar to our study, Kim et al. examined the predictors of caregiver burden for dementia (18). Due to its advantages, many studies have employed machine learning to discover the predictors of psychological burdens. Prout et al. conducted a study to determine the predictors of psychological distress worldwide during the COVID-19 pandemic using machine learning algorithms (19). Likewise, Zhang et al. applied machine learning to evaluate the impact of predictors of postpartum depression in pregnant women (20).
After performing the classification task with three machine learning algorithms (i.e., “SVC,” “LR,” and “XGBoost”), we selected the XGBoost classifier, which exhibited the best performance. The XGBoost model obtained the feature importance of determinants of depression within the dementia caregiver and general population groups. Although the two groups exhibited similar overall rankings, they showed differences in the low-ranked variables (Figure 2).
To validate the results of the XGBoost classifier, we hierarchically allocated the determinants among three groups (“Group 1,” “Group 2,” “Group 3”), with 10 variables in each. Group 1, which comprised the 10 most significant determinants, had nine common variables, and the result dovetailed with prior findings on depression. First, “age” was determined to be the highest-ranked variable in both groups. Likewise, a prior study has also discovered a higher prevalence of depression among the elderly (21, 22). Particularly, the result aligns with the previous study that showed the high average age of dementia caregivers, which ranges from 43.6 to 71.8 (23). The age distribution of dementia caregivers accouns for the prominent impact of age on depression experience in the dementia caregiver group. “Days of walking per week” was also found to have a high impact on depression in both groups. It aligns with the prior finding on a positive correlation between physical activity and depression (24, 25), and the clinical effectiveness of walking as a treatment for depression (26). “Household income” and “most recent educational background” were also found to have a high impact on depression in both groups, aligning with prior findings on the positive relationship between socioeconomic status and depression (27). “Number of households” was another determinant that exhibited a high rank in both groups. Likewise, Sempungu et al. found that an increase in household size is associated with a lower prevalence of depression among the Korean population (28). Another high-ranking factor in both groups was the “experience of chewing discomfort.” A negative relationship between oral health and depression has been established in prior studies, where tooth loss was found to have a significant effect (29, 30). Although “average sleeping time” exhibited a high rank in both groups, the rank was slightly higher for dementia caregivers. Al-Abri found a strong bidirectional relationship between sleep deprivation and depression in the general population (31). Furthermore, Gao et al. discovered that dementia caregivers generally sleep 2.42–3.5 fewer hours per week with poorer sleep quality, than the general population (32), supporting a higher rank in dementia caregivers. “Subjective body frame” was another high-impact variable in both groups. Likewise, Richard et al. discovered a positive relationship between depression and body weight dissatisfaction in general populations (33). Finally, “subjective health status” appeared in Group 1 for both groups. Chang-Quan et al. found a similarly strong association between poor self-rated health status and depression among the elderly (34). However, “subjective oral health status” ranked 9th in the dementia caregiver group, and 13th in the general population group. Furthermore, “experience of weight management” ranked 5th in general populations and 12th in dementia caregivers. A strong correlation between depression and both variables was proven in previous studies (30, 35), however, a gap of ranks between dementia caregivers and general populations in them have been discovered in our study.
For Groups 2 and 3, a comparison between the two datasets produced divergent results. There were a few variables that showed a significant gap of ranks between the dementia caregiver and the general population group unlike Group 1. For example, “sex” ranked 20th in the dementia caregiver group, and 25th in the general population group. Moreover, “status of economic activities” ranked 24th in dementia caregivers, and 18th in general populations. In addition, “lifelong status of alcohol drinking” ranked 15th in dementia caregivers and 24th in general populations. Contrarily, some of the variables did not reflect a large gap between the two groups. For instance, “EQ-5D Anxiety/Depression” ranked 17th in the dementia caregiver group, and 16th in the general population group. Also, “Experience of required dental care receipt failure” ranked 19th in the dementia caregiver group, and 21st in the general population group. The rank of “Residence Period_City/Province” was the same as 22nd in both population groups.
Furthermore, we performed a statistical model analysis to verify the accuracy of the aforementioned ranking results. In the in-group analysis, we assessed the rankings of determinants within each group. We constructed three blocks containing five, two, and three variables ordered by rank, respectively, and determined the pseudo R2 scores of all blocks, as listed in Supplementary Tables 1, 2. We verified the increase in scores with the addition of new variables in each block of both groups, thereby verifying the accuracy of the ranks obtained by XGBoost. We also found that the increase in R2 scores was higher in Block 2 than in Block 3 for both groups. Thus, we verified the hierarchy of variables between the two groups.
In the between-group analysis, we evaluated the ranks of determinants between the groups. By selecting the variables showing differences, we placed Group 1 variables in the first block, Group 2 variables in the second, and Group 3 variables in the third. Subsequently, we obtained the pseudo R2 scores of all blocks, as shown in Supplementary Tables 3, 4. Overall, we found the combination of all ten variables in Group 1 to produce the highest scores, demonstrating the high impact of the variables. Furthermore, the R2 score of Block 2 containing “sex” was highest, and “status of economic activities” was highest in Block 3 in dementia caregivers. These results were reversed in the general population group, wherein “status of economic activities” yielded the highest R2 score for Block 2, and “sex” produced the highest R2 score for Block 3.
Subsequently, we performed an additional statistical test on high-impact variables within each group, as shown in Supplementary Tables 5, 6. By performing a t-test, we found that women tend to experience depression more frequently in dementia caregivers, whereas the lack of economic activities was strongly associated with depression in general populations. As a result, we concluded that “sex” is the strongest determinant of depression in dementia caregivers, and “status of economic activities” is the strongest determinant of depression in the general population, considering the hierarchy of determinants resulted from XGBoost classifier (i.e., feature importance) and the result from statistical analyses (i.e., a hierarchical multivariate regression analysis, Welch's t-test) which have proven the rank of determinants once more.
The findings on the high Impact of determinants on depression In each group also dovetails with the previous studies. Previous study has discovered that the females suffer more than males from the caregiver burden of dementia patients (23, 36). A higher rank of “sex” in the caregivers can be interpreted in terms of it. Moreover, it has been found that the primary gender ratio in dementia caregiver participation is female (23). A predominant occupation of females in caregiver accounts for a high impact on depression experience. A high impact of “status of economic activities” on depression of the general population has also been proven. A positive association between depression and employment status in the general population has been indicated by previous studies (37, 38). Not just the risk of depression experience, but also the pattern of depression may vary depending on the employment status (38). The correlation aligns with our findings on the principal impact of “status of economic activities” on depression experience in the general population.
The present study was conducted to identify the determinants of depression among dementia caregivers. We used a large-scale dataset encompassing nationwide information from the general population of South Korea. We first employed three machine learning algorithms and subsequently validated the results obtained by the best-performing model. However, this study had several limitations. Because the survey respondents within the dataset represent the general population, a reduction in dataset size was inevitable when creating the dementia caregiver set. To supplement the reduction, we applied 10-fold CV in the machine learning process to eliminate bias and fully represent the dataset's characteristics prior to analysis. Furthermore, few variables were found to exhibit significant differences between the dementia caregiver and general population groups. The similarity among most determinants of depression can be attributed to the dataset, which has been collected from the general population. An additional study with an appropriate dataset may therefore be required to elucidate the differences in the causes of depression between the two groups.
Our study reveals an apparent difference in the main determinants of depression between the dementia caregiver and the general population, which indicates a necessity to conduct further research pertaining to dementia caregivers. The findings obtained by this study may serve as a basis for policy establishment to improve the mental health of dementia caregivers.
Publicly available datasets were analyzed in this study. This data can be found at: https://chs.kdca.go.kr/chs/ from Korea Centers for Disease Control and Prevention Data (KDCA).
KC and JC designed the model and the computational framework, analyzed the data, and wrote the manuscript with input from all authors. KC, JC, and SH carried out the implementation. KC performed the calculations. SH conceived the study and was in charge of overall direction and planning. All authors contributed to the article and approved the submitted version.
This research was supported by the Yonsei Signature Research Cluster Program of 2021 (2021-22-0005). This work was supported by the National Research Foundation of Korea (NRF) grant funded by the Korea government (MSIT) (No. 2019R1A2C1007399).
The authors declare that the research was conducted in the absence of any commercial or financial relationships that could be construed as a potential conflict of interest.
All claims expressed in this article are solely those of the authors and do not necessarily represent those of their affiliated organizations, or those of the publisher, the editors and the reviewers. Any product that may be evaluated in this article, or claim that may be made by its manufacturer, is not guaranteed or endorsed by the publisher.
The Supplementary Material for this article can be found online at: https://www.frontiersin.org/articles/10.3389/fmed.2023.1095385/full#supplementary-material
1. Nichols E, Szoeke CE, Vollset SE, Abbasi N, Abd-Allah F, Abdela J, et al. Global, regional, and national burden of Alzheimer's disease and other Dementias, 1990–2016: a systematic analysis for the global burden of disease study 2016. Lancet Neurol. (2019) 18:88–106. doi: 10.1016/S1474-4422(18)30403-4
2. Nichols E, Steinmetz JD, Vollset SE, Fukutaki K, Chalek J, Abd-Allah F, et al. Estimation of the global prevalence of dementia in 2019 and forecasted prevalence in 2050: an analysis for the global burden of disease study 2019. Lancet Public Health. (2022) 7:e105–125. doi: 10.1016/S2468-2667(21)00249-8
3. Xu J, Zhang Y, Qiu C, Cheng F. Global and regional economic costs of dementia: a systematic review. The Lancet. (2017) 390. doi: 10.1016/S0140-6736(17)33185-9
4. Mattap SM, Mohan D, McGrattan AM, Allotey P, Stephan BCM, Reidpath DD, et al. The economic burden of dementia in low- and middle-income countries (LMICs): a systematic review. BMJ Glob Health. (2022) 7:4. doi: 10.1136/bmjgh-2021-007409
5. Givens JL, Mezzacappa C, Heeren T, Yaffe K, Fredman L. Depressive symptoms among dementia caregivers: role of mediating factors. Am J Geriatr Psychiatry. (2014) 22:481–8. doi: 10.1016/j.jagp.2012.08.010
6. Adams DR, Meyers SA, Beidas RS. The relationship between financial strain, perceived stress, psychological symptoms, and academic and social integration in undergraduate students. J Am College Health. (2016) 64:362–70. doi: 10.1080/07448481.2016.1154559
7. Liu Y, Dokos M, Fauth EB, Lee YG, Zarit SH. Financial strain, employment, and role captivity and overload over time among dementia family caregivers. Gerontologist. (2019). doi: 10.1093/geront/gnz099
8. Li J. Predictors of family caregiver burden in Shanghai. J Appl Gerontol. (2020) 40:703–12. doi: 10.1177/0733464820951029
9. Kim M-D, Hong S-C, Lee C-I, Kim S-Y, Kang I-O, Lee S-Y. Caregiver burden among caregivers of Koreans with dementia. Gerontology. (2008) 55:106–13. doi: 10.1159/000176300
10. Antoniadi AM, Galvin M, Heverin M, Hardiman O, Mooney C. Prediction of caregiver burden in amyotrophic lateral sclerosis: a machine learning approach using random forests applied to a cohort study. BMJ Open. (2020) 10:2. doi: 10.1136/bmjopen-2019-033109
11. Antoniadi AM, Galvin M, Heverin M, Hardiman O, Mooney C. Development of an explainable clinical decision support system for the prediction of patient quality of life in amyotrophic lateral sclerosis. In: Proceedings of the 36th Annual ACM Symposium on Applied Computing. Virtual Event, Republic of Korea (2021).
12. Korea Centers for Disease Control and Prevention Data From: Community Health Survey. August 2011 ~ August 2019. Available online at: https://chs.kdca.go.kr/chs/ (accessed January 09, 2022).
13. Chen T, Guestrin C. XGBoost. In: Proceedings of the 22nd ACM SIGKDD International Conference on Knowledge Discovery and Data Mining. San Francisco, CA (2016).
14. Dreiseitl S, Ohno-Machado L. Logistic regression and artificial neural network classification models: a methodology review. J Biomed Inform. (2002) 35:352–9. doi: 10.1016/S1532-0464(03)00034-0
15. Wu Q, Zhou D. Analysis of support vector machine classification. J Comput Anal Appl. (2006) 8:2. Available online at: https://www.researchgate.net/publication/238652514_Analysis_of_support_vector_machine_classification
16. D'Amelio M, Terruso V, Palmeri B, Benedetto ND, Famoso G, Cottone P, et al. Predictors of caregiver burden in partners of patients with Alzheimer's disease. Neurol Sci. (2009) 30:171–4. doi: 10.1007/s10072-009-0024-z
17. Coen RF, Swanwick GRJ, O'Boyle CA, Coakley D. Behaviour disturbance and other predictors of career burden in Alzheimer's disease. Int J Geriatr Psychiatry. (1997) 12:331.
18. Kim H, Chang M, Rose K, Kim S. Predictors of caregiver burden in caregivers of individuals with dementia. J Adv Nurs. (2011) 68:846–55. doi: 10.1111/j.1365-2648.2011.05787.x
19. Prout TA, Zilcha-Mano S, Aafjes-van Doorn K, Békés V, Christman-Cohen I, Whistler K, et al. Identifying predictors of psychological distress during COVID-19: a machine learning approach. Front Psychol. (2020) 11:586202. doi: 10.3389/fpsyg.2020.586202
20. Zhang W, Liu H, Silenzio VM, Qiu P, Gong W. Machine learning models for the prediction of postpartum depression: application and comparison based on a cohort study. JMIR Med Inform. (2020) 8:4. doi: 10.2196/15516
21. Mirowsky J, Ross CE. Age and depression. J Health and Soc Behav. (1992) 33:3. doi: 10.2307/2137349
22. Stordal E, Mykletun A, Dahl AA. The association between age and depression in the general population: a multivariate examination. Acta Psychiatr Scand. (2003) 107:132–41. doi: 10.1034/j.1600-0447.2003.02056.x
23. Chien L-Y, Chu H, Guo J-L, Liao Y-M, ChangL-I, Chen C-H, et al. Caregiver support groups in patients with dementia: a meta-analysis. Int J Geriatr Psychiatry. (2011) 26:1089–98. doi: 10.1002/gps.2660
24. Camacho TC, Roberts RE, Lazarus NB, Kaplan GA, Cohen RD. Physical activity and depression: evidence from the Alameda County study. Am J Epidemiol. (1991) 134:220–31. doi: 10.1093/oxfordjournals.aje.a116074
25. Dinas PC, Koutedakis Y, Flouris AD. Effects of exercise and physical activity on depression. Ir J Med Sci. (2010) 180:319–25. doi: 10.1007/s11845-010-0633-9
26. Robertson R, Robertson A, Jepson R, Maxwell M. Walking for depression or depressive symptoms: a systematic review and meta-analysis. Ment Health Phys Act. (2012) 5:66–75. doi: 10.1016/j.mhpa.2012.03.002
27. Miech RA, Shanahan MJ. Socioeconomic status and depression over the life course. J Health Soc Behav. (2000) 41:2. doi: 10.2307/2676303
28. Sepumungu JK, Choi M, Lee EH, Lee YH. Changes in household size and depression: a temporal analysis. Res Square. (2022). doi: 10.21203/rs.3.rs-1224296/v1
29. Cademartori MG, Gastal MT, Nascimento GG, Demarco FF, Corrêa MB. Is depression associated with oral health outcomes in adults and elders? A systematic review and meta-analysis. Clin Oral Invest. (2018) 22:2685–702. doi: 10.1007/s00784-018-2611-y
30. Okoro CA, Strine TW, Eke PI, Dhingra SS, Balluz LS. The association between depression and anxiety and use of oral health services and tooth loss. Community Dent Oral Epidemiol. (2011) 40:134–44. doi: 10.1111/j.1600-0528.2011.00637.x
31. Al-Abri MA. Sleep deprivation and depression: a bi-directional association. Sultan Qaboos Univ Med J. (2015) 15:e4–6. Available online at: https://www.ncbi.nlm.nih.gov/
32. Gao C, Chapagain NY, Scullin MK. Sleep duration and sleep quality in caregivers of patients with dementia. JAMA Netw Open. (2019) 2:8. doi: 10.1001/jamanetworkopen.2019.9891
33. Richard A, Rohrmann S, Lohse T, Eichholzer M. Is body weight dissatisfaction a predictor of depression independent of body mass index, sex and age? results of a cross-sectional study. BMC Public Health. (2016) 16:1. doi: 10.1186/s12889-016-3497-8
34. Chang-Quan H, Xue-Mei Z, Bi-Rong D, Zhen-Chan L, Ji-Rong Y, Qing-Xiu L. Health status and risk for depression among the elderly: a meta-analysis of published literature. Age Ageing. (2009) 39:1. doi: 10.1093/ageing/afp187
35. Dixon JB, Dixon ME, O'Brien PE. Depression in association with severe obesity. Arch Intern Med. (2003) 163:17. doi: 10.1001/archinte.163.17.2058
36. Xiong C, Biscardi M, Astell A, Nalder E, Cameron JI, Mihailidis A, et al. Sex and gender differences in caregiving burden experienced by family caregivers of persons with dementia: a systematic review. PLoS ONE. (2020) 15:4. doi: 10.1371/journal.pone.0231848
37. Dooley D, Prause J, Ham-Rowbottom KA. Underemployment and depression: longitudinal relationships. J Health Soc Behav. (2000) 41:4. doi: 10.2307/2676295
Keywords: depression, dementia, caregiver, community health survey, machine learning, statistical model
Citation: Cho K, Choi J and Han S (2023) Validation of depression determinants in caregivers of dementia patients with machine learning algorithms and statistical model. Front. Med. 10:1095385. doi: 10.3389/fmed.2023.1095385
Received: 11 November 2022; Accepted: 17 January 2023;
Published: 02 February 2023.
Edited by:
Tábatta Brito, Federal University of Alfenas, BrazilReviewed by:
Luciana Alves, State University of Campinas, BrazilCopyright © 2023 Cho, Choi and Han. This is an open-access article distributed under the terms of the Creative Commons Attribution License (CC BY). The use, distribution or reproduction in other forums is permitted, provided the original author(s) and the copyright owner(s) are credited and that the original publication in this journal is cited, in accordance with accepted academic practice. No use, distribution or reproduction is permitted which does not comply with these terms.
*Correspondence: Sanghoon Han,  c2FuZ2hvb24uaGFuQHlvbnNlaS5hYy5rcg==
Disclaimer: All claims expressed in this article are solely those of the authors and do not necessarily represent those of their affiliated organizations, or those of the publisher, the editors and the reviewers. Any product that may be evaluated in this article or claim that may be made by its manufacturer is not guaranteed or endorsed by the publisher.
Research integrity at Frontiers
Learn more about the work of our research integrity team to safeguard the quality of each article we publish.