
95% of researchers rate our articles as excellent or good
Learn more about the work of our research integrity team to safeguard the quality of each article we publish.
Find out more
ORIGINAL RESEARCH article
Front. Med. , 16 February 2023
Sec. Infectious Diseases: Pathogenesis and Therapy
Volume 10 - 2023 | https://doi.org/10.3389/fmed.2023.1049642
This article is part of the Research Topic Current Priorities in Health Research Agendas: Tensions Between Public and Commercial Interests in Prioritizing Biomedical, Social, and Environmental Aspects of Health View all 15 articles
 Maryam Shirvani Shiri1
 Hassan Karami2
 Hosein Ameri3Ali Akbari Sari1Maryam Tatari4,5
 Sara Emamgholipour1*Somayeh Afshari1
COVID-19 is a global challenge that negatively affects the health–related quality of life (HRQoL) of the general population. The current study aimed to evaluate HRQoL and its associated factors among the Iranian general population during the COVID-19 pandemic. The data were collected in 2021 using the EuroQol 5-Dimension 3-Level (EQ-5D-3L) and EQ-5D Visual Analog Scale (EQ VAS) questionnaires through an online survey. Participants were recruited via social media from the Fars province. The multiple binary logistic regression model was used to identify factors influencing participants' HRQoL. Kolmogorov-Smirnov, the t-test, ANOVA, and the chi-square test were used. All tests were conducted at a significance level of 5% using Stata 14.2 and SPSS 16. A total of 1,198 participants were involved in this cross-sectional study. The mean age of participants was 33.3 (SD:10.2), and more than half were women (55.6%). The mean EQ-5D-3L index value and EQ-VAS of the respondents were 0.80 and 77.53, respectively. The maximum scores of the EQ-5D-3L and EQ-VAS in the present study were 1 and 100, respectively. The most frequently reported problems were anxiety/depression (A/D) (53.7%), followed by pain/discomfort (P/D) (44.2%). Logistic regression models showed that the odds of reporting problems on the A/D dimension increased significantly with supplementary insurance, including concern about getting COVID-19, hypertension, and asthma, by 35% (OR = 1.35; P = 0.03), 2% (OR = 1.02; P = 0.02), 83% (OR = 1.83; P = 0.02), and 6.52 times (OR = 6.52; P = 0.01), respectively. The odds of having problems on the A/D dimension were significantly lower among male respondents, those in the housewives + students category, and employed individuals by 54% (OR = 0.46; P = 0.04), 38% (OR = 0.62; P = 0.02) and 41% (OR = 0.59; P = 0.03), respectively. Moreover, the odds of reporting a problem on the P/D dimension decreased significantly in those belonging in a lower age group and with people who were not worried about getting COVID-19 by 71% (OR = 0.29; P = 0.03) and 65% (OR = 0.35; P = 0.01), respectively. The findings of this study could be helpful for policy-making and economic evaluations. A significant percentage of participants (53.7%) experienced psychological problems during the pandemic. Therefore, effective interventions to improve the quality of life of these vulnerable groups in society are essential.
The new coronavirus (COVID-19) has spread rapidly worldwide. By the beginning of 2022, more than 300 million people had been infected globally, and about five million had died (1). In Iran, the first case of infection was reported on 19/02/2020. In January 2022, the number of confirmed cases of COVID-19 was over 6,373,174, and the number of deaths from COVID-19 was more than 132,454 (2). Around the world, a variety of strong social distancing measures have been implemented to slow the growth rate of COVID-19 cases (e.g., in Wuhan and other Chinese cities (3, 4), across European countries (5), French regions (6), or some U.S. states (7, 8).
Similarly, the Iranian government adopted strong measures such as closing down schools, universities, and workplaces and propagating strict social distancing to reduce the prevalence of COVID-19. Such restrictions increased long-term psychological consequences and negatively affected the quality of life (QoL) of individuals through fear and anxiety, stress, and stigmatization (9, 10).
The World Health Organization defines the quality of life as people's perception of their position in life in terms of culture, the value system in which they live, and their goals, expectations, standards, and priorities. Therefore, it is a completely subjective topic that cannot be observed by others and is based on people's understanding of different aspects of life. This term is a wide-ranging notion that encompasses, in a complex way, a person's physical health, psychological condition, level of independence, and relation to notable features of their environment (11, 12).
Health–related quality of life (HRQoL) refers to those aspects of QoL that influence either physical or mental health. This measure enables healthcare policymakers to identify the factors affecting HRQoL and recognize those aspects of COVID-19 management that need to be enhanced to improve people's HRQoL (13, 14).
One of the most widely used instruments for measuring HRQoL in clinical and outcome research is the EuroQol 5-Dimension 3-Level (EQ-5D-3L) (15), which contains a descriptive system of five dimensions (Mobility, Self-Care, Usual-Activity, Pain-Discomfort, and Anxiety-Depression) and an EQ-5D Visual Analog Scale (EQ VAS) (16). EQ-5D is a generic measure recommended by the National Institute of Health and Care Excellence (NICE) to calculate the utility values of health states (17). The Iranian value set of EQ-5D-3L was estimated based on the time trade-off (TTO) method by Goudarzi et al. (18).
According to the available literature, the HRQoL of the general population is influenced by several socioeconomic and clinical factors. In a population-wide study, Ping et al. concluded that factors such as aging, chronic disease, lower income, epidemic effects, and concern about getting COVID-19 are effective in affecting HRQoL (19). Moreover, an Estonian study reported that being older, unemployed or economically inactive, and experiencing financial hardship were all correlated with lower HRQoL (20). Regarding the wide range of reports on HRQoL in the general population during the COVID-19 pandemic in other countries, such as China (19), Portugal (21), Vietnam (22), Egypt (23), Estonia (20), and Saudi Arabia (24), the lack of extensive national and subnational scale studies on the subject, the scarcity of studies on the relationship between HRQoL and socioeconomic and clinical factors, the assessment of the HRQoL of the Iranian general population and the identification of influential predictors of HRQoL during the COVID-19 pandemic need to be investigated. As a result, the present study evaluated the HRQoL of the general population during the COVID-19 pandemic and its relationship with socioeconomic and clinical factors in the Fars province, southern Iran.
This cross-sectional research was conducted on the general population in the Fars province from 23/10/2021 to 21/11/2021 (during the fifth wave of COVID-19). Fars is the fourth most populated province (4,851,274 people) in Iran. It is located in the south of the country and includes 36 cities (25). By 31/01/2022, a total of 534,127 confirmed COVID-19 cases with 7,485 deaths had been reported in the province (2).
The sample size of this study was calculated by the formula at a 95% confidence level (α−1), σ = 19.37, and the acceptable margin of error for the d parameter was 1.2 (19). The sample size was increased by 10% based on the probability of losing the number of samples during the study, and the final sample size was estimated to be 1,146 participants. Participants were recruited through convenience sampling.
The study population was comprised of inhabitants of the Fars province. Inclusion criteria were: (1) being 18 years of age or older; (2) having access to the internet and the online questionnaire; (3) agreeing to participate in the study by confirming the online consent form; and (4) having the complete ability to answer all questionnaires. Furthermore, people who were not residents of the Fars province, COVID-19 patients, in addition to those who were previously affected by COVID-19, and individuals with a past medical history of mental illness or who were under treatment for a mental health problem were excluded.
HRQoL was the response variable, and the explanatory variables included socio-economic and clinical factors such as gender (female respondents vs. male respondents); marital status (single vs. married); age (≤ 30, 31–40, 41–50, and ≥51 years); educational level (illiterate; <6th grade; 6–9th grade; 10–12th grade; >12th grade); employment status (employed; housewives+students; unemployed); insurance coverage (no vs. yes); place of residence (urban vs. rural); level of household income (very low; low; middle; high); concern about getting COVID-19 (never; no; yes; very worried), hypertension (no vs. yes); diabetes (no vs. yes); cardiovascular disease (no vs. yes); cerebrovascular disease (no vs. yes); pulmonary disease (no vs. yes); asthma (no vs. yes).
The current study was a web-based survey, and respondents participated in it via instant messaging (WhatsApp and Telegram). We found all the administrators of Telegram and WhatsApp channels by searching on Google and introducing ourselves through friends. We contacted the administrators of the Telegram and WhatsApp channels for all the cities in the Fars province and asked them to post the link to the online questionnaires for this study in their groups and invite members to complete the questionnaires. This included a statement outlining the objectives of the research and informed consent to participate in the study. Following confirmation of these statements, participants proceeded to the main stage of the questionnaire.
The data collection tool was a questionnaire consisting of the following sections:
1. Demographic and socio-economic information of participants.
2. Health status: health status variables include chronic diseases and behaviors associated with the COVID-19 pandemic. This information was self-reported. The behavior related to the pandemic was also defined as the degree of concern about being infected by COVID-19; responses were categorized into four states: “I'm never worried,” “I'm not worried,” “I'm slightly worried,” and “I'm very worried.”
3. The 3-Level version of the EuroQol 5-Dimension questionnaire (EQ-5D-3L) and the Visual Analog Scale (VAS) (validated Farsi version of the HRQoL questionnaire): this was used to determine the health status of participants. The EQ-5D-3L questionnaire consists of five questions, each measuring one of the five dimensions of HRQoL: Mobility (MO), Self-Care (SC), Usual Activities (UA), Pain/Discomfort (P/D), and Anxiety/Depression (A/D). The questions in each dimension are answered on a three-level scale, including no problems, some problems, and extreme problems. The scales were given a score from 1 (no problems) to 3 (extreme problems). Eventually, a five-digit code was obtained for each patient by putting the scores' numbers together. This method can generate 243 unique discrete health states (five to the power of three). The EuroQOL Group performed research mainly focusing on statistical modeling to produce numerical values for each of the 243 health states obtained from the EQ-5D-3L questionnaire. This utility-based EQ-5D-3L index score ranges from−0.113 (most severe impairment across all five dimensions) to 1 (no problems on any dimension) (18). EQ VAS is another part of the instrument that measures an individual's personal view of their HRQoL using a scale of 0 (worst health state) to 100 (best health state). This tool can be used to quantitatively assess respondents' health outcomes (26). The validity and reliability of the EQ-5D-3L were confirmed by weighted kappa coefficients of 0.66 to 0.92 and ICCs of 0.88 for cancer patients (27), in addition to kappa coefficients of 0.39 to 0.71, ICCs of 0.76, and the Cronbach's alpha of 0.87 for patients with type 2 diabetes in Iran (28).
Continuous variables were represented as mean ± standard deviation and categorical variables as frequencies and percentages. Since the result of the Kolmogorov–Smirnov normal distribution test for the EQ-5D-3L was significant (p < 0.05), the T-test and ANOVA tests were used to determine the differences in the EQ-5D-3L index value in each factor. For each dimension of the EQ-5D-3L, the second and third levels were merged to create two broader levels: “no problems” and “some or extreme problems.” Then, the chi-square test was used to assess the relationship between the EQ-5D-3L dimensions and qualitative variables. Finally, multiple logistic regression was used to obtain odds ratios (ORs) and 95% confidence intervals (95% CIs) for variables that were significantly associated with dimensions in the chi-square test. Key assumptions of multiple logistic regression were met. The independence of errors was not violated (Durbin-Watson statistic = 2.03). Also, multicollinearity was met (variance inflation factOR = ≤ 1.5). Furthermore, variables were entered into the model using the backward elimination technique. All tests were conducted using Stata 14.2 (StataCorp, College Station, TX) and SPSS 16 software at a significance level of 5%.
A total of 1,198 questionnaires were completed and returned by the participants by 21/11/2021. A few cases (amounting to 32) were not usable due to living outside of Fars's province. The remaining 1,166 questionnaires were analyzed.
The sociodemographic and clinical characteristics of 1,166 participants are shown in Table 1. The mean age of participants was 33.3 (SD:10.2). More than half of the participants were women (55.6%), married (67.6%), urbanites (82.8%), and highly educated (65.2%). The mean± SD for the EQ-5D-3L Index and EQ-VAS were 0.80 ± 0.016 and 77.53 ± 21.29, respectively (Table 1).
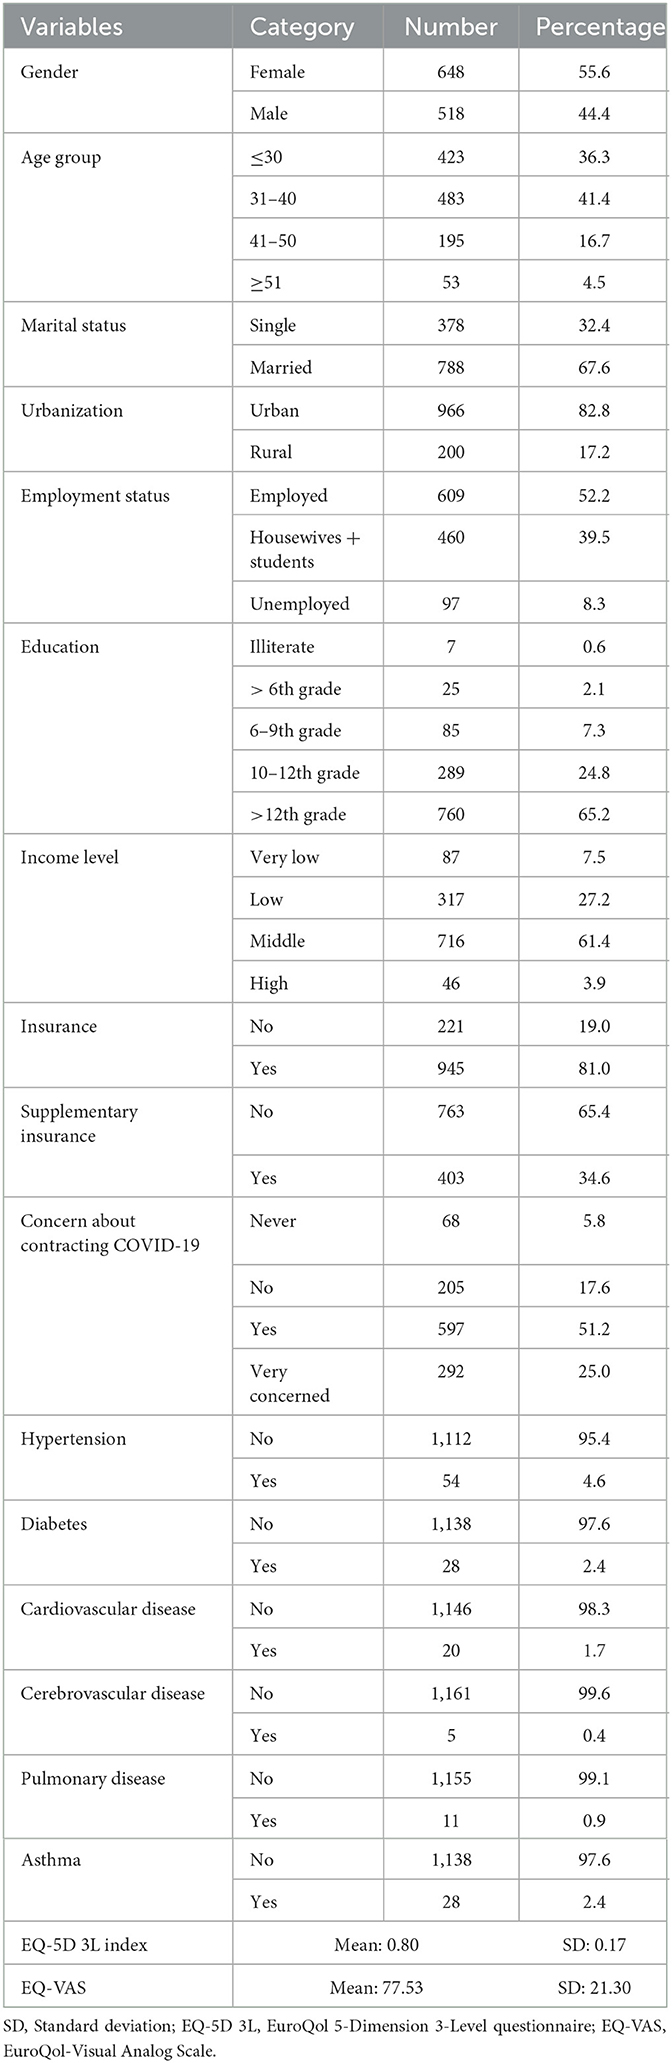
Table 1. Demographic characteristics.
The results of the differences in EQ-5D-3L index values for each factor are presented in Table 2. The parametric tests demonstrated that the differences in EQ-5D-3L index values were statistically significant (P < 0.001) for education, occupation, income, worry about COVID-19, hypertension, asthma, cerebrovascular disease, and pulmonary disease. The results also showed that the mean EQ-5D-3L value was significantly lower in participants with a lower level of income (0.69 ± 0.20) vs. those with a higher level of income (0.82 ± 0.21), in the illiterate (0.65 ± 0.25) vs. those with higher levels of education (0.81 ± 0.15), in unemployed participants (0.75 ± 0.18) vs. those in employment (0.82 ± 0.15). The mean EQ-5D-3L value was also lower in participants who were worried about COVID-19 (0.74 ± 0.18) vs. those who never worried about COVID-19 (0.82 ± 0.17), those with hypertension (0.72 ± 0.19) vs. those without (0.80 ± 0.16), in respondents diagnosed with a cerebrovascular disease (0.66 ± 0.08) vs. those without (0.80 ± 0.16), in those with pulmonary disease (0.62 ± 0.13) vs. those without (0.80 ± 0.16), and in individuals with asthma (0.68 ± 0.13) vs. those without such a diagnosis (0.80 ± 0.16) (Table 2).
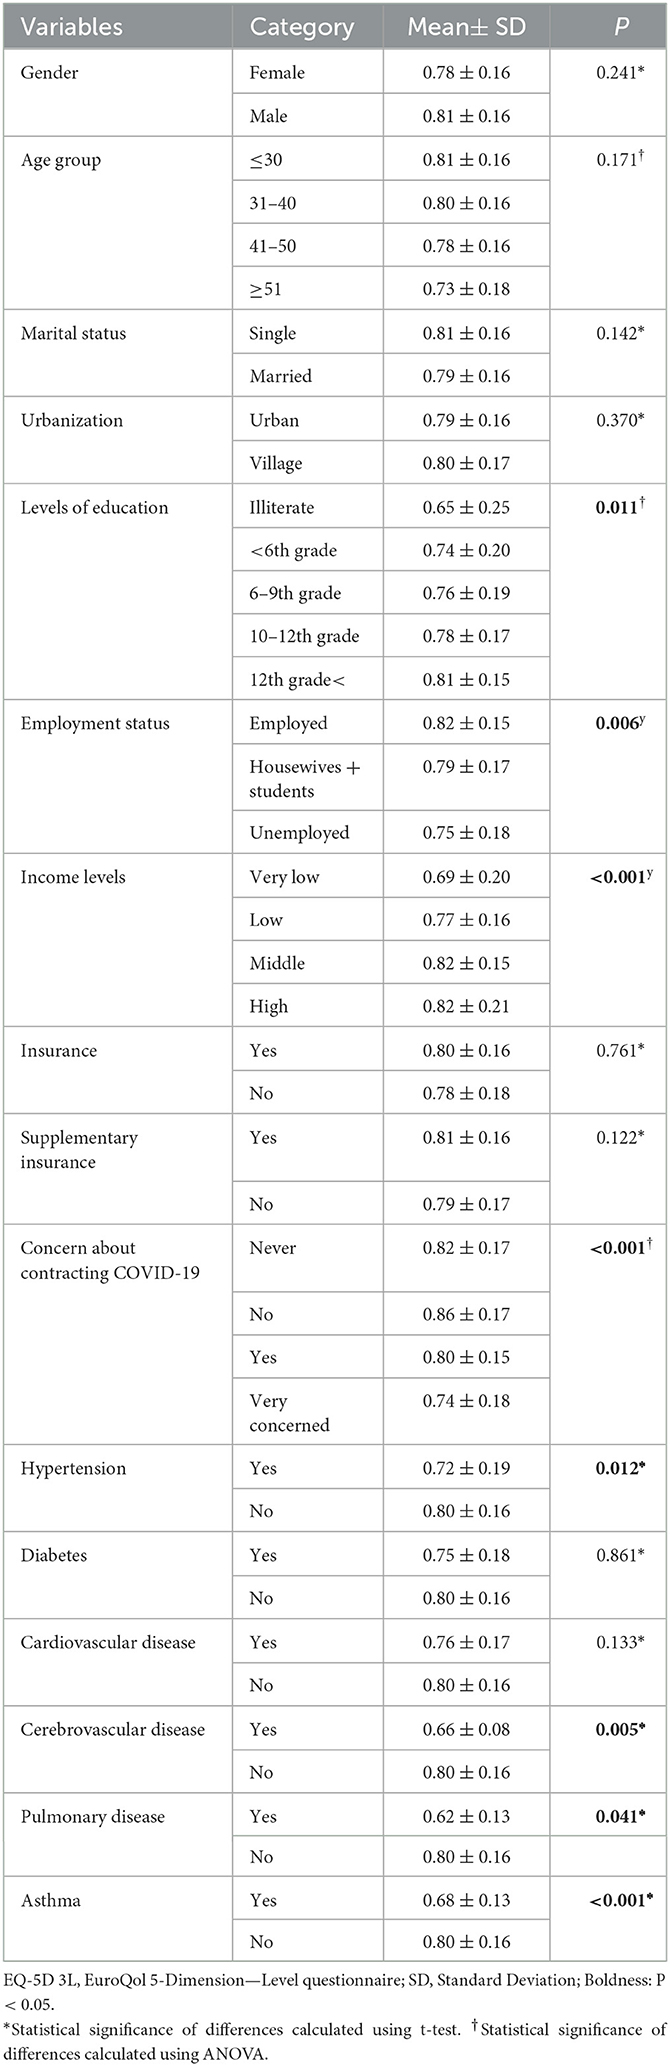
Table 2. Differences in EQ-5D-3L index values among participants.
Table 3 shows the result of the chi-square test between dimensions dichotomized (dependent variables) and qualitative variables (independent variables). Of the total respondents, 21.5, 7.2, 16, 44.2, and 53.7% reported problems in the dimensions of MO, SC, UA, P/D, and A/D, respectively. People over the age of 51 and married reported significantly more problems on the MO dimension (P < 0.05). Illiterate people and those without supplementary insurance reported the most problems on the SC dimension (P < 0.05). Male respondents, people over the age of 51, unemployed individuals, and those with hypertension reported the most problems in the UA dimension (P < 0.05). Female respondents, people with < 6 years of schooling, unemployed individuals, people without health insurance, and those with hypertension and asthma reported the most problems on the P/D dimension (P < 0.05). Female interviewees, unemployed people, those without health insurance, individuals with supplementary insurance, and subjects with hypertension and asthma reported the most problems on the A/D dimension (P < 0.05). People with very low incomes reported the most problems across all dimensions (P < 0.05). Subjects who were very concerned about getting COVID-19 reported the most problems across all dimensions except the A/D dimension (P < 0.05). Moreover, people with a pulmonary disease diagnosis reported the most problems across all dimensions except the MO dimension (P < 0.05) (Table 3).
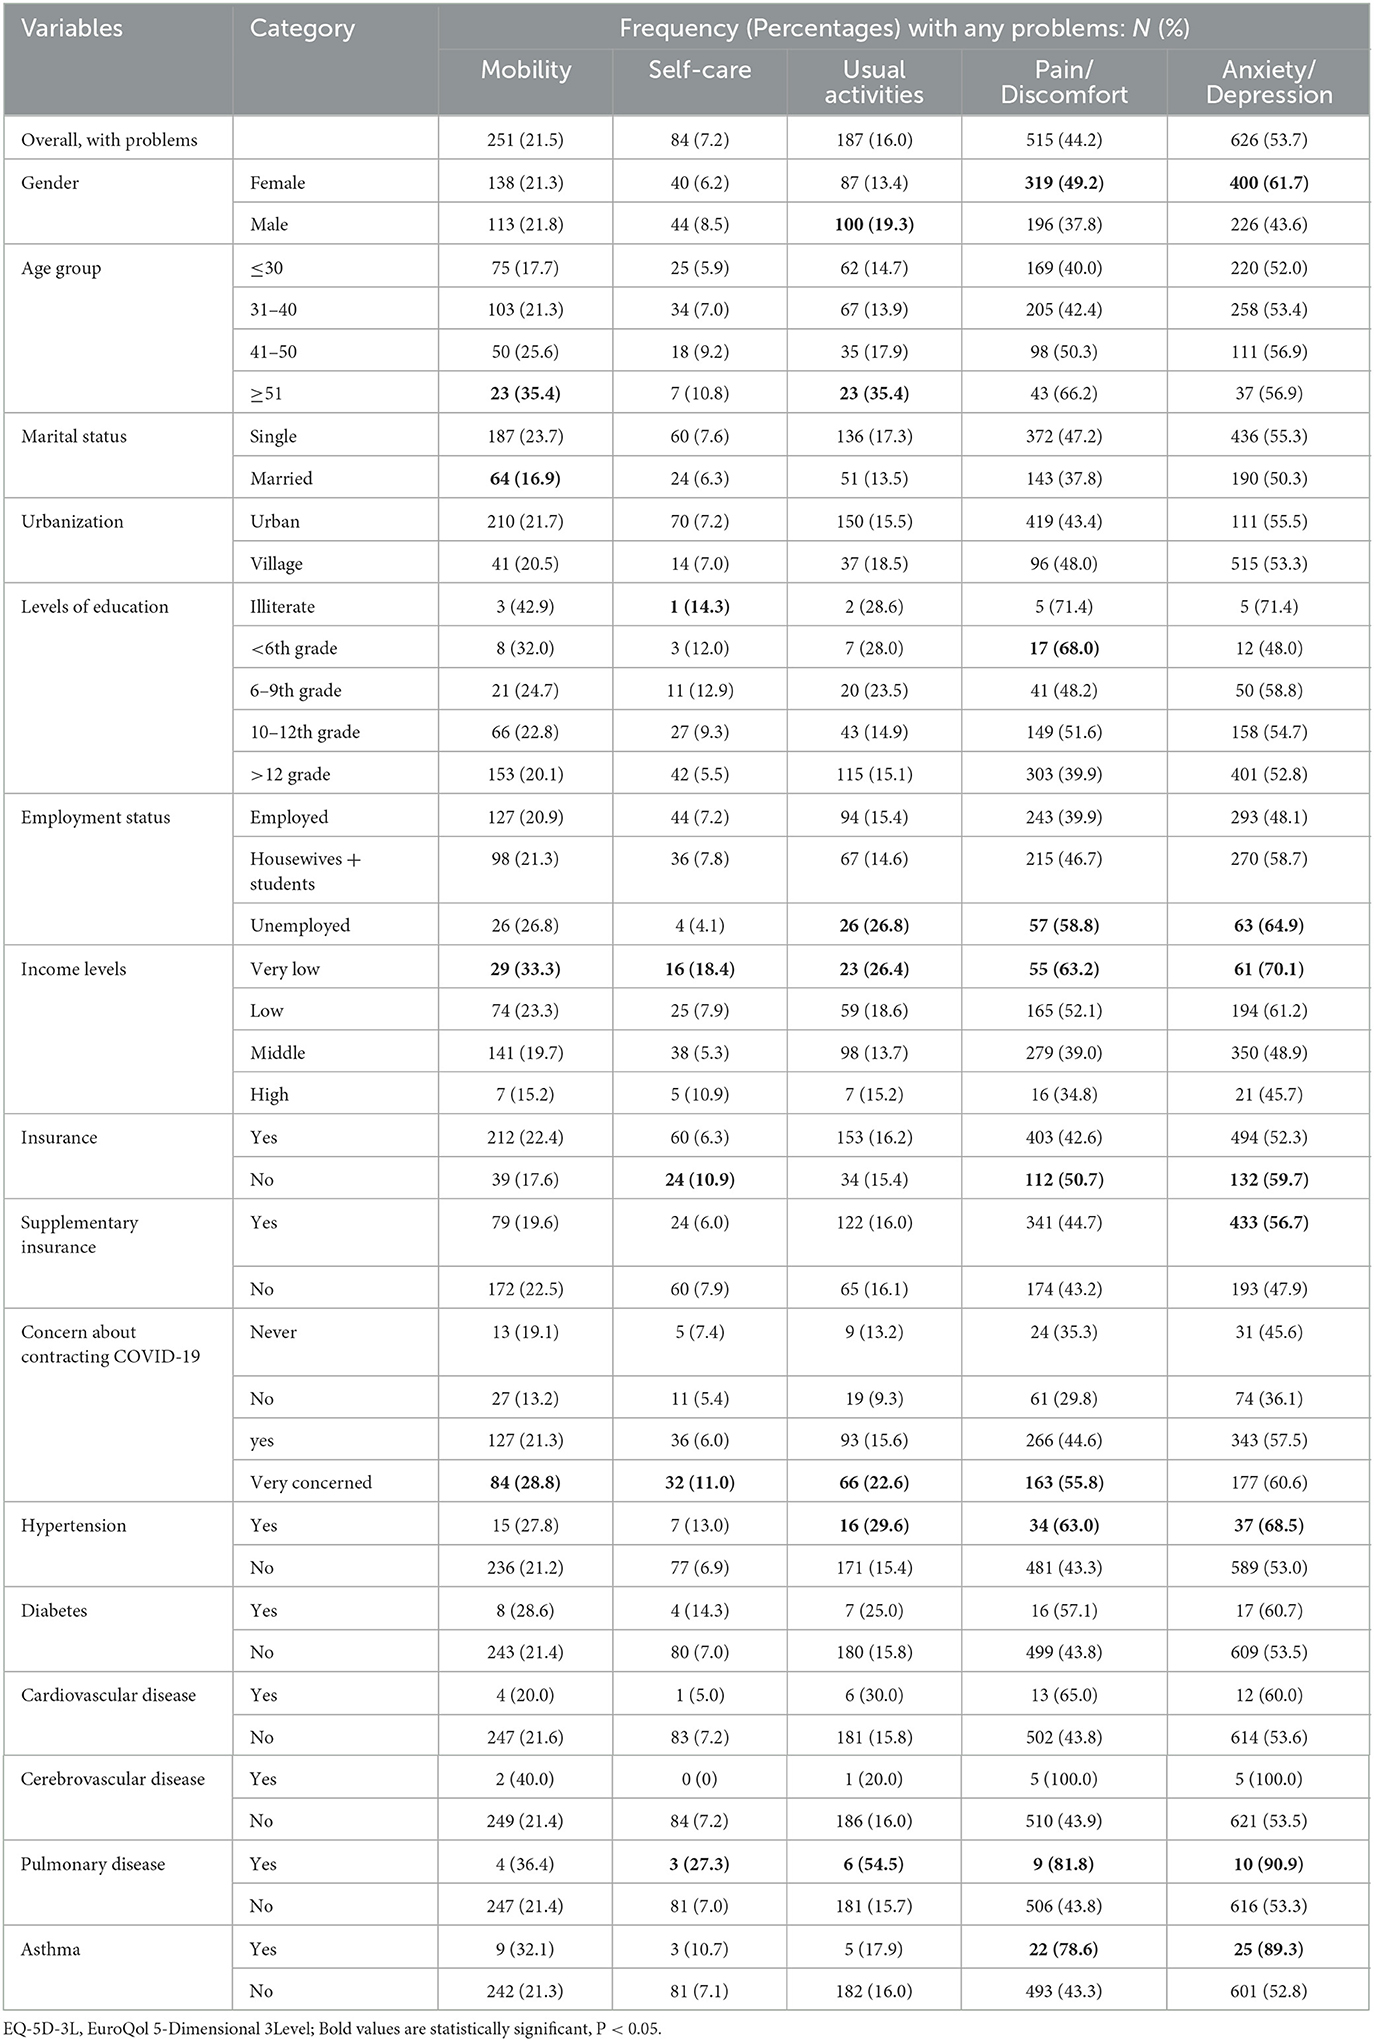
Table 3. Results of the chi-square test for the EQ-5D-3L dimensions and qualitative variables.
Multiple logistic regression models were conducted to evaluate the relationships between the significant variables obtained from Table 3 (i.e., gender, age, employment status, income level, insurance coverage, concern about getting COVID-19, hypertension, and asthma) and EQ-5D-3L dimensions. As presented in Table 4, male respondents had higher odds of 73% (OR = 1.73; P = 0.03) to report a problem on the UA dimension compared to the female subjects (reference group), while they reported significantly fewer problems on the A/D dimension by 54% (OR = 0.46; P = 0.04). Compared to the age group of 50 years and over (reference group), the age group ≤ 30 reported a lower percentage of problems on the dimensions of MO= 64% (OR = 0.36; P = 0.01), SC= 69% (OR = 0.31; P = 0.03), UA= 66% (OR = 0.34; P = 0.01), and P/D= 69% (OR = 0.31; P = 0.01). The odds of reporting problems on the SC dimension increased by 2.56 (OR = 2.56; P = 0.02) and 3.1 (OR = 3.1; P = 0.01) times, respectively, for those in employment and housewives + students, while being employed and housewives + students significantly decreased the odds of reporting problems on the A/D dimension by 41% (OR = 0.59; P = 0.03) and 38% (OR = 0.62; P = 0.02), respectively, compared to the unemployed (reference group). In comparison with high-income people (reference group), those with very low income, low income, and middle income significantly increased the odds of a problem on the MO dimension by 2.78 times (OR = 2.78; P = 0.01), 72% (OR = 1.72; P = 0.02), and 39% (OR = 1.39; P = 0.02), respectively. Moreover, the odds of problems on the SC dimension among people with supplementary insurance were lower by 83% (OR = 0.17; P = 0.04), while the odds of reporting risk on the A/D dimension were higher by 35% (OR = 1.35; P = 0.03). Additionally, people who were not worried about getting COVID-19 had significantly lower odds in MO=60% (OR = 0.40; P = 0.01), UA= 68% (OR = 0.32; P = 0.01), P/D= 65% (OR = 0.35; P = 0.01), and A/D= 58% (OR = 0.42; P = 0.02). Moreover, the odds of reporting problems on the A/D dimension increased significantly by 83% and 6.52 times, respectively, in subjects with hypertension (OR = 1.83; P = 0.02) and asthma (OR = 6.52; P = 0.01).
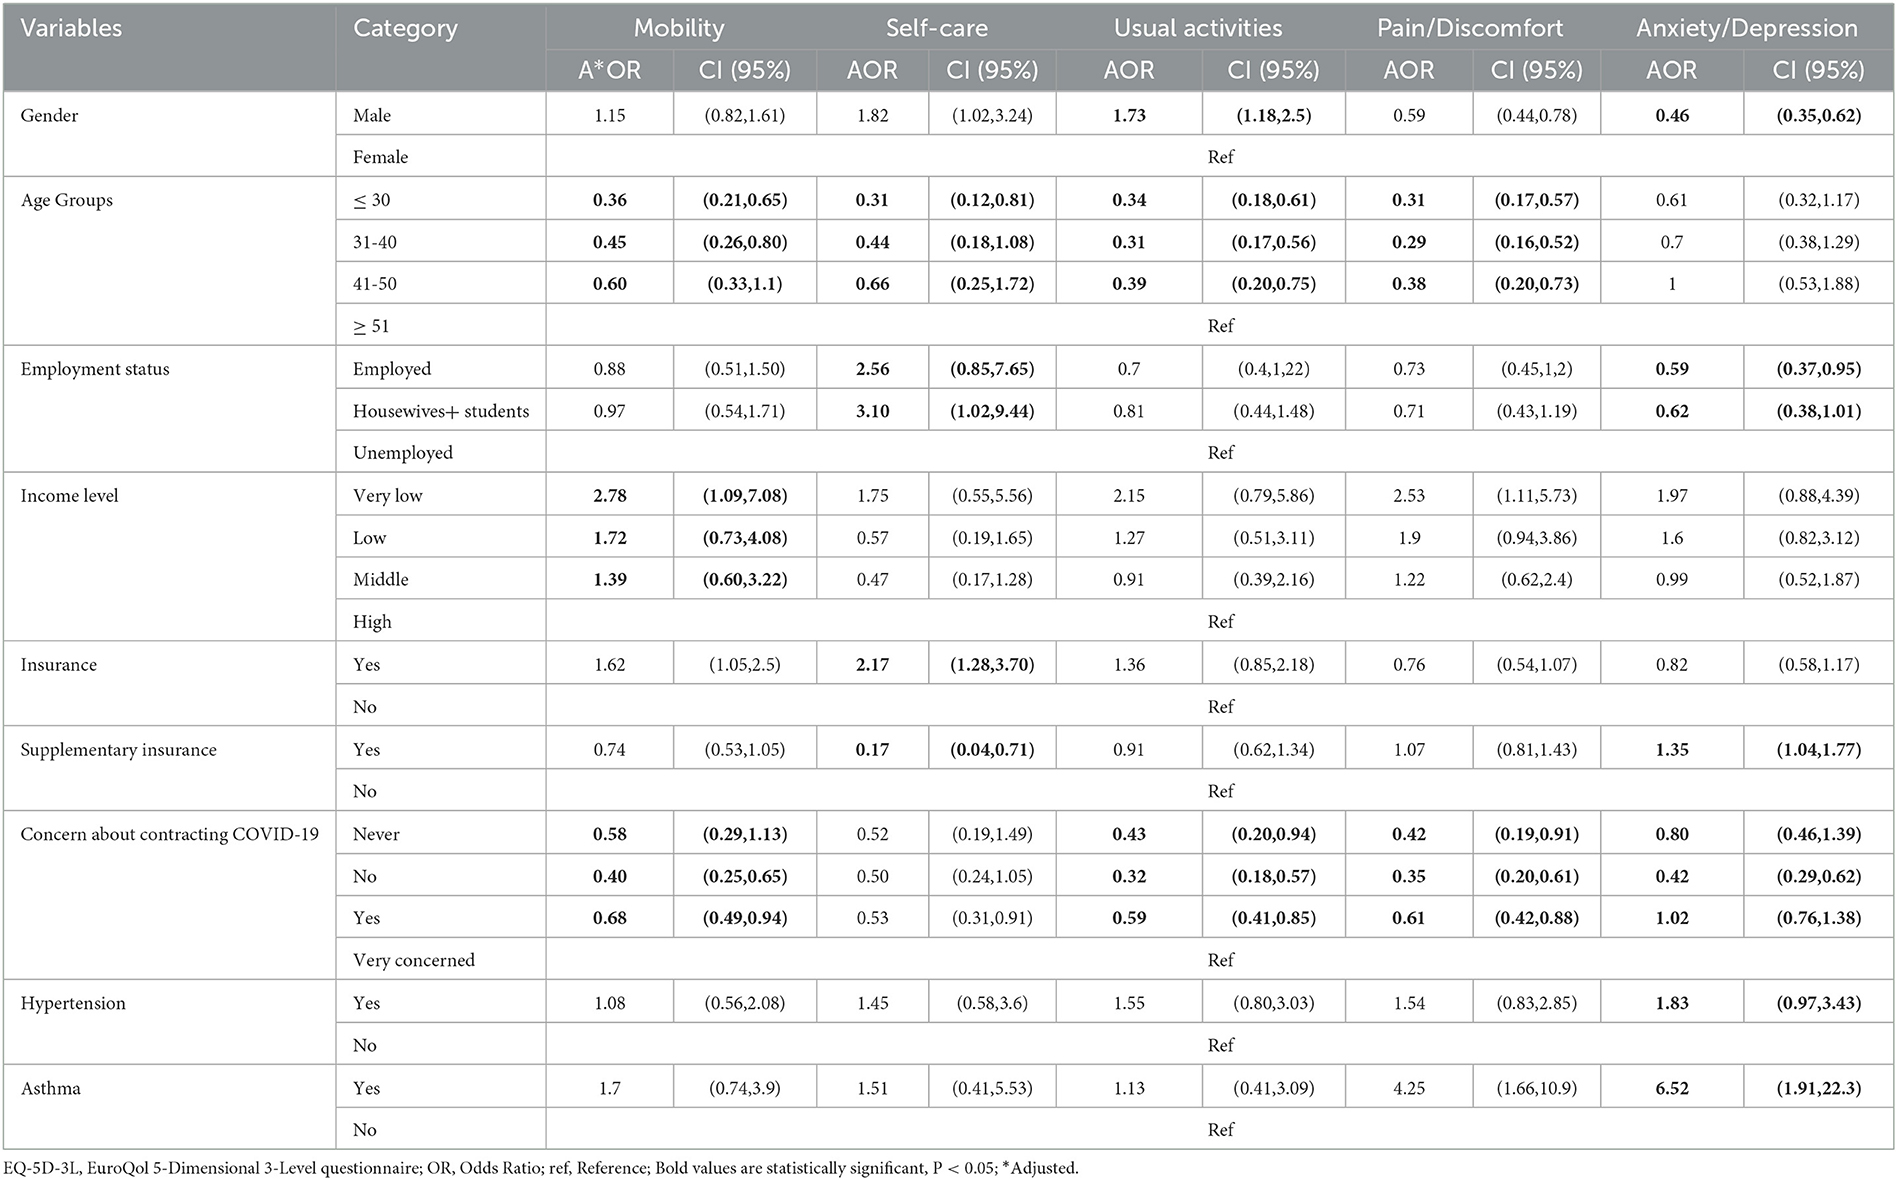
Table 4. Results of multiple logistic regression for the EQ-5D-3L dimensions and qualitative variables.
Participants' mean EQ-5D index and EQ-VAS scores were 0.80 and 77.53, respectively. Before the COVID-19 pandemic, two studies conducted on the general populations of Iran (based on a crosswalk methodology) (29) and South Australia (30) reported EQ-5D index scores of 0.79 and 0.91 and EQ-VAS scores of 71.7 and 78.5, respectively. Moreover, the mean EQ-5D index and EQ-VAS scores in studies conducted during the COVID-19 pandemic in China and Vietnam were 0.94 (85.5), and 0.95 (88.3), respectively (19, 22), which were higher than our results. Other studies in Portugal, Germany, Poland, Uruguay, and Italy before the COVID-19 pandemic reported scores of 0.86, 0.92, 0.89, 0.95, and 0.92, respectively (21, 31–34). It should be noted that we used the EQ-5D-3L value sets for Iran, and the EQ-5D value sets of each country are different. This issue may explain the difference between the results of the above studies and our research. Furthermore, the floor effect for the EQ-5D-3L in the Iranian study was lower than in other countries. Demographic characteristics such as female gender, older age, having a lower level of education, and having a lower income can justify the low HRQoL score in our study compared to the above studies.
According to our findings, higher utility scores were associated with a higher level of education. Previous research (28, 35–38) supported this result, while some studies demonstrated an inverse relation (19, 22). People with better education are more likely to have access to a healthy and clean environment, information and skills, and more financial resources.
Moreover, as in past studies (21, 36), employed subjects had significantly higher EQ-5D index values. However, other studies contradicted our results (19, 22). The COVID-19 pandemic has adversely affected the economy, and many people have lost their jobs as a result of their inability to obtain a minimum wage to support their families (39). The fear of economic loss has increased stress and caused psychological problems among people worldwide (39).
Similarly, income level was found to have a significantly positive relationship with HRQoL. It is evident that higher-income respondents are less concerned about living costs; therefore, they are expected to have higher utility scores. Despite our results, other studies conducted in the same COVID-19 period did not report a significant relationship between income level and utility scores (19, 22).
Consistent with our study, another research paper found a significant inverse correlation between the level of concern about contracting COVID-19 and utility scores (19). Fear of exposure to COVID-19, mental fatigue, insufficient information, financial damage, ambiguity in the disease's condition, and uncertainty about when the disease will end all cause stress and anxiety and affect the HRQoL of people during the pandemic.
Furthermore, in line with previous studies (19, 40, 41), there was a significant negative relationship between utility scores and hypertension, cerebrovascular disease, pulmonary disease, and asthma. The risk of severe COVID-19 increases among people with underlying medical conditions; this factor may make these people vulnerable and reduce their utility (42).
According to the findings, a large percentage of participants (44.2 and 53.7%) reported problems on the P/D and A/D dimensions, respectively. Before the COVID-19 crisis and using the same tool in the general population of Iran, these findings were confirmed by Goudarzi et al. (18). Similarly, several studies reported that the majority of complaints were on the P/D and A/D dimensions (19, 21, 28), while Saarni et al. (43) and König et al. (44) found the most issues on the P/D and MO dimensions.
Multiple logistic regression revealed that higher age groups, lower income levels, and concern about getting COVID-19 increased the likelihood of reporting problems on the MO dimension significantly. Ping et al. reported similar results, only about the impact of age (19), while a study on Palestinians found no significant relationship between the chance of reporting a problem on the MO dimension and demographic characteristics (45).
Regression analysis also indicated that the likelihood of reporting a problem on the SC dimension was considerably associated with age, employment, and insurance. Similar results for the impact of employment were reported by Ping et al. (19) in China. Hamdan et al. also reported a significant association between the probability of reporting a problem in SC and age (45).
Additionally, we found that the probability of reporting a problem on the UA dimension increased significantly with being a male individual, aging, and concerned about getting COVID-19. Hamdan et al. discovered that participants with a college education were significantly less likely to report problems in the UA than those with a high school education (45). A study conducted in India found a significant relationship between gender and place of residence and the likelihood of reporting problems on the UA dimension (46).
Similar to the study in China (19), this research showed that the odds of reporting a problem on the P/D dimension increased significantly with age and concern about getting COVID-19. Furthermore, our results showed that the probability of reporting a problem on the A/D dimension was significantly higher in female interviewees, in the unemployed, in participants with supplementary insurance, in people who were worried about getting COVID-19, and in those with hypertension and asthma.
The findings of this study can be used to identify the unmet health needs of the population, recognize inequalities and determinants of population health, help policymakers and health planners make informed decisions and develop healthcare programs, and can also be used to evaluate public health programs and ensure that the population benefits from these programs.
This is the first study in Iran to analyze HRQoL and its predictors among the general population during the COVID-19 pandemic. Having a sufficient sample size was another strength of the current study. Despite these advantages, our study has some limitations. To begin with, data collection via an online questionnaire (web survey) may be subject to selection bias some people such as the illiterate, the elderly, and those with low socioeconomic status. Thus, the first limitation is associated with its generalizability to the whole Iranian community. Secondly, the convenience sampling method has been used in this research, which cannot be fully representative of the population because the samples are not selected at random. Also, cross-sectional studies cannot demonstrate a causal relationship. Furthermore, EQ-5D-3L has higher ceiling effects than EQ-5D-5L. Therefore, the results of this study should be interpreted with caution. In addition to the above, the use of the OR is a limitation because it tends to overestimate the measure of association when compared to the use of the prevalence ratio. Finally, worry about getting COVID-19 was assessed by one question in this study, whereas standard instruments to measure such psychological distress have been developed by Ahorsu et al. (47) and Taylor et al. (48). As a result, it is necessary to use a valid and standardized instrument to assess the impact of COVID-19 on mental health in future studies.
This study provides crucial insights into HRQoL and its influencing factors among the Iranian general population during the COVID-19 pandemic, which will be useful to policymakers. Indeed, accurate knowledge of community health helps planners and policymakers in their decision-making. The risk of P/D increased significantly among people who were aging and concerned about contracting COVID-19. The risk of A/D also increased significantly among men, in addition to those participants with hypertension and asthma, those who were unemployed, those with insurance, and those who were concerned about getting COVID-19. In all age groups, more than half of the participants are affected by A/D. Therefore, during pandemics, the mental health of people, especially those with chronic diseases, should be considered. The implementation of psychological counseling programs and medical interventions is needed to improve population health.
The raw data supporting the conclusions of this article will be made available by the authors, without undue reservation.
The studies involving human participants were reviewed and approved by the Committee of Ethics of the Tehran University of Medical Sciences IR.TUMS.MEDICINE.REC.1399.434. The patients/participants provided their written informed consent to participate in this study.
MSS, SE, AAS, and HK contributed to the design and conception of the study. MSS and HK organized and prepared data file, wrote the first draft of the manuscript, co-supervised the research, and data acquisition. MSS, MT, HK, and HA performed statistical analysis. MSS, HK, HA, and SA wrote the sections of manuscript. SE and AAS supervised the study. SE, AAS, and HA commented on the manuscript. All authors contributed in manuscript revision, proofread, and approved the submitted version.
The authors would like to thank the participants who took part in the study and enabled this research.
The authors declare that the research was conducted in the absence of any commercial or financial relationships that could be construed as a potential conflict of interest.
All claims expressed in this article are solely those of the authors and do not necessarily represent those of their affiliated organizations, or those of the publisher, the editors and the reviewers. Any product that may be evaluated in this article, or claim that may be made by its manufacturer, is not guaranteed or endorsed by the publisher.
1. World Health Organization (WHO). Coronavirus Disease (COVID-19) Dashboard. Bangladesh Physiotherapy Journal (2020) 10. Geneva, Switzerland: World Health Organization
2. Shiraz University of Medical Sciences. Available online at: https://www.sums.ac.ir/page-newsarchive/fa/0/dorsaetoolsenews/54635-G0/ (accessed on January 31, 2022).
3. Pan A, Liu L, Wang C, Guo H, Hao X, Wang Q, et al. Association of Public Health Interventions With the Epidemiology of the COVID-19 Outbreak in Wuhan, China. JAMA. (2020) 323:1915–23. doi: 10.1001/jama.2020.6130
4. Tian H, Liu Y, Li Y, Wu CH, Chen B, Kraemer MUG Li B, et al. An investigation of transmission control measures during the first 50 days of the COVID-19 epidemic in China. Science. (2020) 368:638–42. doi: 10.1126/science.abb6105
5. Flaxman S, Mishra S, Gandy A, Unwin HJT, Mellan TA, Coupland H, et al. Estimating the effects of non-pharmaceutical interventions on COVID-19 in Europe. Nature. (2020) 584:257–61. doi: 10.1038/s41586-020-2405-7
6. Prague M, Wittkop L, Collin A, Dutartre D, Clairon Q, Moireau P, Thiébaut R, P. Hejblum B. Multi-level modeling of early COVID-19 epidemic dynamics in French regions and estimation of the lockdown impact on infection rate. medRxiv. (2020) 20073536. doi: 10.1101/2020.04.21.20073536
7. Oliveira GLAd, Lima L, Silva I, Ribeiro-Dantas MdC, Monteiro KH, Endo PT. Evaluating Social Distancing Measures and Their Association with the Covid-19 Pandemic in South America. ISPRS Int J Geo-Inf . (2021) 10:121. doi: 10.3390/ijgi10030121
8. Pei S, Kandula S, Shaman J. Differential effects of intervention timing on COVID-19 spread in the United States. Sci Adv. (2020) 6:eabd6370. doi: 10.1126/sciadv.abd6370
9. Farahati M. Psychological consequences of the outbreak of coronavirus in society. Social Impact Assessment. (2020) 1:207–25.
10. Liu N, Zhang F, Wei C, Jia Y, Shang Z, Sun L, et al. Prevalence and predictors of PTSS during COVID-19 outbreak in China hardest-hit areas: Gender differences matter. Psychiatry Res. (2020) 287:112921. doi: 10.1016/j.psychres.2020.112921
11. The WHOQOL. Group. World Health Organization Quality of Life Assessment (WHOQOL): development and general psychometric properties. Soc Sci Med. (1998) 46:1569–85. doi: 10.1016/S0277-9536(98)00009-4
12. Mirzaei N, Jahanian Sadatmahalleh S, Bahri Khomami M, Moini A, Kazemnejad A. Sexual function, mental health, and quality of life understrain of COVID-19 pandemic in Iranian pregnant and lactating women: a comparative cross-sectional study. Health Qual Life Outcomes. (2021) 19:66. doi: 10.1186/s12955-021-01720-0
13. Ameri H, Yousefi M, Yaseri M, Nahvijou A, Arab M, Akbari Sari A. Mapping the cancer-specific QLQ-C30 onto the generic EQ-5D-5L and SF-6D in colorectal cancer patients. Expert Rev Pharmacoecon Outcomes Res. (2019) 19:89–96. doi: 10.1080/14737167.2018.1517046
14. Testa MA, Simonson DC. Assessment of quality-of-life outcomes. N Engl J M. (1996) 334:835–40. doi: 10.1056/NEJM199603283341306
15. Purba FD, Hunfeld JAM, Iskandarsyah A, Fitriana TS, Sadarjoen SS, Ramos-Goñi JM, et al. The Indonesian EQ-5D-5L value set. Pharmacoeconomics. (2017) 35:1153–65. doi: 10.1007/s40273-017-0538-9
16. Prosser LA, Hammitt JK, Keren R. Measuring health preferences for use in cost-utility and cost-benefit analyses of interventions in children. Pharmacoeconomics. (2007) 25:713–26. doi: 10.2165/00019053-200725090-00001
17. National Institute for Health and Care Excellence (NICE). Process and Methods Guides. Guide to the Methods of Technology Appraisal 2013. London: NICE (2013).
18. Goudarzi R, Sari AA, Zeraati H, Rashidian A, Mohammad K, Amini S. Valuation of quality weights for EuroQol 5-dimensional health states with the time trade-off method in the capital of Iran. Value Health Reg Issues. (2019) 18:170–5. doi: 10.1016/j.vhri.2019.01.007
19. Ping W, Zheng J, Niu X, Guo C, Zhang J, Yang H, Shi Y. Evaluation of health–related quality of life using EQ-5D in China during the COVID-19 pandemic. PLoS ONE. (2020) 15:e0234850-e doi: 10.1371/journal.pone.0234850
20. Tamson M, Reile R, Sokurova D, Innos K, Nurk E, Laidra K, et al. Health–related quality of life and its socio-demographic and behavioural correlates during the COVID-19 pandemic in Estonia. Int J Environ Res Public Health. (2022) 19:9060. doi: 10.3390/ijerph19159060
21. Ferreira LN, Pereira LN, da Fé Brás M, Ilchuk K. Quality of life under the COVID-19 quarantine. Qual Life Res. (2021) 30:1389–405. doi: 10.1007/s11136-020-02724-x
22. Vu MQ, Tran TTP, Hoang TA, Khuong LQ, Hoang MV. Health–related quality of life of the Vietnamese during the COVID-19 pandemic. PLoS ONE. (2020) 15:e0244170-e. doi: 10.1371/journal.pone.0244170
23. Mohsen S, El-Masry R, Ali OF, Abdel-Hady D. Quality of life during COVID-19 pandemic: a community-based study in Dakahlia governorate, Egypt. Glob Health Res Policy. (2022) 7:1–9. doi: 10.1186/s41256-022-00246-2
24. Algahtani FD. Hassan S-u-N, Alsaif B, Zrieq R. Assessment of the quality of life during COVID-19 pandemic: a cross-sectional survey from the Kingdom of Saudi Arabia. Int J Environ Res Public Health. (2021) 18:847. doi: 10.3390/ijerph18030847
25. Statistics Center of Iran (SCI). Statistics Center of Iran, Population and Housing Censuses (2021). Available online at: https://www.amar.org.ir/english/Population-and-Housing-Censuses (accessed on March 20, 2021).
26. EuroQol - a new facility for the measurement of health–related quality of life. Health Policy. (1990) 16:199–208. doi: 10.1016/0168-8510(90)90421-9
27. Moradi N, Poder TG, Safari H, Mojahedian MM, Ameri H. Psychometric properties of the EQ-5D-5L compared with EQ-5D-3L in cancer patients in Iran. Front Oncol. (2022) 12:1052155. doi: 10.3389/fonc.2022.1052155
28. Zare F, Ameri H, Madadizadeh F, Aghaei MR. Validity and reliability of the EQ-5D-3L (a generic preference-based instrument used for calculating quality-adjusted life -years) for patients with type 2 diabetes in Iran. Diabetes Metab Syndr Clin Res Rev. (2021) 15:319–24. doi: 10.1016/j.dsx.2021.01.009
29. Emrani Z, Akbari Sari A, Zeraati H, Olyaeemanesh A, Daroudi R. Health–related quality of life measured using the EQ-5D-5 L: population norms for the capital of Iran. Health Qual Life Outcomes. (2020) 18:108. doi: 10.1186/s12955-020-01365-5
30. McCaffrey N, Kaambwa B, Currow DC, Ratcliffe J. Health–related quality of life measured using the EQ-5D-5L: South Australian population norms. Health Qual Life Outcomes. (2016) 14:133. doi: 10.1186/s12955-016-0537-0
31. Hinz A, Kohlmann T, Stöbel-Richter Y, Zenger M. Brähler E. The quality of life questionnaire EQ-5D-5L: psychometric properties and normative values for the general. German populationQual Life Res. (2013) 23:443–7. doi: 10.1007/s11136-013-0498-2
32. Golicki D, Niewada M. EQ-5D-5L Polish population norms. Arch Med Sci. (2017) 13:191–200. doi: 10.5114/aoms.2015.52126
33. Augustovski F, Rey-Ares L, Irazola V, Garay OU, Gianneo O, Fernández G, et al. An EQ-5D-5L value set based on Uruguayan population preferences. Qual Life Res. (2016) 25:323–33. doi: 10.1007/s11136-015-1086-4
34. Scalone L, Cortesi PA, Mantovani LG, Ciampichini R, Cesana G. Reference Eq-5d-3l and Eq-5d-5l Data From the Italian General Population. Value Health. (2014) 17:A514–A5. doi: 10.1016/j.jval.2014.08.1591
35. Arab-Zozani M, Hashemi F, Safari H, Yousefi M, Ameri H. Health–related quality of life and its associated factors in COVID-19 patients. Osong Public Health Res Perspect. (2020) 11:296–302. doi: 10.24171/j.phrp.2020.11.5.05
36. Epifanio MS, Andrei F, Mancini G, Agostini F, Piombo MA, Spicuzza V, et al. The impact of COVID-19 pandemic and lockdown measures on quality of life among Italian general population. J Clin Med. (2021) 10:289. doi: 10.3390/jcm10020289
37. Karami H, Shirvani Shiri M, Rezapour A, Sarvari Mehrabadi R, Afshari S. The association between diabetic complications and health–related quality of life in patients with type 2 diabetes: A cross-sectional study from Iran. Qual Life Res. (2021) 30:1963–74. doi: 10.1007/s11136-021-02792-7
38. Zare F, Ameri H, Madadizadeh F, Reza Aghaei M. Health–related quality of life and its associated factors in patients with type 2 diabetes mellitus. SAGE Open Med. (2020) 8:2050312120965314. doi: 10.1177/2050312120965314
39. Yoosefi Lebni J, Abbas J, Moradi F, Salahshoor MR, Chaboksavar F, Irandoost SF, et al. How the COVID-19 pandemic effected economic, social, political, and cultural factors: A lesson from Iran. Int J Soc Psychiatry. (2021) 67:298–300. doi: 10.1177/0020764020939984
40. Fujikawa A, Suzue T, Jitsunari F, Hirao T. Evaluation of health–related quality of life using EQ-5D in Takamatsu, Japan. Environ Health Prev Med. (2011) 16:25–35. doi: 10.1007/s12199-010-0162-1
41. Yang Z, Busschbach J, Liu G, Luo N. EQ-5D-5L norms for the urban Chinese population in China. Health Qual Life Outcomes. (2018) 16:210. doi: 10.1186/s12955-018-1036-2
42. Horesh D, Kapel Lev-Ari R, Hasson-Ohayon I. Risk factors for psychological distress during the COVID-19 pandemic in Israel: Loneliness, age, gender, and health status play an important role. Br J Health Psychol. (2020) 25:925–33. doi: 10.1111/bjhp.12455
43. Saarni SI, Härkänen T, Sintonen H, Suvisaari J, Koskinen S, Aromaa A, et al. The impact of 29 chronic conditions on health–related quality of life: a general population survey in Finland using 15D and EQ-5D. Qual Life Res. (2006) 15:1403–14. doi: 10.1007/s11136-006-0020-1
44. König HH, Bernert S, Angermeyer MC, Matschinger H, Martinez M, Vilagut G, et al. Comparison of population health status in six European Countries. Med Care. (2009) 47:255–61. doi: 10.1097/MLR.0b013e318184759e
45. Hamdan A, Ghanim M, Mosleh R. COVID-19 confinement and related well being measurement using the EQ-5D questionnaire: A survey among the Palestinian population. Int J Clin Pract. (2021) 75:e14621-e. doi: 10.1111/ijcp.14621
46. Barani S, Bhatnagar T, Natarajan M, Gayathri K, Sonekar HB, Sasidharan A, et al. Health–related quality of life among COVID-19 individuals: a cross-sectional study in Tamil Nadu, India. Clin Epidemiol Glob Health. (2022) 13:100943. doi: 10.1016/j.cegh.2021.100943
47. Ahorsu DK, Lin C-Y, Imani V, Saffari M, Griffiths MD, Pakpour AH. The fear of COVID-19 scale: development and initial validation. Int J Ment Health Addict. (2022) 20:1537–45. doi: 10.1007/s11469-020-00270-8
Keywords: health–related quality of life, COVID-19, socioeconomic factors, regression analysis, pandemic, Iran
Citation: Shirvani Shiri M, Karami H, Ameri H, Akbari Sari A, Tatari M, Emamgholipour S and Afshari S (2023) The influencing factors of health–related quality of life of the general population of Iran during the COVID-19 Pandemic. Front. Med. 10:1049642. doi: 10.3389/fmed.2023.1049642
Received: 20 September 2022; Accepted: 30 January 2023;
Published: 16 February 2023.
Edited by:
Ana Afonso, NOVA University of Lisbon, PortugalReviewed by:
Mohsen Saffari, Baqiyatallah University of Medical Sciences, IranCopyright © 2023 Shirvani Shiri, Karami, Ameri, Akbari Sari, Tatari, Emamgholipour and Afshari. This is an open-access article distributed under the terms of the Creative Commons Attribution License (CC BY). The use, distribution or reproduction in other forums is permitted, provided the original author(s) and the copyright owner(s) are credited and that the original publication in this journal is cited, in accordance with accepted academic practice. No use, distribution or reproduction is permitted which does not comply with these terms.
*Correspondence: Sara Emamgholipour,  cy1lbWFtZ2hvbGlwb3VyQHR1bXMuYWMuaXI=
Disclaimer: All claims expressed in this article are solely those of the authors and do not necessarily represent those of their affiliated organizations, or those of the publisher, the editors and the reviewers. Any product that may be evaluated in this article or claim that may be made by its manufacturer is not guaranteed or endorsed by the publisher.
Research integrity at Frontiers
Learn more about the work of our research integrity team to safeguard the quality of each article we publish.