
94% of researchers rate our articles as excellent or good
Learn more about the work of our research integrity team to safeguard the quality of each article we publish.
Find out more
ORIGINAL RESEARCH article
Front. Med., 08 November 2022
Sec. Hepatology
Volume 9 - 2022 | https://doi.org/10.3389/fmed.2022.960235
This article is part of the Research TopicEditors' Showcase: HepatologyView all 10 articles
Primary hepatic neuroendocrine tumor (PHNET) is rare liver cancer and related prognostic factors are unclear. The aim of this study was to analyze the prognostic risk factors of patients with PHNETs and establish an assessment model for prognosis. The clinical information of 539 patients with PHNETs who met the criteria for inclusion was extracted from the Surveillance, Epidemiology, and End Results (SEER) database. These patients were randomly assigned to the training (269 cases) and validation sets (270 cases). Prognostic factors in patients with PHNETs were screened using the Cox proportional regression model and Fine–Gray competing risk model. Based on the training set analysis using the Fine–Gray competing risk model, a nomogram was constructed to predict cumulative probabilities for PHNET-specific death. The performance of the nomogram was measured by using receiver operating characteristic curves, the concordance index (C-index), calibration curves, and decision curve analysis (DCA). No differences in clinical baseline characteristics between the training and validation sets were observed, and the Fine–Gray analysis showed that surgery and more than one primary malignancy were associated with a low cumulative probability of PHNET-specific death. The training set nomograms were well-calibrated and had good discriminative ability, and good agreement between predicted and observed survival was observed. Patients with PHNETs with a high-risk score had a significantly increased risk of PHNET-specific death and non-PHNET death. Surgical treatment and the number of primary malignancies were found to be independent protective factors for PHNETs. The competing risk nomogram has high accuracy in predicting disease-specific survival (DSS) for patients with PHNETs, which may help clinicians to develop individualized treatment strategies.
Globally, liver cancer is one of the most common malignancies with the highest morbidity. The most common pathological type is hepatocellular carcinoma, which accounts for ~85% of liver cancer cases (1). A primary hepatic neuroendocrine tumor (PHNET) is a relatively rare pathological subtype that accounts for only 0.11% of primary hepatic tumors and 0.77% of neuroendocrine tumors (NETs) (2, 3). Although the incidence of PHNETs has increased by six times more than that in 1973 (4); they are still rare and predominantly reported in case reports and case reviews (5). At present, their clinical prognosis remains unclear (6).
In the classical Cox regression model, which is commonly used in survival analysis, the end points of the survival outcomes are generally outcome events of interest and censored events (7). However, there are other outcome events that simultaneously occur in the study population, which may prevent or reduce the probability of the outcome events being of interest to the researcher. This kind of event forms a competing relationship with the outcome event of interest and is defined as a competing event. If the competing events were ignored and classical Cox regression was performed directly, the results may be biased. This may result in certain bias and false positives or negatives if the proportion of competing events is >10 or <10%, respectively. The Fine–Gray competing risk model is a more effective model for survival analysis because it allows the survival data end points to be divided into multiple categories and separates competing events from outcome events of interest, thereby eliminating the impact of competing events on prognosis (8, 9).
The current common clinical prognostic evaluation is based mainly on the American Joint Committee on Cancer staging guidelines (10) that include pathological indicators, such as depth of tumor infiltration and the number of lymph node metastases and bloodstream metastases. However, it fails to adequately consider various factors, such as age, race, Primary malignancy number, and other treatments that are considered important for survival, which limits its value and ability to guide an individualized prognosis. A nomogram model, which is based on a large amount of clinical data and uses a combination of independent prognostic factors to quantify individual survival risk, is considered valuable when evaluating patient prognosis (11). In the field of liver cancer, the factors that affect disease-specific survival (DSS) in patients with PHNETs have been analyzed (12), and a nomogram has been constructed to predict the overall survival (OS) (13). However, the use of classical Cox regression for OS analysis may overestimate the cumulative incidence.
This study intended to analyze data from the Surveillance, Epidemiology, and End Results (SEER) database, which is based on a competing risk model, to explore the prognostic factors for PHNETs and construct a nomogram model that provides a basis for individualized patient treatment.
The SEER database is an authoritative source for cancer statistics that has detailed the incidence, pathology, treatment, and prognosis of patients in some states and counties within the United States since 1973 (14). The SEER database is characterized by its large volume and relatively comprehensive clinical information. This study used SEER*Stat 8.3.9 software (National Cancer Institute, Bethesda, MD, USA) to extract case information of patients with PHNETs. This study did not require informed consent as the SEER dataset is publicly available.
Patients were included in the study if they met the following criteria: the primary tumor was located in the liver at the time of the patient's initial diagnosis; the tumor's pathological histological type was either a large cell neuroendocrine carcinoma, carcinoid tumor, enterochromaffin cell carcinoid, neuroendocrine carcinoma, atypical carcinoid tumor or adenocarcinoma with neuroendocrine differentiation; and the complete clinical, pathological, and follow-up information was available. The patients with a survival time of zero were excluded from the study. Half of the patients were randomly assigned to the training set used to develop the nomogram; the remaining patients served as the validation set.
Covariates in the study included patients' age (<55, 56–66, 67–75, or >76 years), sex, race (white, black, or other), marital status (divorced/separated, married, single/unmarried, or widowed/other), and year of diagnosis (<2003, 2004–2011, or 2012–2016); whether they underwent surgery (yes or no/unknown), radiotherapy (yes or no/unknown), or chemotherapy (yes or no/unknown); the number of regional lymph nodes (0, 1~, or unknown), histological type (carcinoid tumor, neuroendocrine carcinoma, or others), and grade (G1, G2, G3, or Gx); whether it is a primary malignancy (yes/no); the primary malignancy number (1 or 1+); months of survival; outcome (disease-specific death, 1; other death, 2; or survival, 0); and cause of death.
Disease-specific survival was defined as the duration from the date of diagnosis to death from causes of PHNETs. OS was defined as the duration from the date of diagnosis to death or the last follow-up visit, regardless of the cause of death.
R software version 4.1.1 (R Foundation for Statistical Computing, Vienna, Austria) was used for data analysis. Baseline characteristics of both the training and validation sets were compared using the χ2 test and Fisher's exact test. The effects of each variable on OS and DSS in patients with PHNET were analyzed with the univariable and multivariable Cox proportional regression models. Survival curves for each variable were plotted using the survival package in the R software based on Kaplan–Meier and log-rank tests, and forest plots were plotted using the forestplot package. PHNET-specific death and non-PHNET death were considered two competing events. The effect of each variable on DSS in patients with PHNETs was analyzed using the cmprsk package of the R language with the Fine–Gray competing risk model (8), where the probability of PHNET-specific death and probability of non-PHNET death were expressed as the cumulative incidence function (CIF). Based on the independent risk factors affecting DSS in patients with PHNETs, we used the regplot package of the R software to construct a nomogram prediction model. The performance of the model was measured using the concordance index (C-index) (15), receiver operating characteristic curve (16), calibration curve (17), and decision curve analysis (DCA) (18). Finally, we divided the training and validation sets into high-risk and low-risk groups (grouped by the median) based on the nomogram and plotted the cumulative risk curves. A p-value <0.05 was considered statistically significant.
A total of 539 patients met the inclusion criteria and were randomly divided (5:5) into the training (N = 269) and validation sets (N = 270). Analysis of the baseline characteristics between the sets showed no statistically significant differences for age, sex, race, marital status, histological type, year of diagnosis, number of regional lymph nodes, history of previous malignancy, grade, radiotherapy, chemotherapy, surgery, primary malignancy number, outcomes (OS, DSS, and PHNET-specific death), and months of survival (Table 1).
In the training set, Kaplan–Meier and log-rank tests were used to plot OS curves for each indicator (Figure 1). Further, analysis with univariable and multivariable Cox proportional regression models showed that older age (67–75 and >76 years), neuroendocrine carcinoma/others, and chemotherapy (yes) were independent risk factors for poorer OS. Conversely, married, widowed/other, and surgery (yes) were independent protective factors for better OS (Table 2). In terms of indicators affecting the DSS of patients with PHNET, Kaplan–Meier and log-rank tests were used to plot DSS curves for each indicator (Figure 2) and found older age (>76 years), other races, neuroendocrine carcinoma, and chemotherapy (yes) to be independent risk factors; whereas, surgery (yes) and higher primary malignancy number were independent protective factors (Table 3).
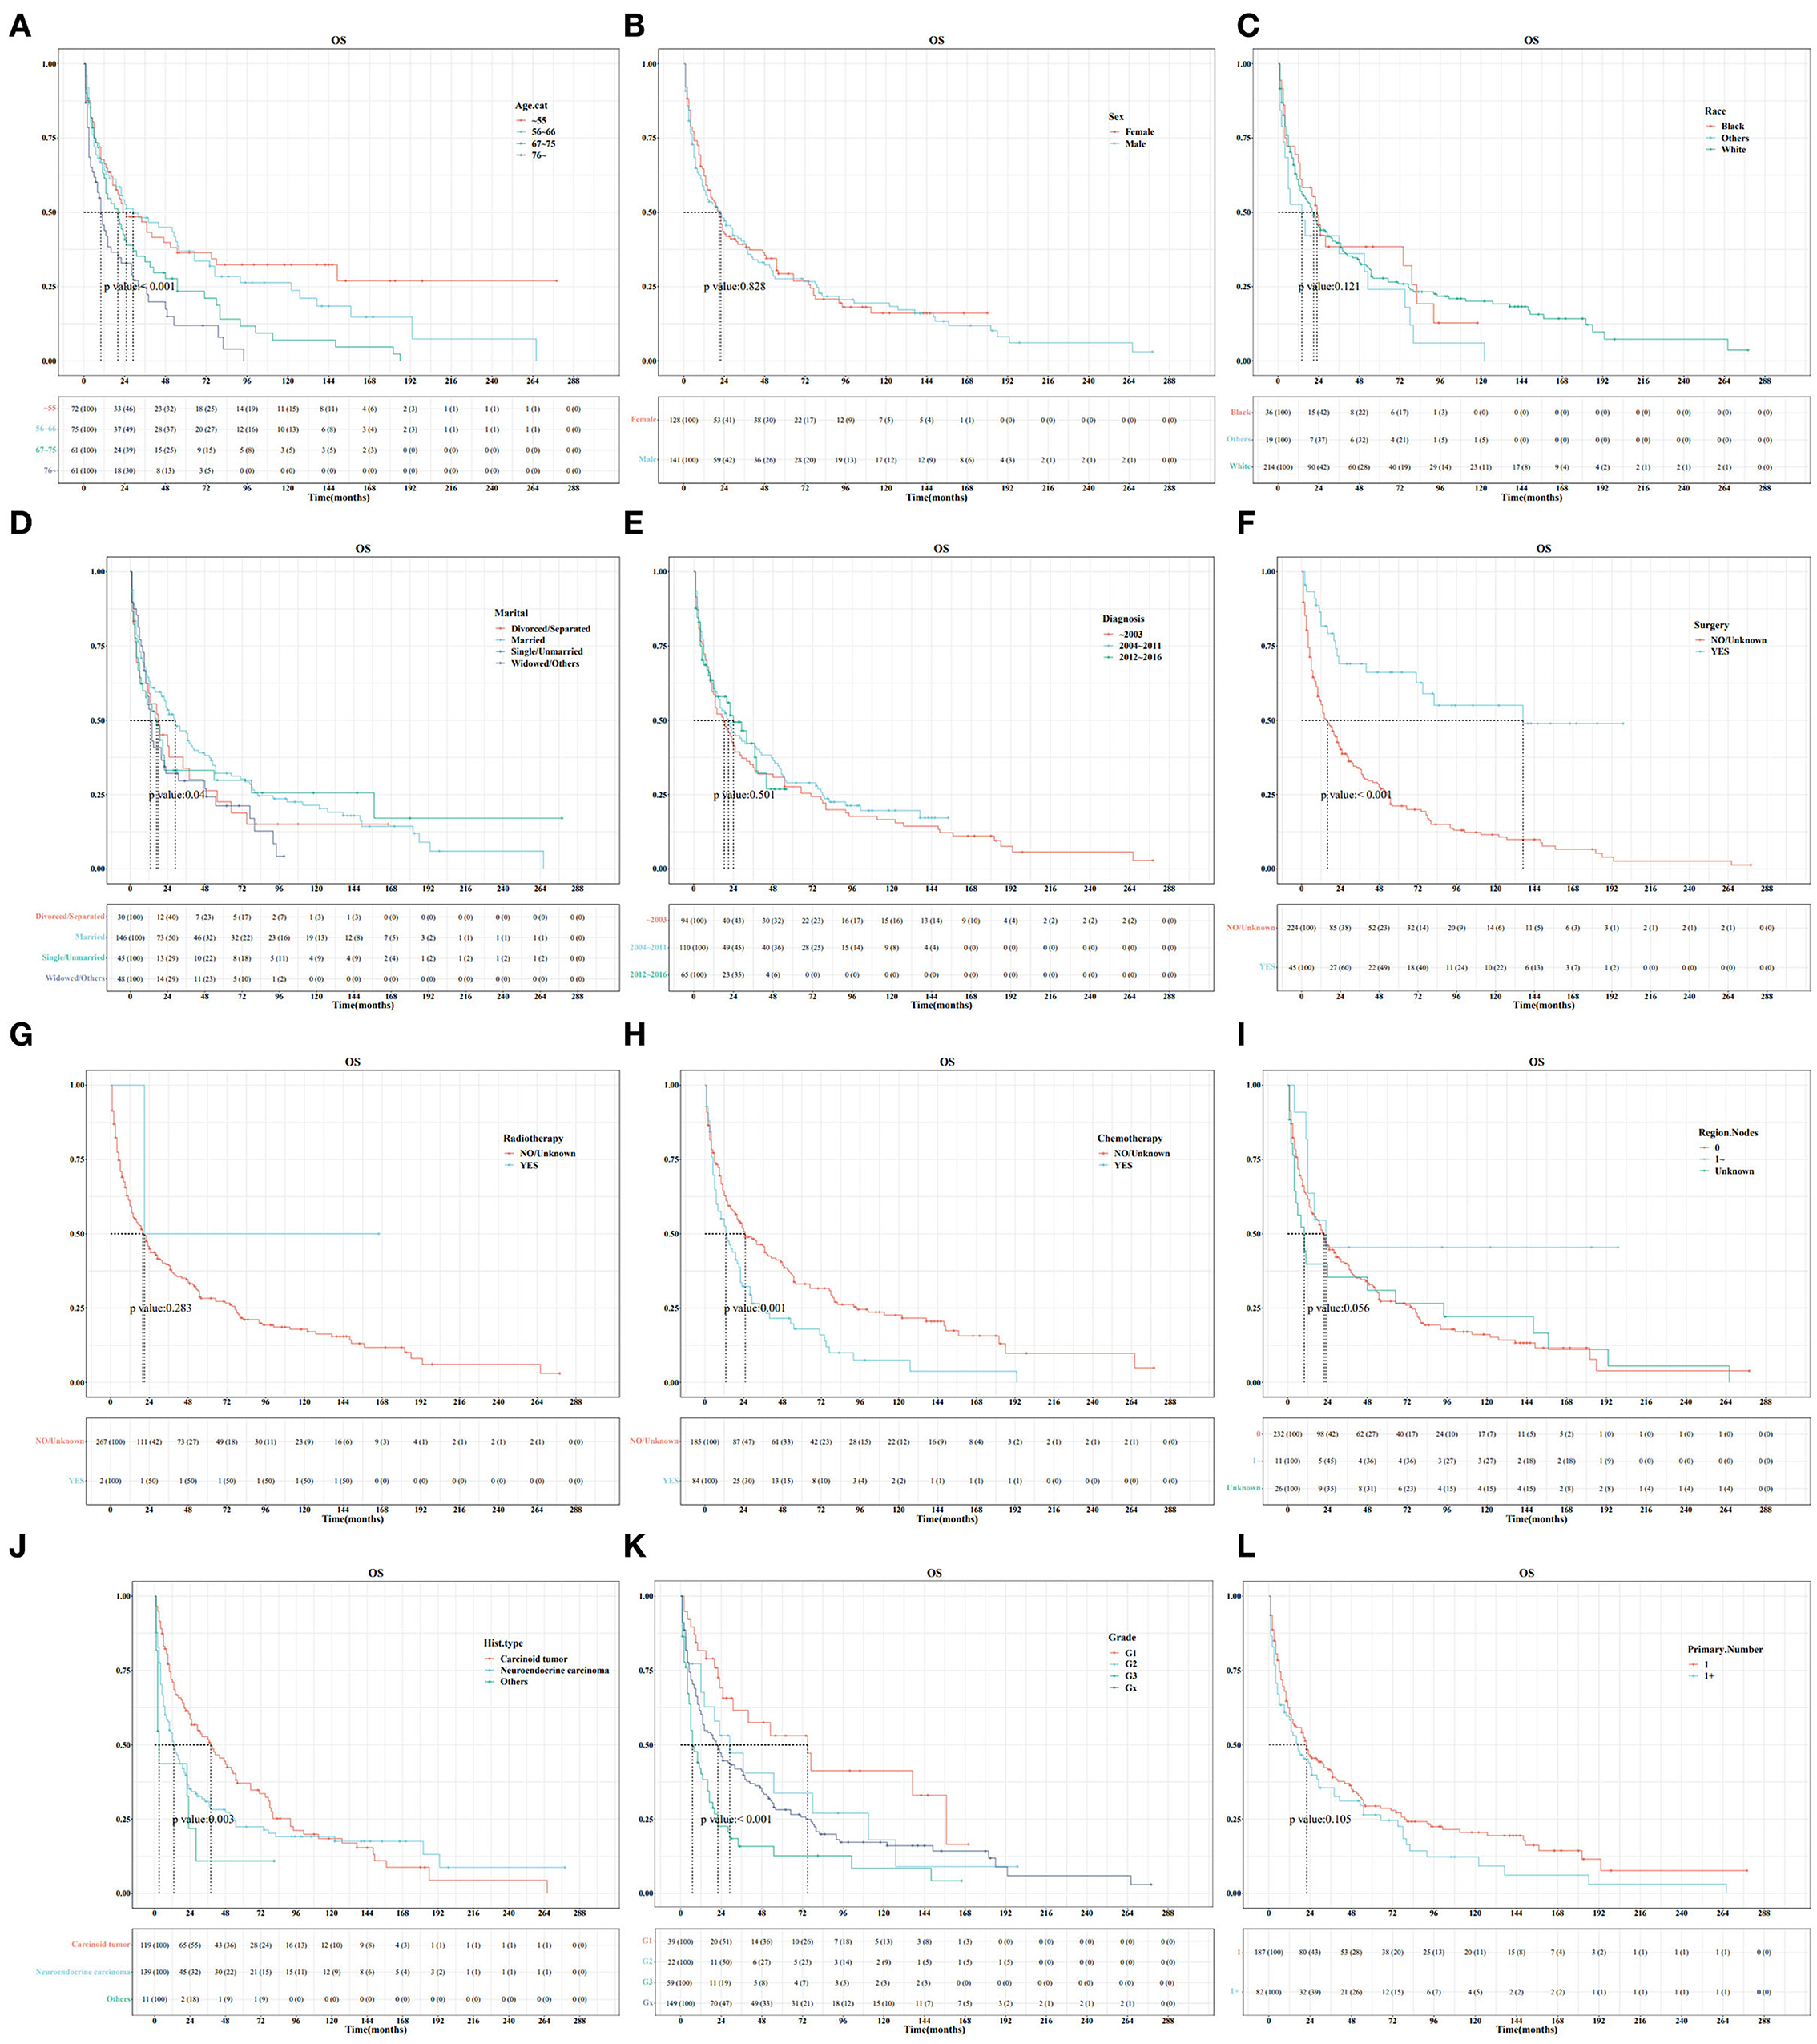
Figure 1. Survival curve analysis of the influence of the main variables on the overall survival (OS) of patients with primary hepatic neuroendocrine tumor (PHNET) in the training set. (A) age; (B) sex; (C) race; (D) marital status; (E) year of diagnosis; (F) surgery; (G) radiotherapy; (H) chemotherapy; (I) number of regional lymph nodes; (J) histological type; (K) grade; and (L) number of primary malignancies.
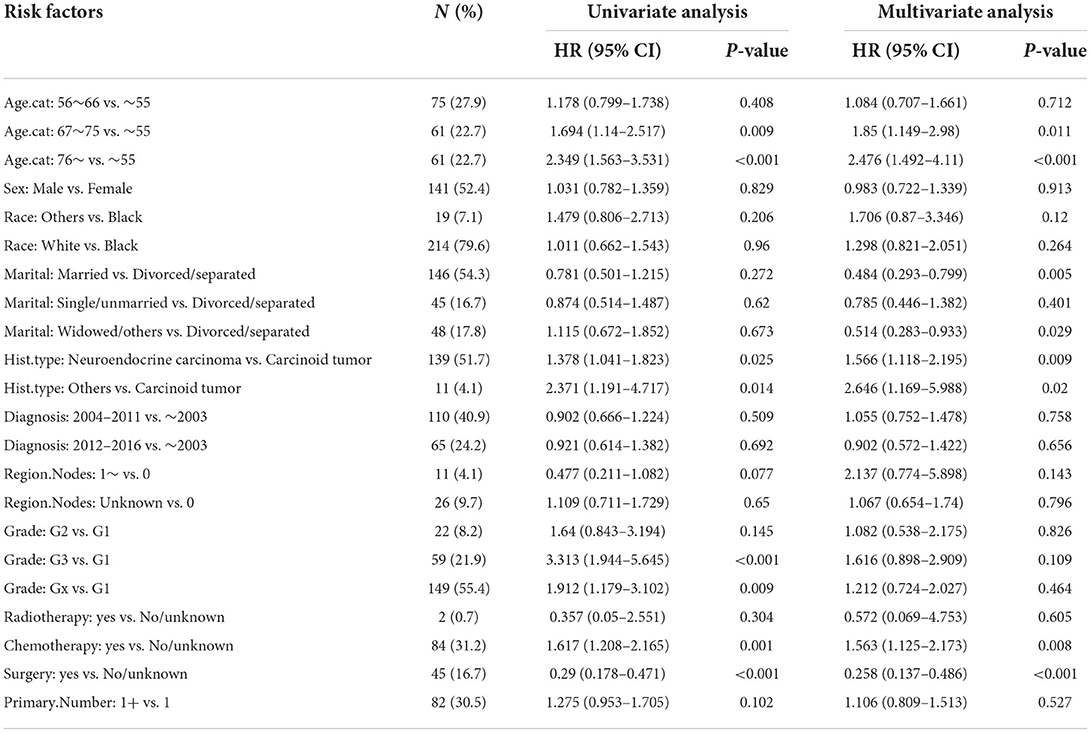
Table 2. Univariate and multivariate Cox analysis of factors for OS in patients with PHNET in the training set.
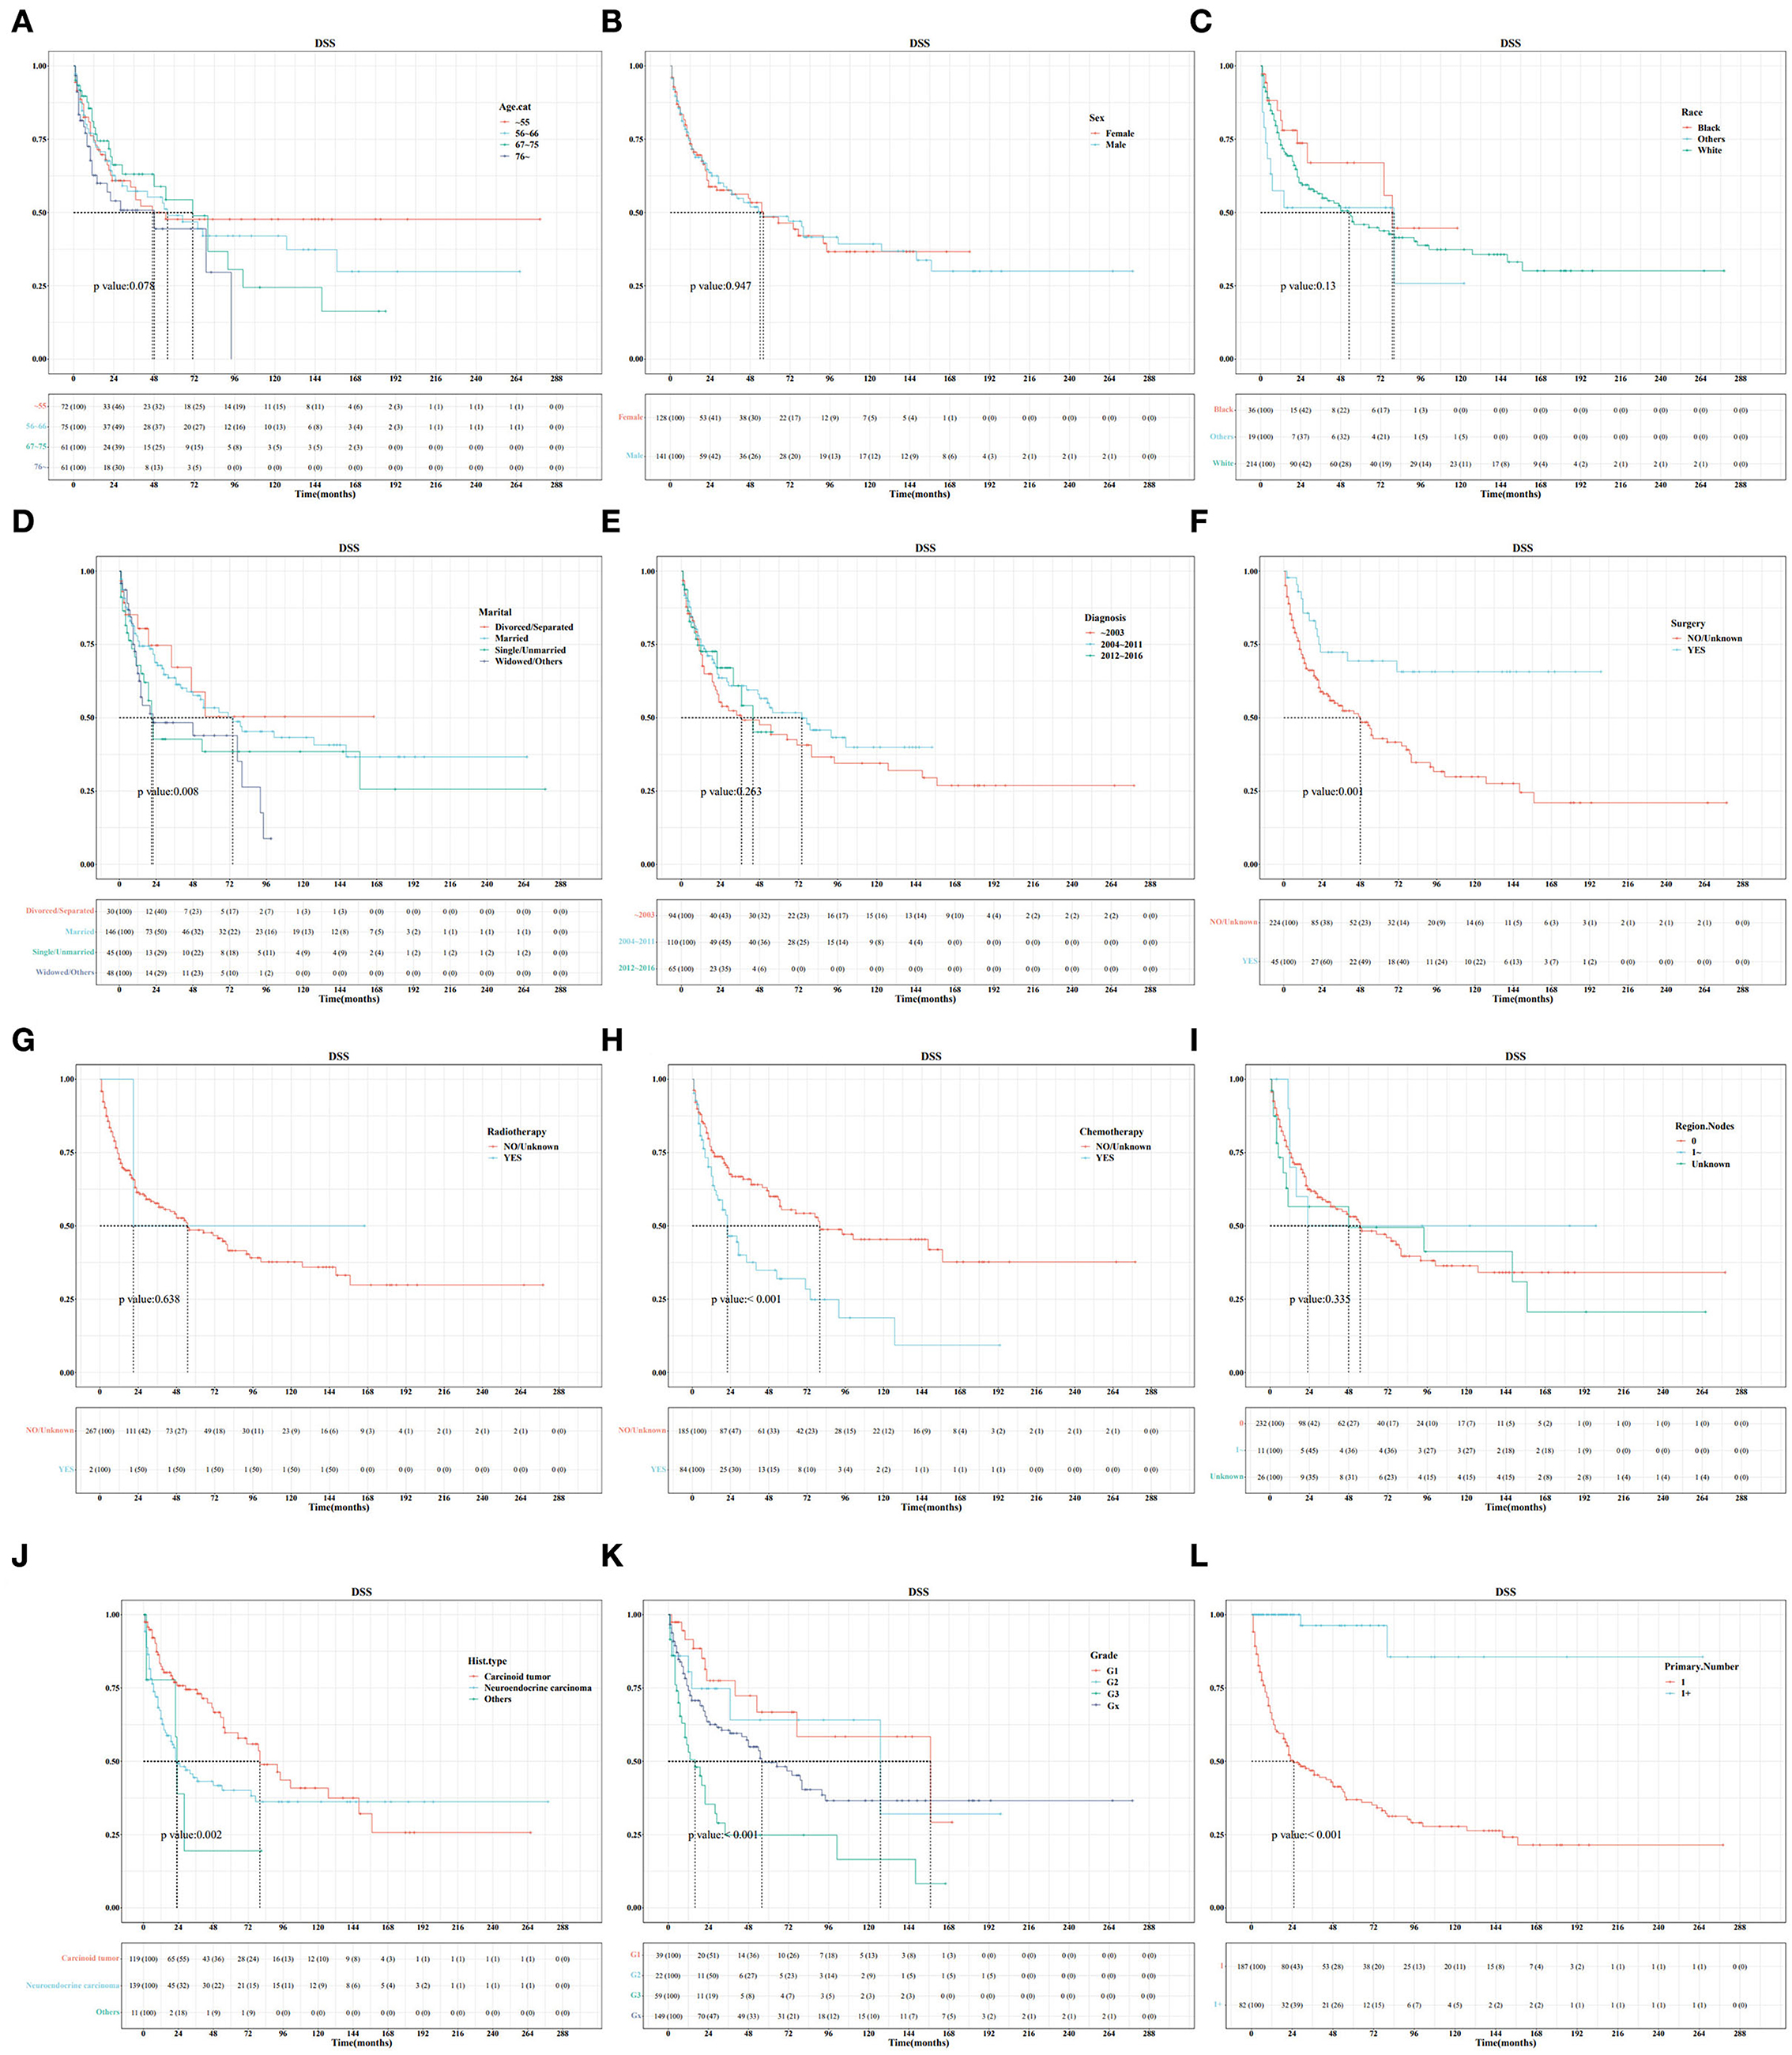
Figure 2. Survival curve analysis of the influence of the main variables on the DSS of patients with primary hepatic neuroendocrine tumor (PHNET) in the training set. (A) age; (B) sex; (C) race; (D) marital status; (E) year of diagnosis; (F) surgery; (G) radiotherapy; (H) chemotherapy; (I) number of regional lymph nodes; (J) histological type; (K) grade; and (L) number of primary malignancies.
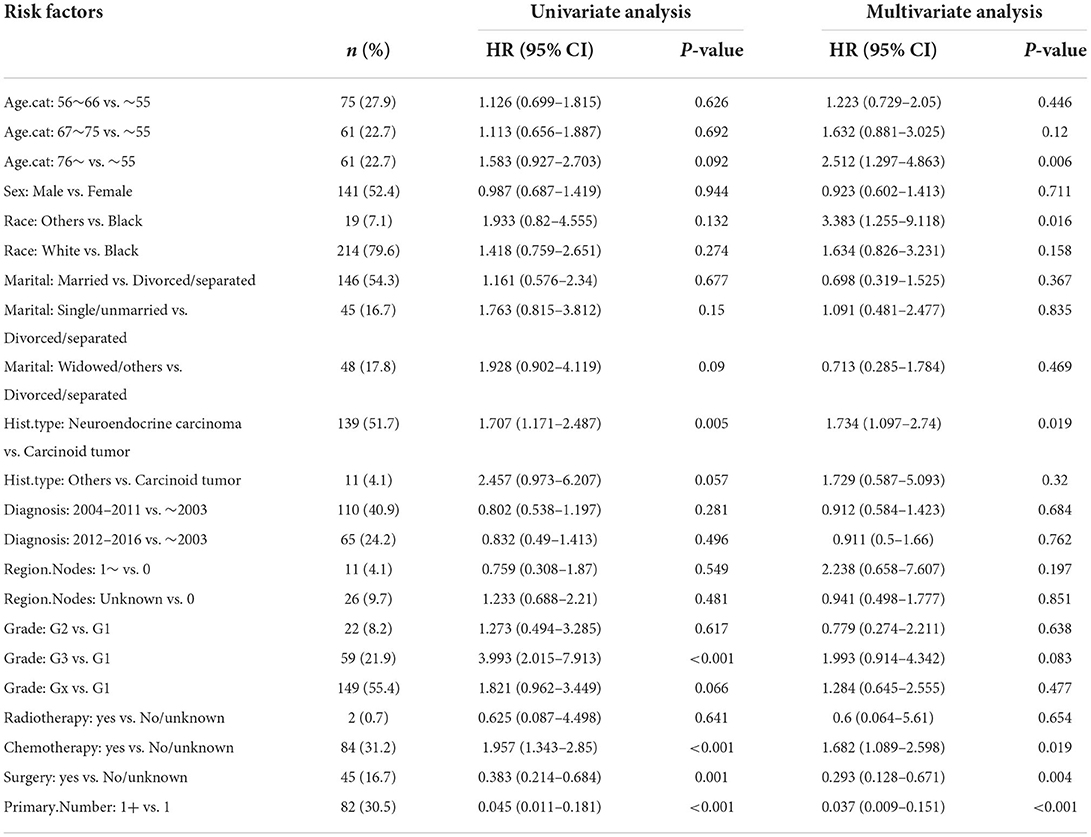
Table 3. Univariate and multivariate Cox analysis of factors for DSS in patients with PHNET in the validation set.
In this study, the cumulative probabilities for PHNET-specific death and non-PHNET death were also analyzed using the Fine–Gray competing risk model. In the training set, CIF curves were plotted for each indicator (Figure 3) and revealed that patients with PHNETs with older age had significantly increased risks of non-PHNET-related death. Further, patients with PHNETs with an advanced grade had a significantly increased risk of PHNET-specific death, divorced patients with PHNETs had a significantly decreased risk of PHNET-specific death, and patients with PHNETs with more primary malignancies had a significantly decreased risk of PHNET-specific death and an increased risk of non-PHNET death. In addition, patients with PHNET without surgical treatment had a significantly increased risk of both PHNET-specific death and non-PHNET death, and patients with PHNET who received chemotherapy had a significantly increased risk of PHNET-specific death.
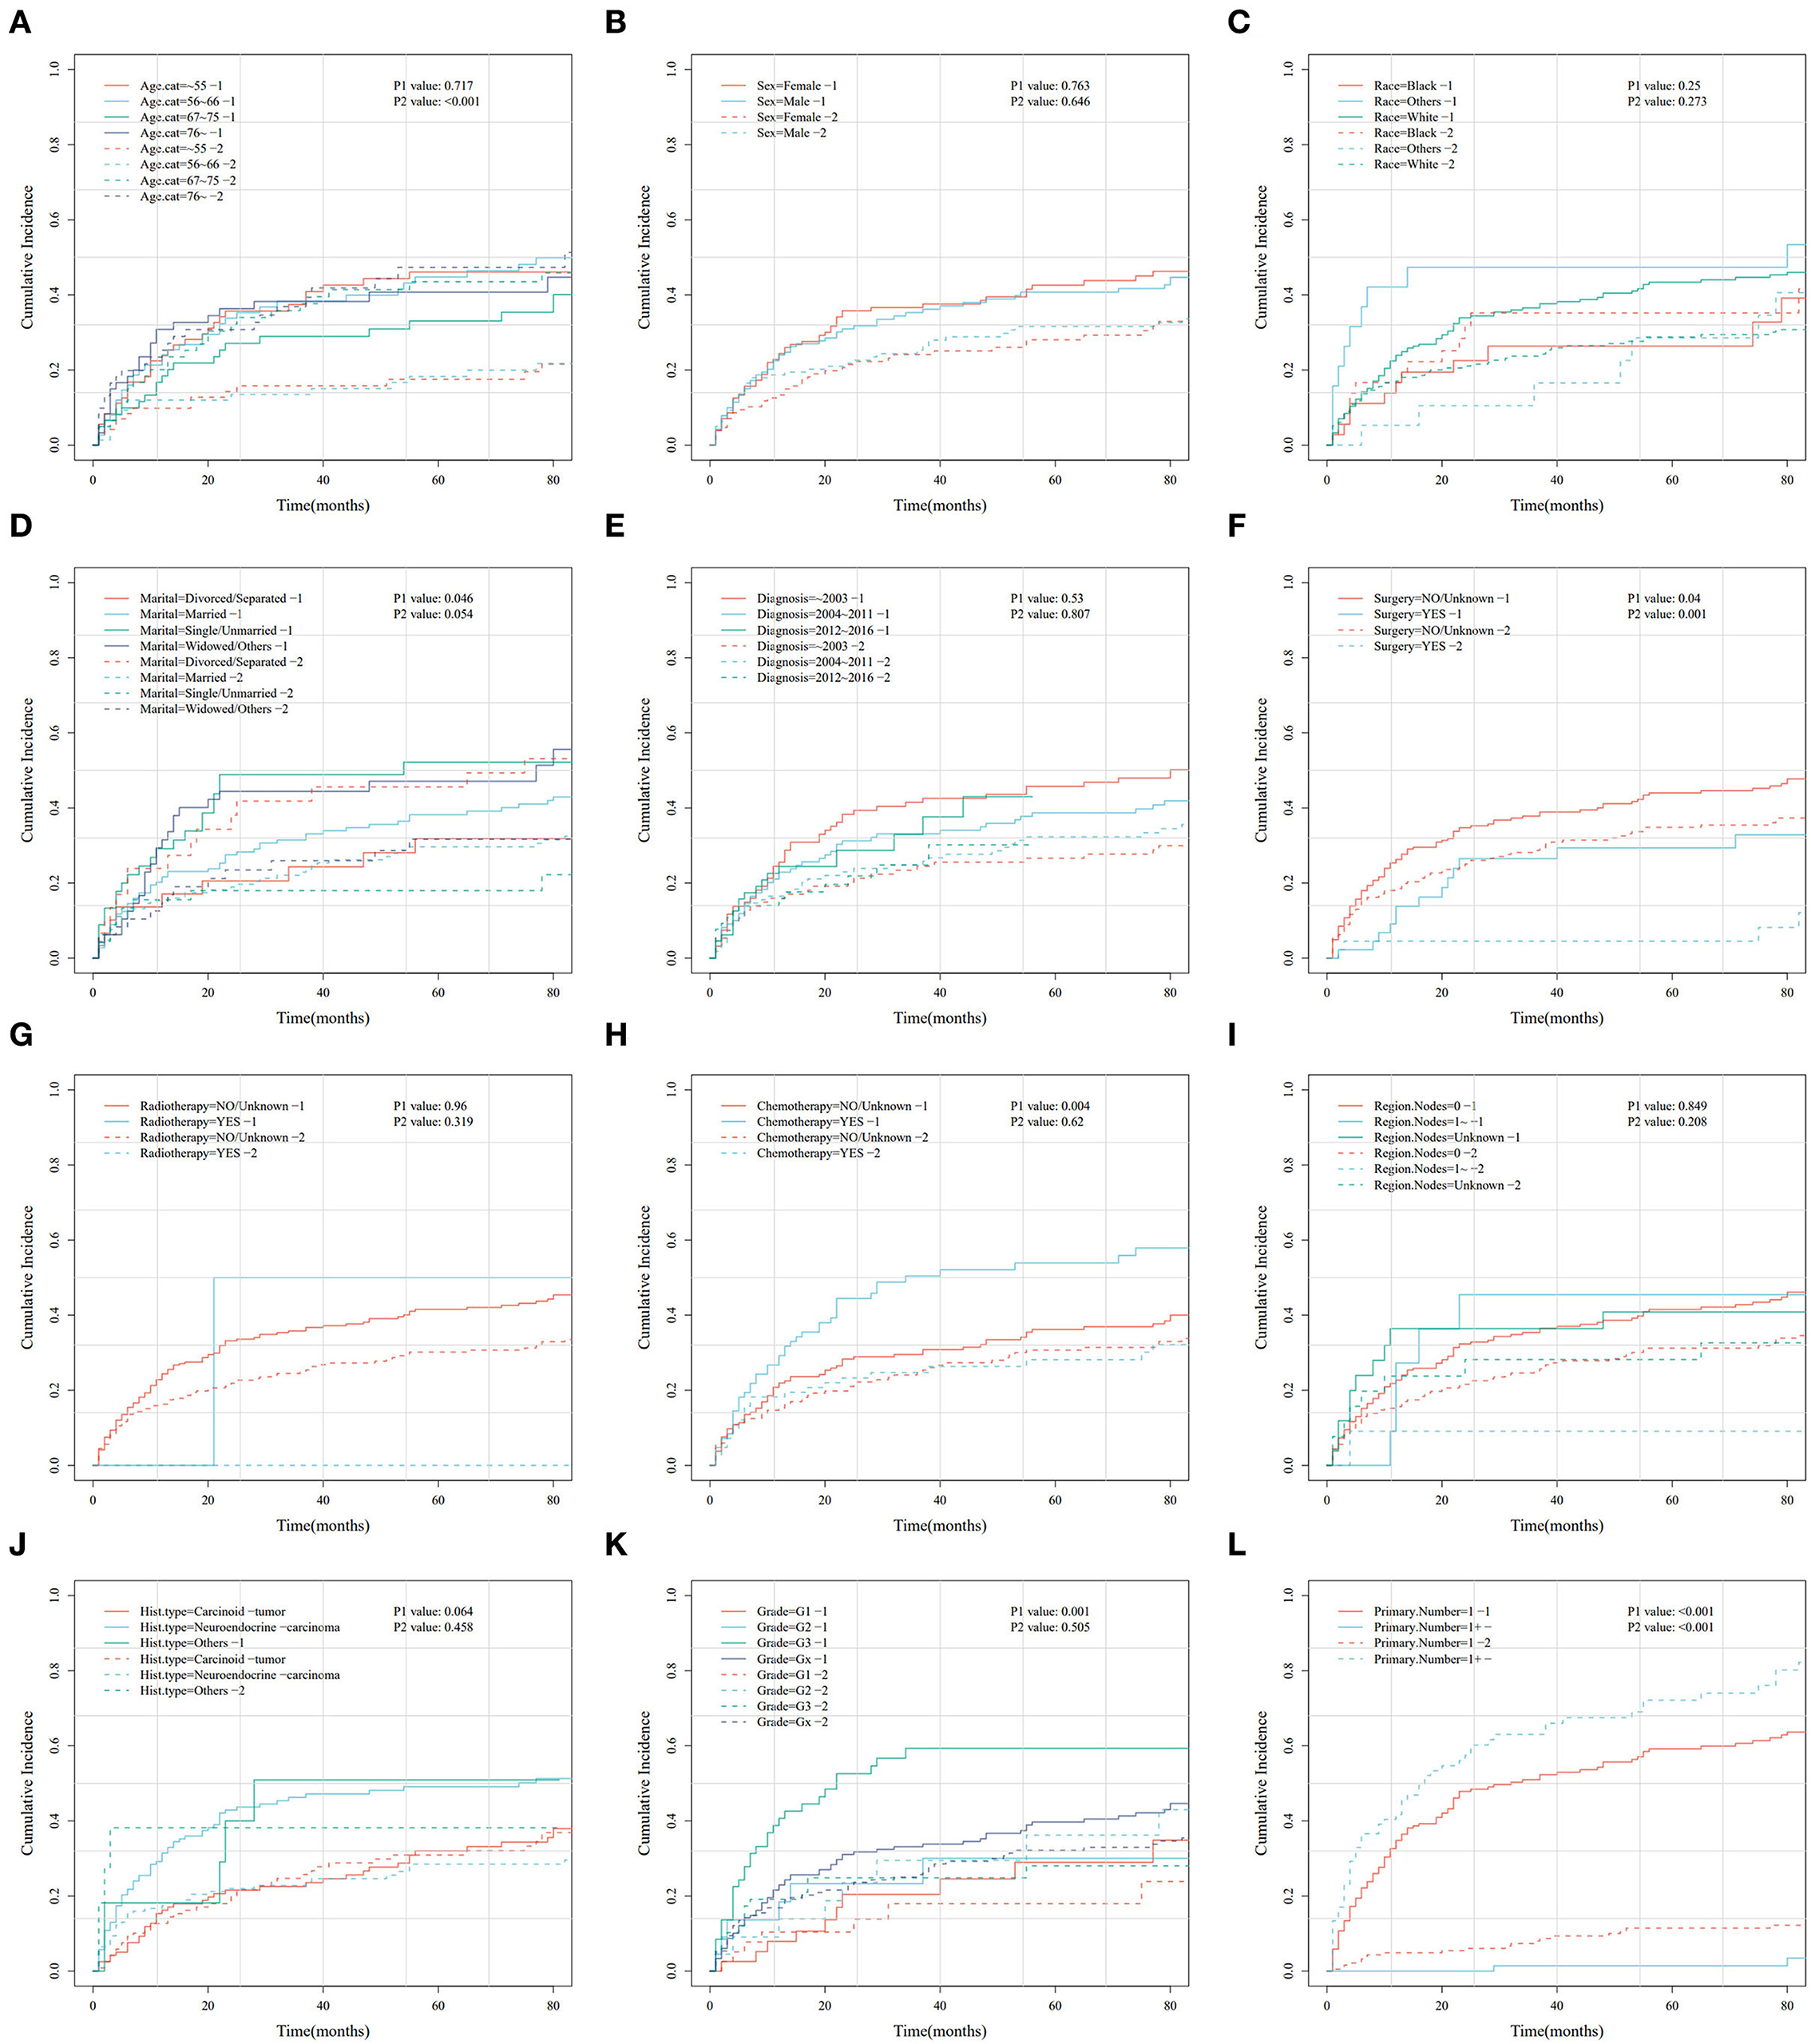
Figure 3. Cumulative risk curve analysis of the influence of the main variables on the cumulative probabilities for primary hepatic neuroendocrine tumor (PHNET)-specific death (labeled by 1) and non-PHNET death (labeled by 2) in the training set. (A) age; (B) sex; (C) race; (D) marital status; (E) year of diagnosis; (F) surgery; (G) radiotherapy; (H) chemotherapy; (I) number of regional lymph nodes; (J) histological type; (K) grade; and (L) number of primary malignancies.
Moreover, the univariate and multivariate analyses showed that two factors in the training set, older age (>76 years) and other races, were independent risk factors; however, surgery (yes) and the number of primary malignancies were independent protective factors (Table 4). Further, in the validation set, male sex, neuroendocrine carcinomas, grade G3, and radiotherapy treatment were associated with higher cumulative probabilities of PHNET-specific death; in contrast, surgery and more than one primary malignancy were associated with lower cumulative probabilities of PHNET-specific death (Table 5).
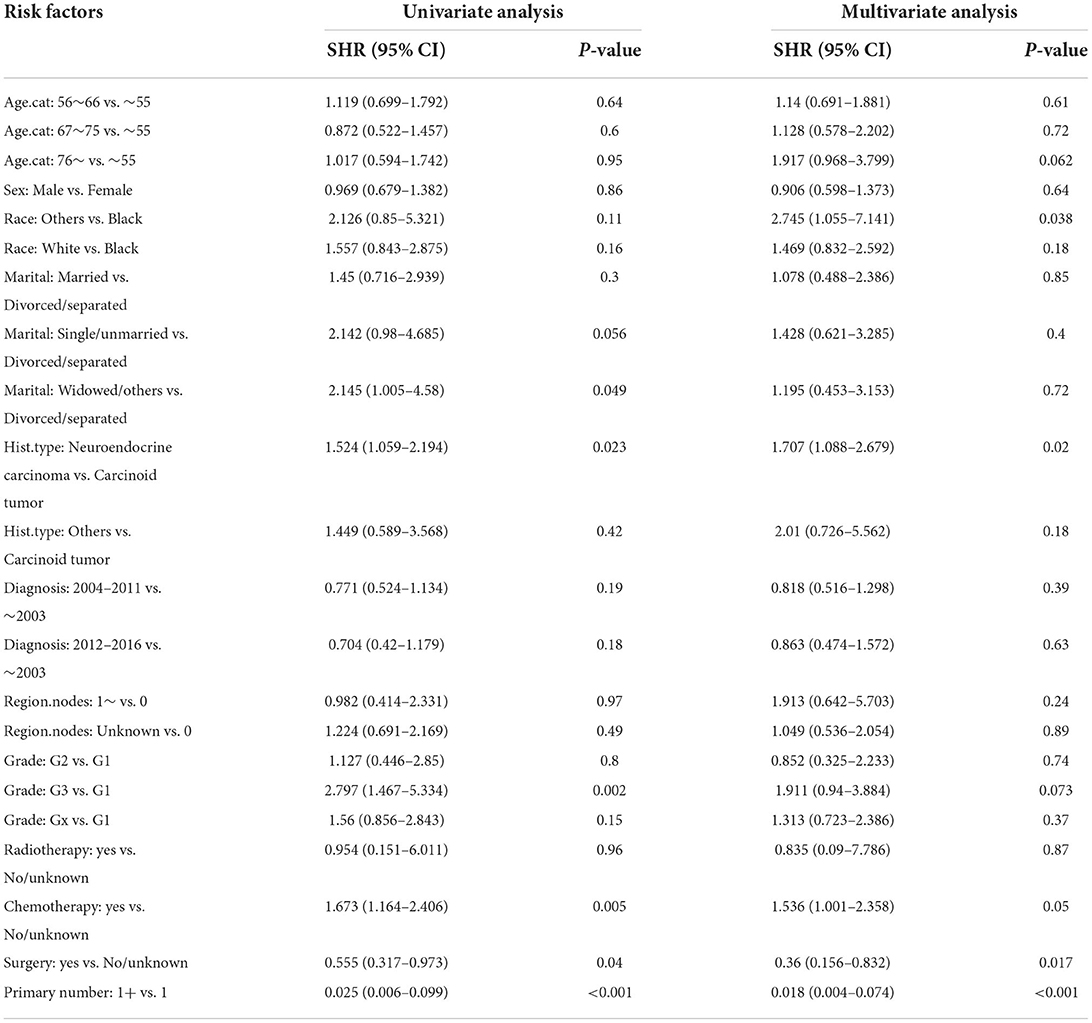
Table 4. Univariate and multivariate Fine-Gray analysis of factors for cumulative probabilities of PHNET-specific death in the training set.
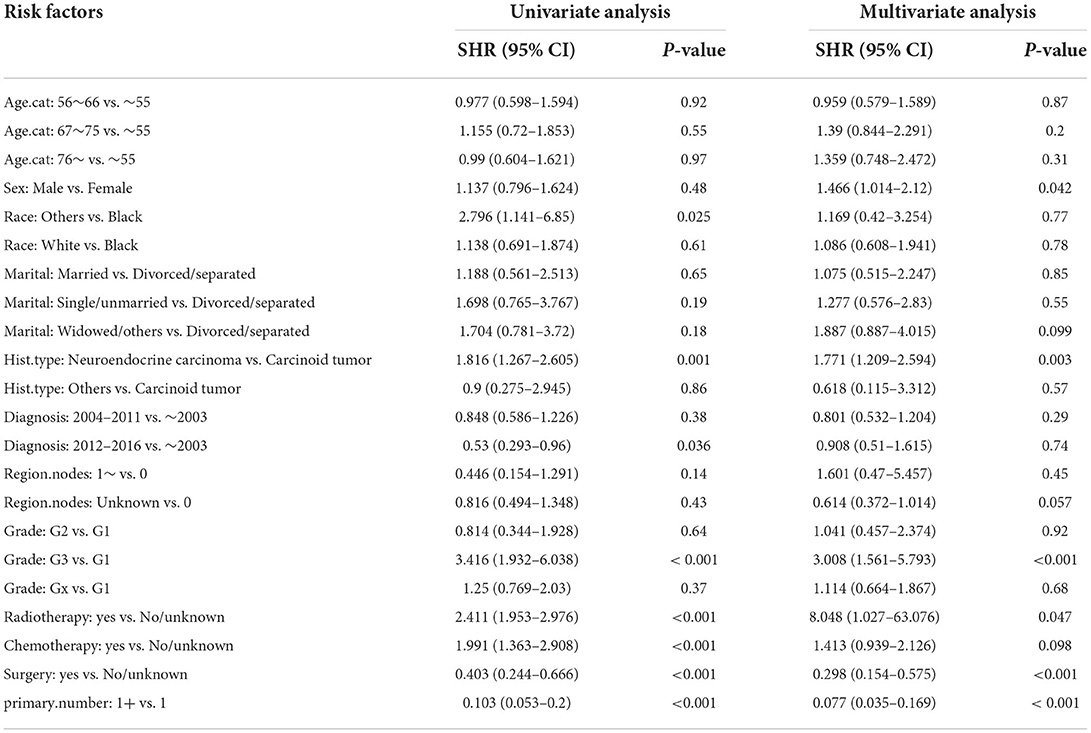
Table 5. Univariate and multivariate Fine-Gray analysis of factors for cumulative probabilities of PHNET-specific death in the validation set.
Based on the Fine–Gray analysis of the training set, five statistically significant indicators (multivariate analysis) were included in a competing risk nomogram model to predict the 1-, 3-, and 5-year cumulative probabilities for PHNET-specific death (Figure 4A). The nomogram demonstrated good discrimination with a high C-index in the training (0.792, 0.799, and 0.799, respectively) and validation sets (0.809, 0.813, and 0.809, respectively) for the 1-, 3-, and 5-year cumulative probabilities. Furthermore, the area under the curve (AUC) values of the nomogram model for predicting the 1-, 3-, and 5-year cumulative probabilities for PHNET-specific death were 0.799, 0.818, and 0.829, respectively, in the training set and 0.833, 0.875, and 0.87, respectively, in the validation set (Figures 4B, 5A). The calibration curves for the 3- and 5-year cumulative probabilities were similar to the standard curves in both the training and validation sets (Figures 4C, 5B). Furthermore, all decision curve analyses showed that the nomogram illustrated a high net benefit (Figures 4D, 5C). Further, based on the total score of each patient generated by the nomogram in the training set, all patients were divided into either a low- or high-risk group. The Fine–Gray analyses depicted that the high-risk group had higher and lower cumulative probabilities of PHNET-specific death and non-PHNET death, respectively, than the low-risk group (Figure 6).
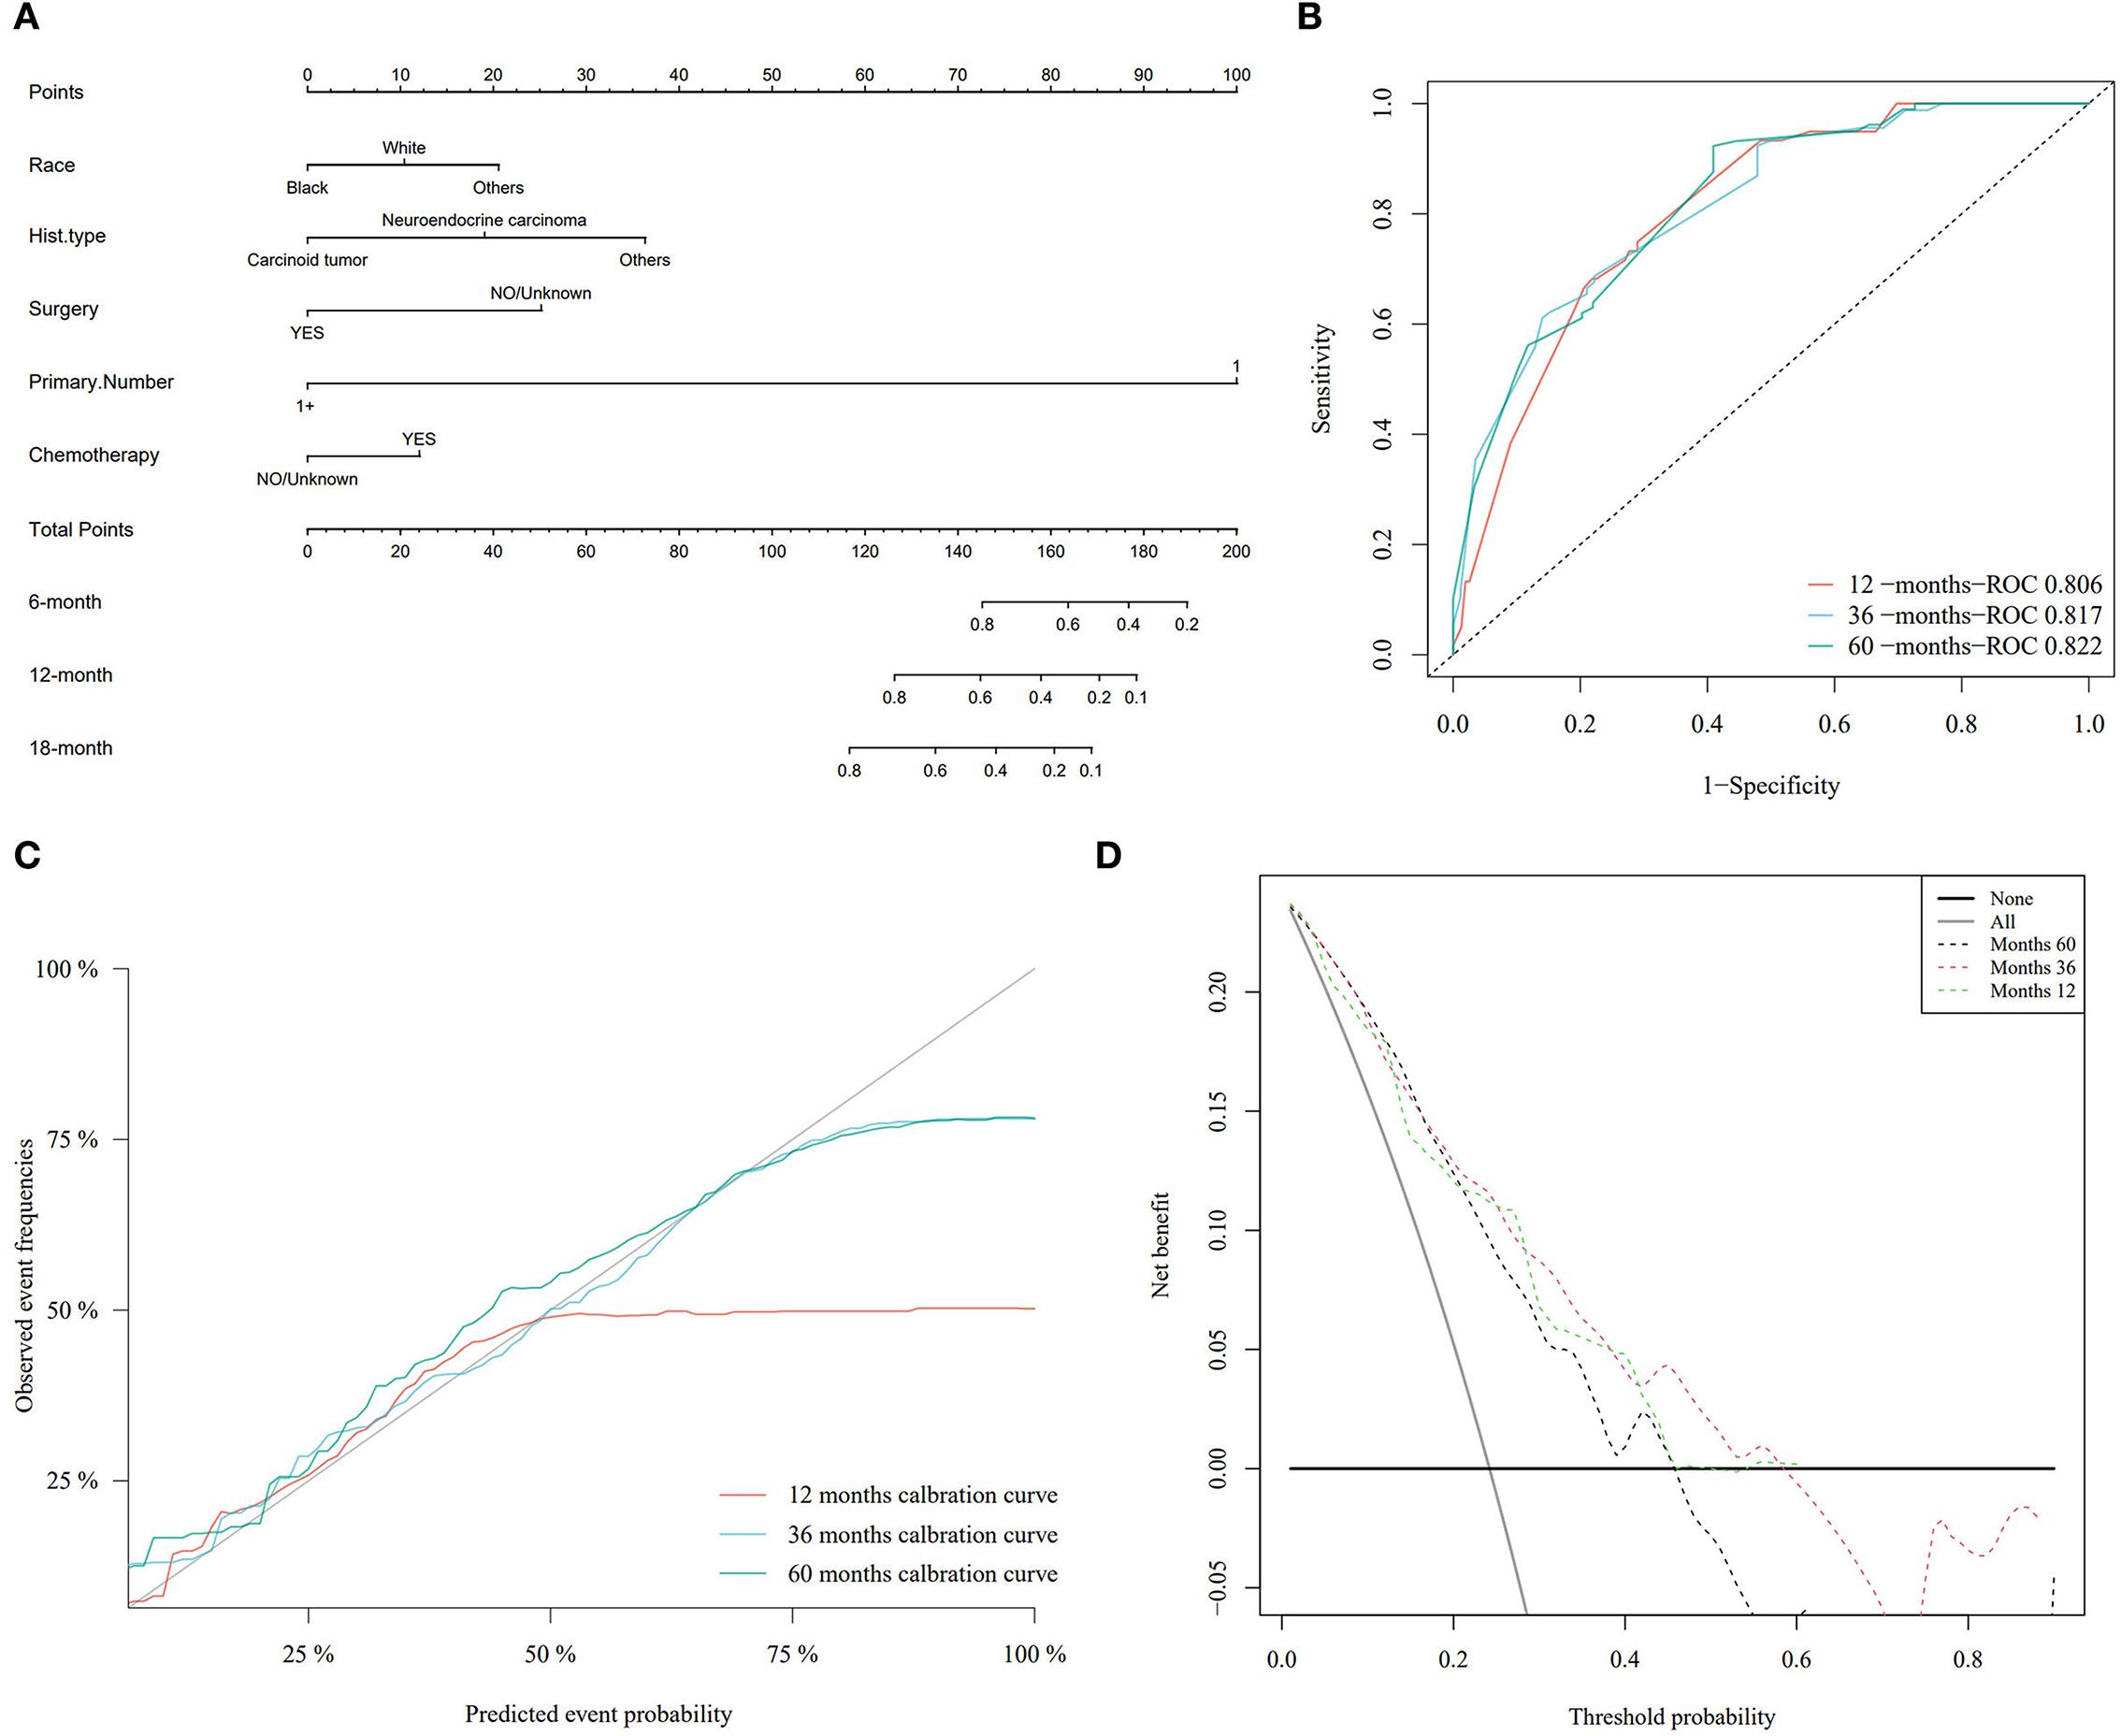
Figure 4. Nomogram model and its performance based on Fine–Gray analysis of patients with primary hepatic neuroendocrine tumor (PHNET) in the training set. (A) Nomogram model; (B) receiver operating characteristic curve; (C) calibration curves; and (D) decision curve analysis.
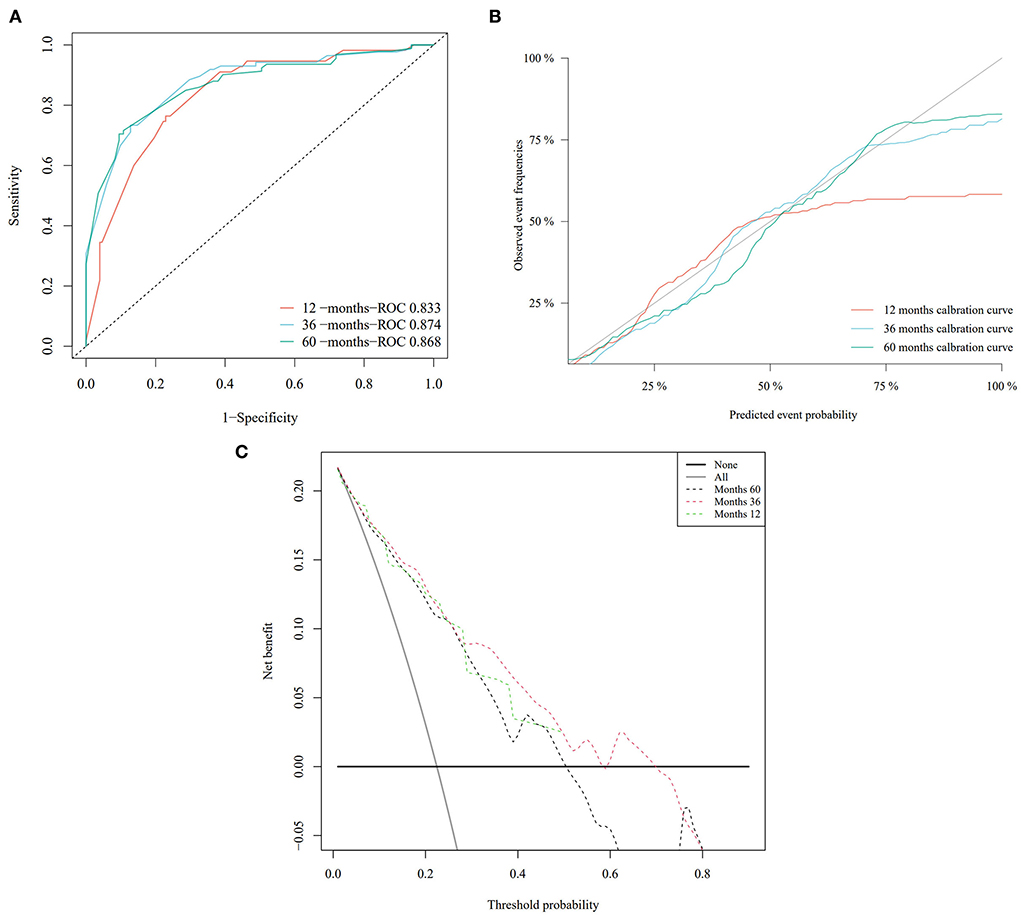
Figure 5. The performance of the nomogram model was evaluated with the validation set. (A) Receiver operating characteristic curve; (B) calibration curves; and (C) decision curve analysis.
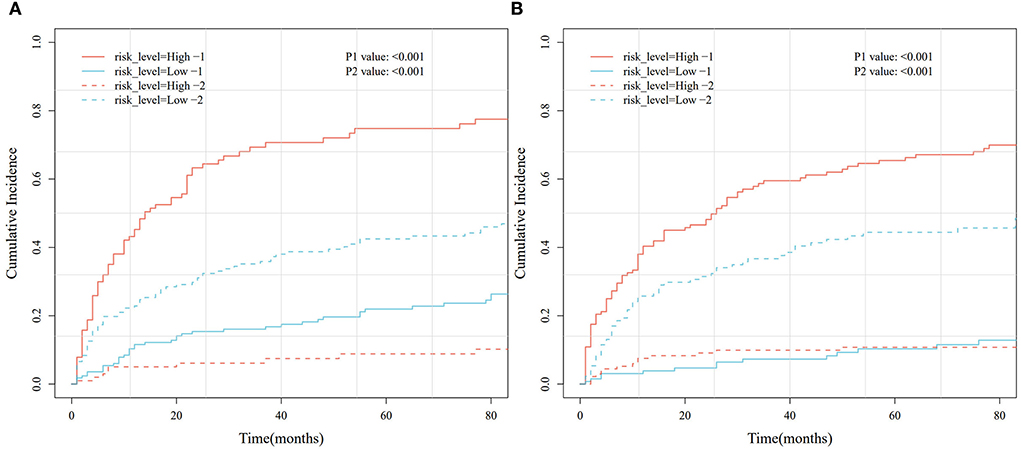
Figure 6. Cumulative risk curve analysis based on different risk groups generated by the nomogram model in the training and validation sets. (A) Training set. (B) Validation set.
Neuroendocrine tumors are a heterogeneous group of tumors originating from peptidergic neurons and neuroendocrine cells that can occur throughout the body, although incidences in the liver are rare (19, 20). In this study, independent risk factors affecting the DSS of 539 patients with PHNET were identified by a multivariable Cox regression model and Fine–Gray competing risk model. Based on race, surgical and chemotherapy treatments, histological tumor type, and the number of primary malignancies, a nomogram was drawn to predict the cumulative probability of PHNET-specific death.
The multivariate Cox analysis in this study showed that older age (>76 years), neuroendocrine carcinoma, and chemotherapy treatment predicted poorer OS and DSS, while surgery predicted better OS and DSS. It is known that a PHNET is generally diagnosed at an older age (21); however, a case of a PHNET that occurred at a young age, which was misdiagnosed as hepatocellular carcinoma preoperatively, was reported in South Korea (22). This report was consistent with our results that age is an independent risk factor affecting the prognosis of patients with PHNETs. Interestingly, chemotherapy treatment was an independent risk factor that conflicted with a previous case report stating that postoperative platinum-based chemotherapy was recommended in the management of PHNETs (23). This contradiction may be derived from Cox analysis inherent bias. Considering this bias, we performed Fine–Gray analysis, which identified surgical treatment and the number of primary malignancies as independent protective factors in both the training and validation sets. According to Jung et al., surgical treatment is recommended because of the favorable postresection outcomes (24). However, the result that the number of primary malignancies was a protective factor is puzzling, and perhaps more samples should be included for clarification.
A clinical nomogram is a valid and reliable prediction model that combines multiple prognostic factors to accurately calculate and predict individual survival (25). Nomograms have been used extensively in many previous studies, such as those on oropharyngeal cancer (26), young breast cancer (27), low-grade endometrial stromal sarcoma (28), and both malignant pheochromocytoma and paraganglioma (29). In terms of liver cancer, a nomogram has been constructed to predict OS in PHNET cases by Zhang et al. (13); however, this report did not take into account the effect of competing events on PHNET-specific death, which lowered the confidence of the results. In this study, we utilized the Fine–Gray competing risk model to analyze the independent prognostic factors and to construct a nomogram model. Multiple evaluation indicators implied that the nomogram for PHNETs performed well. To further validate the performance of the nomogram model constructed for the training set, we measured the C-index and AUC value and plotted both calibration curves and a decision curve. The results of the validation set were similar to those of the training set, which suggested that our nomogram model effectively predicted the DSS of patients with PHNETs.
This study has some limitations, mostly related to the data from the SEER database. First, most of the data from the SEER database are clinical indicators that do not include laboratory tests, imaging tests, or other indicators; as a result, the nomogram constructed in this study could only incorporate the clinical indicators of patients with PHNETs. Moreover, some clinical indicators in the SEER database were missing, which may have affected the accuracy of the prognostic model constructed in this study. Therefore, more clinical studies are needed to further validate the model.
In conclusion, this study developed a nomogram model to predict the DSS in patients with PHNETs using the clinical data from the SEER database and Fine–Gray analysis. We found that surgical treatment and the number of primary malignancies were independent protective factors for PHNETs, which can be used as an important reference for future decisions regarding clinical treatment.
This study provides a novel, well-calibrated, and good discriminatory competing risk nomogram that has a high accuracy to predict disease-specific survival (DSS) for patients with primary hepatic neuroendocrine tumor (PHNET) that may help clinicians to develop individualized treatment strategies. Surgical treatment and the number of primary malignancies were independent protective factors for PHNET.
The original contributions presented in the study are included in the article/supplementary material, further inquiries can be directed to the corresponding author.
JL, XL, and KZ: study design. YW and XD: collection of patients' clinicopathological data. JL and XL: data assembly, acquisition of survival predictions, and data analysis. KZ and ZC: study preparation and approval. All authors have read and approved the final manuscript.
This work was supported by the research foundation of Affiliated People's Hospital of Jiangsu University; the support was granted to KZ and JL (Y2020003-S and Y2019014).
The authors acknowledged the efforts of the SEER Program in providing high-quality open resources for researchers.
The authors declare that the research was conducted in the absence of any commercial or financial relationships that could be construed as a potential conflict of interest.
All claims expressed in this article are solely those of the authors and do not necessarily represent those of their affiliated organizations, or those of the publisher, the editors and the reviewers. Any product that may be evaluated in this article, or claim that may be made by its manufacturer, is not guaranteed or endorsed by the publisher.
AUC, the area under the curve; CIF, cumulative incidence function; C-index, concordance index; DCA, decision curve analysis; DSS, disease-specific survival; NET, neuroendocrine tumors; OS, overall survival; PHNET, primary hepatic neuroendocrine tumor; ROC, receiver operating characteristic; SEER, Surveillance, Epidemiology, and End Results.
1. Yang H, Zhang X, Cai XY, Wen DY, Ye ZH, Liang L, et al. From big data to diagnosis and prognosis: gene expression signatures in liver hepatocellular carcinoma. PeerJ. (2017) 5:e3089. doi: 10.7717/peerj.3089
2. Tuan LL, Minh ND, Minh HT, Cuong NH, Thu Ha V, Luan DT, et al. Primary hepatic neuroendocrine tumor. Endocrinol Diabetes Metab Case Rep. (2021) 2021:20–0220. doi: 10.1530/EDM-20-0220
3. Yao JC, Hassan M, Phan A, Dagohoy C, Leary C, Mares JE, et al. One hundred years after “carcinoid”: epidemiology of and prognostic factors for neuroendocrine tumors in 35,825 cases in the United States. J Clin Oncol. (2008) 26:3063–72. doi: 10.1200/JCO.2007.15.4377
4. Herrera-Martinez AD, Hofland J, Hofland LJ, Brabander T, Eskens F, Galvez Moreno MA, et al. Targeted systemic treatment of neuroendocrine tumors: current options and future perspectives. Drugs. (2019) 79:21–42. doi: 10.1007/s40265-018-1033-0
5. DeLuzio MR, Barbieri AL, Israel G, Emre S. Two cases of primary hepatic neuroendocrine tumors and a review of the current literature. Ann Hepatol. (2017) 16:621–9. doi: 10.5604/01.3001.0010.0313
6. Yu WM Li R, Sun BL, Du JK, Tuo HF. Primary hepatic neuroendocrine tumour with multiple liver metastases: a case report with literature review. Int J Surg Case Rep. (2021) 89:106590. doi: 10.1016/j.ijscr.2021.106590
7. George B, Seals S, Aban I. Survival analysis and regression models. J Nucl Cardiol. (2014) 21:686–94. doi: 10.1007/s12350-014-9908-2
8. Austin PC, Fine JP. Practical recommendations for reporting fine-gray model analyses for competing risk data. Stat Med. (2017) 36:4391–400. doi: 10.1002/sim.7501
9. Nolan EK, Chen HY, A. Comparison of the Cox Model to the Fine-Gray Model for Survival Analyses of Re-Fracture Rates. Arch Osteoporos. (2020) 15:86. doi: 10.1007/s11657-020-00748-x
10. Beach M, Caviedes LH, Sergi CM. Gross dissection of liver for hepatocellular carcinoma using Ajcc cancer staging manual 8th edition: Anatomical and practical considerations. In: Sergi CM, editor. Liver Cancer. Brisbane, QLD: Exon Publications (2021). doi: 10.36255/exonpublications.livercancer.2021.ch4
11. Balachandran VP, Gonen M, Smith JJ, DeMatteo RP. Nomograms in oncology: more than meets the eye. Lancet Oncol. (2015) 16:e173–80. doi: 10.1016/S1470-2045(14)71116-7
12. Li YF, Zhang QQ, Wang WL. Clinicopathological characteristics and survival outcomes of primary hepatic neuroendocrine tumor: a surveillance, epidemiology, and end results (seer) population-based study. Med Sci Monit. (2020) 26:e923375. doi: 10.12659/MSM.923375
13. Zhang Z, Zhao X, Li Z, Wu Y, Liu Y, Li Z, et al. Development of a nomogram model to predict survival outcomes in patients with primary hepatic neuroendocrine tumors based on seer database. BMC Cancer. (2021) 21:567. doi: 10.1186/s12885-021-08337-y
14. Duggan MA, Anderson WF, Altekruse S, Penberthy L, Sherman ME. The surveillance, epidemiology, and end results (seer) program and pathology: toward strengthening the critical relationship. Am J Surg Pathol. (2016) 40:e94–102. doi: 10.1097/PAS.0000000000000749
15. Pencina MJ, D'Agostino RB. Overall C as a measure of discrimination in survival analysis: model specific population value and confidence interval estimation. Stat Med. (2004) 23:2109–23. doi: 10.1002/sim.1802
16. Hanley JA, McNeil BJ. The meaning and use of the area under a receiver operating characteristic (Roc) curve. Radiology. (1982) 143:29–36. doi: 10.1148/radiology.143.1.7063747
17. Harrell FE Jr, Lee KL, Mark DB. Multivariable prognostic models: issues in developing models, evaluating assumptions and adequacy, and measuring and reducing errors. Stat Med. (1996) 15:361–87. doi: 10.1002/(SICI)1097-0258(19960229)15:4<361::AID-SIM168>3.0.CO;2-4
18. Van Calster B, Wynants L, Verbeek JFM, Verbakel JY, Christodoulou E, Vickers AJ, et al. Reporting and interpreting decision curve analysis: a guide for investigators. Eur Urol. (2018) 74:796–804. doi: 10.1016/j.eururo.2018.08.038
19. Cha DI, Kang TW, Jang KM, Kim YK, Kim SH, Ha SY, et al. Hepatic neuroendocrine tumors: gadoxetic acid-enhanced magnetic resonance imaging findings with an emphasis on differentiation between primary and secondary tumors. Abdom Radiol. (2018) 43:3331–9. doi: 10.1007/s00261-018-1653-6
20. Oronsky B, Ma PC, Morgensztern D, Carter CA. Nothing but Net: a review of neuroendocrine tumors and carcinomas. Neoplasia. (2017) 19:991–1002. doi: 10.1016/j.neo.2017.09.002
21. Parray A, Patkar S, Goel M. Primary hepatic neuroendocrine tumours of liver- a rarity: single centre analysis of 13 patients. Ann Hepatobil Pancreat Surg. (2020) 24:17–23. doi: 10.14701/ahbps.2020.24.1.17
22. Song S, Koh Y. Primary hepatic neuroendocrine tumor arising at a young age: rare case report and literature review. Korean J Gastroenterol. (2022) 79:35–40. doi: 10.4166/kjg.2021.139
23. Lan J, Guo D, Qin X, Chen B, Liu Q. Mixed neuroendocrine carcinoma and hepatocellular carcinoma: a case report and literature review. Front Surg. (2021) 8:678853. doi: 10.3389/fsurg.2021.678853
24. Jung J, Hwang S, Hong SM, Kim KH, Ahn CS, Moon DB, et al. Long-term postresection prognosis of primary neuroendocrine tumors of the liver. Ann Surg Treat Res. (2019) 97:176–83. doi: 10.4174/astr.2019.97.4.176
25. Kattan MW, Scardino PT. Evidence for the usefulness of nomograms. Nat Clin Pract Urol. (2007) 4:638–9. doi: 10.1038/ncpuro0968
26. Fakhry C, Zhang Q, Nguyen-Tan PF, Rosenthal DI, Weber RS, Lambert L, et al. Development and validation of nomograms predictive of overall and progression-free survival in patients with oropharyngeal cancer. J Clin Oncol. (2017) 35:4057–65. doi: 10.1200/JCO.2016.72.0748
27. Sun Y, Li Y, Wu J, Tian H, Liu H, Fang Y, et al. Nomograms for prediction of overall and cancer-specific survival in young breast cancer. Breast Cancer Res Treat. (2020) 184:597–613. doi: 10.1007/s10549-020-05870-5
28. Wu J, Zhang H, Li L, Hu M, Chen L, Xu B, et al. A nomogram for predicting overall survival in patients with low-grade endometrial stromal sarcoma: a population-based analysis. Cancer Commun. (2020) 40:301–12. doi: 10.1002/cac2.12067
Keywords: competing risk model, decision curve analysis, nomogram, primary hepatic neuroendocrine tumor, surveillance
Citation: Lin J, Li X, Ding X, Chen Z, Wu Y and Zhao K (2022) Developing a competing risk nomogram that predicts the survival of patients with a primary hepatic neuroendocrine tumor. Front. Med. 9:960235. doi: 10.3389/fmed.2022.960235
Received: 02 June 2022; Accepted: 17 October 2022;
Published: 08 November 2022.
Edited by:
Zhixin Wang, Affiliated Hospital of Qinghai University, ChinaReviewed by:
Xiaoyin Bai, Peking Union Medical College Hospital (CAMS), ChinaCopyright © 2022 Lin, Li, Ding, Chen, Wu and Zhao. This is an open-access article distributed under the terms of the Creative Commons Attribution License (CC BY). The use, distribution or reproduction in other forums is permitted, provided the original author(s) and the copyright owner(s) are credited and that the original publication in this journal is cited, in accordance with accepted academic practice. No use, distribution or reproduction is permitted which does not comply with these terms.
*Correspondence: Kun Zhao, a3VuQHVqcy5lZHUuY24=
†These authors share first authorship
Disclaimer: All claims expressed in this article are solely those of the authors and do not necessarily represent those of their affiliated organizations, or those of the publisher, the editors and the reviewers. Any product that may be evaluated in this article or claim that may be made by its manufacturer is not guaranteed or endorsed by the publisher.
Research integrity at Frontiers

Learn more about the work of our research integrity team to safeguard the quality of each article we publish.