 Qiangmin Qiu1†
 Yanze Li1†
 Ye Zhang1†Yanguang Hou1
 Juncheng Hu1,2Lei Wang1Zhiyuan Chen1Yourong Lei3*
 Yang Du1*
 Xiuheng Liu1*
- 1Department of Urology, Renmin Hospital of Wuhan University, Wuhan, China
- 2Wuhan University Institute of Urologic Disease, Renmin Hospital of Wuhan University, Wuhan, China
- 3Department of Infection Prevention and Control, Renmin Hospital of Wuhan University, Wuhan, China
Necroptosis is a type of caspase-independent cell death, and it plays a critical role in regulating the development of cancer. To date, little is known about the role of necroptosis-related genes (NRGs) in clear cell renal cell carcinoma (ccRCC). In this study, we downloaded data regarding the expression of NRGs and overall survival (OS) from The Cancer Genome Atlas (TCGA) database and constructed a risk model to determine the prognostic features of necroptosis using COX regression analysis. Patients with ccRCC were divided into low-risk and high-risk groups based on their risk scores. Thereafter, Kaplan–Meier curves were used to evaluate OS, and receiver operating characteristic (ROC) curves were used to determine the accuracy of prediction. Stratified analyses were performed according to different clinical variables. Furthermore, we assessed the correlation between clinical variables and risk scores; the NRGs with differential expression were mainly enriched in positive regulation of intracellular transport and platinum resistance pathways. We constructed prognostic signatures for OS based on four NRGs and showed that the survival time was significantly longer in the low-risk groups than in the high-risk groups (p < 0.001). The area of the ROC curve for OS was 0.717, indicating excellent predictive accuracy of the established model. Therefore, a predictive model based on NRGs was constructed, which can predict the prognosis of patients and provides insights into the biological mechanisms underlying necroptosis in patients with ccRCC.
Introduction
Renal cell carcinoma (RCC) is a common malignancy in humans, and clear cell renal cell carcinoma (ccRCC) is the most dominant type of RCC (1, 2). Surgery is an effective treatment for localized RCC, but limited surgical treatment is available for advanced RCC or metastatic RCC (3, 4). Because of the heterogeneity of tumors, TNM staging is commonly used in clinical practice; however, this is not an optimal technique to predict the prognosis of patients (5). Thus, determining new diagnostic and prognostic markers for ccRCC is urgently required.
Necroptosis is a form of caspase-independent programmed cell death, which recruits downstream mixed-lineage kinase domain-like pseudokinase (MLKL) phosphorylation and localization to the cell membrane through the complex formed by receptor-interacting serine/threonine-protein kinase 3 (RIP3) and receptor-interacting serine/threonine-protein kinase 1 (RIP1), resulting in cell membrane rupture and cell death (6). In addition, necroptosis is involved in tumor recurrence after radiotherapy through the RIP3/RIP1/MLKL/Janus kinase (JNK)/interleukin 8 (IL-8) pathway (7–9).
The role and mechanism of necroptosis in cancer have not been established thus far (10). Cancer cells may survive by inhibiting the expression of key necroptosis genes. The expression of key necroptosis-related genes (NRGs) is often increased in some tumors (11, 12). To date, the studies investigating the role of necroptosis in ccRCC have focused on developing treatment by targeting necroptosis (13, 14), and few studies have reported the function of necroptosis in predicting the prognosis of patients with ccRCC.
In this study, we obtained the expression data of 21 differentially expressed NRGs and the clinical information of patients with ccRCC from The Cancer Genome Atlas (TCGA) database and analyzed the biological functions of these genes. We established an overall survival (OS) model based on the 4 prognostic NRGs and discovered necroptosis-related signatures that could predict the prognosis of patients. Thus, our results showed that these necroptosis-related features are reliable markers of the prognosis in patients with ccRCC.
Materials and methods
Data sources
We identified 8 NRGs from the necroptosis gene set M24779.gmt downloaded from the Gene Set Enrichment Analysis (GSEA)1 database. Additionally, based on the results of previous studies on necroptosis, we identified 67 NRGs (Supplementary Table 1). We downloaded the RNA sequencing (RNA-seq) data and clinical information of 539 patients with ccRCC from the TCGA database.2
Enrichment analysis
Differentially expressed NRGs were identified using the limma package in R with thresholds of | log2FC| values of > 1 and adjusted p-values of < 0.05. To better understand the role of differentially expressed NRGs, the “cluster profiler” package was used for Gene Ontology (GO) and Kyoto Encyclopedia of Genes and Genomes (KEGG) analyses, and the “ggplot2” and “GOplot” packages were used for visualization.
Construction of a prediction signature
Univariate Cox regression analysis was performed to screen for NRGs in patients with ccRCC, and multivariate COX regression analysis was performed to build a necroptosis-related gene signature using the “survival” R package. The risk score of each patient was calculated, and Kaplan–Meier curves were plotted for survival analysis. The predictive value of the prognostic prediction model was calculated using the area under the curve (AUC) of the receiver operating characteristic (ROC) curve using the “survivalROC” R package. Principal component analysis (PCA) and t-distributed stochastic neighbor embedding (t-SNE) were performed using the “stats” R package.
Experimental validation
To confirm the differences in the expression of the NRGs between ccRCC and normal tissues, we performed experimental validation using specimens obtained from 5 patients with ccRCC who underwent radical nephrectomy or partial nephrectomy from June 2021 to December 2022 at Wuhan University Renmin Hospital. Our study was approved by the internal review board of Renmin Hospital of Wuhan University.
The non-tumor tissues and tumor tissues were fixed in 4% paraformaldehyde, embedded in paraffin, and cut in 4-μm-thick sections. The sections were incubated overnight at 4°C with primary antibodies for MYCN (1:150, Abcam, Inc., ab227822), tumor necrosis factor receptor-associated factor 2 (TRAF2) (1:150, Abcam, Inc., ab167163), Bcl-2/adenovirus E1B 19 kDa interacting protein 3 (BNIP3) (1:100, Abcam, Inc., ab205606), and polo-like kinase 1 (PLK1) (1:500, Abcam, Inc., ab155095), and with secondary antibody for 30 min at 37°C. The sections were incubated with 3,3′-Diaminobenzidine (DAB) chromogen for 8 min and followed by hematoxylin and bluing reagent counterstaining. Under a microscope, five different fields of view were randomly selected to assess staining intensity. Two pathologists independently assessed the slides of immunohistochemical staining.
Statistical analysis
All statistical analyses were performed using the R language (version 4.1.2). The rank correlation among the different variables was further assessed using the Pearson correlation coefficient. In addition, independent t-tests were performed to compare gene expressions among different tissues. All statistical p-values were two-tailed, with p-values of < 0.05 indicating statistical significance.
Results
Identification of distinct necroptosis-related genes in non-tumor and clear cell renal cell carcinoma groups
The flow chart of our research process is shown in Supplementary Figure 1. The RNA-seq data and clinical information of 539 patients were downloaded from the TCGA database, and the RNA expression data of 67 NRGs were examined. A total of 21 NRGs were identified with significant differential expression between the non-tumor and ccRCC groups, including 4 downregulated (MYNC, GATA3, IDH2, and BACH2) and 17 upregulated (TRAF2, LEF1, FAS, TNFRSF1B, EGFR, MYC, TLR3, BNIP3, AXL, CD40, ALK, MLKL, PLK1, ZBP1, FASLG, TERT, and CDKN2A) genes (Figure 1A). The screening criteria were set to | log2 (FC)| > 1 and FDR < 0.05. Box and volcano plots were created to compare the expression of the differentially expressed NRGs between non-tumor and ccRCC tissues (Figures 1B,C).
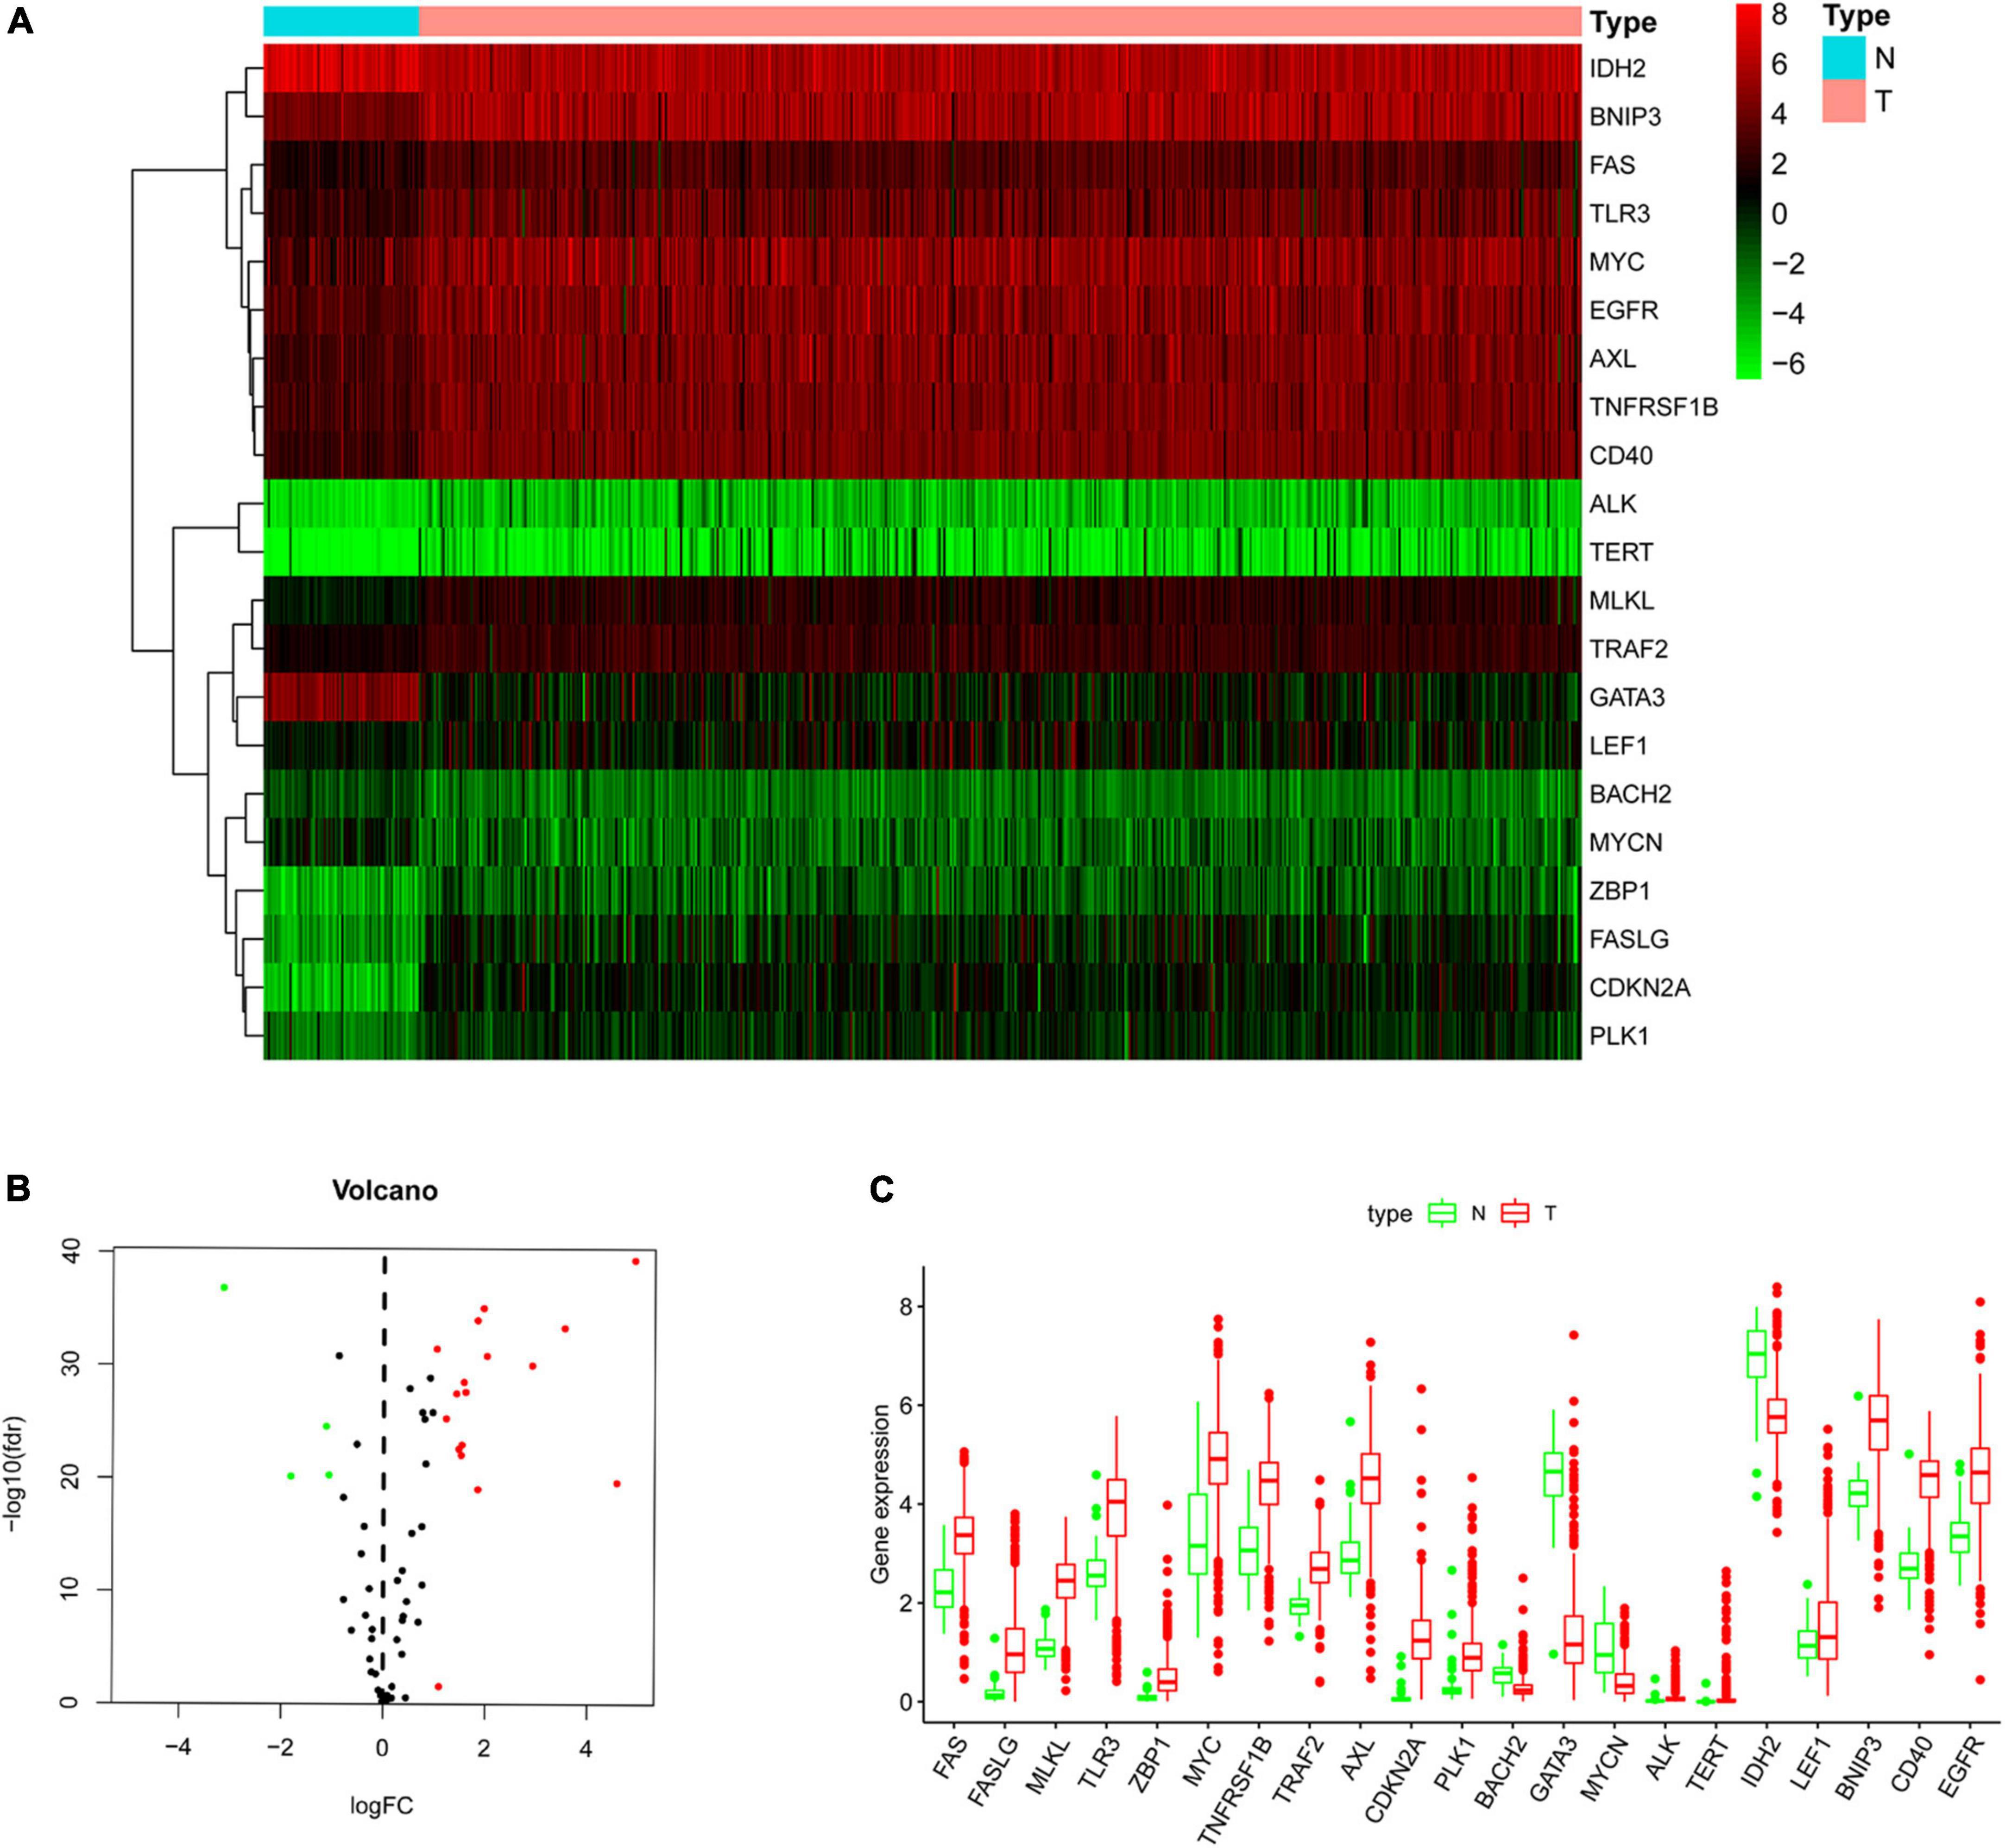
Figure 1. Differentially expressed NRGs in non-tumor and clear cell renal cell carcinoma (ccRCC) tissues. (A) Heatmap demonstrating 21 differentially expressed genes; (B) volcano map demonstrating 21 differentially expressed genes; (C) box plot of genes in non-tumor and ccRCC tissues. Green and red show non-tumor and tumor tissues, respectively.
Enrichment analysis
Based on the differential expression of NRGs, KEGG, and GO enrichment analyses were performed. NRGs were found to be associated with the following KEGG pathways: platinum drug resistance, bladder cancer, apoptosis, p53 signaling pathway, pancreatic cancer, hepatitis B, erbB signaling pathway, apoptosis-multiple species, interleukin 17 (IL-17) signaling pathway, and endocrine resistance (Figure 2A). The results are shown in Figures 2B–D. The top 10 terms of biological process (BP), cellular component (CC), and molecular function (MF) are shown in Figure 3A, including positive regulation of intracellular transport, neuronal death, regulation of intracellular protein transport, positive regulation of intracellular protein transport, regulation of cytokine-mediated signaling pathway, regulation of neuronal death, regulation of response to cytokine stimulus, cell growth, positive regulation of cellular protein localization, and positive regulation of peptidyl-serine phosphorylation, implying that these prognosis-related genes are associated with necroptosis. The bubble plot, circle diagram, and heatmap are shown in Figures 3B–D, respectively.
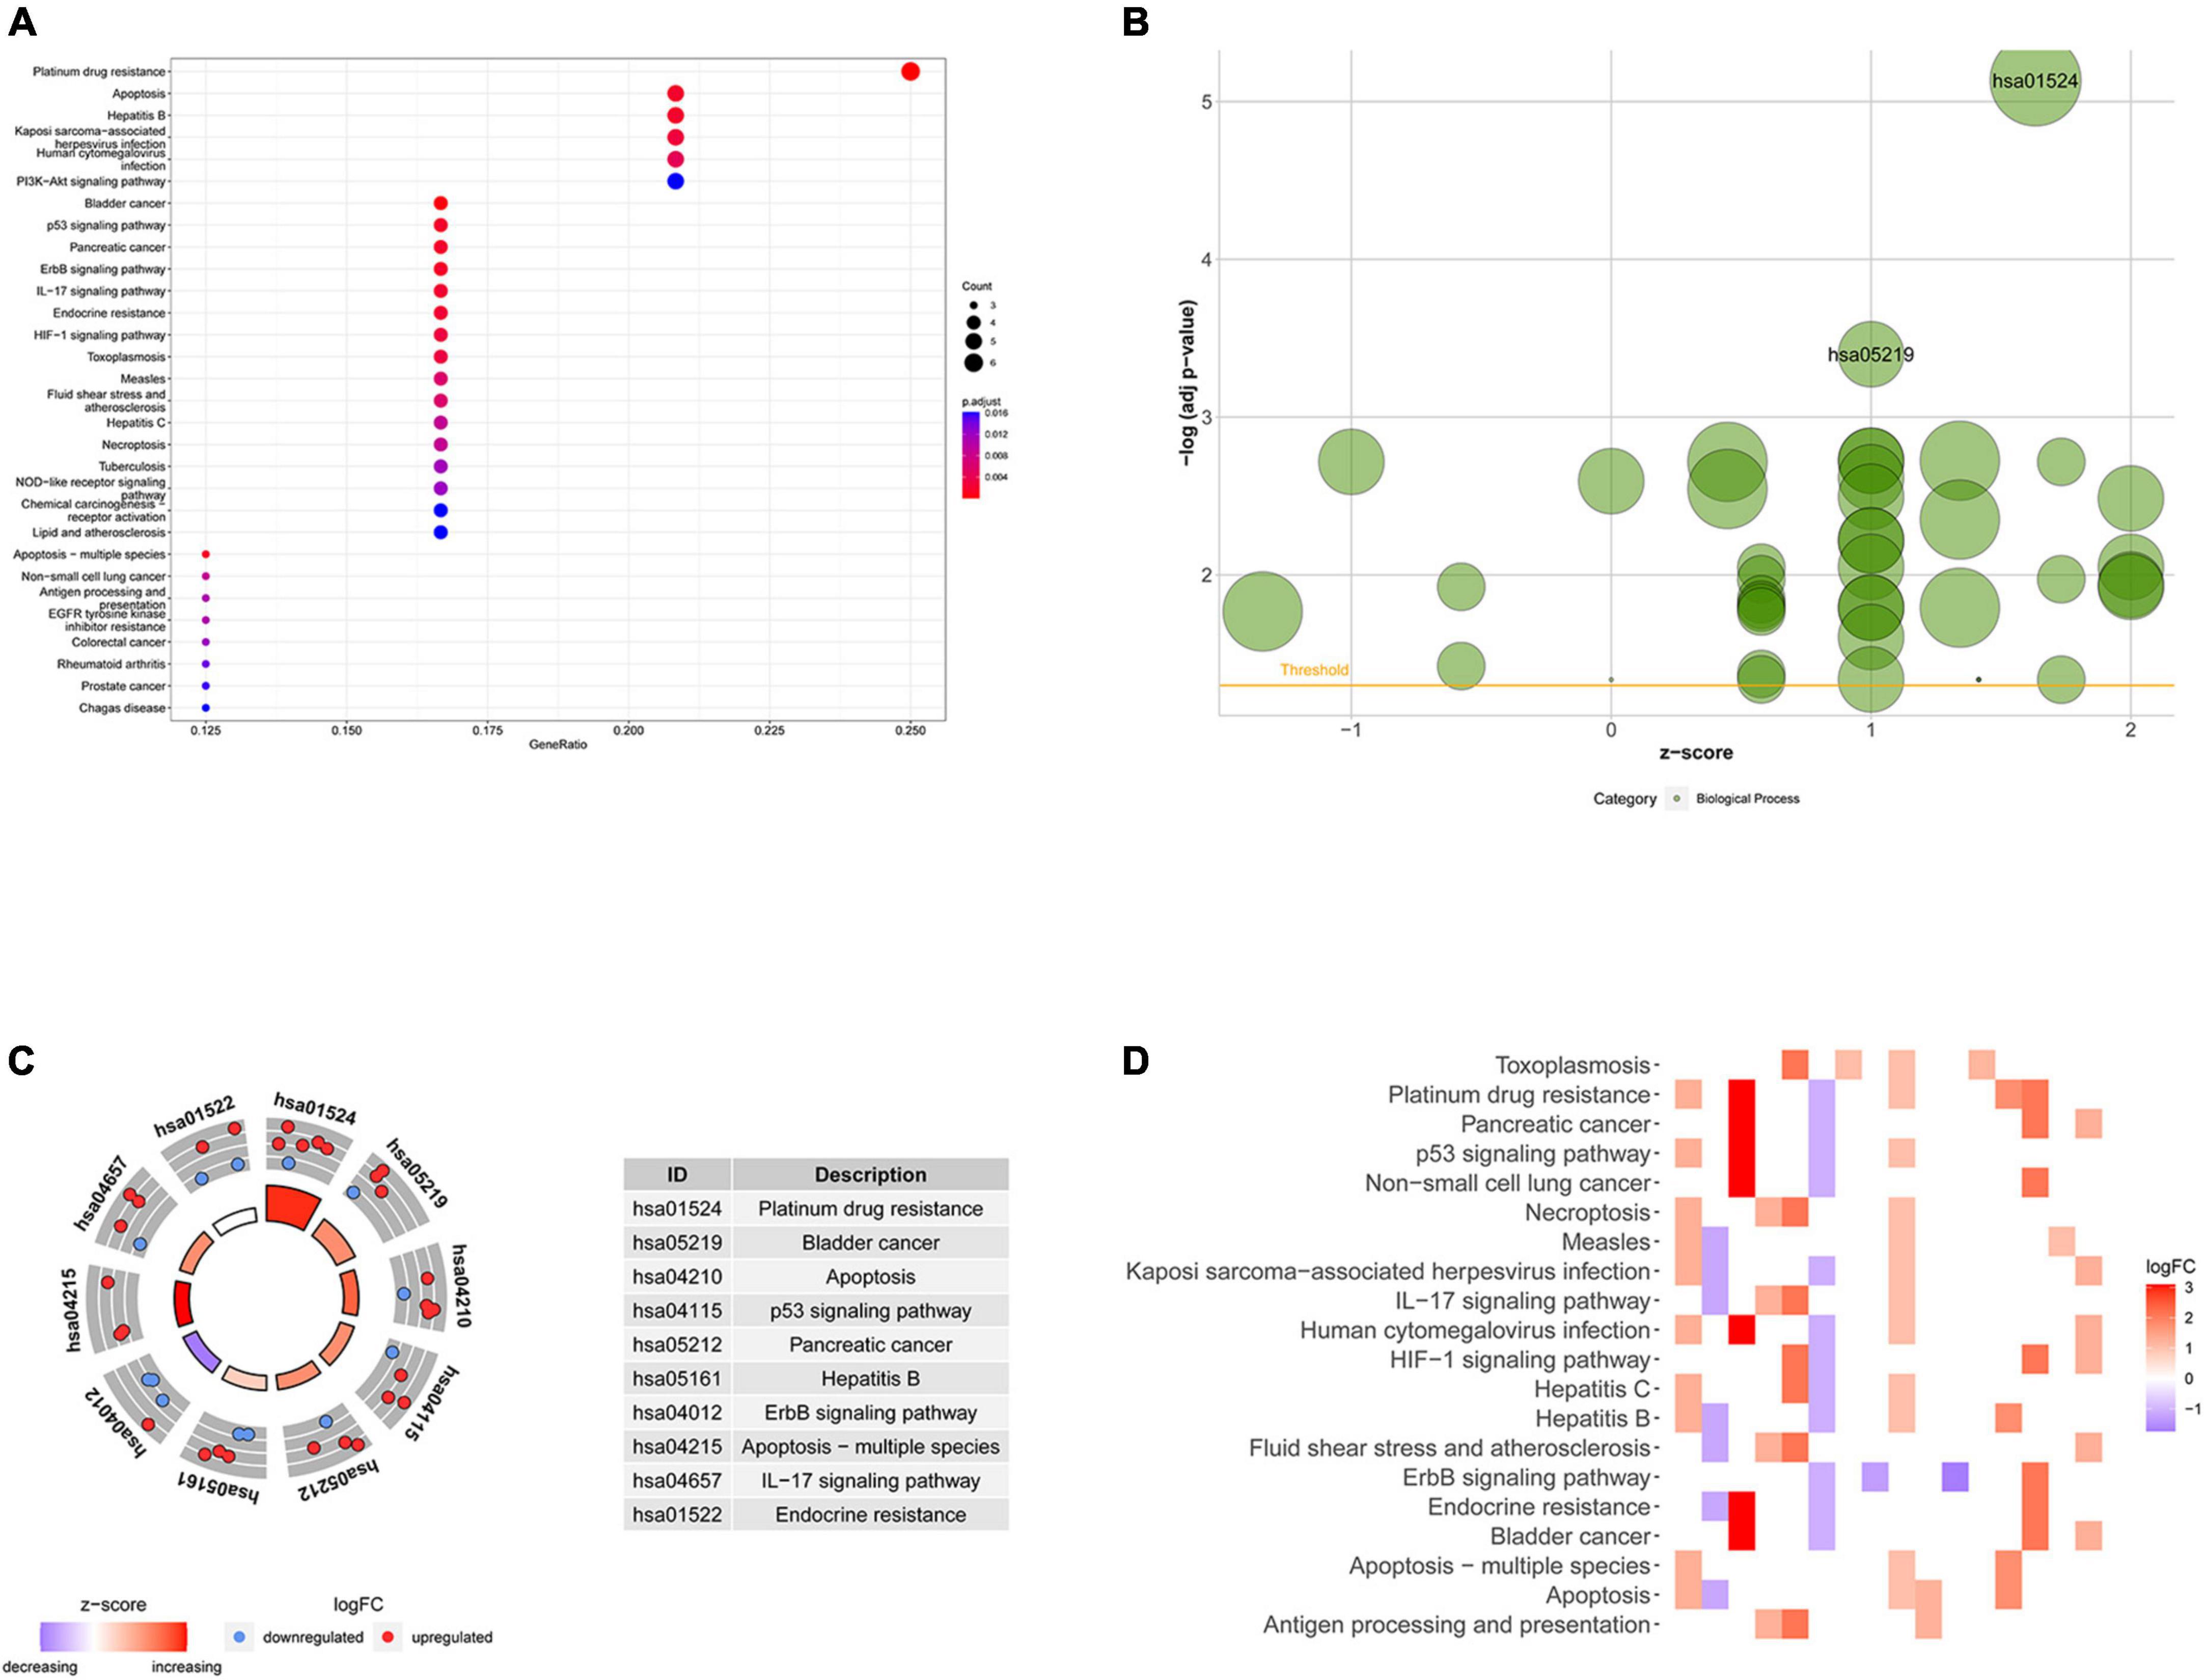
Figure 2. Kyoto Encyclopedia of Genes and Genomes (KEGG) analysis of differentially expressed necroptosis-related genes (NRGs). (A) Bubble chart of the top 30 enrichment pathways; (B) bubble diagram of enriched KEGG pathways; (C) circle diagram of enriched KEGG pathways; (D) heatmap of enrichment analysis. The color of each block represents the | log2 (FC)| values.
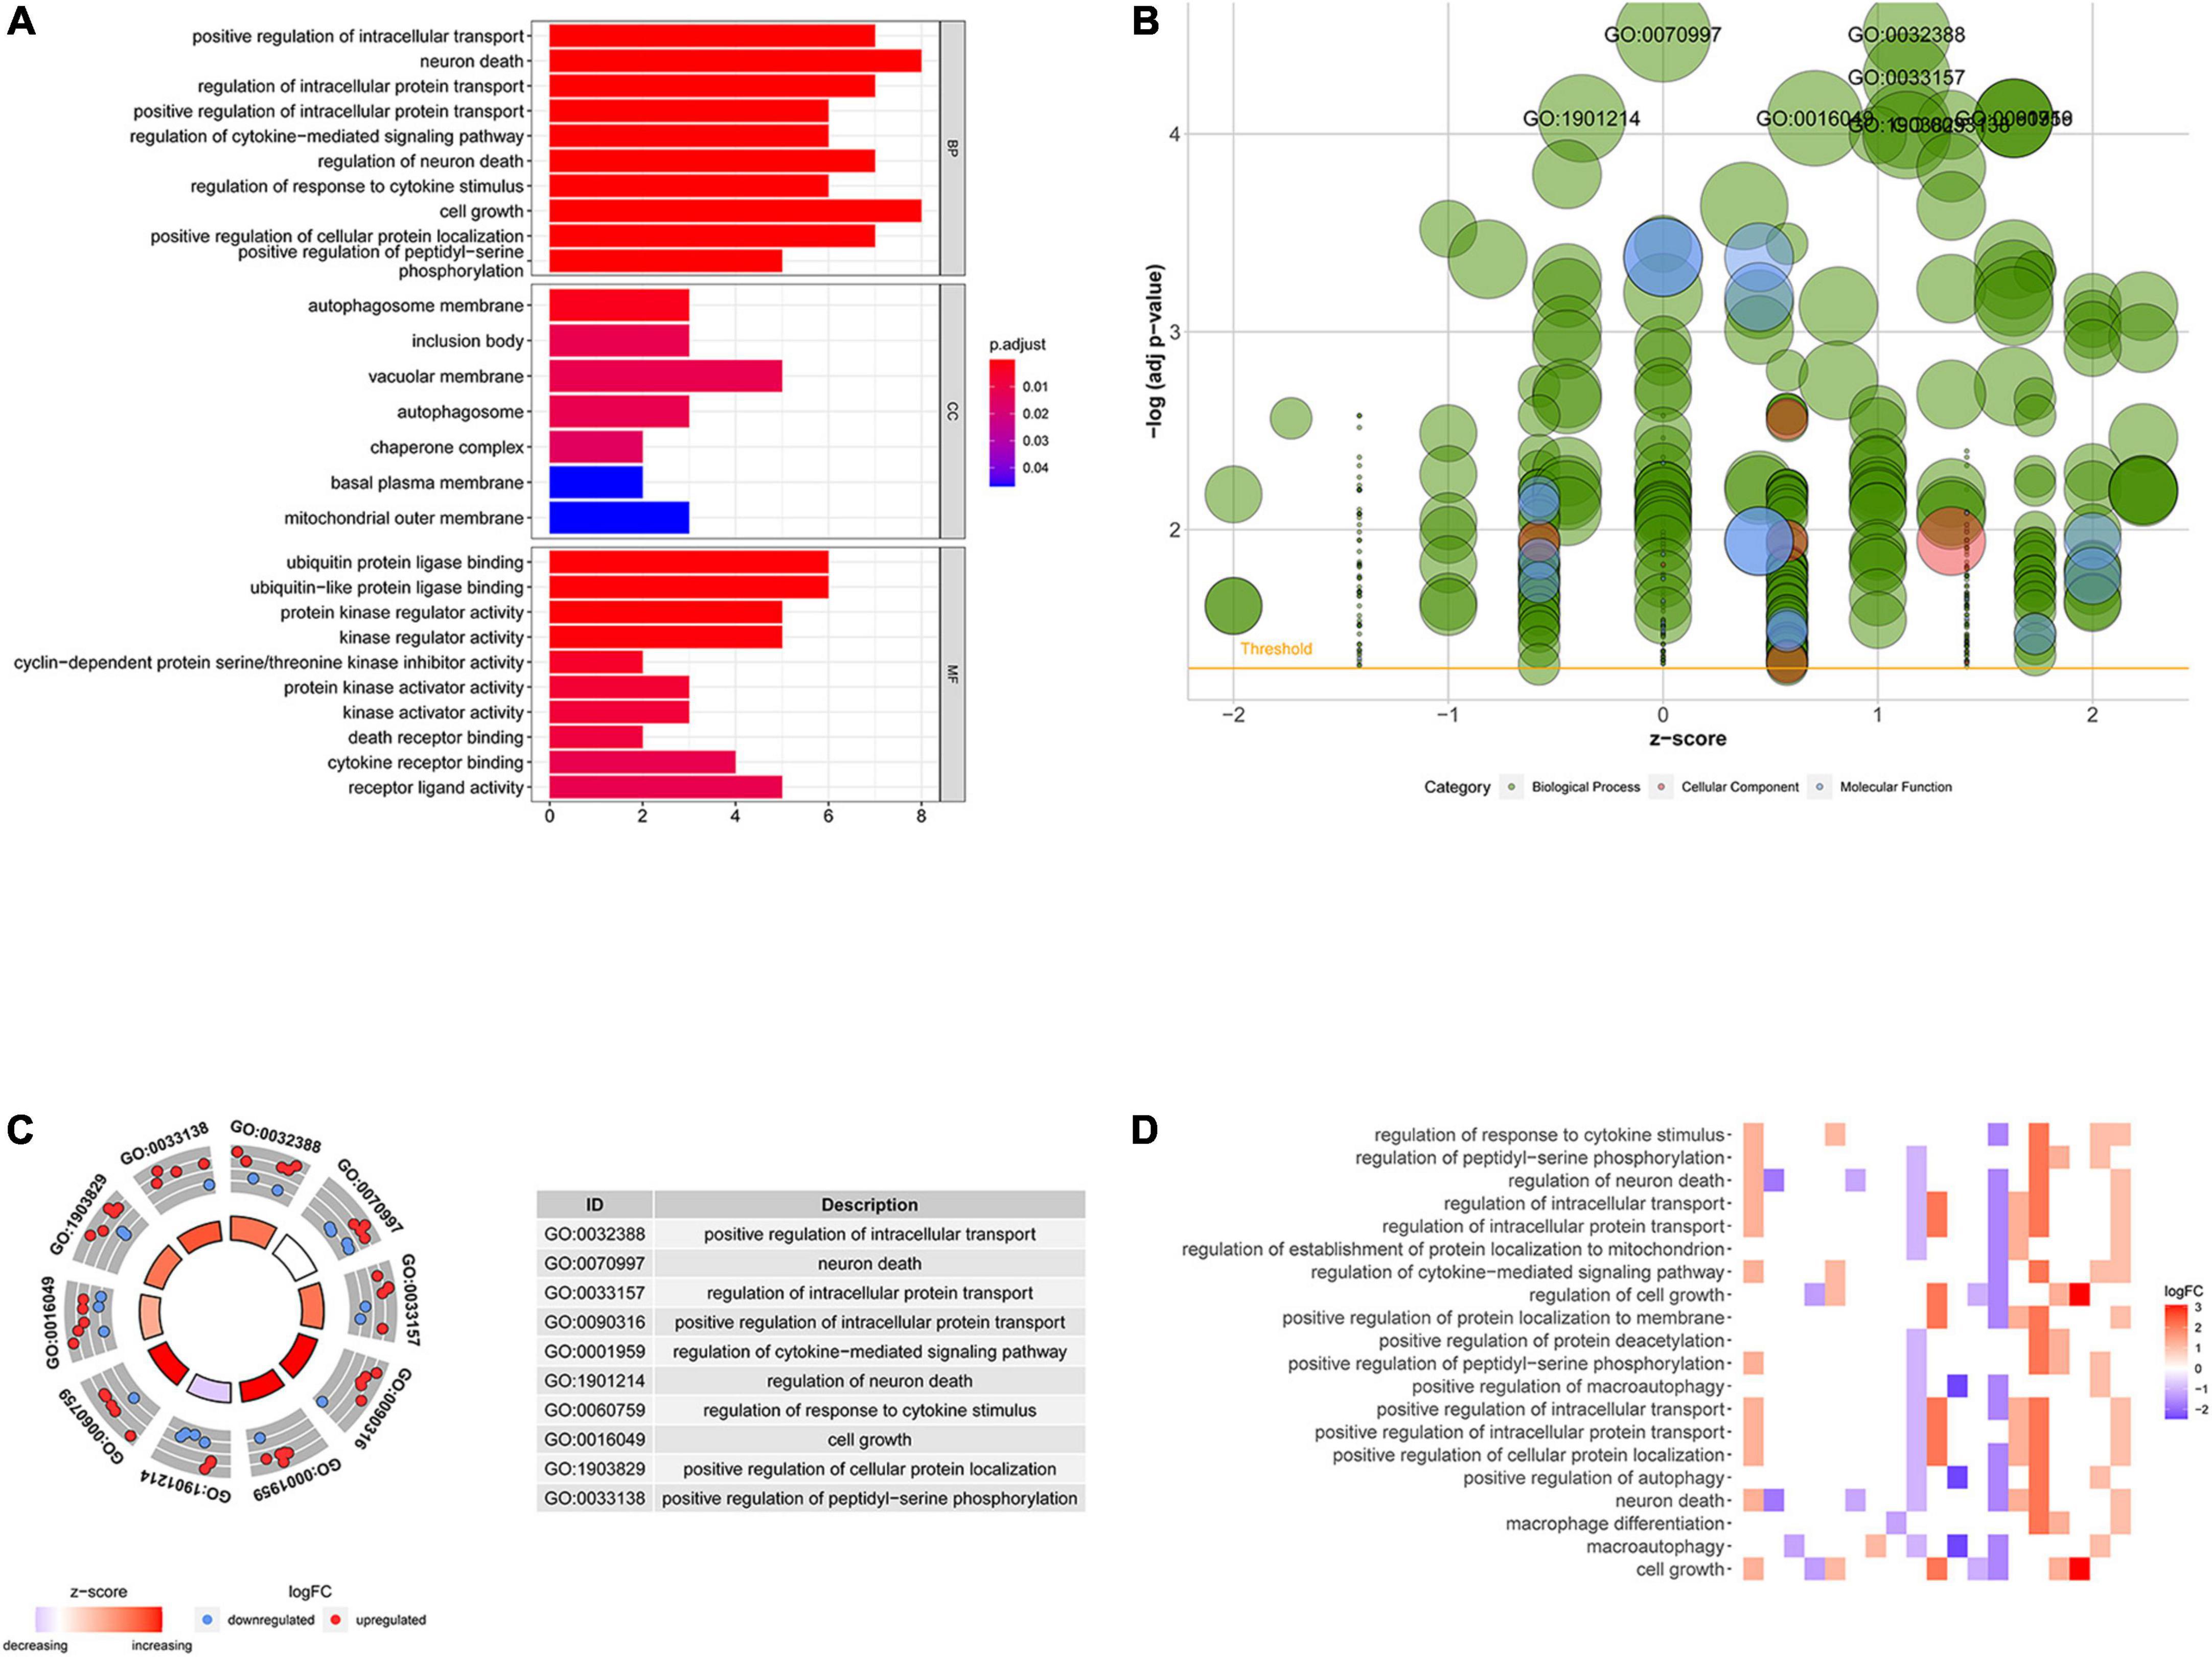
Figure 3. Gene ontology (GO) analysis of differentially expressed NRGs. (A) Histogram demonstrating the top 10 enrichment pathways in biological process (BP), cellular component (CC), molecular function (MF); (B) bubble plot of GO terms; red denotes cellular components, green denotes biological processes and blue denotes molecular functions; (C) circle diagram demonstrating the top 10 significant enriched pathways; (D) heatmap demonstrating the relationship between NRGs and GO enrichment. The color of each block represents the | log2 (FC)| values.
Identification of prognosis-related necroptosis-related genes
Results of univariate Cox regression analysis showed that a total of 11 NRGs were significantly associated with OS (Figure 4). Thereafter, 4 NRGs were selected via multivariate Cox regression analysis for constructing a prognostic signature for OS (Table 1). OS-related prediction model = (0.2407*TRAF2 expression) + (0.5846*PLK1 expression) + (–0.9912*MYCN expression) + (–0.1837*BNIP3 expression).
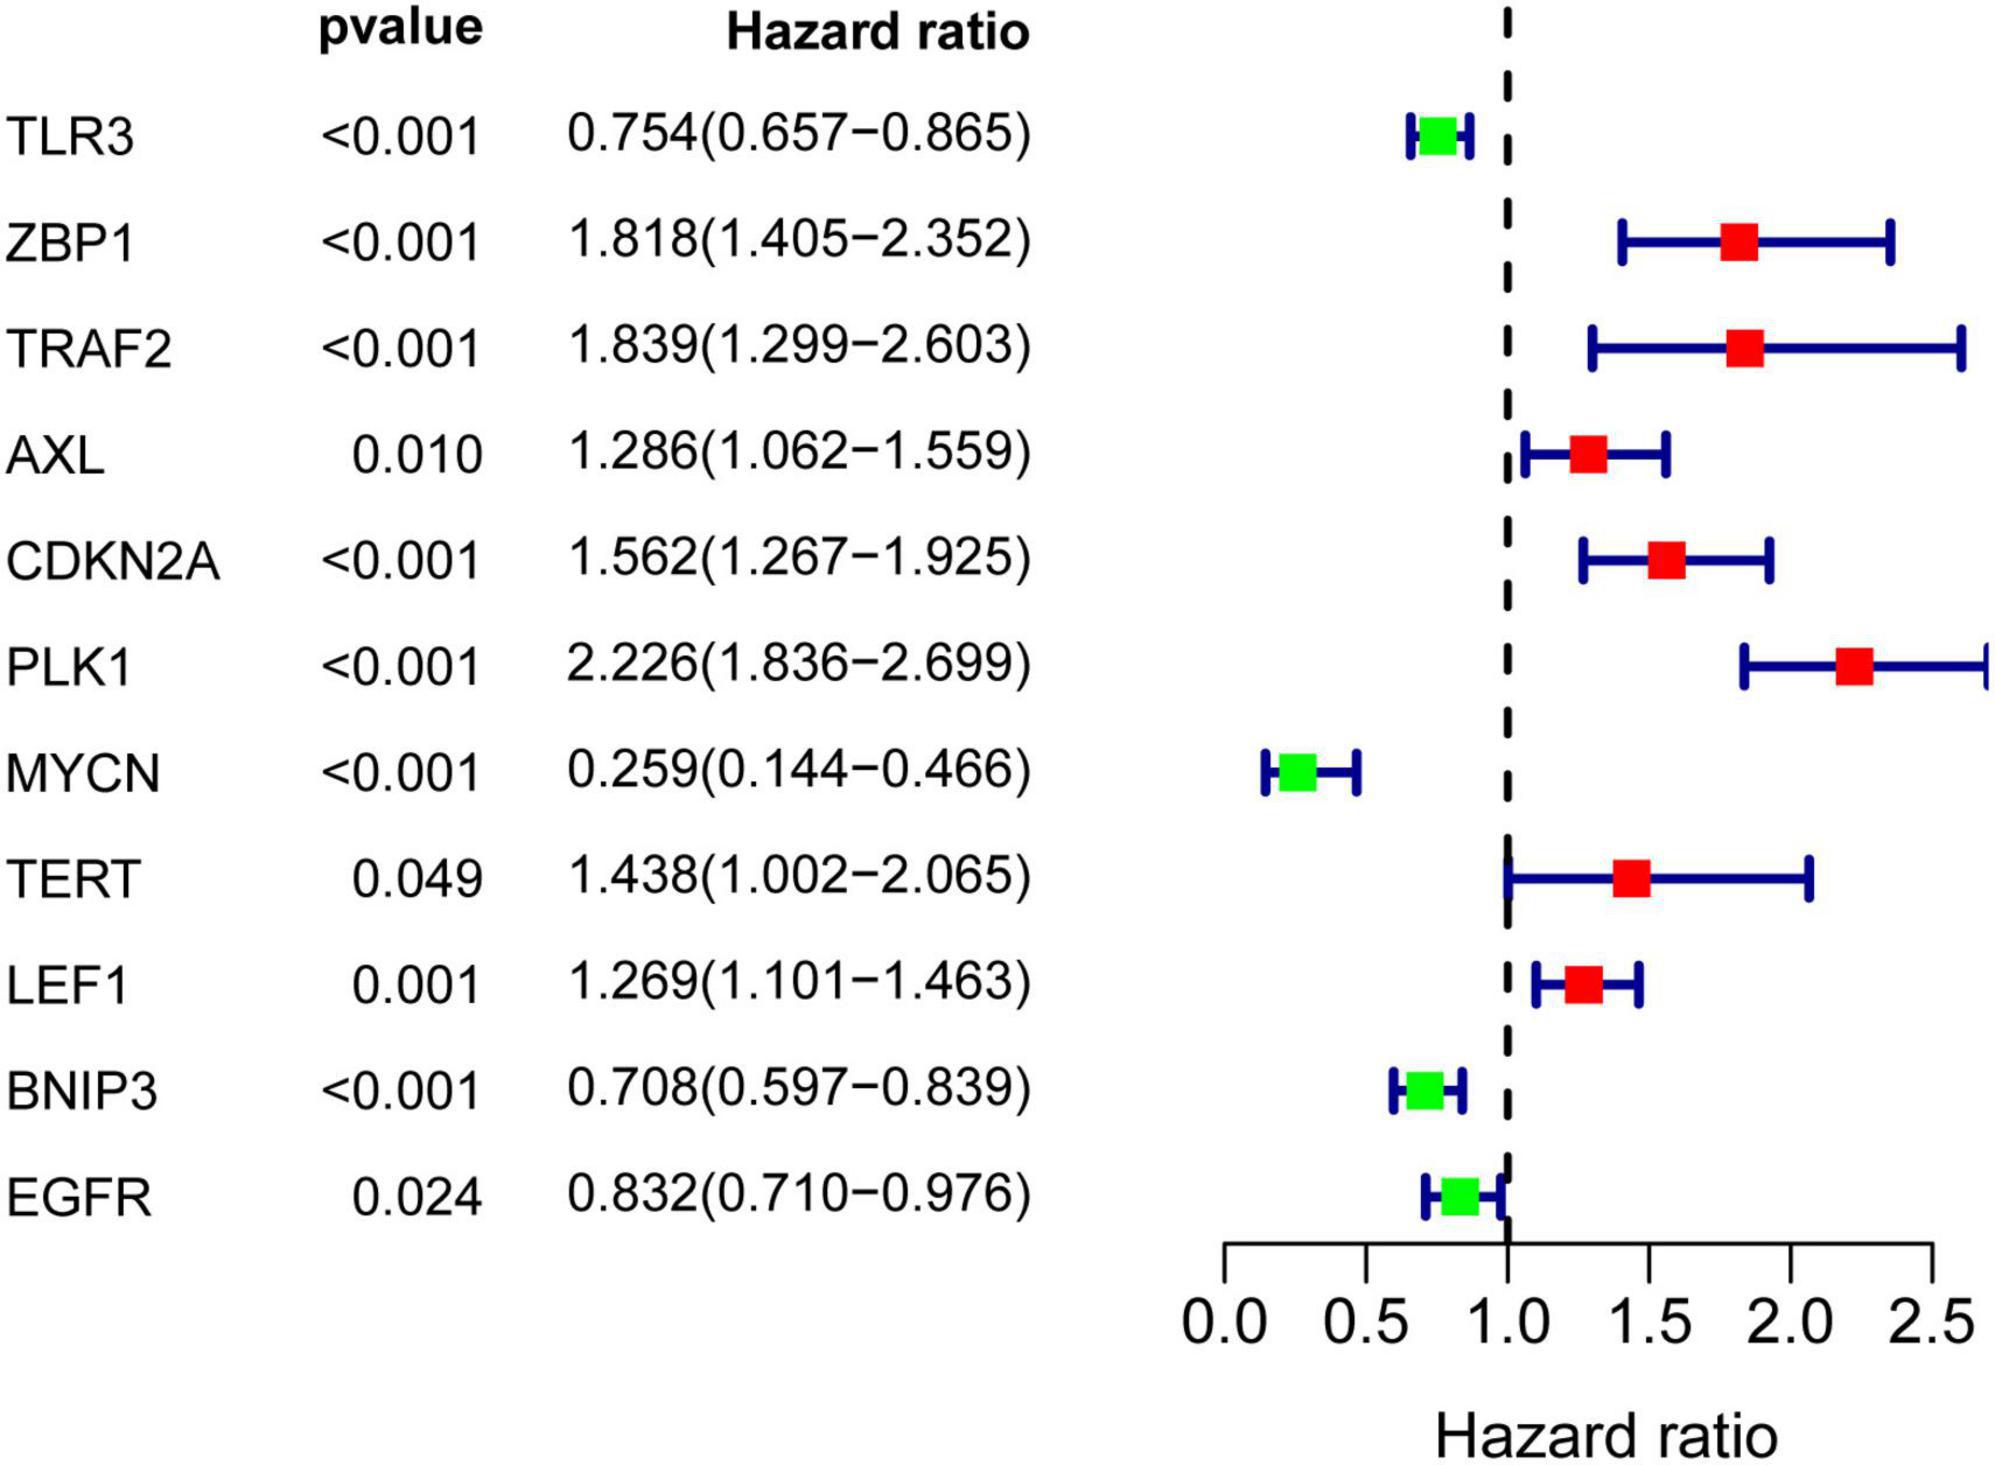
Figure 4. Univariate Cox regression analysis of differentially expressed NRGs.
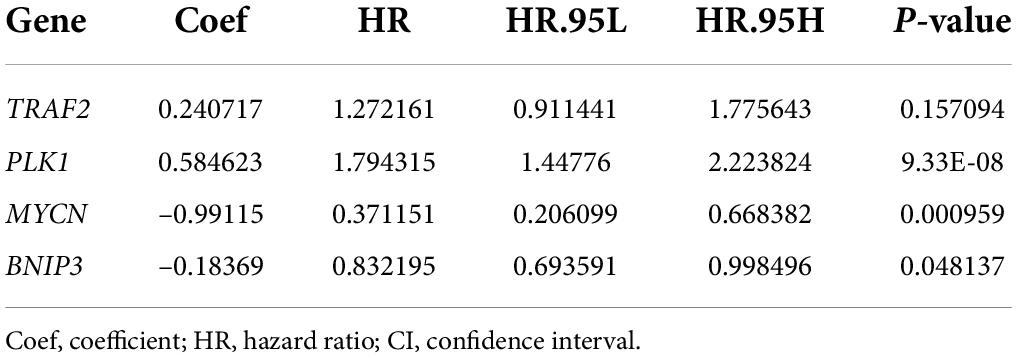
Table 1. Multivariate Cox regression analysis of prognostic necroptosis-related genes (NRGs).
Construction of prognosis prediction model
All patients with ccRCC were divided into high-risk and low-risk groups according to the median risk score (Figure 5B). The scatter diagram shows the survival status of the patients (Figure 5C). The results showed that the patients in low-risk groups had a longer survival time than those in the high-risk groups (p = 2.405e-08, Figure 5A). The heatmap showed the expression of the four genes in the high- and low-risk groups (Figure 5D). Furthermore, we used Cox regression analysis to assess the precision of the prognosis model. Except for sex, other factors were significantly correlated with OS in univariate Cox regression analysis (Figures 5E,I). Multivariate Cox regression analysis showed that age and risk score could be used as independent factors and affected the prognosis of ccRCC. Then, we performed the ROC analysis. The AUC was 0.717, demonstrating excellent predictive precision of the model (Figure 5H). PCA and t-SNE analysis revealed a significant distribution difference in the patients with different risk scores (Figures 5F,G).
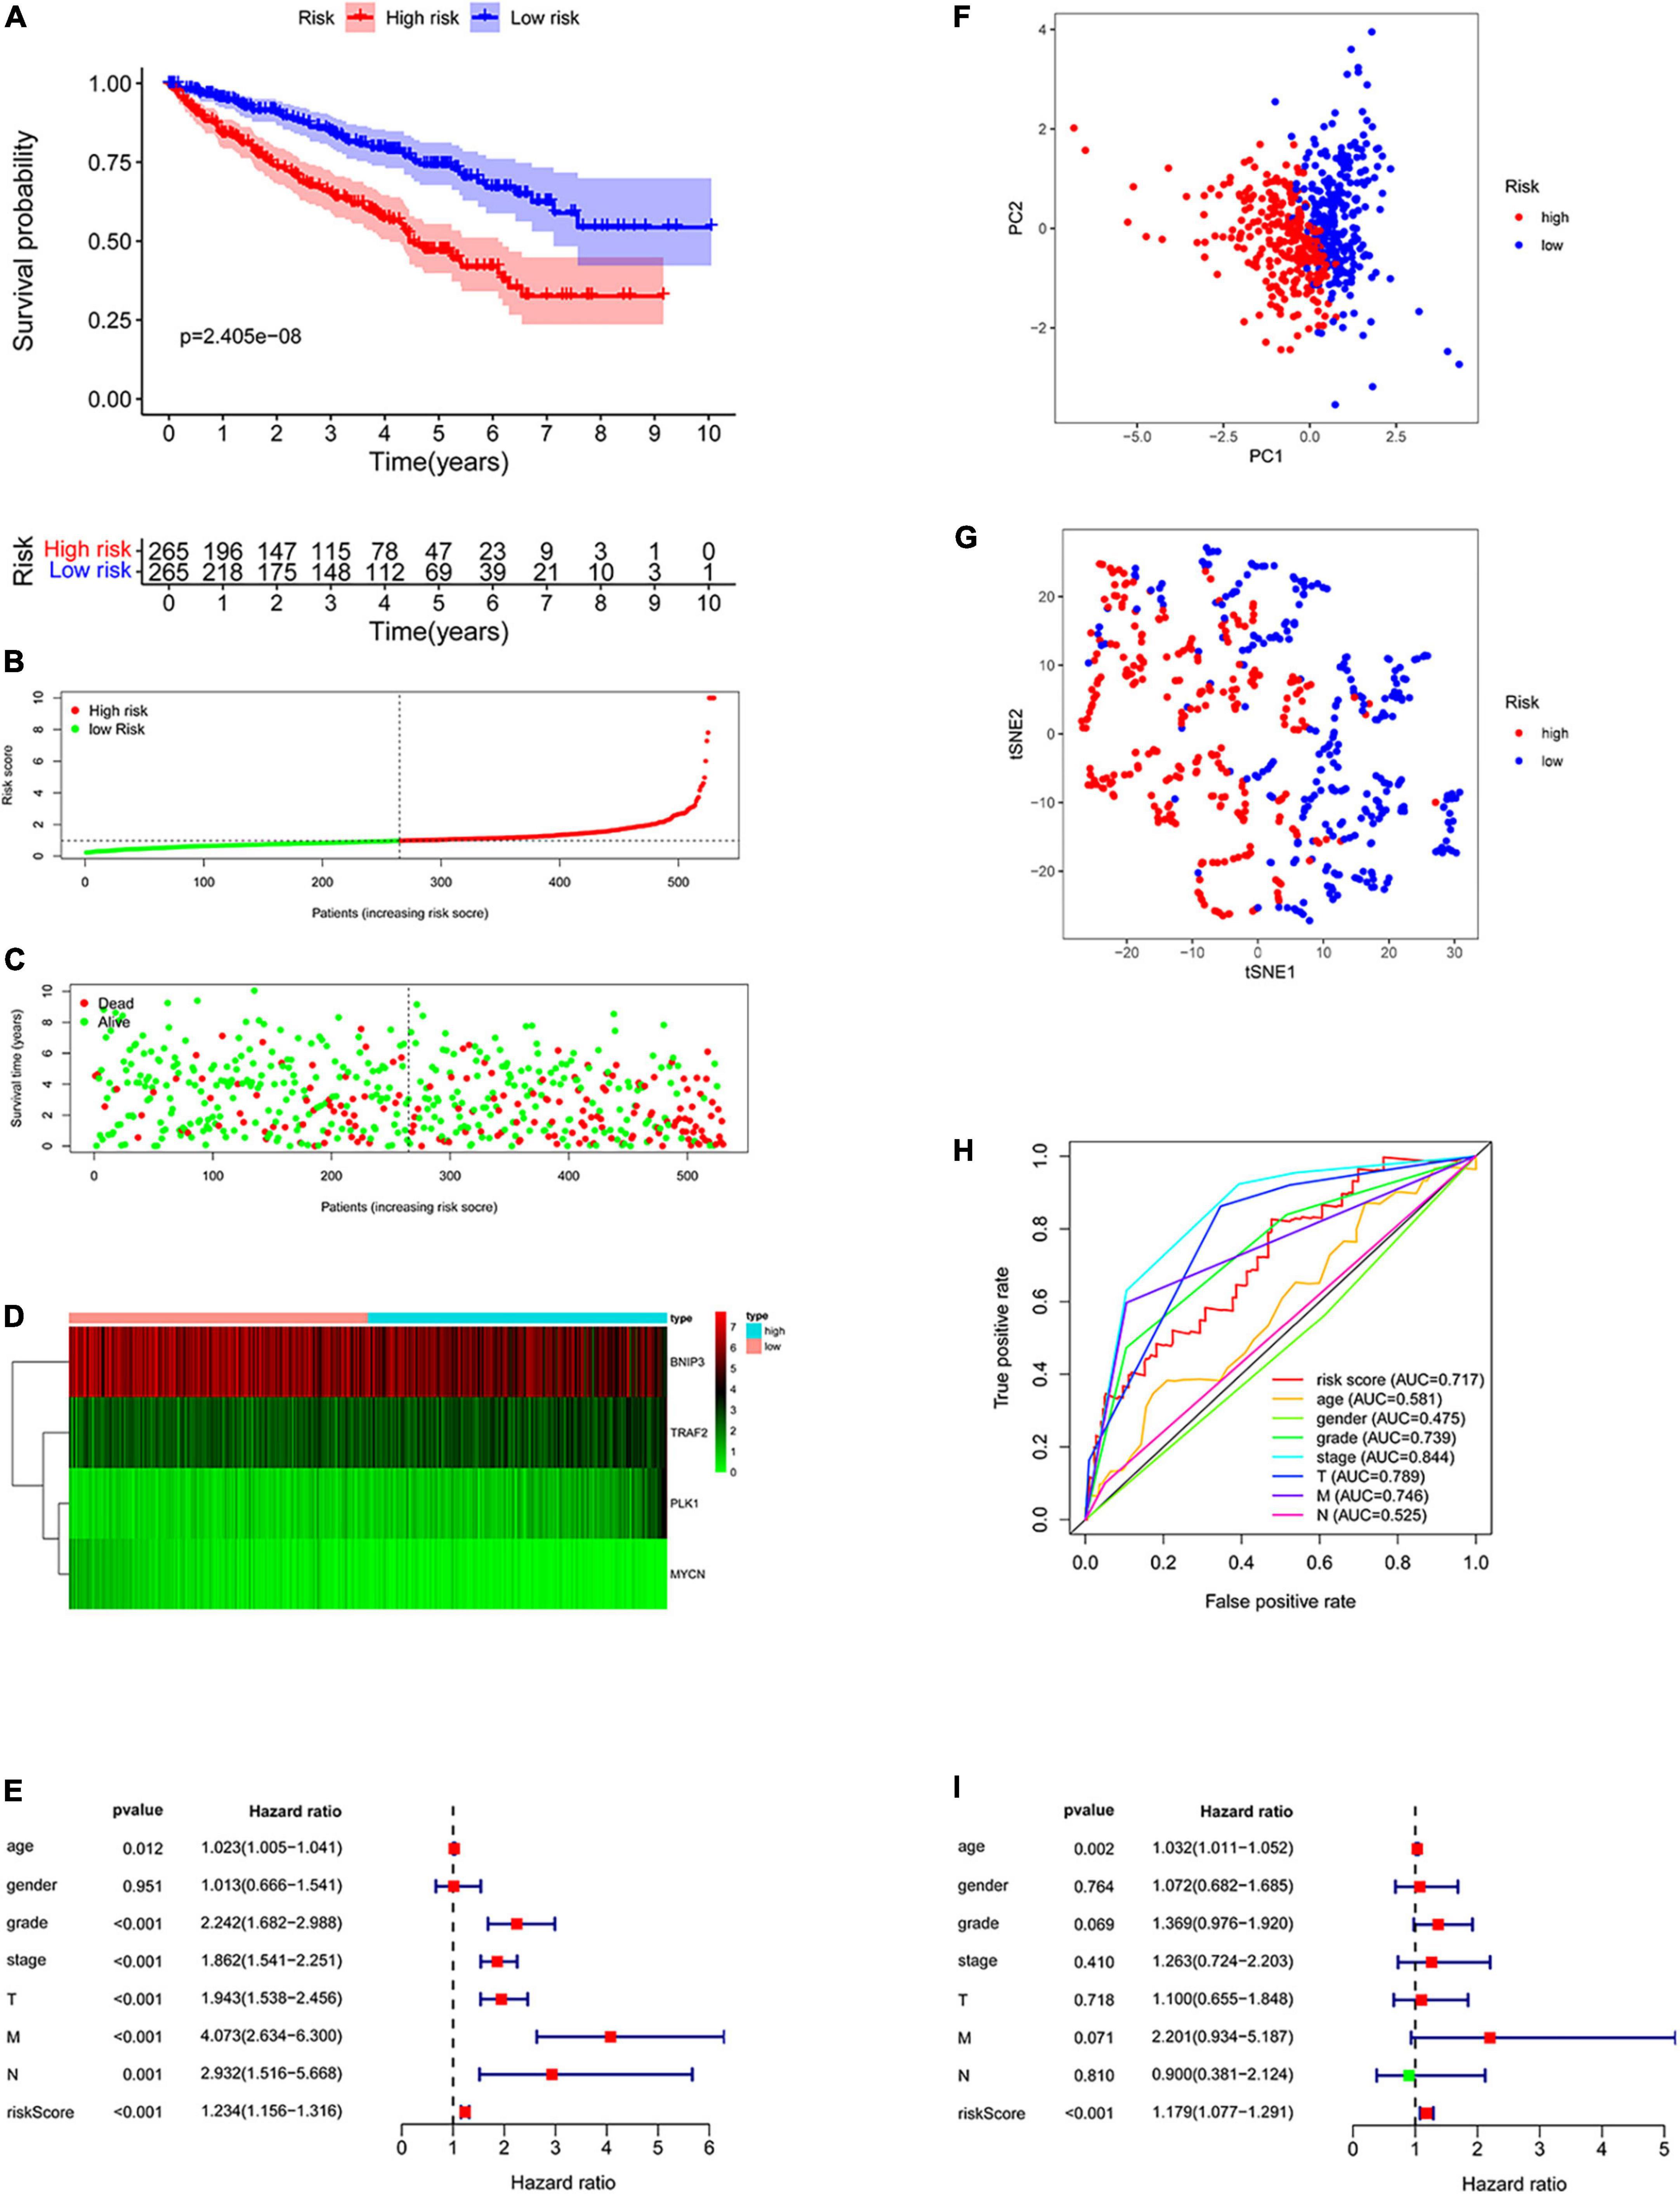
Figure 5. Construction of the prognostic prediction model. (A) The Kaplan–Meier survival curve of low-risk groups; (B) prognostic model distribution of patients with ccRCC; (C) the survival status of patients in the low- and high-risk groups; (D) the expression of the four NRGs; (E) univariate Cox regression analysis; (F) principal component analysis (PCA) plot of the prognosis model; (G) t-distributed stochastic neighbor embedding (t-SNE) analysis of the prognosis model; (H) receiver operating characteristic (ROC) curve showing the predictive precision of the prognosis model; (I) multivariate Cox regression analysis.
Stratified analysis of different subgroups
The prognosis prediction model could predict OS in different subgroups divided based on age (≤ 65 years and > 65 years), sex (men and women), tumor grade (Grade 1–2 and Grade 3–4), M stage (M0 and M1), tumor stage (Stage I–II and Stage III–IV), and T stage (T 1–2 and T 3–4 stage) (all p < 0.05, Figure 6). The model constructed using the four NRGs could predict the prognosis of patients with ccRCC without using clinicopathological factors.
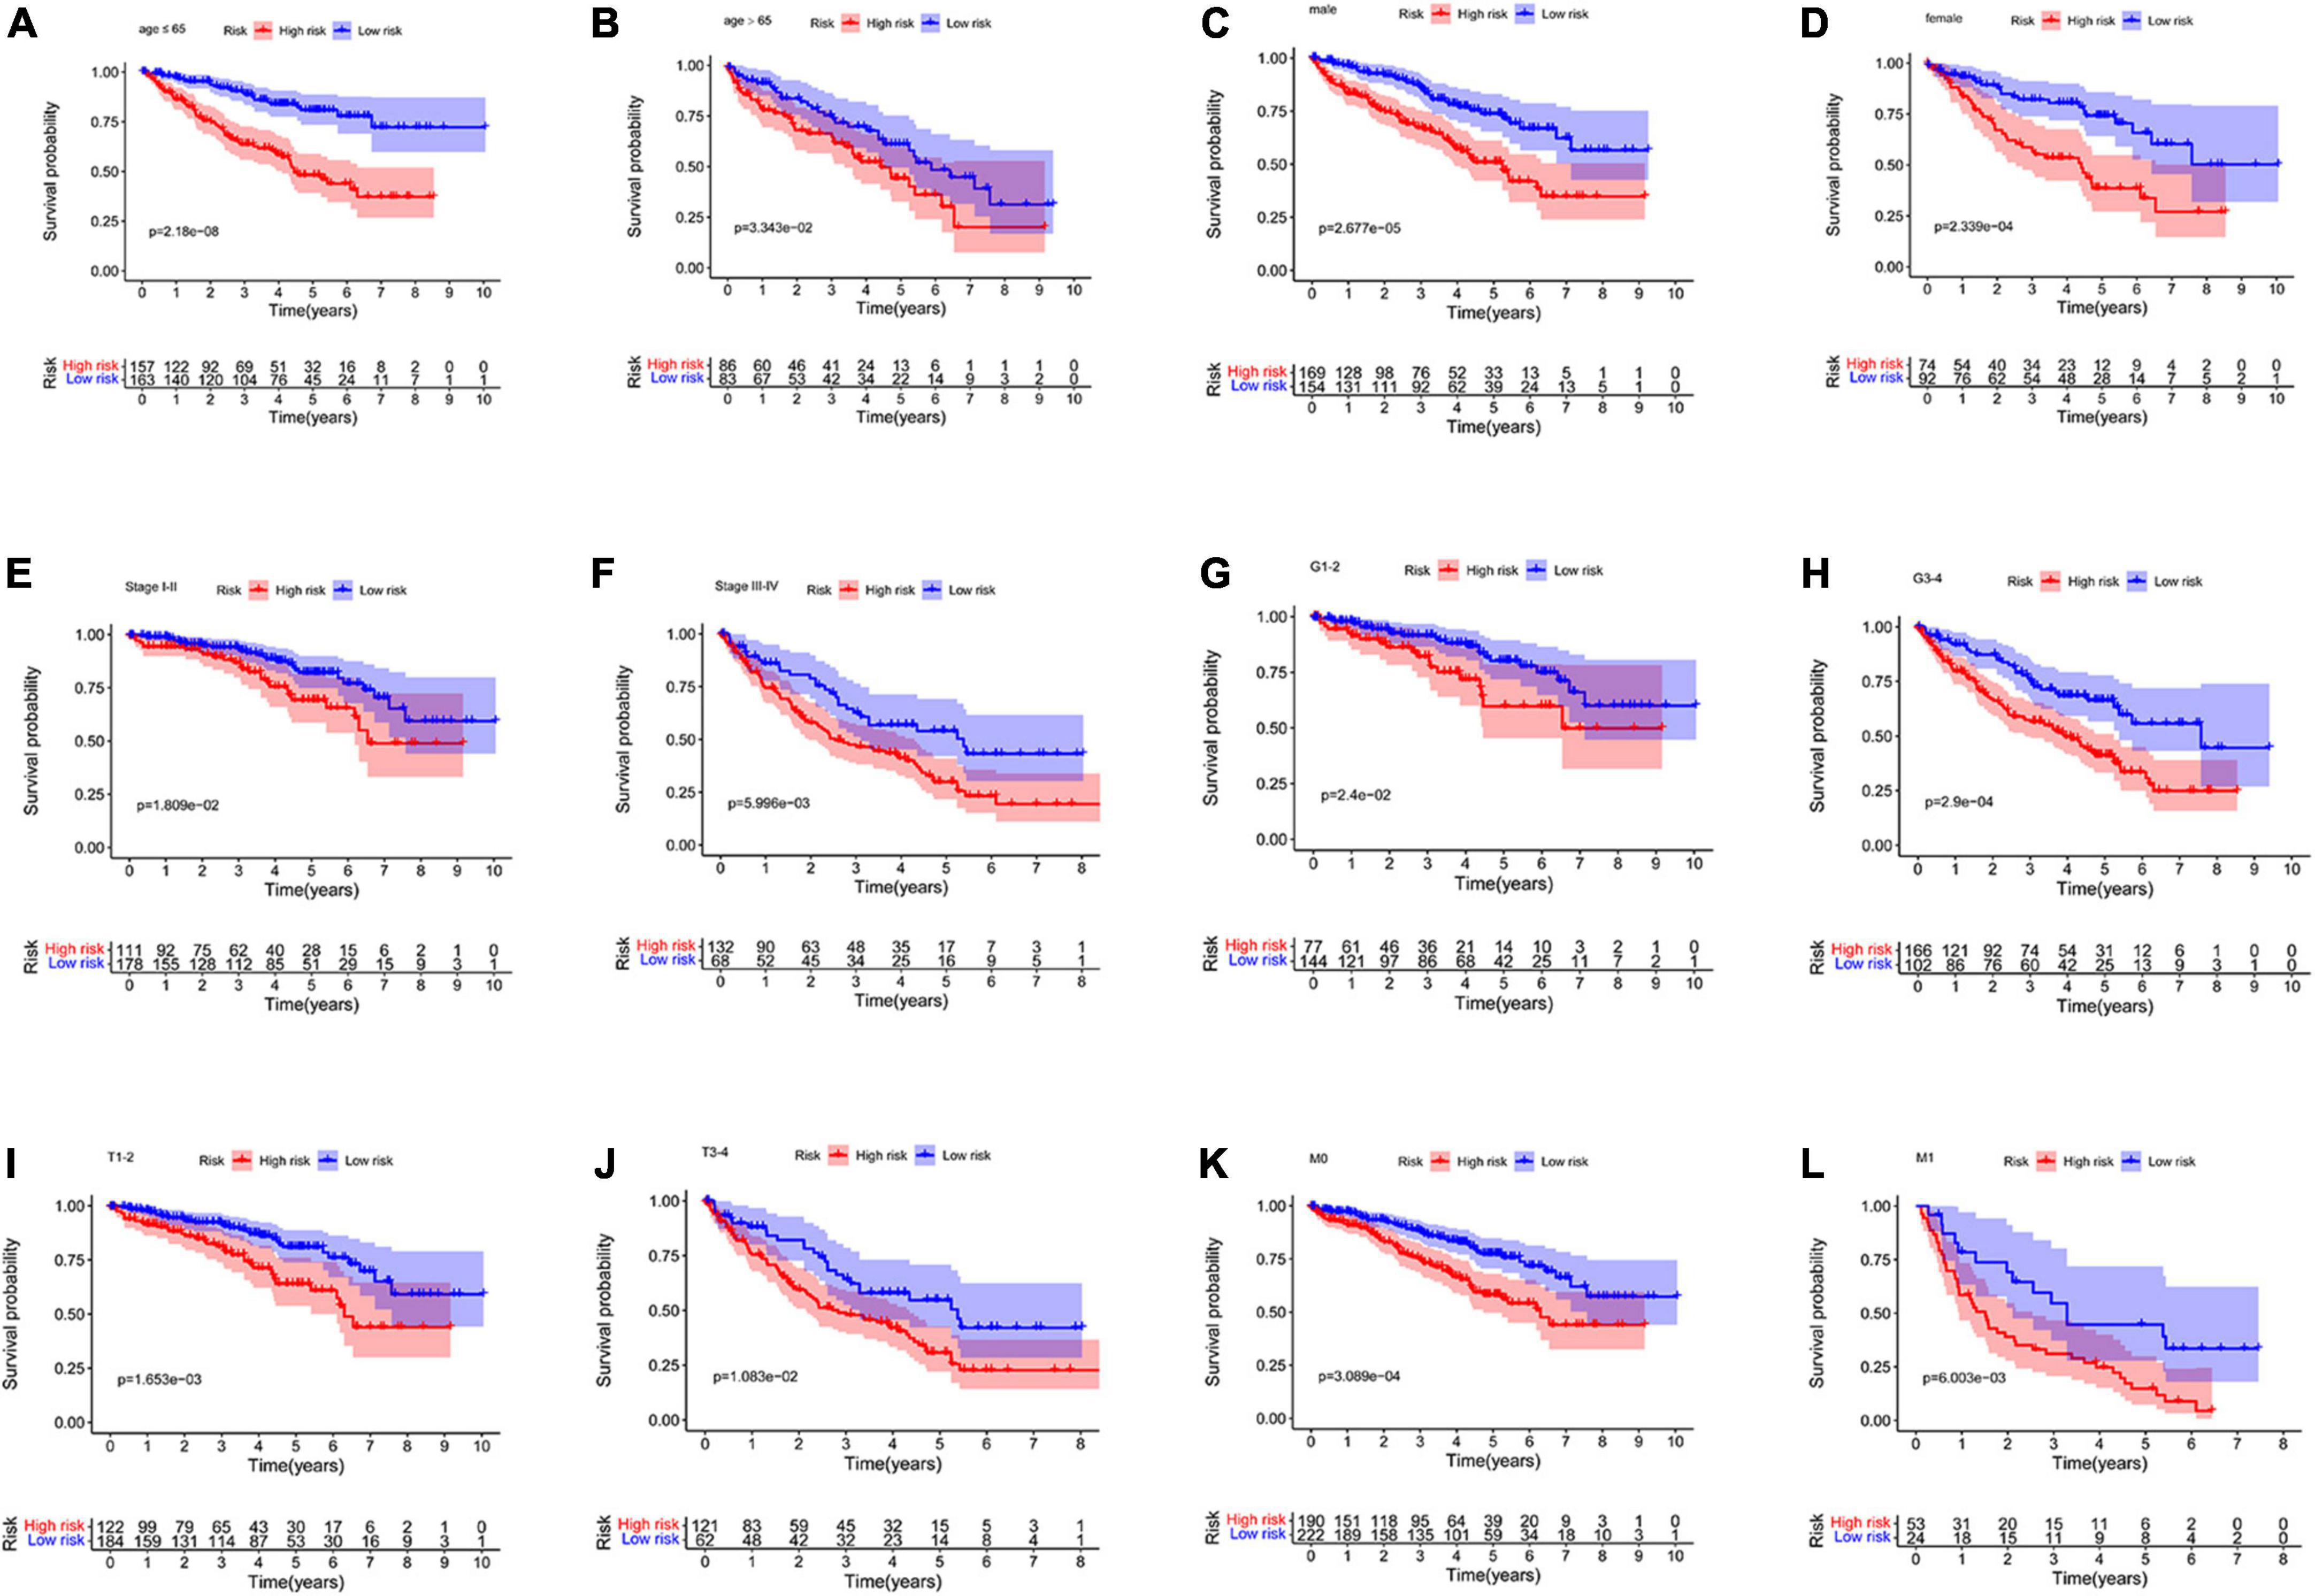
Figure 6. Kaplan–Meier curves for the high- and low-risk groups in different subgroups. (A) age ≤ 65 years; (B) age > 65 years; (C) men; (D) women; (E) stage I–II; (F) stage III–IV; (G) grade 1–2; (H) grade 3–4; (I) T 1–2; (J) T 3–4; (K) M0; (L) M1. M, metastasis; T, tumor size.
Clinical correlation analysis
To investigate the clinical value of the necroptosis-related prognostic signature in ccRCC, we analyzed the correlations among the 4 NRGs, necroptosis-related prognostic signature, and clinical factors. The results demonstrated that MYCN was significantly associated with age, grade, stage, N, and T (Figures 7A–E); TRAF2 was significantly associated with sex, grade, N, and M (Figures 7F–I); BNIP3 was significantly associated with sex, grade, stage, and T (Figures 7J–M). In addition, risk score and PLK1 were both significantly associated with grade, stage, T, N, and M (Figures 7N–W). The correlations among the 4 NRGs, necroptosis-related prognostic signatures, and clinical factors are shown in Figure 8.
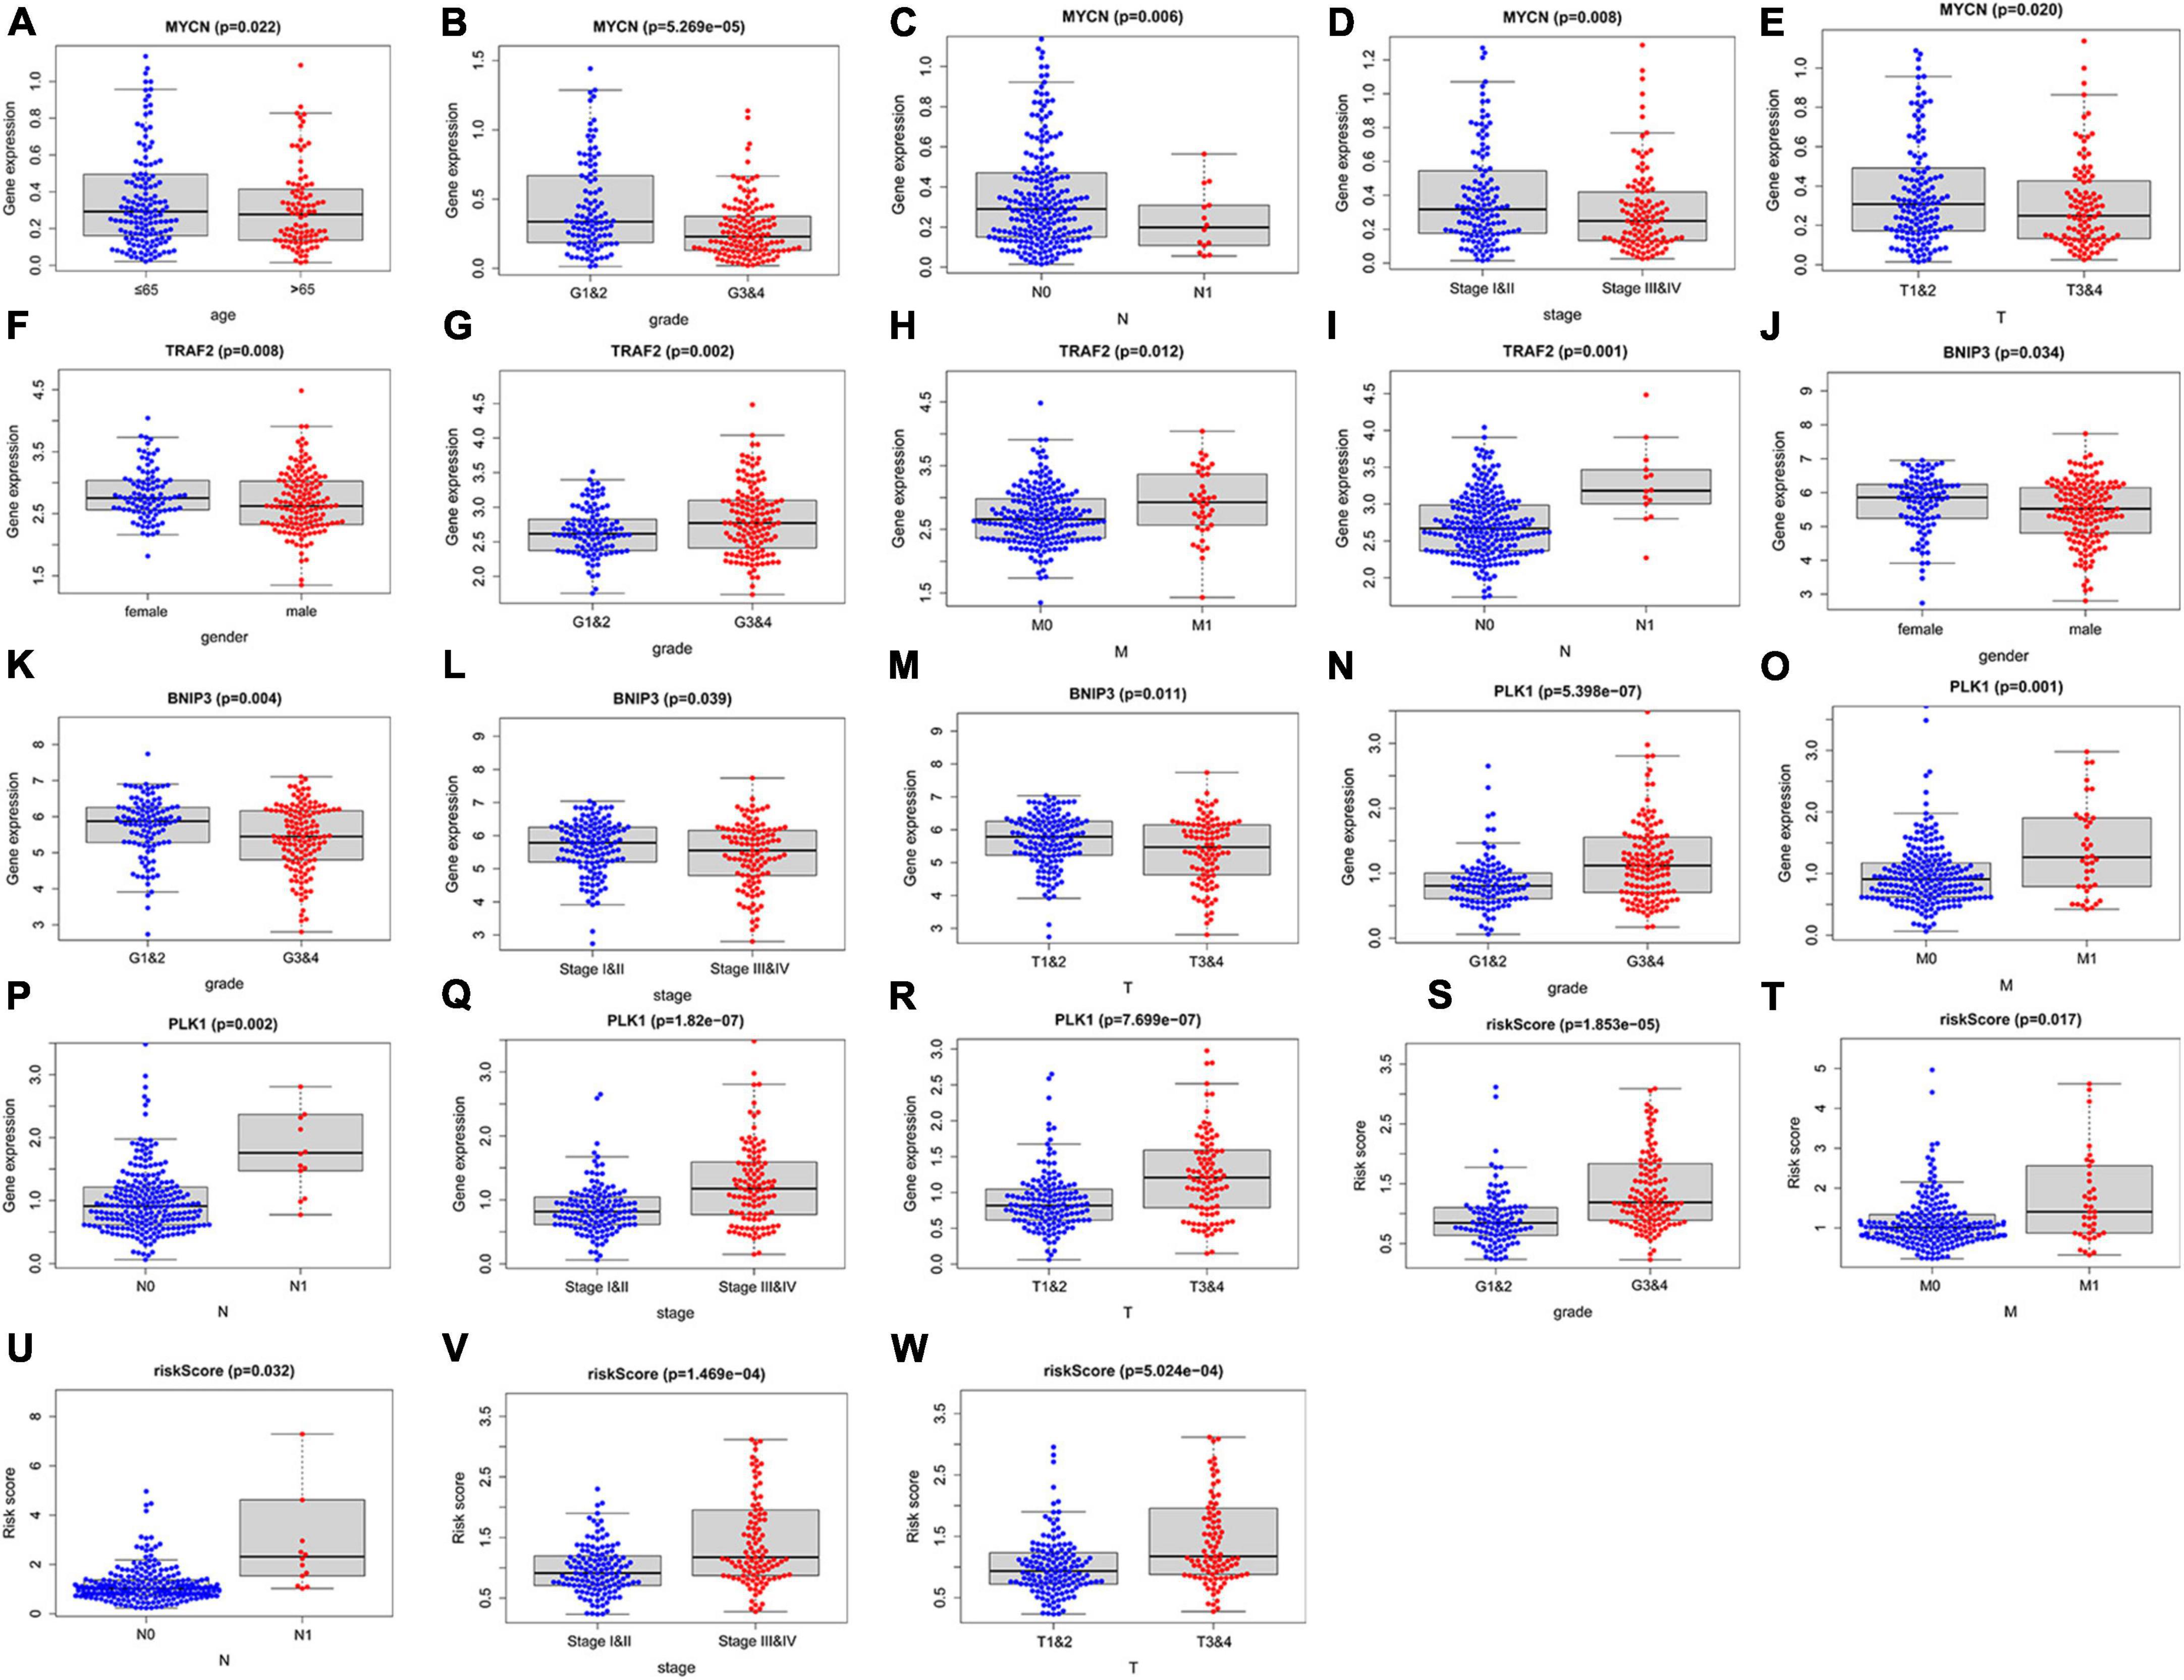
Figure 7. Correlation between the 4 NRGs, necroptosis-related prognostic signature and clinical factors. The expression of MYCN in different groups with different age (A) grade (B), N (C), stage (D), T (E); the expression of TRAF2 in different groups with distinct sex (F), grade (G), M (H), N (I); the expression of BINP2 in different groups with different sex (J), grade (K), stage (L), T (M); the expression of PLK1 and risk-score in different groups with different grade (N,S) M (O,T), N (P,U), stage (Q,V), T (R,W).
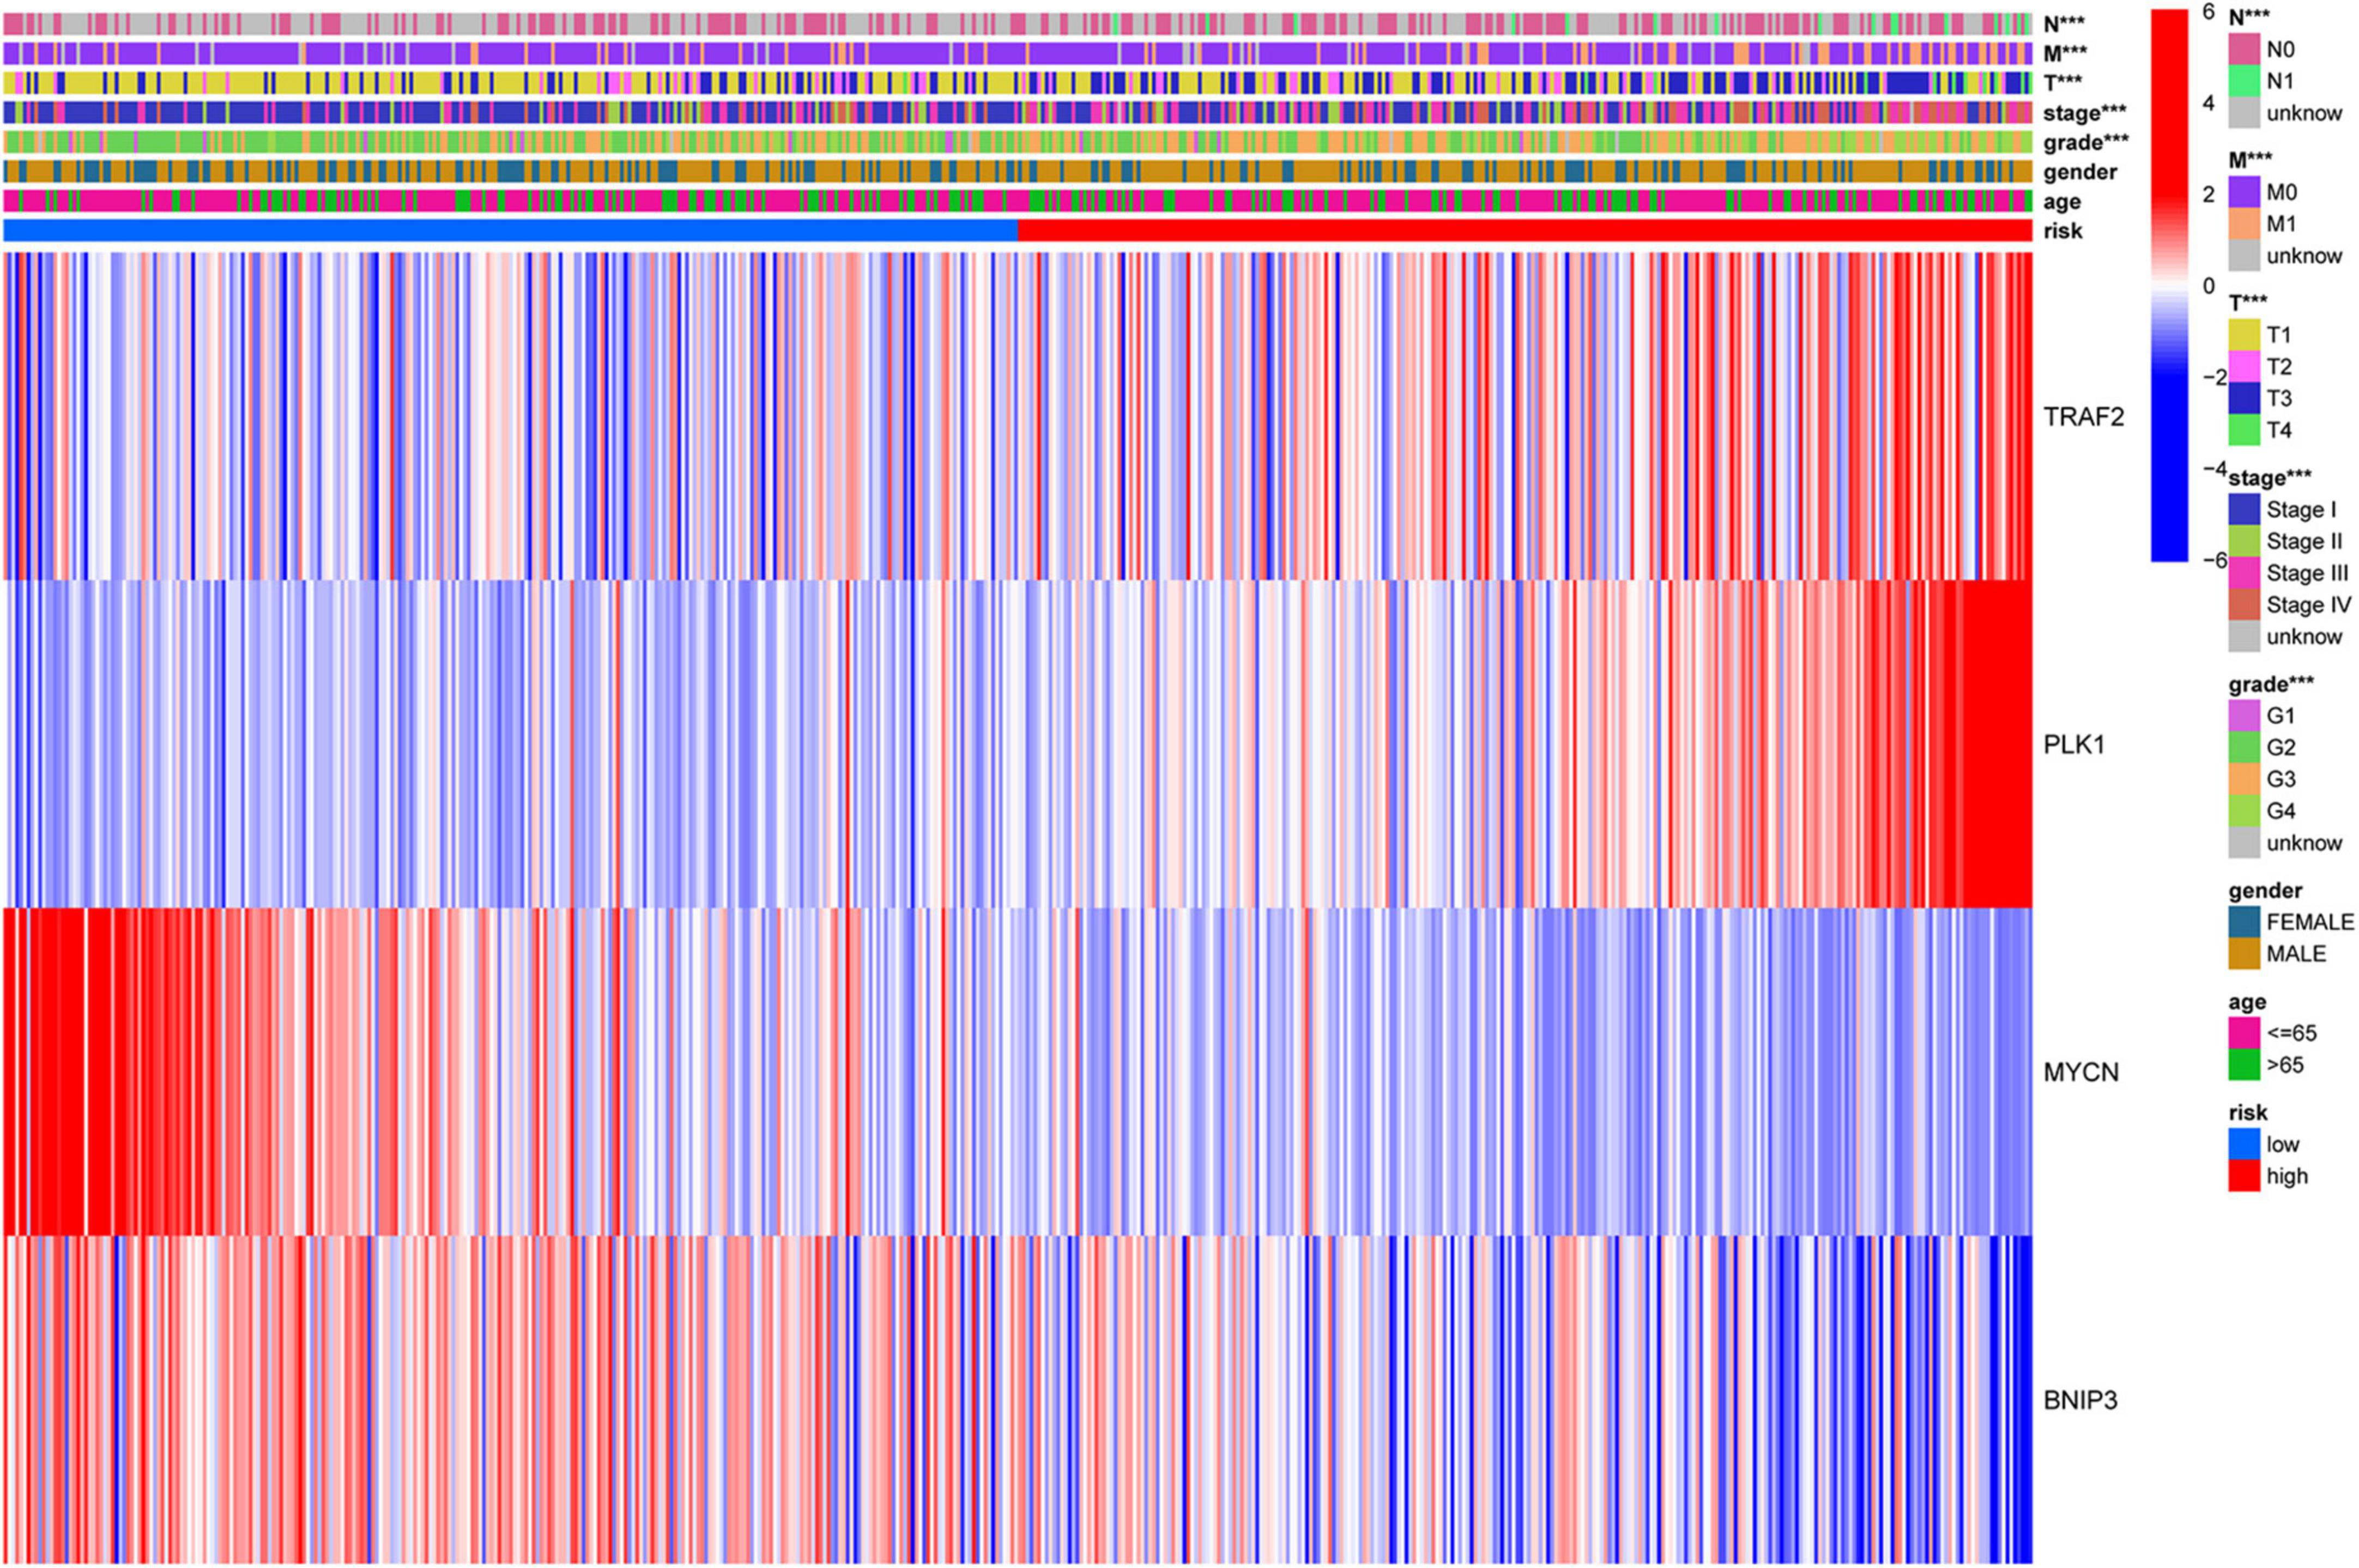
Figure 8. Correlation of risk group and clinicopathological characteristics. ***p < 0.001.
Validation of the predictive value and expression of necroptosis-related genes
We used Kaplan–Meier survival curve analysis to validate the predictive value of the 4 genes. BNIP3, PLK1, and MYCN had excellent prognostic values (Figures 9A,B,D). TRAF2 has a p-value of 0.088 (Figure 9C). Subsequently, our results showed the difference in the expression of these genes between non-tumor and ccRCC tissues (Figures 9E–H).
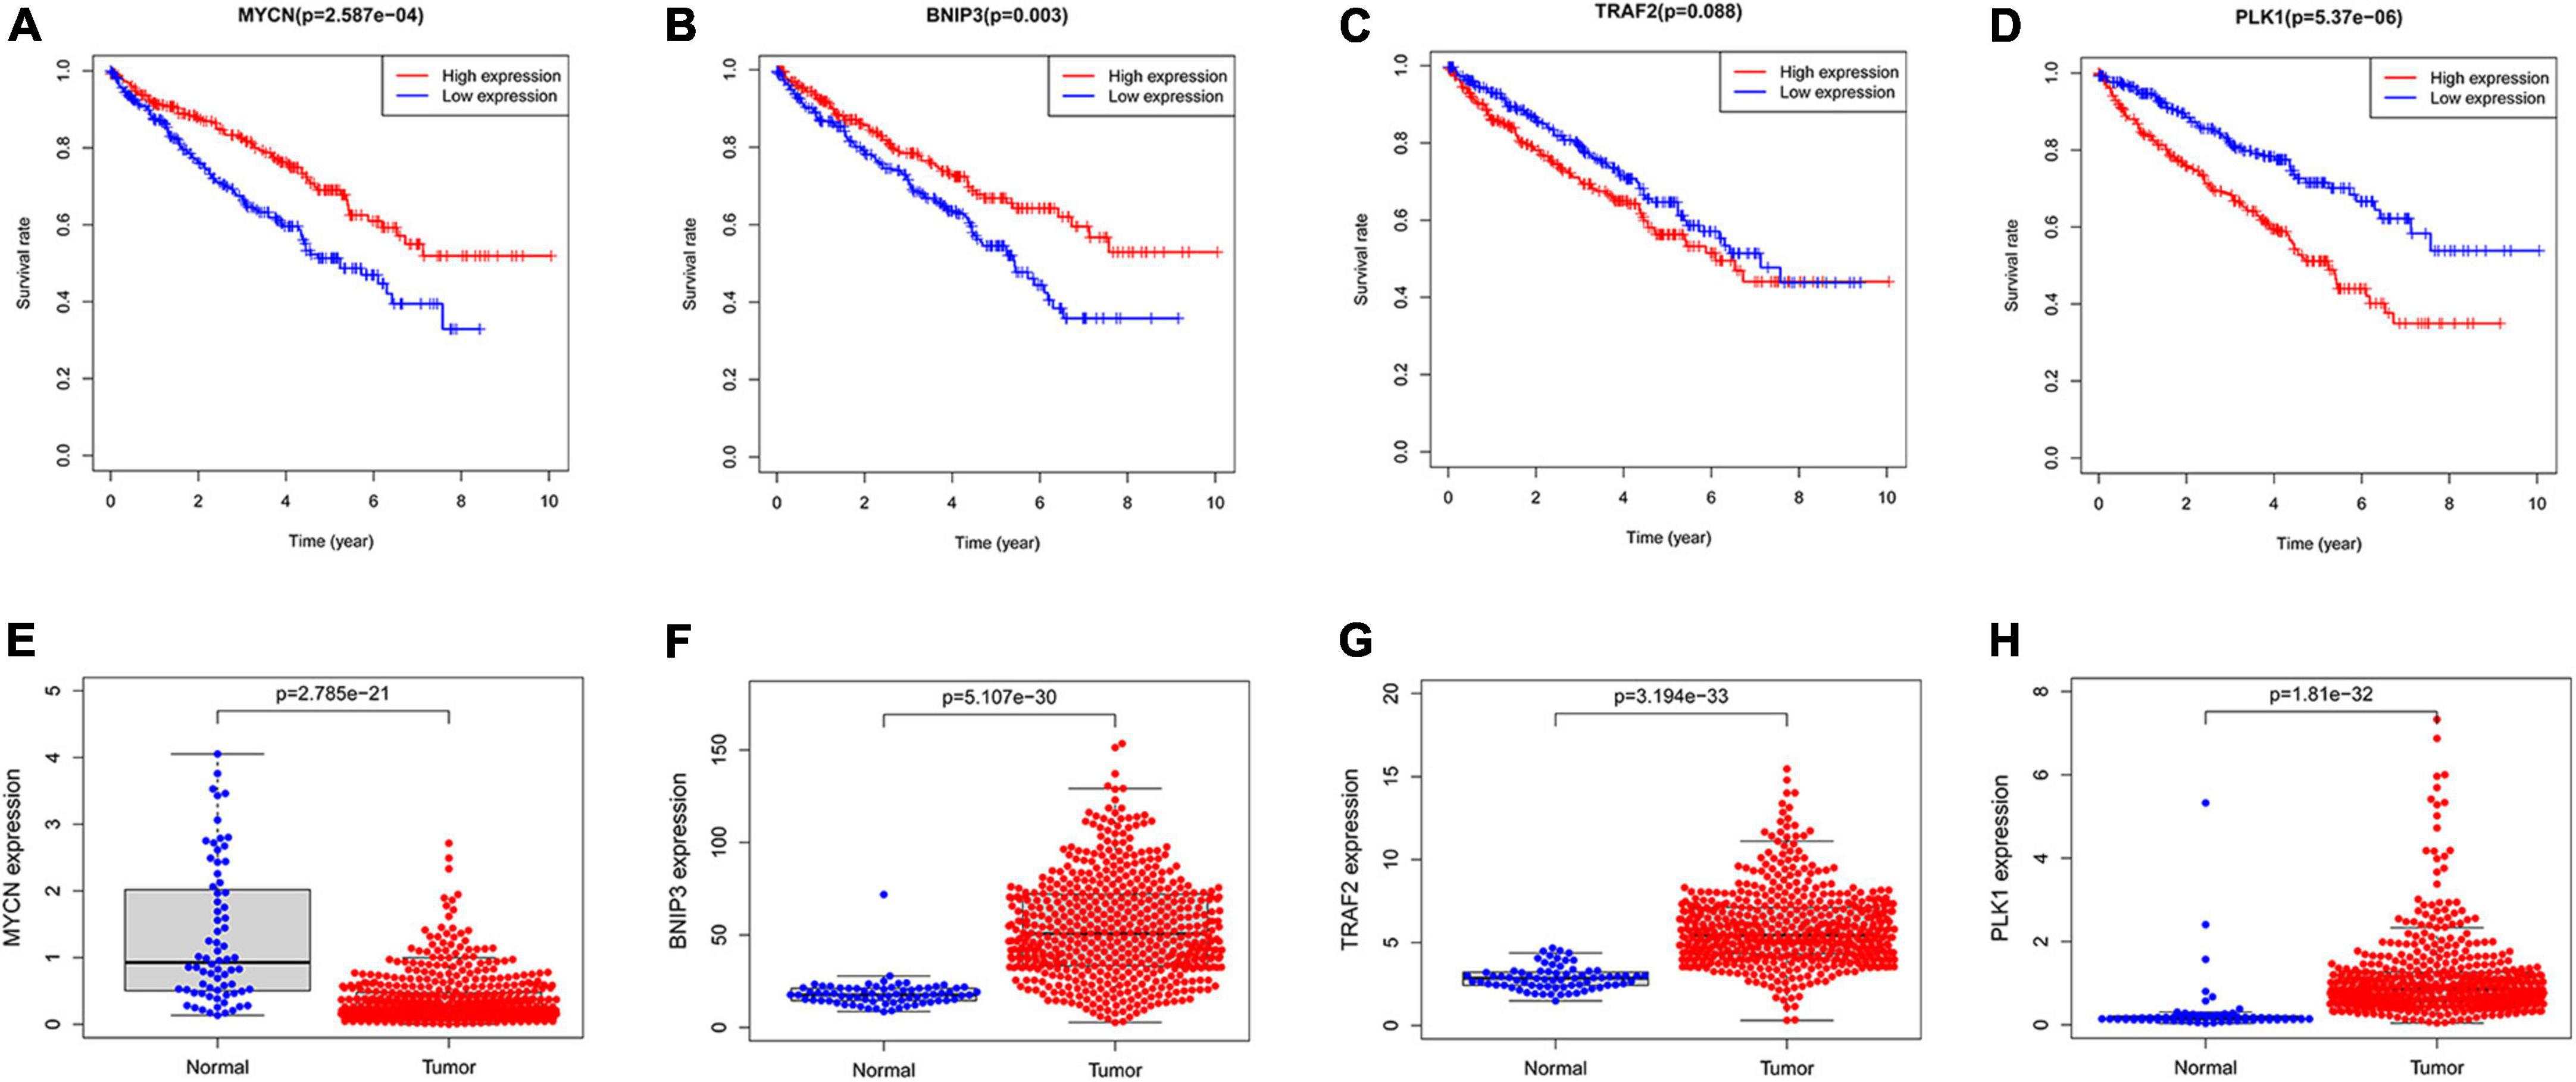
Figure 9. The predictive value of the four NRGs in ccRCC. (A–D) Kaplan–Meier survival curve analysis verified the prognostic value of the four NRGs in ccRCC; (E–H) verification of the RNA expression of the 4 genes between non-tumor tissues and ccRCC.
Validation of the expression of the four necroptosis-related genes
We performed IHC validation in clinical specimens. The results showed that the expression of BNIP3, TRAF2, and PLK1 proteins was higher in ccRCC tissues (Figures 10A–C). However, the expression of the MYCN protein was low in tumor tissues (Figure 10D). Thus, our results confirmed the accuracy of the established prognostic model.
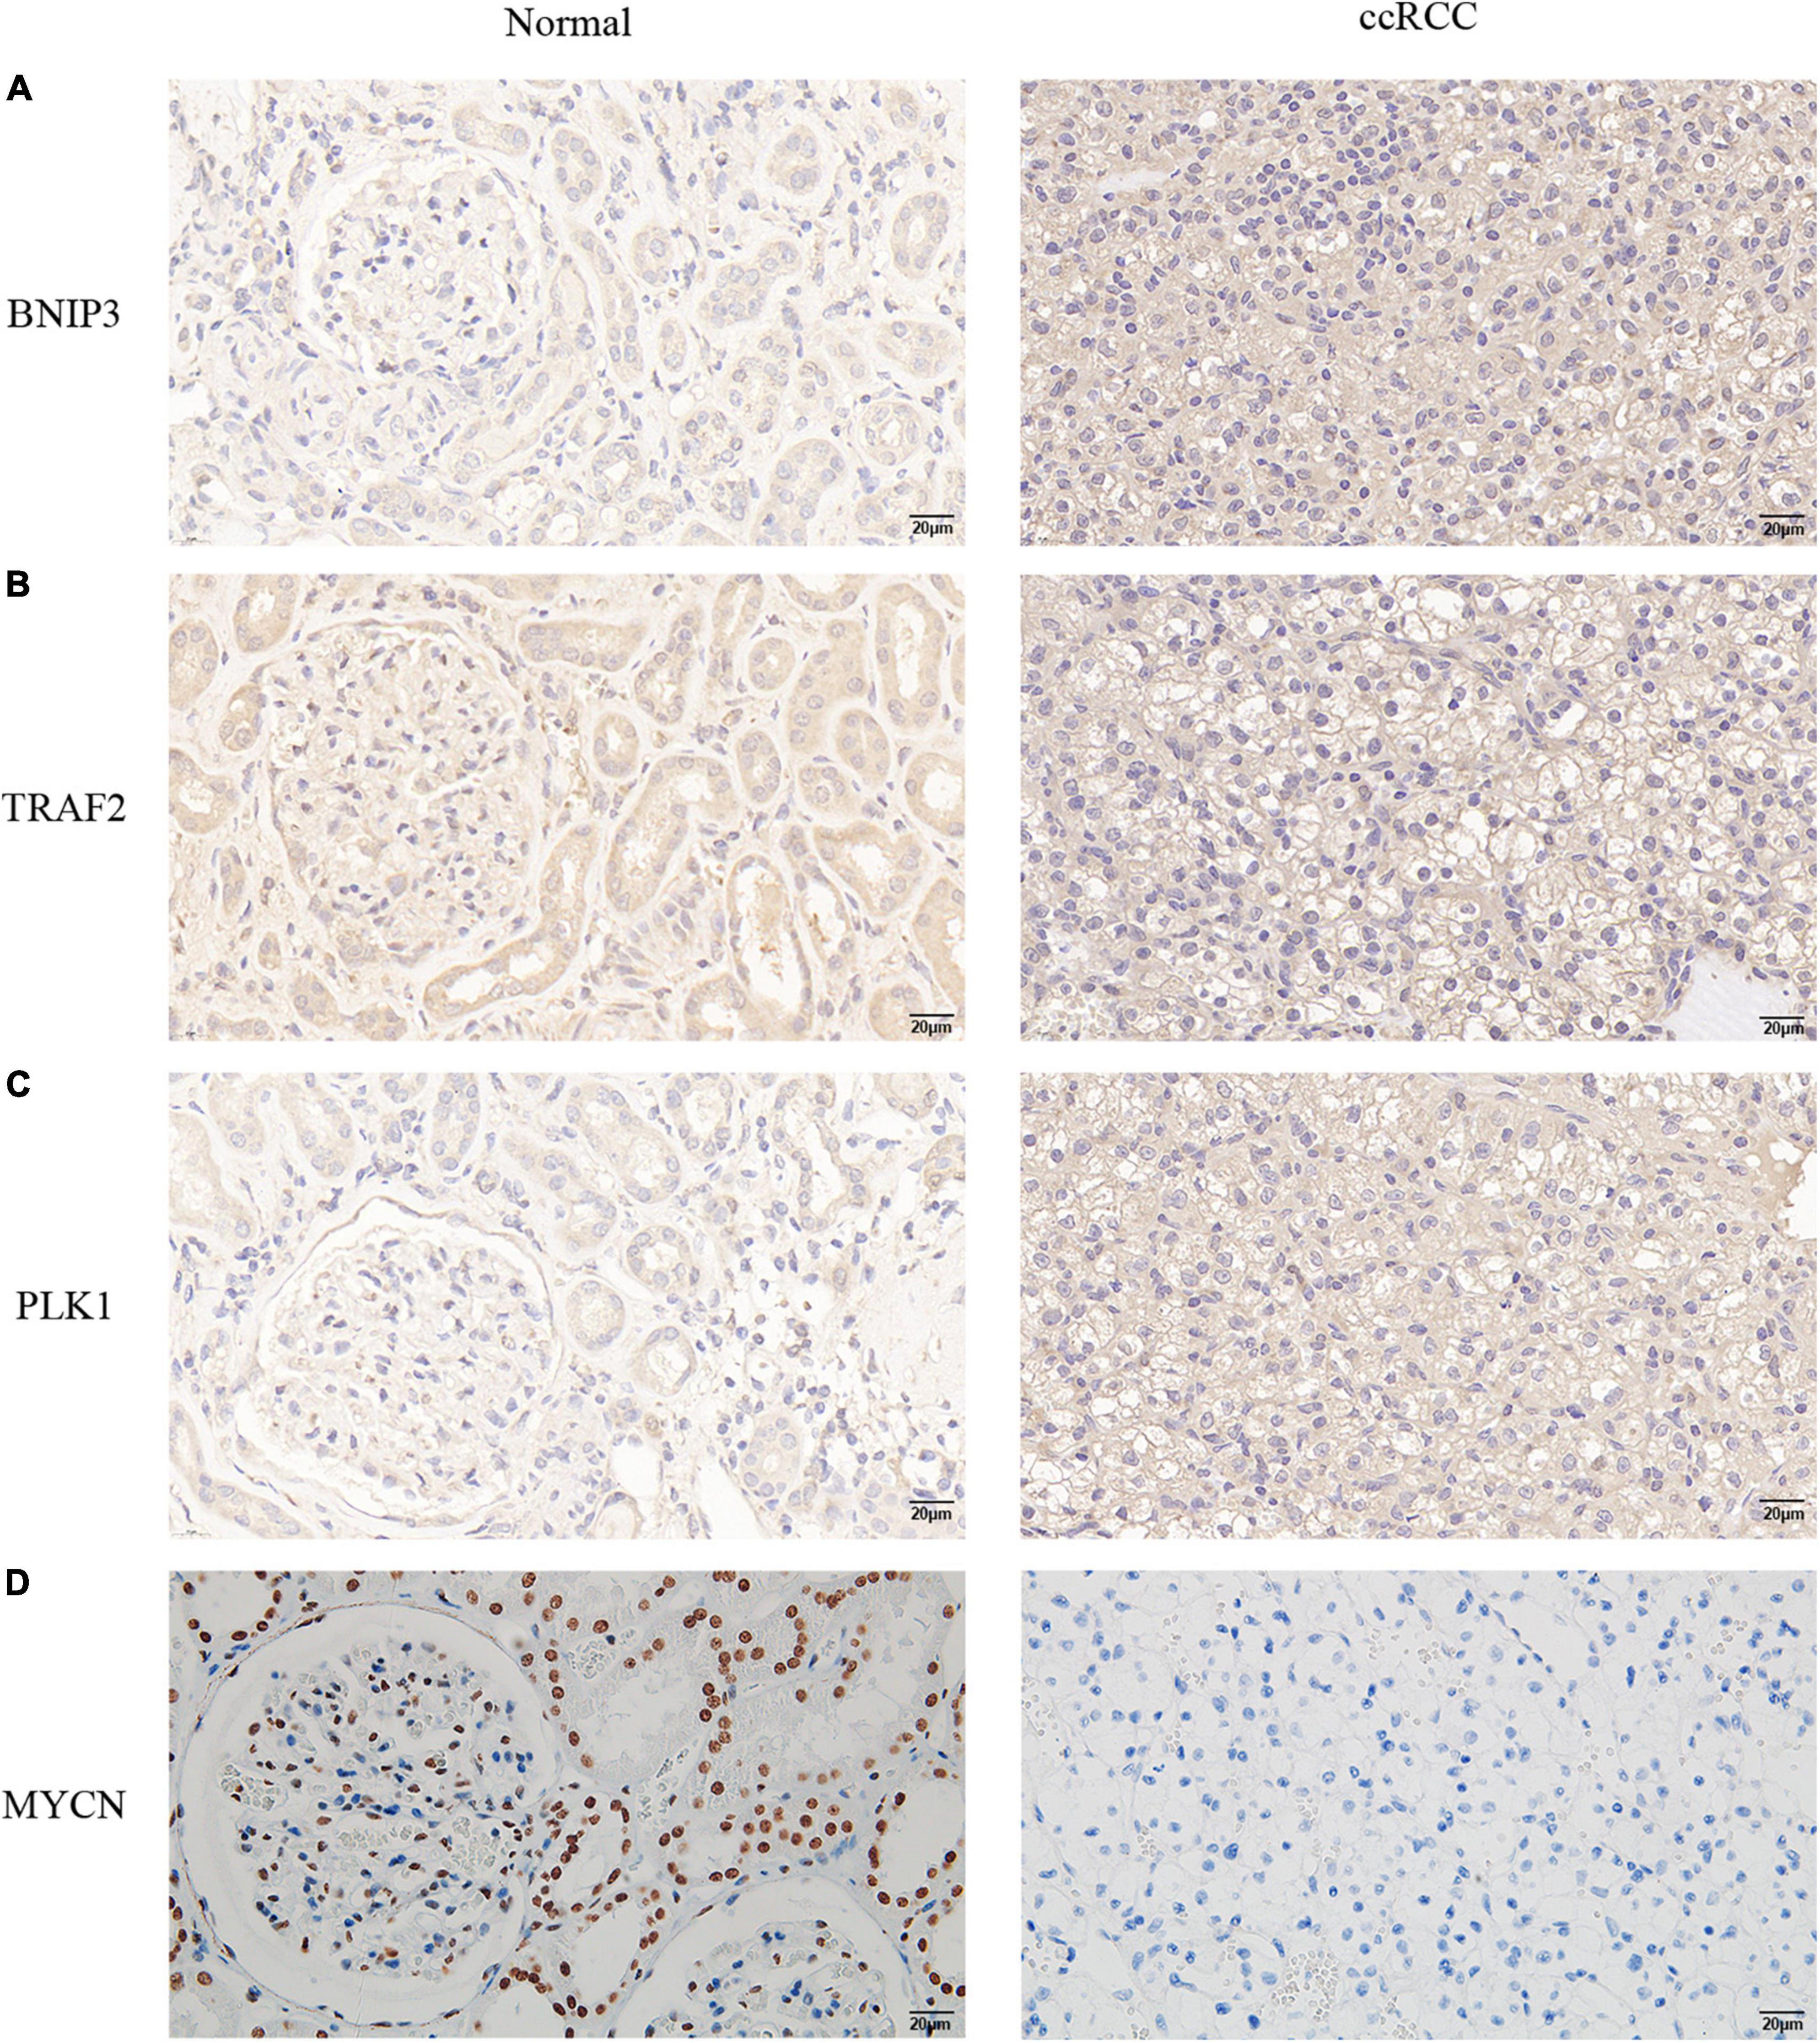
Figure 10. Verification of the protein expression levels of the four NRGs in non-tumor tissues and ccRCC tissues. (A) BINP3, (B) TRAF2, (C) PLK1, (D) MYCN.
Discussion
The ccRCC is prone to recurrence and has a poor prognosis (15). Thus, the development of precise diagnostic and therapeutic biomarkers is urgently required. Necroptosis is a newly discovered form of regulated necrosis. An increasing number of studies have demonstrated that necroptosis plays a critical role in cancer initiation, progression, and metastasis (16, 17). However, the studies performed to date have focused on the role of NRGs in the development of cancer and using them as a therapeutic target (18, 19), and no study has focused on the prognostic value of NRGs in cancer. In this study, we assessed the relationship between NRGs and the prognosis of patients with ccRCC. In addition, we constructed a prognostic model for ccRCC and validated the predictive value of the model.
We screened out 21 differentially expressed genes from 67 NRGs and compared their expression in non-tumor and tumor tissues, including 4 downregulated (GATA3, MYCN, IDH2, and BACH2) and 17 upregulated NRGs (TRAF2, LEF1, FAS, TNFRSF1B, EGFR, MYC, TLR3, BNIP3, AXL, CD40, ALK, MLKL, PLK1, ZBP1, FASLG, TERT, and CDKN2A). Additionally, we performed a functional analysis of the NRGs, and our results indicated that these NRGs were involved in platinum drug resistance, bladder cancer, apoptosis, p53 signaling pathway, pancreatic cancer, hepatitis B, erbB signaling pathway, apoptosis-multiple species, IL-17 signaling pathway, and endocrine resistance. A previous study showed that the sensitivity of ccRCC to cisplatin-induced necroptosis could be regulated by modulating the CAPN4-CNOT3 axis (3). Additionally, several studies have demonstrated that the p53 signaling pathway plays an essential role in the initiation and progression of ccRCC (6). These results suggest that these 21 NRGs may play a significant role in the development of ccRCC.
A total of 11 NRGs were confirmed in univariate Cox regression analysis. Four OS-related NRGs (MYCN, BNIP3, TRAF2, and PLK1) were detected by further multivariate Cox regression analysis, and we established OS-related prediction models using the four genes, which could be an independent prognostic factor for the patients with ccRCC. A previous study showed that PLK1-mediated MCM3 phosphorylation regulates proliferation and apoptosis in ccRCC (20). Dufie et al. also showed that HIF-2 promotes PLK1 expression in ccRCC, which mediates metastasis and resistance to targeted drugs in ccRCC (21). The Myc families of transcription factors (TFs), consisting of MYC, MYCN, and MYCL, are together the most commonly altered oncogenes in cancer (22, 23). Mastropasqua et al. revealed the influence of the N-MYC-miRNAs-TRIM8-p53 axis on the efficacy of cancer treatments in ccRCC (24). One study showed that histone deacetylation is most likely to cause BNIP3 inactivation in ccRCC, which leads to the suppression of apoptosis and promotes the growth of tumors in ccRCC (25, 26). These findings are consistent with those observed in our study. The relationship between TRAF2 and ccRCC remains to be clarified and may be related to immunity (27, 28).
In summary, we constructed a prognosis prediction model using the TCGA database and performed validation of the model. We identified a total of four OS-related NRGs (MYCN, BINP3, TRAF2, and PLK1). Therefore, these 4 NRGs are capable of acting as promising prognostic and diagnostic biomarkers for patients with ccRCC.
Data availability statement
The original contributions presented in this study are included in the article/Supplementary material, further inquiries can be directed to the corresponding author/s.
Author contributions
YD, YRL, and XL conceived, designed the study, and supervised the study. QQ, YZL, and YZ wrote the manuscript, performed the experiments, analyzed, and interpreted the data. YH, JH, LW, and ZC provided technical support. All authors contributed to the article and approved the submitted version.
Funding
This work was supported by the Key Research and Development Program of Hubei Province (No. 2020BCB051).
Conflict of interest
The authors declare that the research was conducted in the absence of any commercial or financial relationships that could be construed as a potential conflict of interest.
Publisher’s note
All claims expressed in this article are solely those of the authors and do not necessarily represent those of their affiliated organizations, or those of the publisher, the editors and the reviewers. Any product that may be evaluated in this article, or claim that may be made by its manufacturer, is not guaranteed or endorsed by the publisher.
Supplementary material
The Supplementary Material for this article can be found online at: https://www.frontiersin.org/articles/10.3389/fmed.2022.942991/full#supplementary-material
Footnotes
References
1. Gulati S, Vaishampayan U. Current state of systemic therapies for advanced renal cell carcinoma. Curr Oncol Rep. (2020) 22:26. doi: 10.1007/s11912-020-0892-1
2. Frew IJ, Moch H. A clearer view of the molecular complexity of clear cell renal cell carcinoma. Annu Rev Pathol. (2015) 10:263–89. doi: 10.1146/annurev-pathol-012414-040306
3. Bai D, Feng H, Yang J, Yin A, Qian A, Sugiyama H. Landscape of immune cell infiltration in clear cell renal cell carcinoma to aid immunotherapy. Cancer Sci. (2021) 112:2126–39. doi: 10.1111/cas.14887
4. Young JR, Margolis D, Sauk S, Pantuck AJ, Sayre J, Raman SS. Clear cell renal cell carcinoma: Discrimination from other renal cell carcinoma subtypes and oncocytoma at multiphasic multidetector CT. Radiology. (2013) 267:444–53. doi: 10.1148/radiol.13112617
5. Zhan C, Xu C, Chen J, Shen C, Li J, Wang Z, et al. Development and validation of an IL6/JAK/STAT3-related gene signature to predict overall survival in clear cell renal cell carcinoma. Front Cell Dev Biol. (2021) 9:686907. doi: 10.3389/fcell.2021.686907
6. Gong Y, Fan Z, Luo G, Yang C, Huang Q, Fan K, et al. The role of necroptosis in cancer biology and therapy. Mol Cancer. (2019) 18:100. doi: 10.1186/s12943-019-1029-8
7. Xu D, Zou C, Yuan J. Genetic regulation of RIPK1 and necroptosis. Annu Rev Genet. (2021) 55:235–63. doi: 10.1146/annurev-genet-071719-022748
8. Hu H, Wu X, Wu G, Nan N, Zhang J, Zhu X, et al. RIP3-mediated necroptosis is regulated by inter-filament assembly of RIP homotypic interaction motif. Cell Death Differ. (2021) 28:251–66. doi: 10.1038/s41418-020-0598-9
9. Wang Y, Zhao M, He S, Luo Y, Zhao Y, Cheng J, et al. Necroptosis regulates tumor repopulation after radiotherapy via RIP1/RIP3/MLKL/JNK/IL8 pathway. J Exp Clin Cancer Res. (2019) 38:461. doi: 10.1186/s13046-019-1423-5
10. Khan I, Yousif A, Chesnokov M, Hong L, Chefetz I. A decade of cell death studies: Breathing new life into necroptosis. Pharmacol Ther. (2021) 220:107717. doi: 10.1016/j.pharmthera.2020.107717
11. Xie Y, Zhao Y, Shi L, Li W, Chen K, Li M, et al. Gut epithelial TSC1/mTOR controls RIPK3-dependent necroptosis in intestinal inflammation and cancer. J Clin Invest. (2020) 130:2111–28. doi: 10.1172/JCI133264
12. Karki R, Sundaram B, Sharma BR, Lee S, Malireddi RKS, Nguyen LN, et al. ADAR1 restricts ZBP1-mediated immune response and PANoptosis to promote tumorigenesis. Cell Rep. (2021) 37:109858. doi: 10.1016/j.celrep.2021.109858
13. Al-Lamki RS, Lu W, Manalo P, Wang J, Warren AY, Tolkovsky AM, et al. Tubular epithelial cells in renal clear cell carcinoma express high RIPK1/3 and show increased susceptibility to TNF receptor 1-induced necroptosis. Cell Death Dis. (2016) 7:e2287. doi: 10.1038/cddis.2016.184
14. Wang KJ, Meng XY, Chen JF, Wang KY, Zhou C, Yu R, et al. Emodin induced necroptosis and inhibited glycolysis in the renal cancer cells by enhancing ROS. Oxid Med Cell Longev. (2021) 2021:8840590. doi: 10.1155/2021/8840590
15. Tyson MD, Chang SS. Optimal surveillance strategies after surgery for renal cell carcinoma. J Natl Compr Canc Netw. (2017) 15:835–40. doi: 10.6004/jnccn.2017.0102
16. Roedig J, Kowald L, Juretschke T, Karlowitz R, Ahangarian Abhari B, Roedig H, et al. USP22 controls necroptosis by regulating receptor-interacting protein kinase 3 ubiquitination. EMBO Rep. (2021) 22:e50163. doi: 10.15252/embr.202050163
17. Karki R, Sharma BR, Lee E, Banoth B, Malireddi RKS, Samir P, et al. Interferon regulatory factor 1 regulates PANoptosis to prevent colorectal cancer. JCI Insight. (2020) 5:e136720. doi: 10.1172/jci.insight.136720
18. Park JH, Jung KH, Kim SJ, Yoon YC, Yan HH, Fang Z, et al. HS-173 as a novel inducer of RIP3-dependent necroptosis in lung cancer. Cancer Lett. (2019) 444:94–104. doi: 10.1016/j.canlet.2018.12.006
19. Markowitsch SD, Juetter KM, Schupp P, Hauschulte K, Vakhrusheva O, Slade KS, et al. Shikonin reduces growth of docetaxel-resistant prostate cancer cells mainly through necroptosis. Cancers. (2021) 13:882. doi: 10.3390/cancers13040882
20. Gao ZP, Man XJ, Li ZH, Bi JB, Liu XK, Li ZL, et al. PLK1 promotes proliferation and suppresses apoptosis of renal cell carcinoma cells by phosphorylating MCM3. Cancer Gene Ther. (2020) 27:412–23. doi: 10.1038/s41417-019-0094-x
21. Dufies M, Verbiest A, Cooley LS, Ndiaye PD, He XK, Nottet N, et al. Plk1, upregulated by HIF-2, mediates metastasis and drug resistance of clear cell renal cell carcinoma. Commun Biol. (2021) 4:166. doi: 10.1038/s42003-021-01653-w
22. Ryan SL, Schwalbe EC, Cole M, Lu Y, Lusher ME, Megahed H, et al. MYC family amplification and clinical risk-factors interact to predict an extremely poor prognosis in childhood medulloblastoma. Acta Neuropathol. (2012) 123:501–13. doi: 10.1007/s00401-011-0923-y
23. Mundo L, Ambrosio MR, Raimondi F, Del Porro L, Guazzo R, Mancini V, et al. Molecular switch from MYC to MYCN expression in MYC protein negative Burkitt lymphoma cases. Blood Cancer J. (2019) 9:91. doi: 10.1038/s41408-019-0252-2
24. Mastropasqua F, Marzano F, Valletti A, Aiello I, Di Tullio G, Morgano A, et al. TRIM8 restores p53 tumour suppressor function by blunting N-MYC activity in chemo-resistant tumours. Mol Cancer. (2017) 16:67. doi: 10.1186/s12943-017-0634-7
25. Burton TR, Gibson SB. The role of Bcl-2 family member BNIP3 in cell death and disease: NIPping at the heels of cell death. Cell Death Differ. (2009) 16:515–23. doi: 10.1038/cdd.2008.185
26. Sturm I, Stephan C, Gillissen B, Siebert R, Janz M, Radetzki S, et al. Loss of the tissue-specific proapoptotic BH3-only protein Nbk/Bik is a unifying feature of renal cell carcinoma. Cell Death Differ. (2006) 13:619–27. doi: 10.1038/sj.cdd.4401782
27. Makhov P, Naito S, Haifler M, Kutikov A, Boumber Y, Uzzo RG, et al. The convergent roles of NF-kappa B and ER stress in sunitinib-mediated expression of pro-tumorigenic cytokines and refractory phenotype in renal cell carcinoma. Cell Death Dis. (2018) 9:374. doi: 10.1038/s41419-018-0388-1
Keywords: necroptosis, clear cell renal cell carcinoma, prognosis, platinum drug resistance, genes
Citation: Qiu Q, Li Y, Zhang Y, Hou Y, Hu J, Wang L, Chen Z, Lei Y, Du Y and Liu X (2022) A prognosis model for clear cell renal cell carcinoma based on four necroptosis-related genes. Front. Med. 9:942991. doi: 10.3389/fmed.2022.942991
Received: 13 May 2022; Accepted: 19 July 2022;
Published: 09 August 2022.
Edited by:
Ambadas Rode, Regional Centre for Biotechnology (RCB), IndiaReviewed by:
Wei Zhou, Zhejiang University, ChinaMingrui Pang, Wuhan University, China
Jianjian Zhang, Nanjing Medical University, China
Copyright © 2022 Qiu, Li, Zhang, Hou, Hu, Wang, Chen, Lei, Du and Liu. This is an open-access article distributed under the terms of the Creative Commons Attribution License (CC BY). The use, distribution or reproduction in other forums is permitted, provided the original author(s) and the copyright owner(s) are credited and that the original publication in this journal is cited, in accordance with accepted academic practice. No use, distribution or reproduction is permitted which does not comply with these terms.
*Correspondence: Yourong Lei, MjkwMzEyMjI5M0BxcS5jb20=; Yang Du, cGhvZW5peG5lb0B3aHUuZWR1LmNu; Xiuheng Liu, ZHJsaXV4aEBob3RtYWlsLmNvbQ==
†These authors have contributed equally to this work