 Hanwen Lu
 Liwei Zhou
 Bingchang Zhang1,3
 Zhanxiang Wang
94% of researchers rate our articles as excellent or good
Learn more about the work of our research integrity team to safeguard the quality of each article we publish.
Find out more
ORIGINAL RESEARCH article
Front. Med., 29 November 2022
Sec. Gene and Cell Therapy
Volume 9 - 2022 | https://doi.org/10.3389/fmed.2022.939776
Recent studies have found that the protein encoded by the FDX1 gene is involved in mediating Cuproptosis as a regulator of protein lipoylation and related to immune response process of tumors. However, the specific biological function of FDX1 in glioma is currently unclear. To explore the potential function of FDX1, this study explored the correlation between the expression of FDX1 in cancers and survival prognosis by analyzing the public databases of GEPIA and Cbioportal. Immune infiltration was analyzed by the TIMER2.0 database in tumors. The possible biological processes and functions of FDX1-related in glioma were annotated through gene enrichment. Relationship between Cuproptosis and autophagy was explored through gene co-expression studies. Summary and conclusions of this study: (1) FDX1 is highly expressed in gliomas and associated with poor prognosis in low-grade gliomas (LGG). (2) Gene annotation indicates that FDX1 is mainly involved in the tumor protein lipoylation and cell death. (3) FDX1 expression is positively correlated with the infiltration of immune cells. (4) LIPT2 and NNAT, two other genes involved in lipoylation, may be unidentified marker gene for Cuproptosis. And the Cuproptosis genes related to FDX1 were positively correlated with the expression of autophagy marker genes Atg5, Atg12, and BECN-1. This evidence suggests that there may be some interaction between FDX1 mediated Cuproptosis and autophagy. In summary, FDX1 may serve as a potential immunotherapy target and prognostic marker for Glioma.
Glioma is one of the most common central nervous system malignancies (1–6). Evidence shows that high-grade glioma (HGG) has obvious aggressiveness and heterogeneity (7–14). In 2022, the World Health Organization (WHO) updated the classification criteria of glioma according to the molecular characteristics of different gliomas, which will help patients obtain more accurate diagnoses and precise personalized treatment in clinical practice (1, 2). Therefore, exploring new molecular marker is important work. FDX1 is a mitochondrial-associated protein, named ferredoxin 1 (FDX1) for it is closely related to iron-sulfur protein synthesis (15–17). Meanwhile, it acts as a key regulator of lipoylation to regulate protein lipoylation process (18, 19). It is worth noting that a recent report found that FDX1, as a key enzyme, regulates the Cuproptosis by regulating protein lipoylation process (20).
However, the role and biological function of FDX1 in gliomas are currently unclear. Currently, it is generally accepted that the tumor microenvironment (TME) is one of the key factors in tumor initiation and progression (7, 21–29). It is mainly composed of tumor cells, fibroblast cells, immune cells, various signal molecules, extracellular matrix, special physical and chemical factors (30–33). Evidence shows that the tumor microenvironment significantly affects tumor diagnosis, survival outcomes, and clinical treatment sensitivity (21, 23, 33–35). In recent years, related immunological studies have found that immune cell infiltration plays a key role in the tumor microenvironment in the formation, occurrence and development (31, 36–47). The most concerned are the immune checkpoint protein PD-1 and its ligands PD-L1 and PDCD1LG2, tumor transforming growth factor B1 (TGFB1) and its receptors TGFB1R (48–54). TGFB1 plays an immunosuppressive role in the process of tumor progression. Inhibiting the activation and differentiation of B lymphocytes and T lymphocytes, further leads to the immune dysfunction of the body, allowing tumor cells to escape the surveillance of the immune system (55–57).
This study aimed to explore the relationship and possible signaling pathways between FDX1 expression and the prognosis of glioma patients utilizing bioinformatics. In addition, by analyzing the expression correlation between immune cell signatures and FDX1 expression, we explored the relationship between FDX1 expression and the infiltration of immune cells in the tumor microenvironment and further clarified whether FDX1 could be used as a new type of glioma patient immunotherapy markers. At the same time, potential Cuproptosis mediators and whether Cuproptosis and ferroptosis have common features in autophagy dependence were identified by gene co-expression research method.
The patient transcriptome data and corresponding clinical information used in this study were derived from the Chinese Glioma Patient Genome Atlas (CGGA,1) (58) and The Cancer Genome Atlas (TCGA, see text footnote 1) public database. Gene annotation and differential gene analysis are completed by the GENEMAINA2 data platform (GENEMAINA is a visualization platform that integrates a large amount of annotation information and gene interactions, which can identify co-expressed genes of specific gene in tumors. Gene functions and signaling pathway informations can be predicted through the annotated informations (59).
The mutation information analysis of the FDX1 gene was completed by the cBioPortal3 platform TCGA-GBM and TCGA-LGG datasets. Correlation between the FDX1 gene and the level of tumor immune infiltration was performed by the analysis tool TIMER2.0. TIMER2.0 is an immune assessment tool constructed based on tumor gene signatures expression in TCGA, which can be used to assess the correlation between different genes and immune cell subtypes, as well as the immune level and purity of infiltration.4 LinkedOmics is an analysis tool for identifying differentially expressed genes associated with FDX1. In this study, the statistical methods used were all tested and distinguished by Pearson correlation coefficient (60). The relationship between the FDX1 gene and immune-related factors, as well as the GO annotation of the gene and the KEGG signaling pathway enrichment analysis, were completed by the TISIDB database. TISIDB is an analysis platform to study the interaction between genes and tumor immunity5 (61).
In this study, the online tool LinkedOmics was used to analyze potential genes related to FDX1 function. According to the expression abundance of key genes, which were divided into high and low expression groups. GSEA6 module was employed to cellular process enrichment, and GSEA enrichment was estimated using the normalized enrichment score (FDR ≤ 0.25, p ≤ 0.05 indicating a statistical difference).
The statistical methods used in this study were Spearman’s tests to evaluate the significance and correlation between the expressed genes. 50% of the gene expression value was set as the critical point, and all sample were divided into two groups according to the expression level. The differences and significance of survival rates among the groups were further evaluated by the Kaplan-Meier algorithm. ANOVA analysis was used to count the expression of FDX1 gene in three independent datasets in the CGGA database.
To understand the expression of the FDX1 gene in cancers, TIMER2.0 was used to analyze the transcriptome expression level of the FDX1 gene in different tumors and normal tissues. The results showed that the FDX1 gene was abnormally expressed in most tumor tissues compared to normal tissues. It is worth noting that the expression of the FDX1 gene was abnormally high in glioma than normal tissues, especially in glioblastoma (GBM), the expression level was the highest (Figure 1A). Next, the expression level of FDX1 in different tumor and normal tissues was further evaluated through the GEPIA online database (Figure 1B). The results showed that the transcripts level of FDX1 in GBM and Low grade glioma (LGG) was significantly higher than normal tissues. This is consistent with the conclusions obtained from TIMER2.0.

Figure 1. Expression of FDX1 gene in different cancers. (A) Expression of FDX1 gene in different cancer and normal tissues of TIMER2.0 database (*P ≤ 0.05, **P ≤ 0.01, ***P ≤ 0.001). (B) Expression of FDX1 Transcripts in different cancer and normal tissues in GEPIA database (*P ≤ 0.05, **P ≤ 0.01, ***P ≤ 0.001).
The present study analyzed three independent transcriptome datasets in the CGGA database, and the results showed that FDX1 gene expression was higher in HGG relative to LGG (Figure 2A). To further check the accuracy of the above results, expression levels of FDX1 were analyzed using the glioma transcriptome datasets published by different experimental groups provided by the Gliovis platform.7 The results showed that FDX1 was abnormally up-regulated in both TCGA and Rembrandit datasets relative to LGG and HGG samples (Figure 2B). The results are consistent with previous. Meanwhile, we analyzed the expression of FDX1 protein in glioma cells by HPA (Human Protein Database)8. The results showed that FDX1 protein was expressed in the glioma cell line U251 cells, and was mainly expressed in the cytoplasm and cell membrane (Figure 2C).
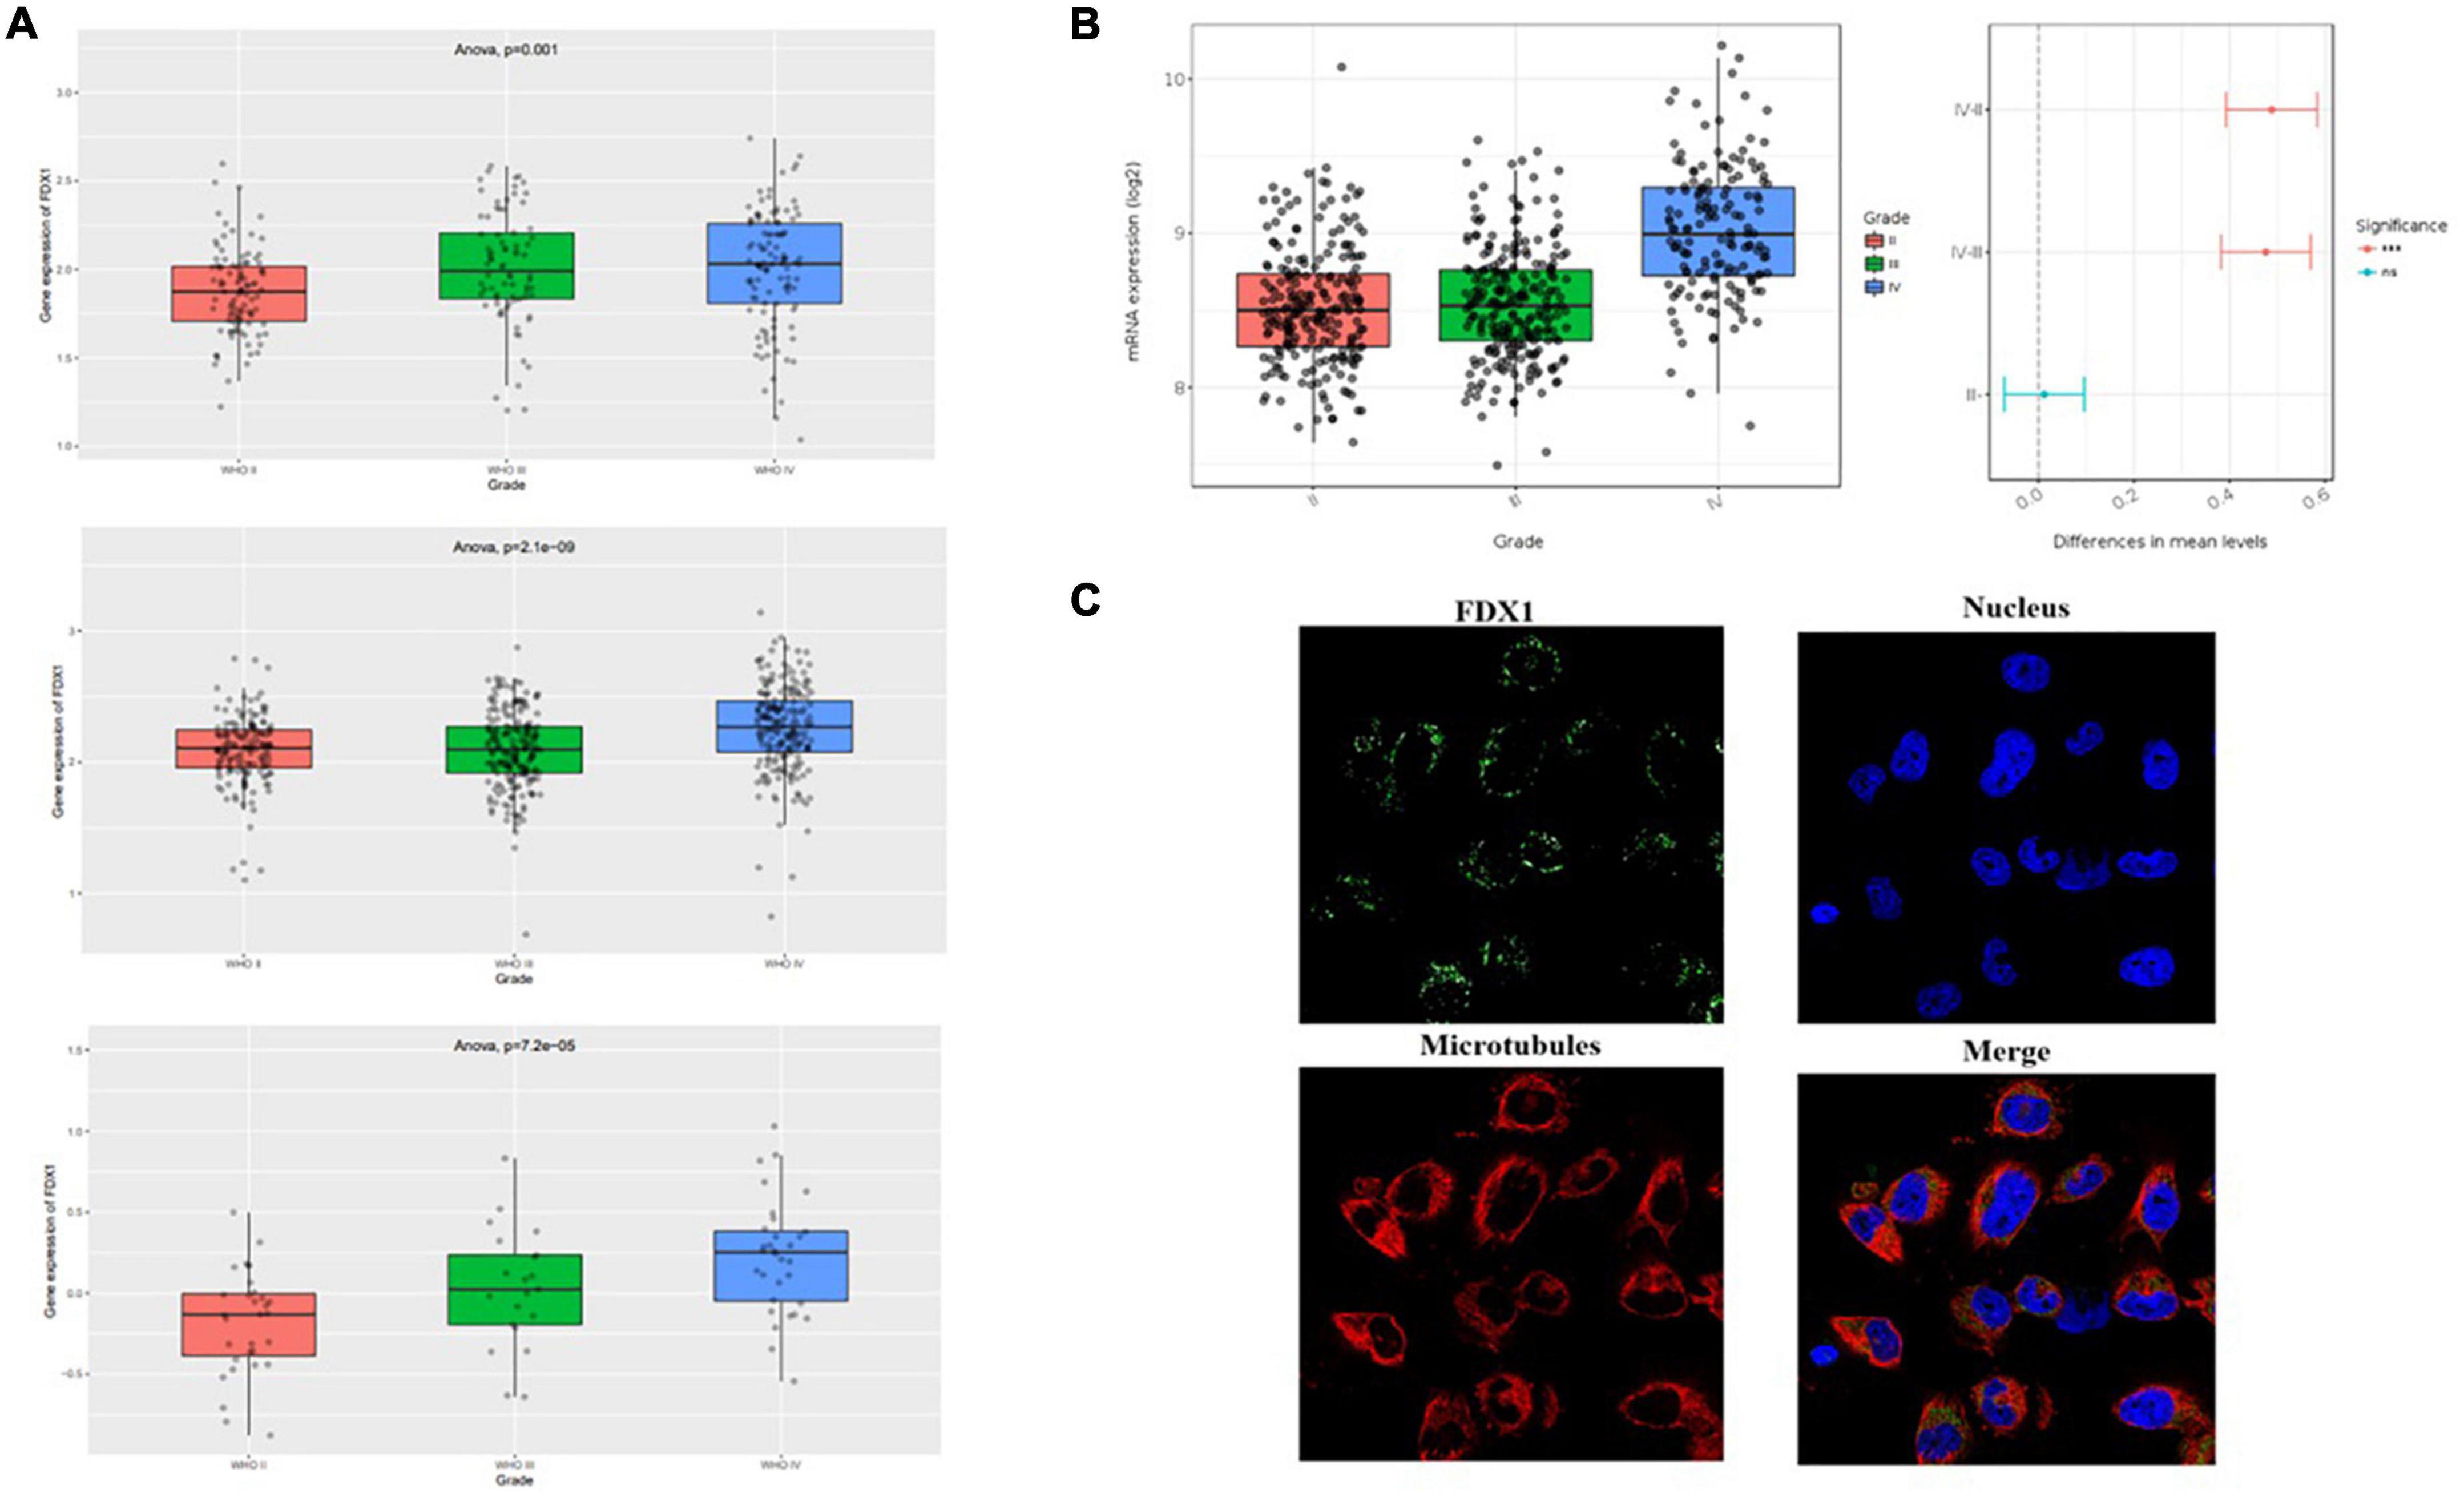
Figure 2. Expression level analysis of Fdx1 gene in multiple public databases. (A) Expression of Fdx1 gene in three independent research cohorts of CGGA. (B) Expression of Fdx1 gene in TCGA dataset (LGG-GBM). (C) Expression of FDX1 in glioma cell line U251 cells (the data from Human Protein Altas public database).
To further verify our analysis results, we detected the expression of FDX1 in glioma tissues and cell lines. The results showed that the protein expression of FDX1 in grade II, III, and GBM of glioma was significantly up-regulated compared with the normal group (Figures 3A,B). The results showed that the protein expression of FDX1 in Normal glial cell (NHA cell) and glioma cell lines (U87-MG, U251, U373, and A172) was significantly up-regulated compared with the normal group (Figures 3C,D). In order to further prove our conclusion, we also detected the mRNA expression of FDX1 gene in NHA cell and glioma cell lines. The results showed that the mRNA expression of FDX1 in U251, U373, and A172 cell were significantly higher than NHA cell (Figure 3E).
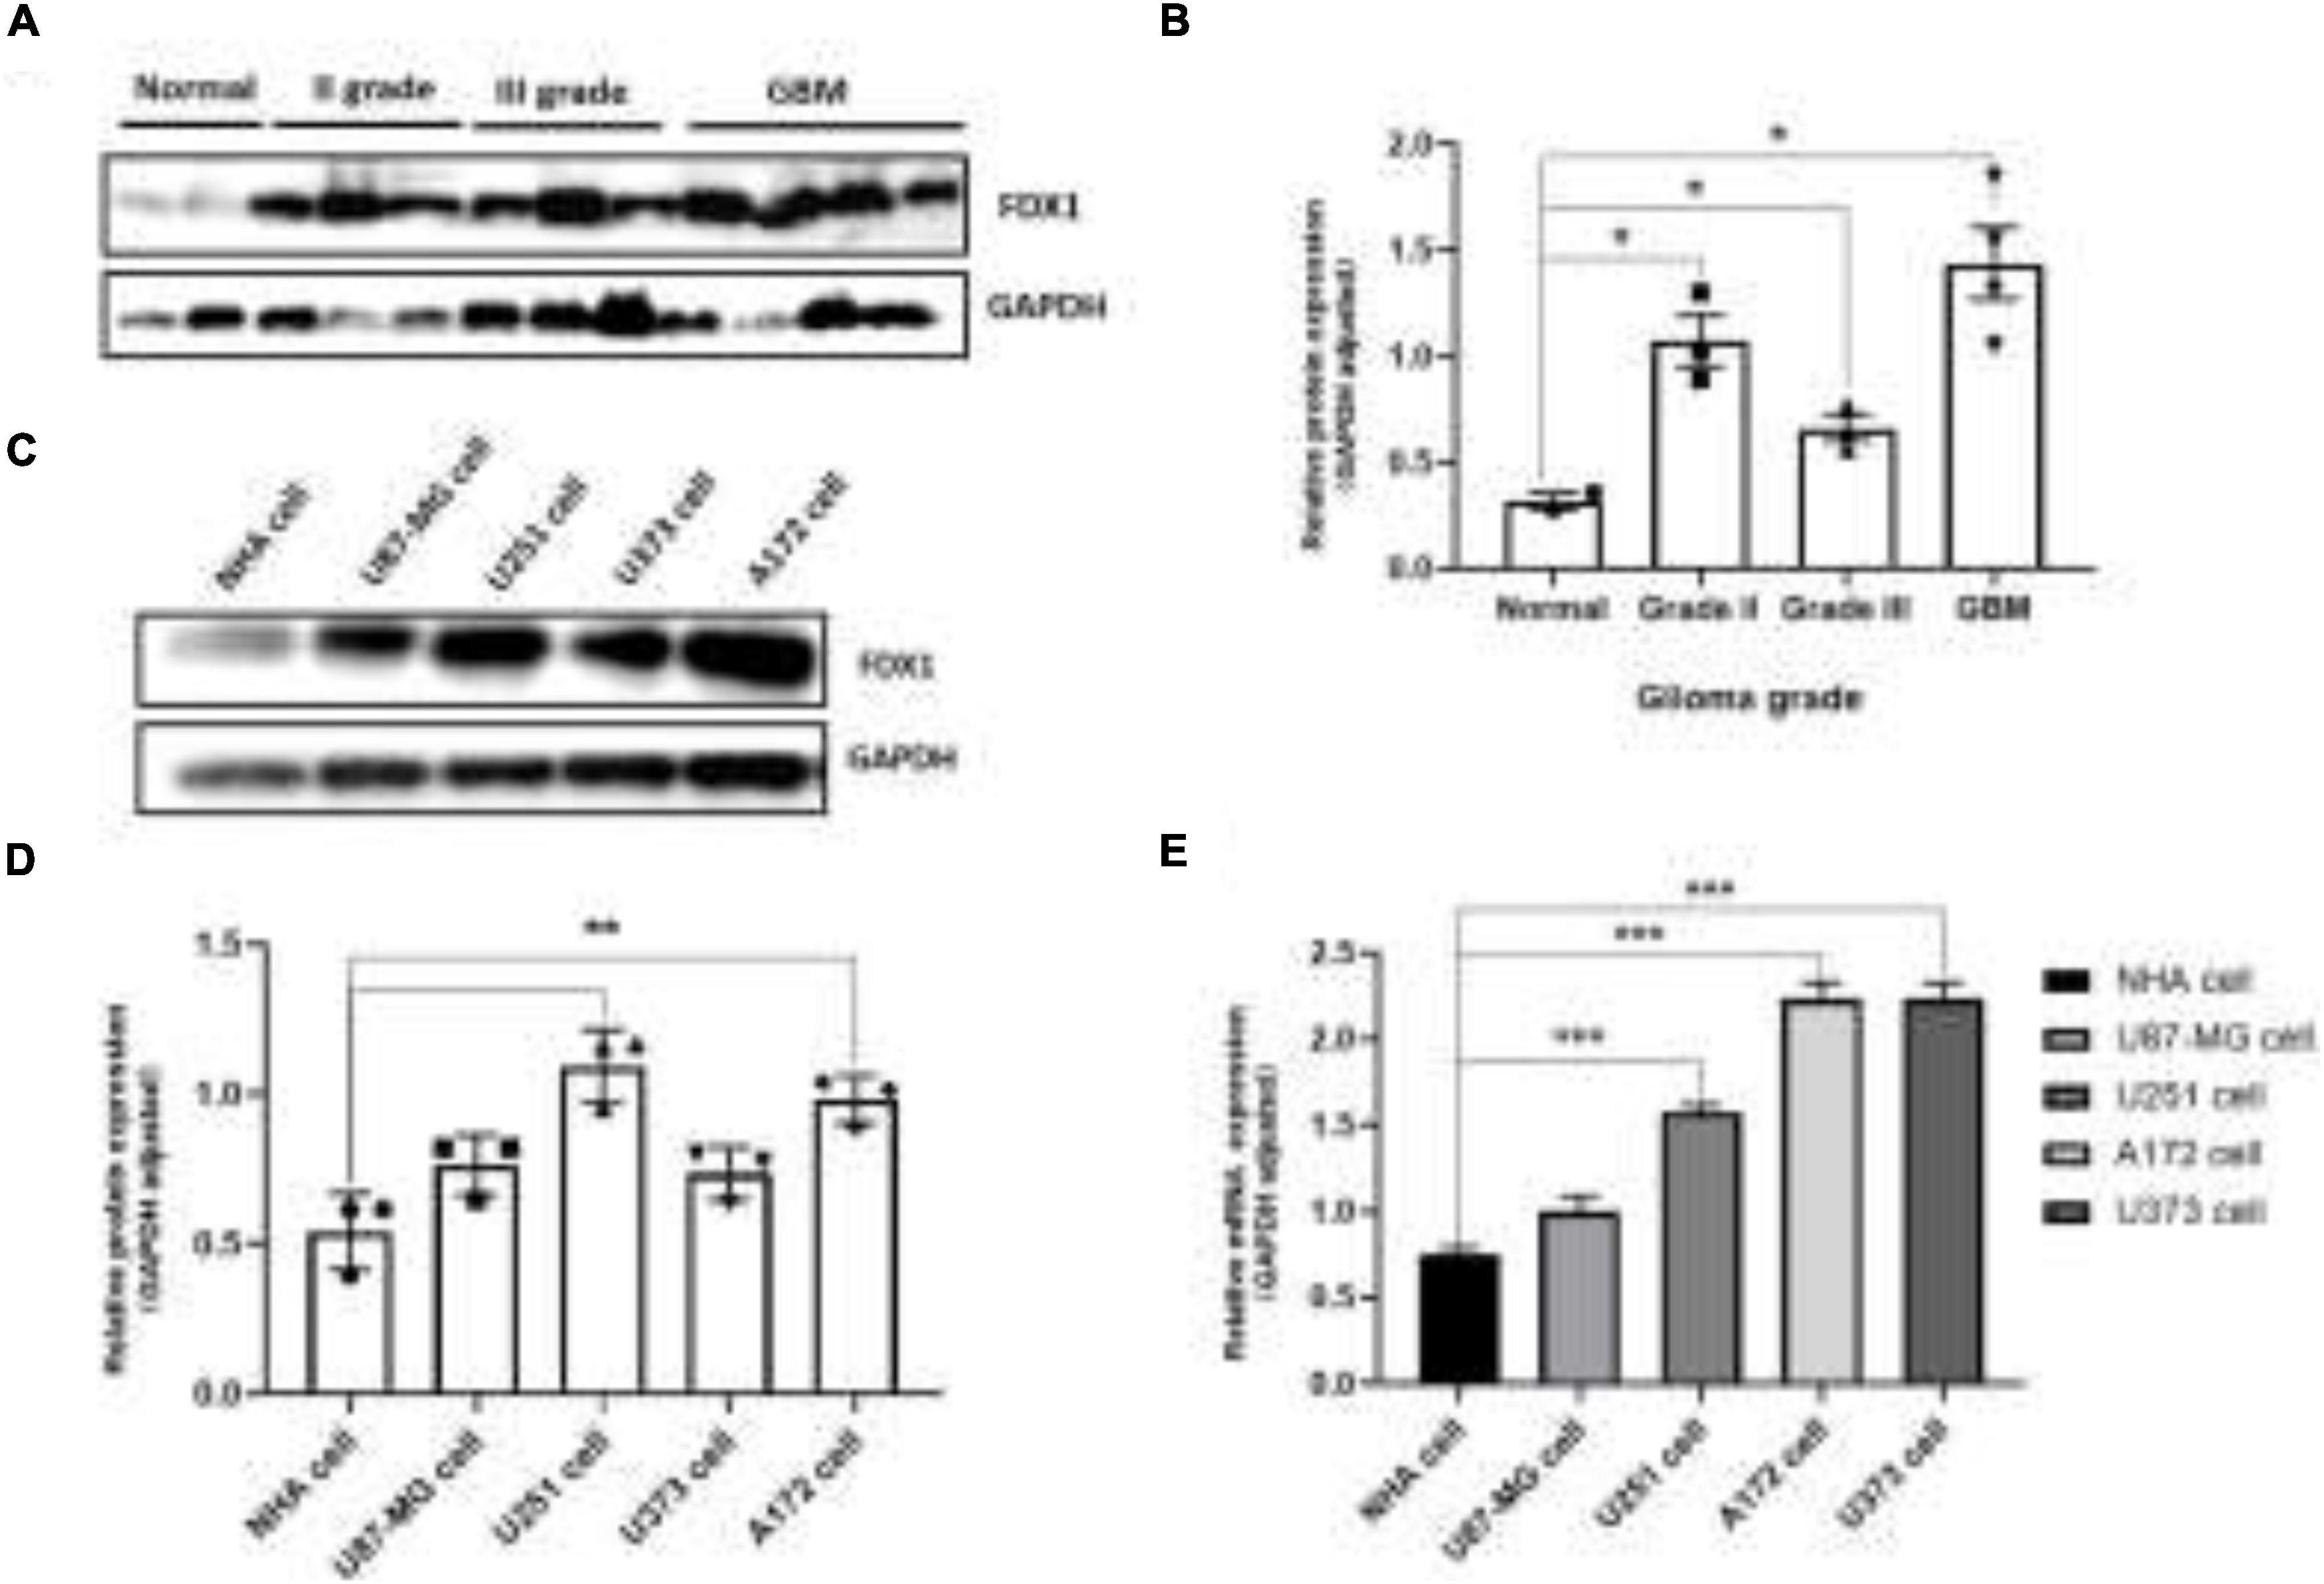
Figure 3. Expression level analysis of FDX1 in glioma tissue glioma cell lines. (A) Expression of FDX1 protein in Normal and glioma tumor tissue (Grade II, Grade III, and GBM). (B) Statistical analysis of FDX1 protein relative to GAPDH gene expression in normal tissues and glioma tissues. (C) Expression of FDX1 protein in normal glial cell line (NHA cell) and glioma cell lines (U87-MG cell, U251 cell, U373 cell, and A172 cell). (D) Statistical analysis of FDX1 relative to GAPDH gene expression J in glia cell line and glioma cell lines. (E) mRNA expression of FDX1 gene in normal glial cell (NHA cell) and glioma cell lines. (*P ≤ 0.05, **P ≤ 0.01, and ***P ≤ 0.001).
To further understand the relationship between the expression of FDX1 gene and the clinical characteristics of glioma patients, we performed univariate and multivariate regression analysis. The results showed that in CGGA database, FDX1 expression was statistically correlated with patient age, tumor grade, chemotherapy resistance, IDH mutation and 1p19q codeletion. The results in TCGA database showed that the expression of FDX1 was statistically correlated with tumor grade and 1p19q codeletion (Tables 1, 2).
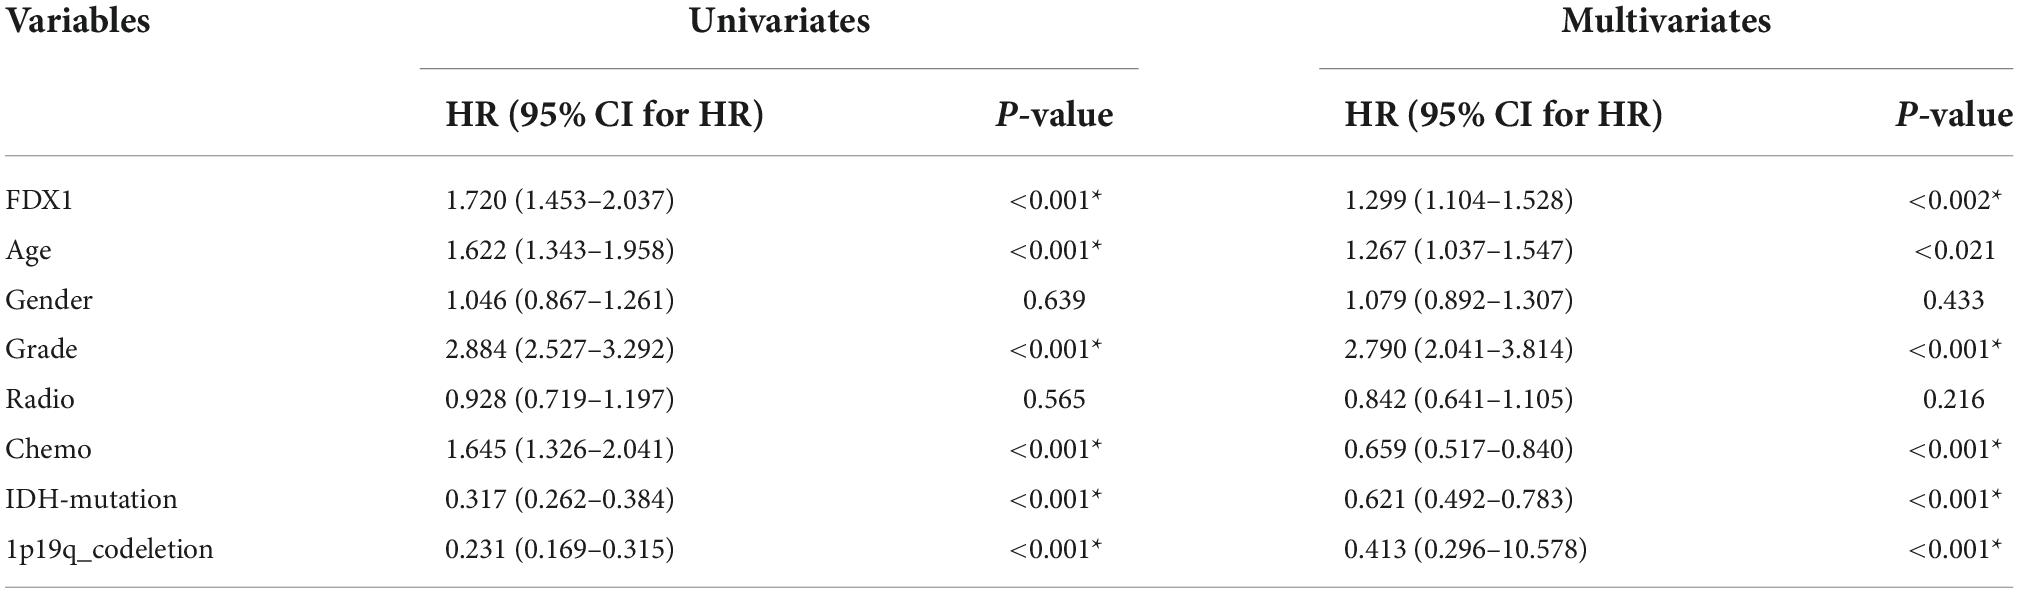
Table 1. Cox regression analysis of the clinical variables, and overall survival in CGGA cohorts.
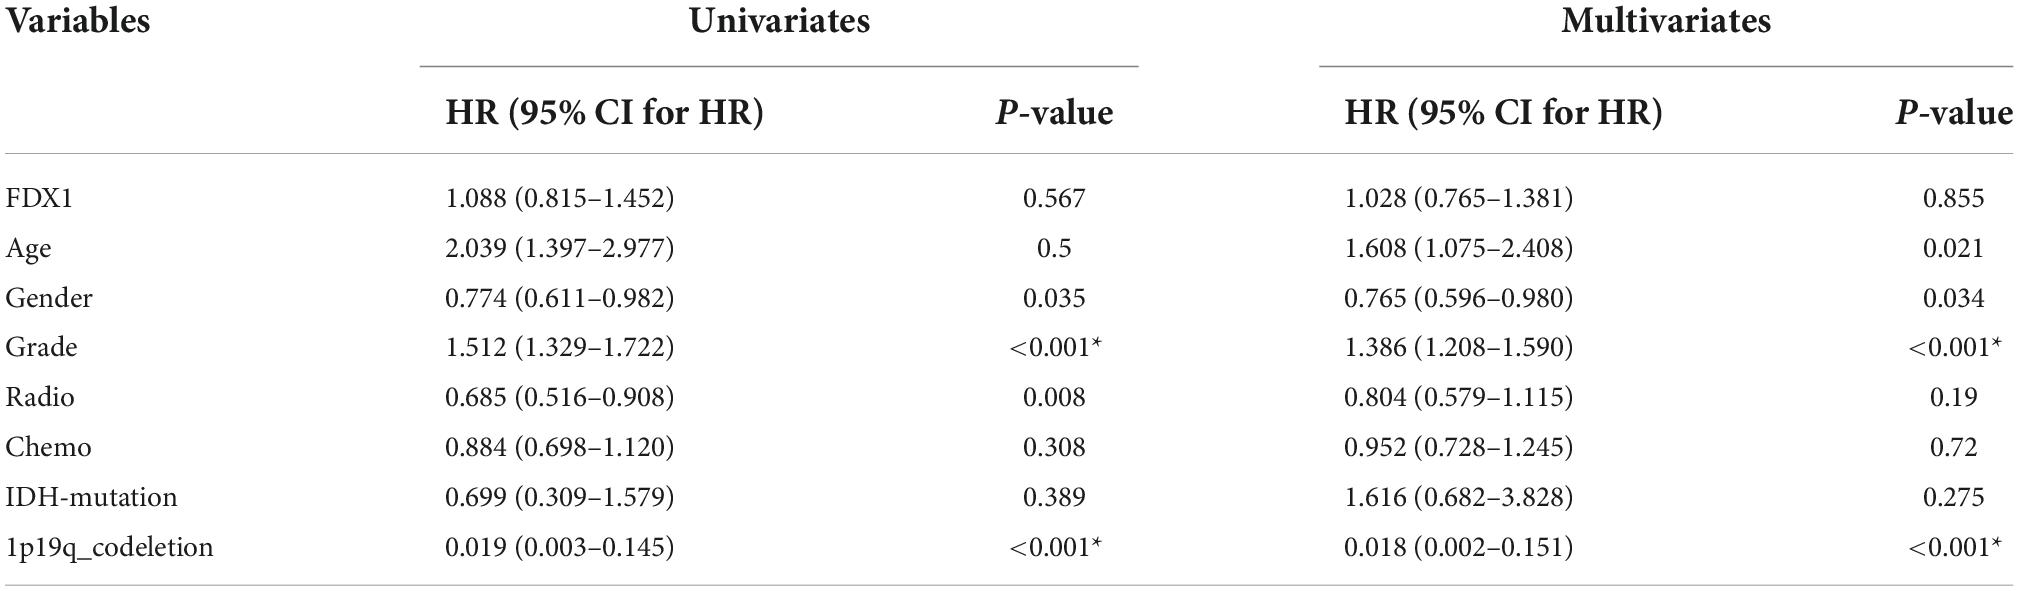
Table 2. Cox regression analysis of the clinical variables, and overall survival in TCGA cohorts.
To further explore the correlation between FDX1 expression and clinical characteristics of glioma patients. Online tool GEPIA9 was used to performed the survival analysis of LGG and GBM samples. The results showed that FDX1 expression was associated with overall survival (OS) and progression-free survival (PFS) in patients with low-grade glioma, but not with OS or PFS in GBM patients (Figure 4A). Further, we separately analyzed the correlation between FDX1 expression and prognosis in all glioma patients, LGG and GBM patients. The results showed that high expression of FDX1 was significantly associated with the prognosis time of all glioma patients. FDX1 expression is significantly associated with prognosis in LGG. However, the prognosis is not significantly different from that of GBM (Figure 4B). At the same time, we verified the result in three independent cohorts of CGGA, and the conclusion indicate that high expression of FDX1 gene was associated with the overall prognosis of glioma (Figure 4C).
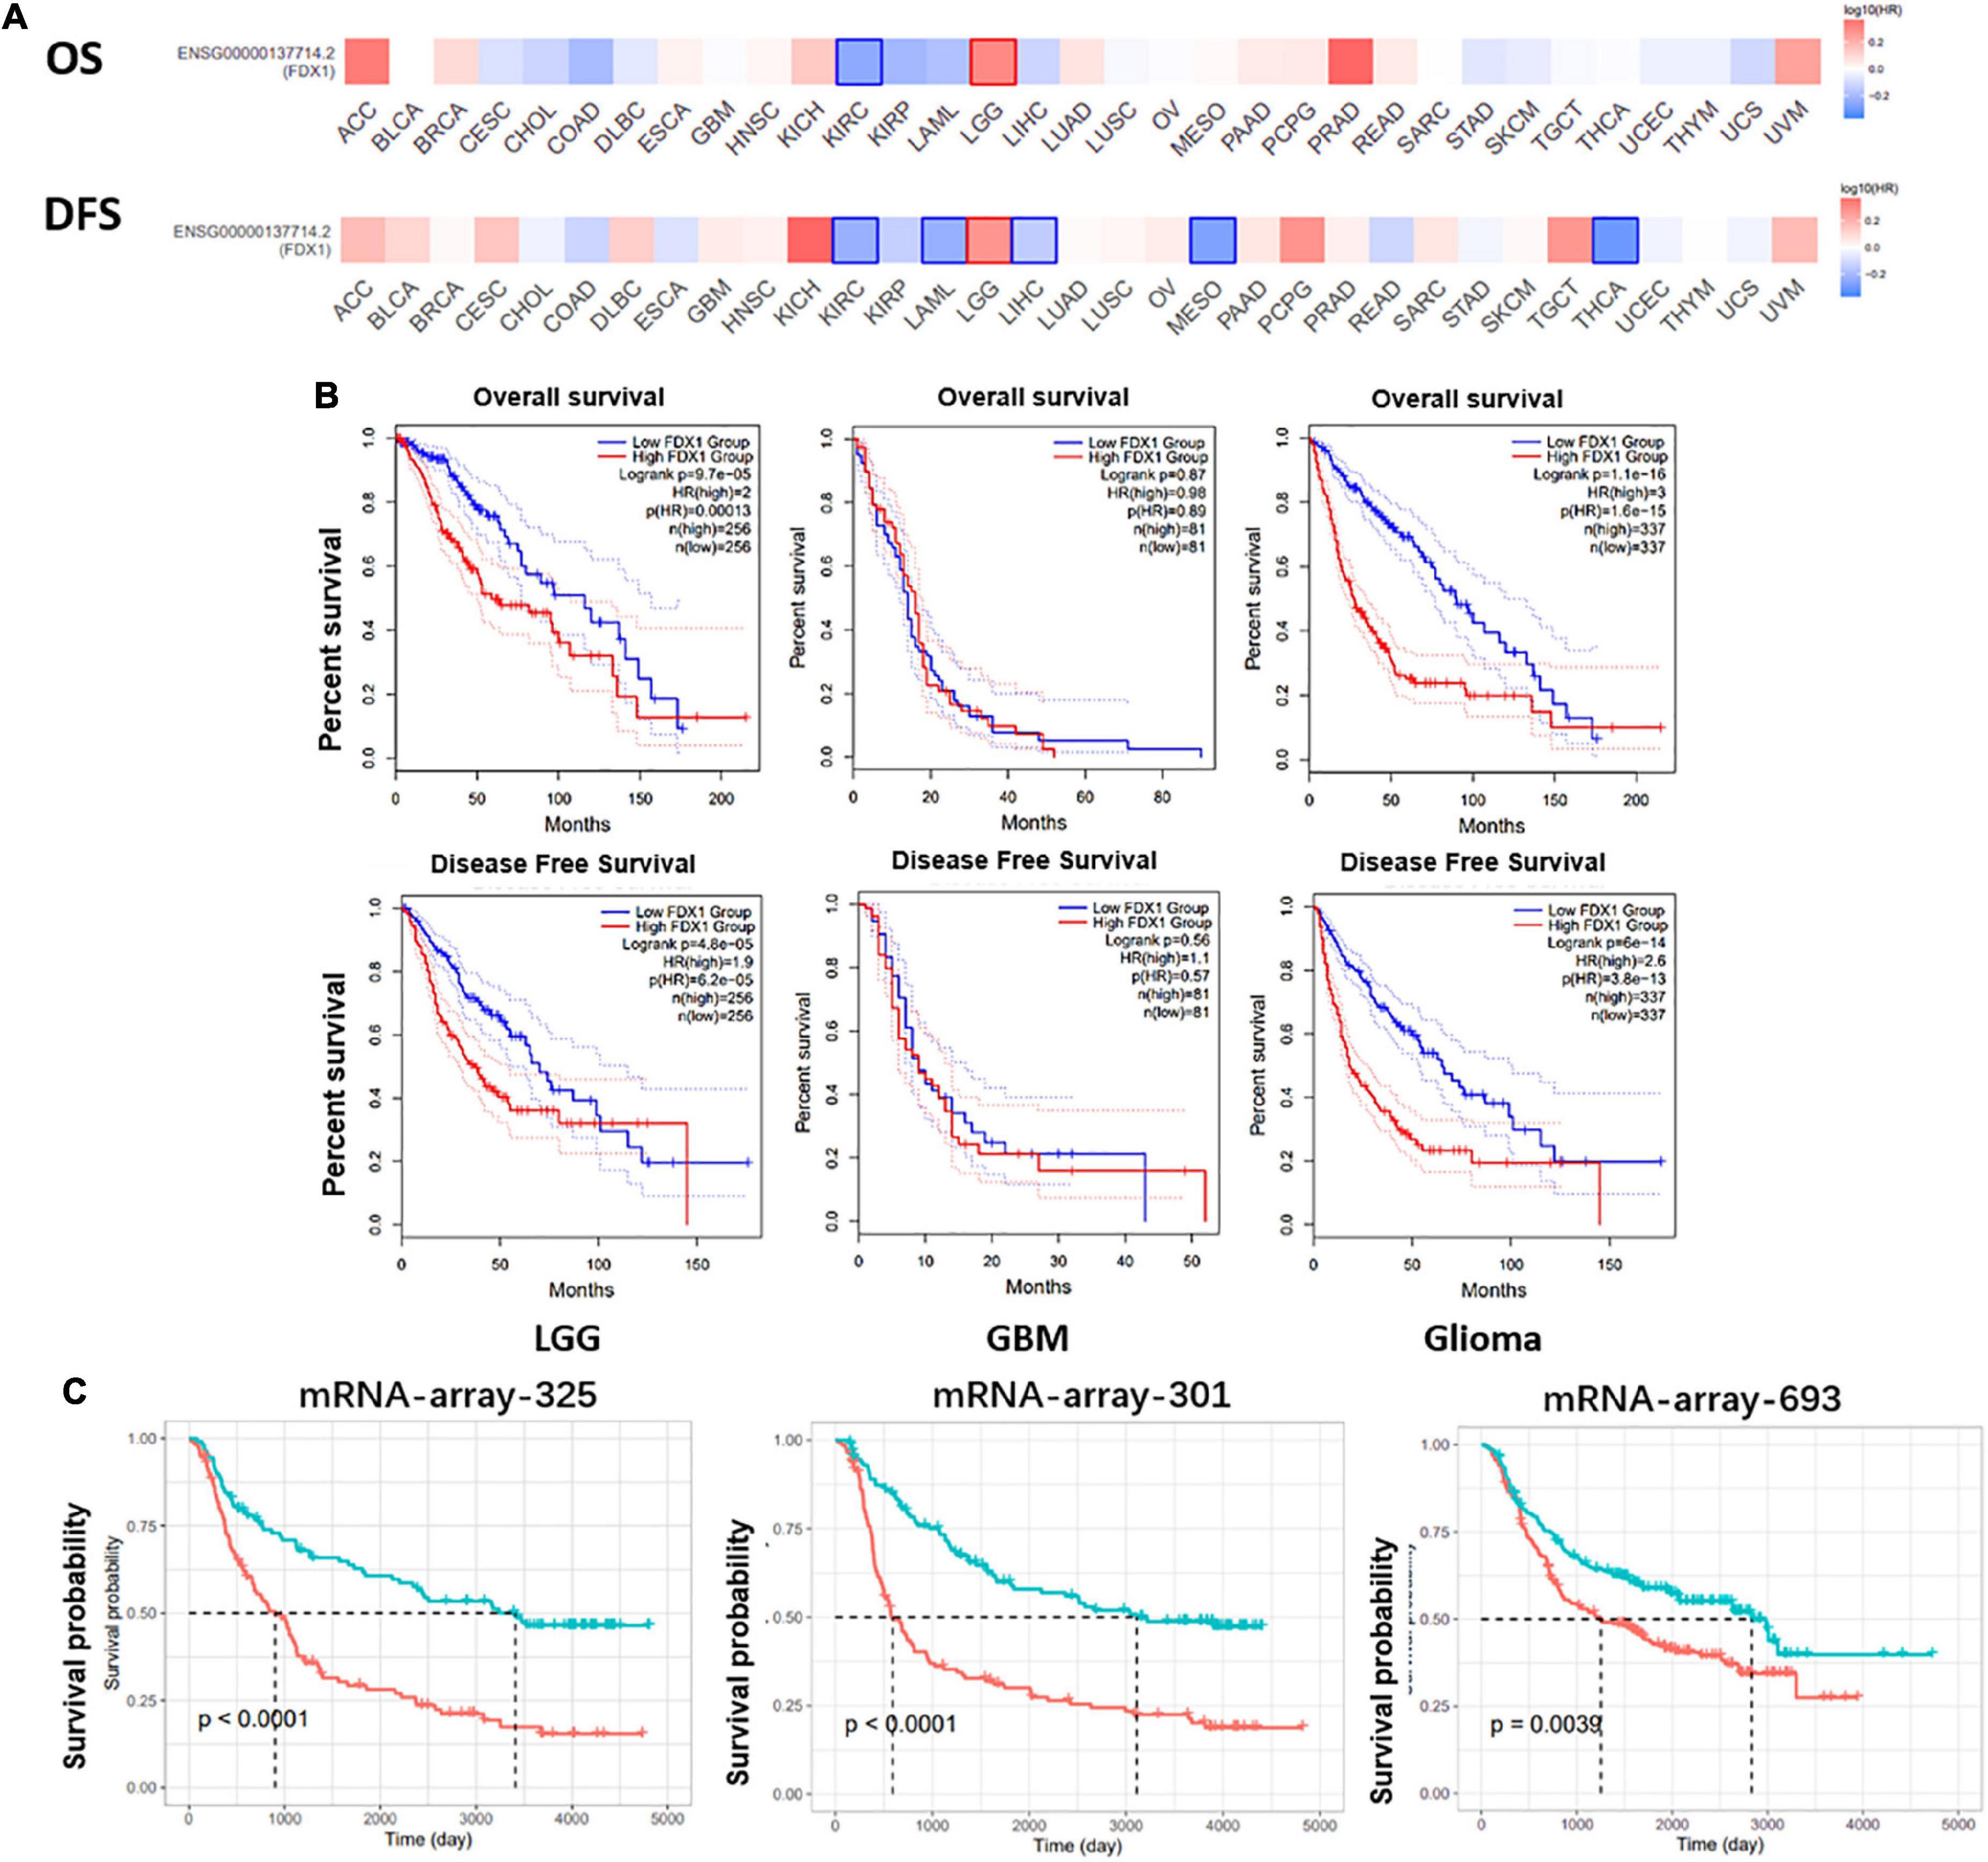
Figure 4. Potential prognostic value of FDX1 in glioma. (A) The overall survival and progression-free survival curve of FDX1 in glioma. (B) Survival analysis of glioma in TCGA database. (C) Survival analysis of glioma in CGGA datasets.
To further understand the relationship between FDX1 gene mutations and tumor clinical characteristics, we used the cBioPortal platform to analyze the frequency mutations in 33 cancers from the TCGA database. The results showed that FDX1 had a lower mutation frequency in tumors (Figure 5A). The mutation frequencies were 0.6 and 0.4% in GBM and LGG samples (Figure 5B). At the same time, FDX1 gene interaction network constructed by GeneMANIA database. The results suggested that FDX1 may be closely related to redox homeostasis, nutritional stress and assembly process of oxygen-sulfur cluster complexes (Figure 5C).
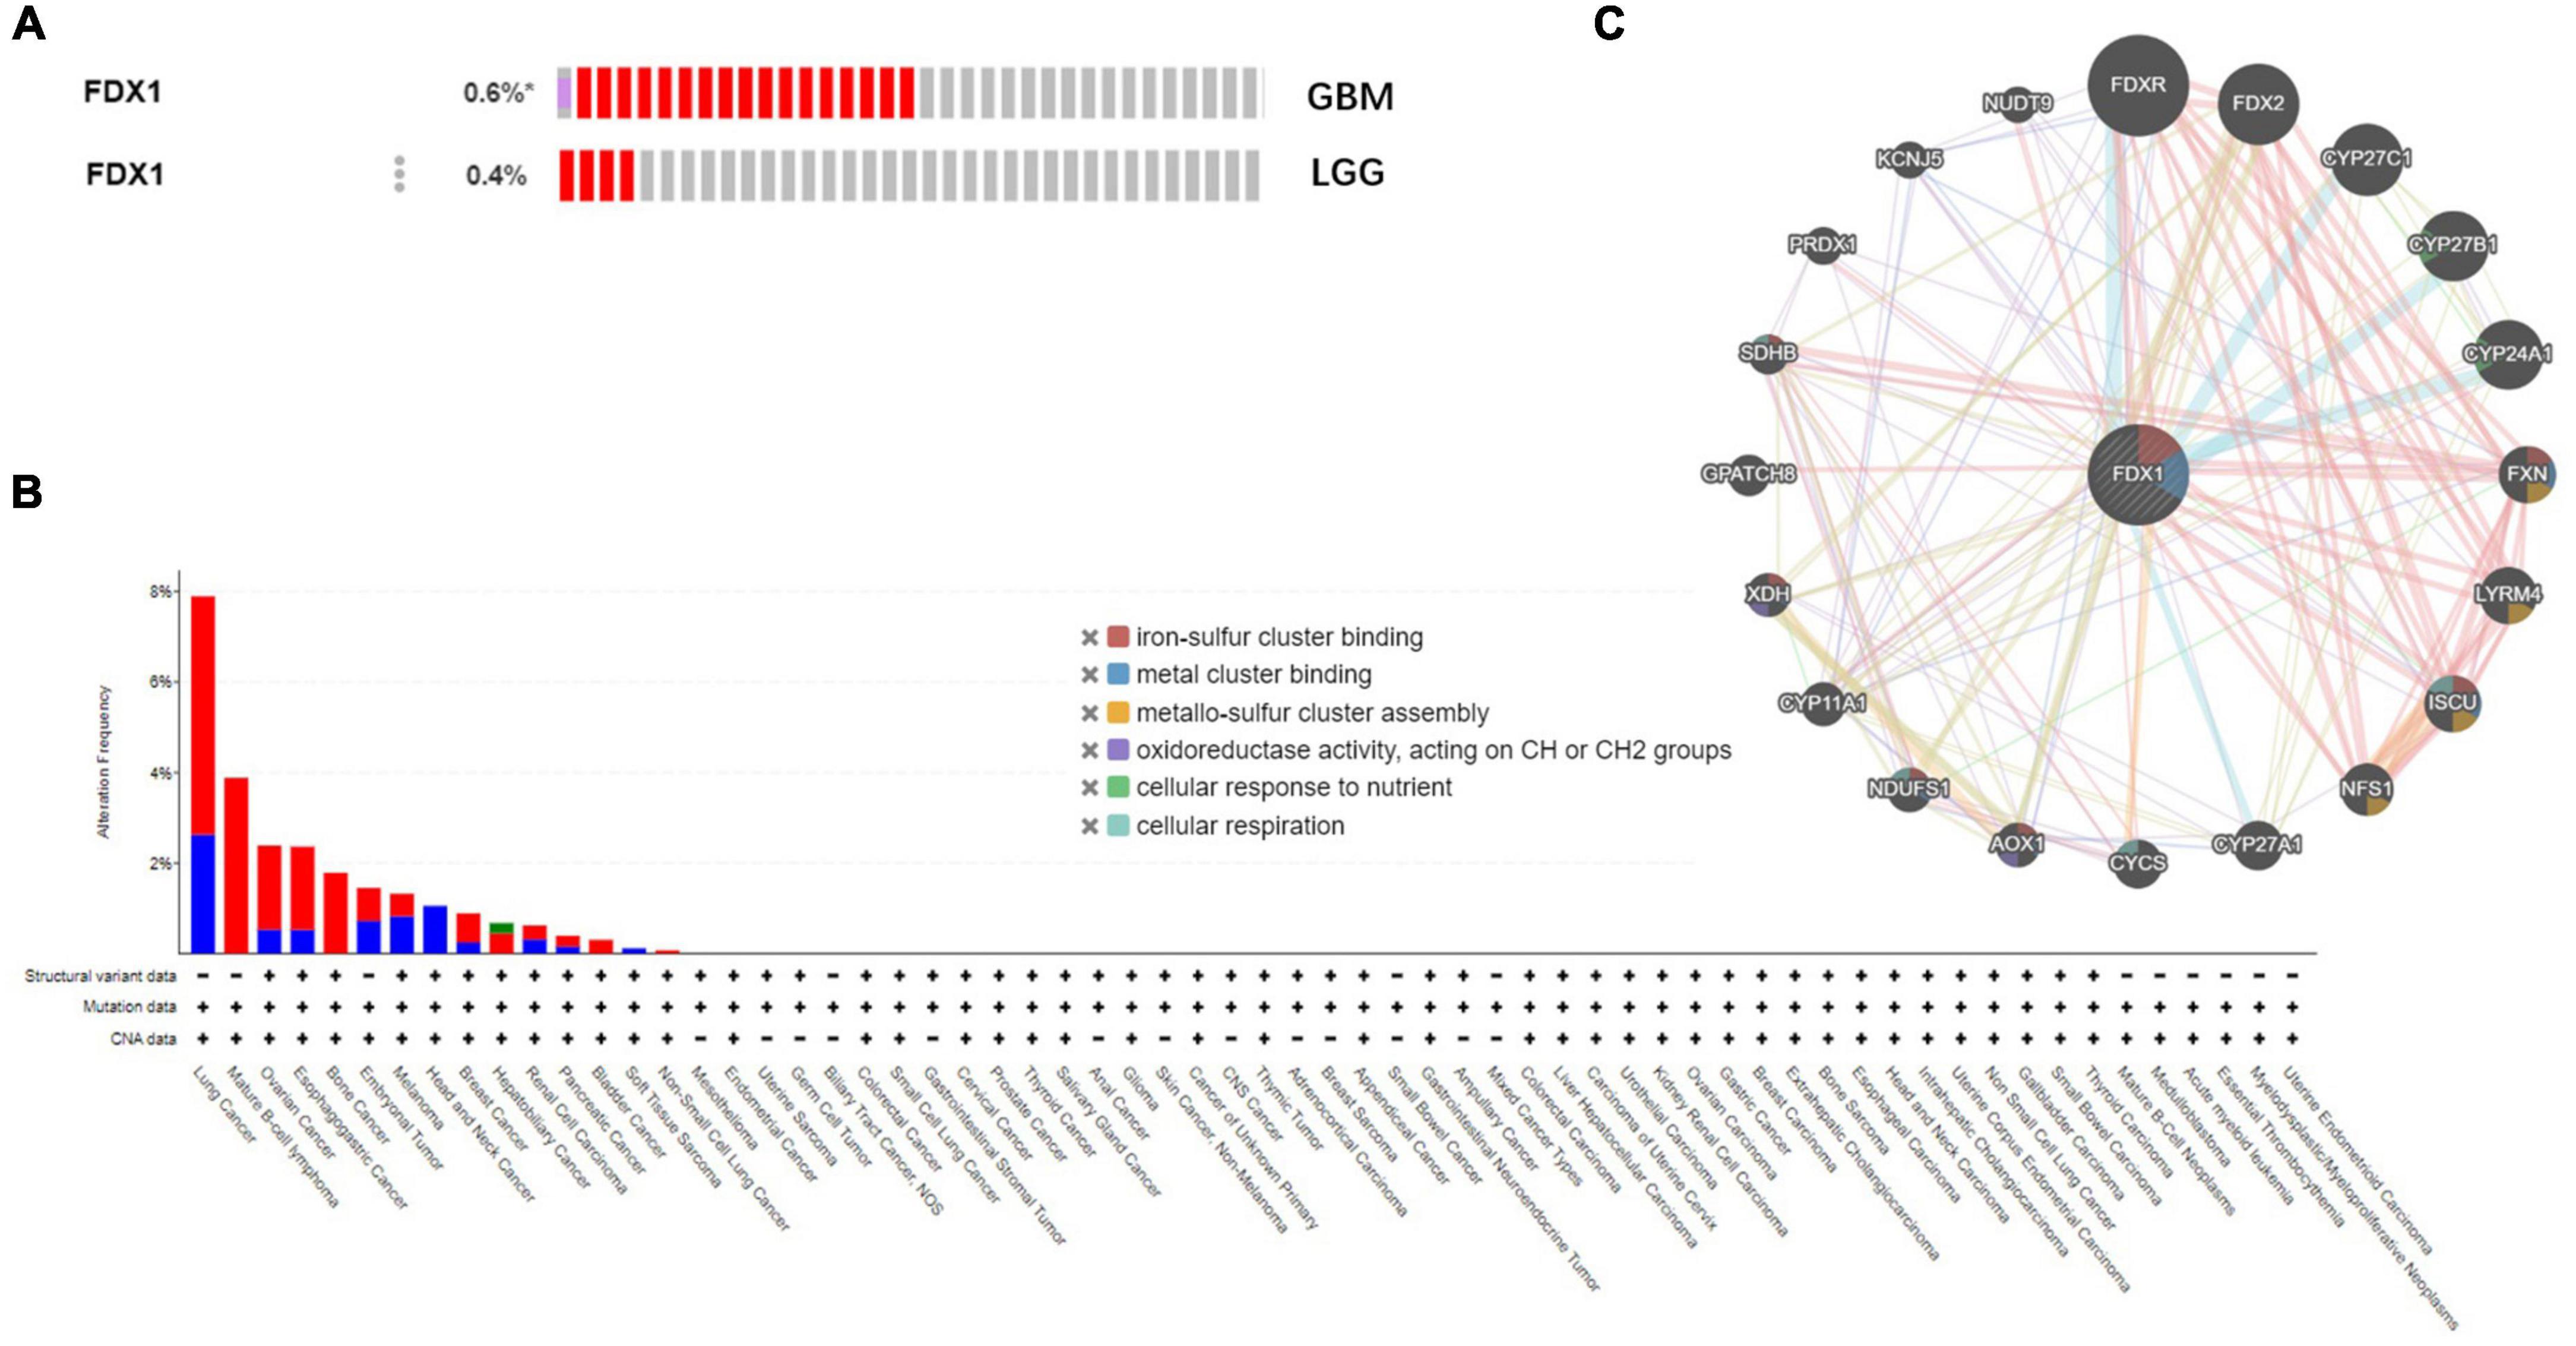
Figure 5. Genetic alterations and interactions of FDX1 gene in glioma. (A) Genetic alterations of FDX1 gene in cBioPortal database. (B) Mutation frequency of FDX1 gene in GBM and LGG samples. (C) Interaction network analysis of FDX1 gene was performed by GeneMANIA.
To further explore the function of FDX1 in glioma, we used the LinkedOmics database to analyze the gene co-expression network centered on FDX1 in glioma. As shown below, in the volcano plot, red represents positive correlated genes co-expressed with FDX1, and the green represents negatively correlated genes co-expressed with FDX1 (Figure 6A). We selected genes in the top 50% for further correlation analysis and visualized them with a heatmap (Figure 6B). Gene GO annotation and KEGG pathway enrichment analysis (GSEA) results showed that FDX1 and its co-expressed genes were mainly related to cellular protein lipoylation, lipid metabolism, small molecule metabolism and immune response (Figures 6C,D).
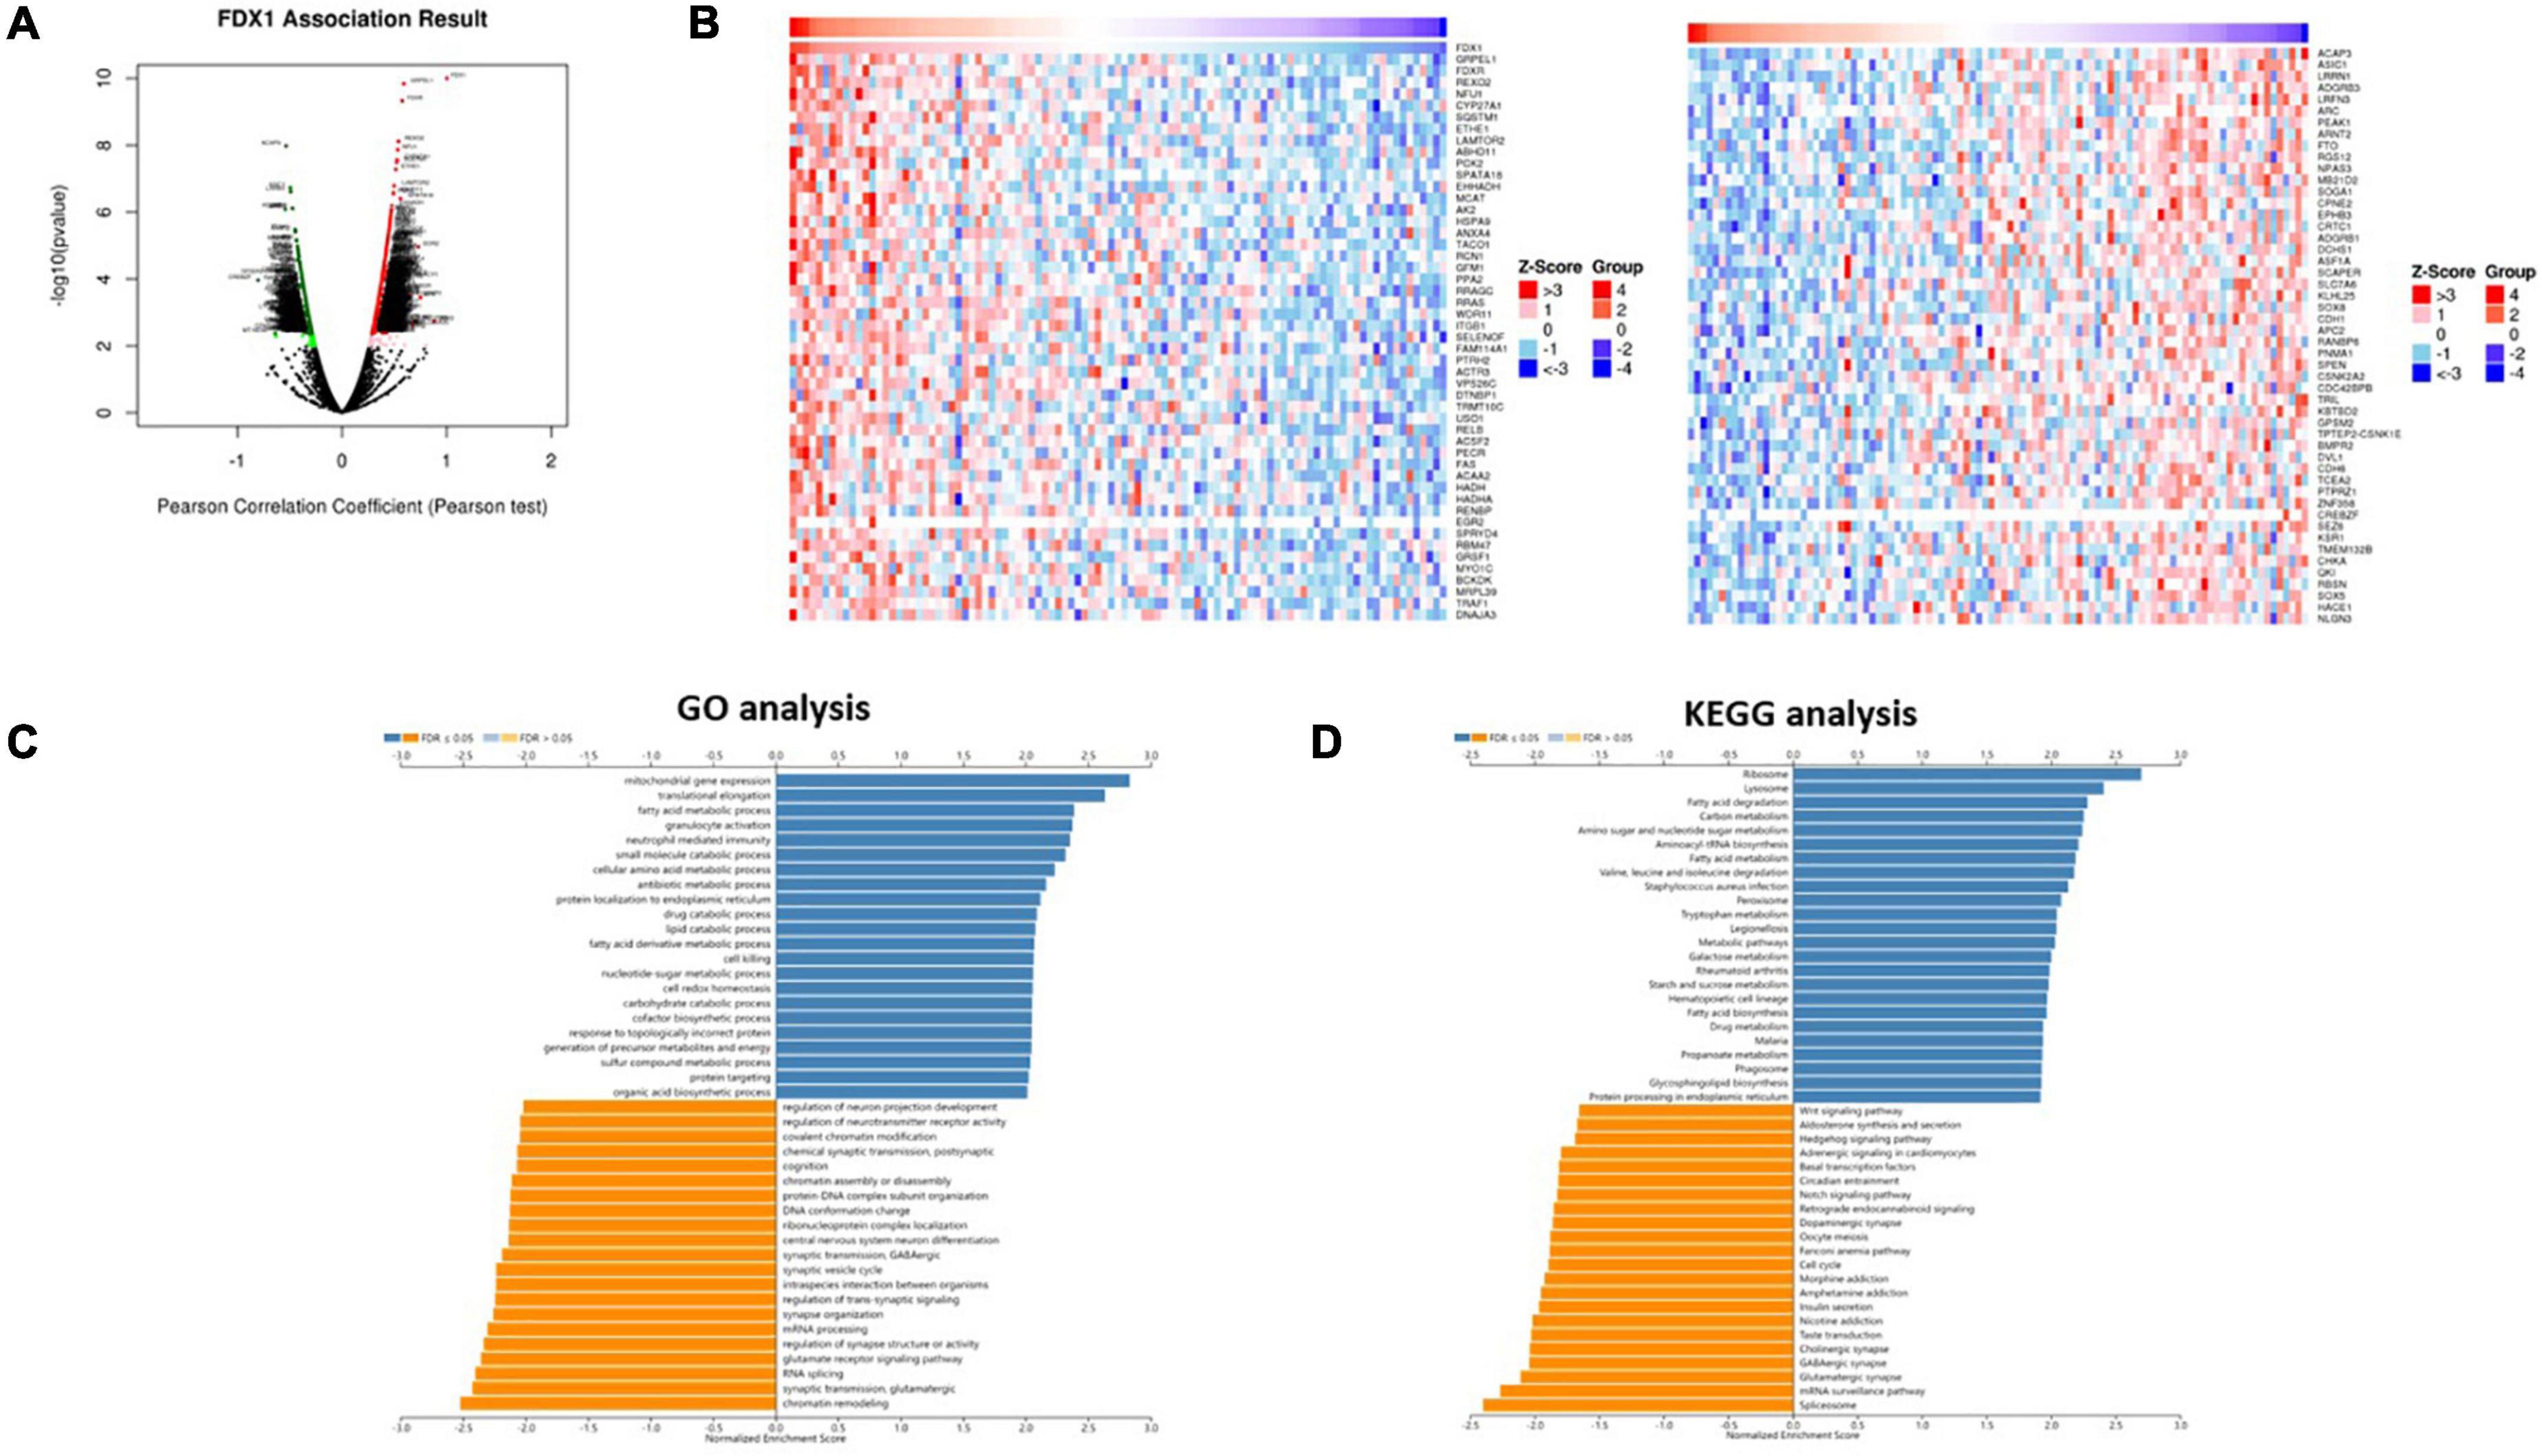
Figure 6. Co-expression network of FDX1 gene in glioma. (A) The scheme showed FDX1-related differentially expressed genes in glioma. (B) The scheme showed FDX1-related genes in glioma. (C) Genes of FDX1 co-expressed enrichment analysis performed by LinkedOmics (GSEA method).
Next, to clarify the relationship between FDX1 gene expression and immune cell infiltration in the tumor microenvironment, the TIMER2.0 platform were used to analyze different dimensions of immunity. The results showed a positive correlation between FDX1 expression and infiltration of CD4 + positive T cells, T lymphocytes, Macophage cells and dendritic cells, and negative correlation with B cells (Figure 7A). We further analyzed the relationship between FDX1 expression and immune cell infiltration through the TISIDB database. The results showed that FDX1 expression was positively correlated with myeloid-derived suppressor cells, CD4 + T central memory T cells, Macrophage cells, and active Dendritic cells (Figures 7B,C).
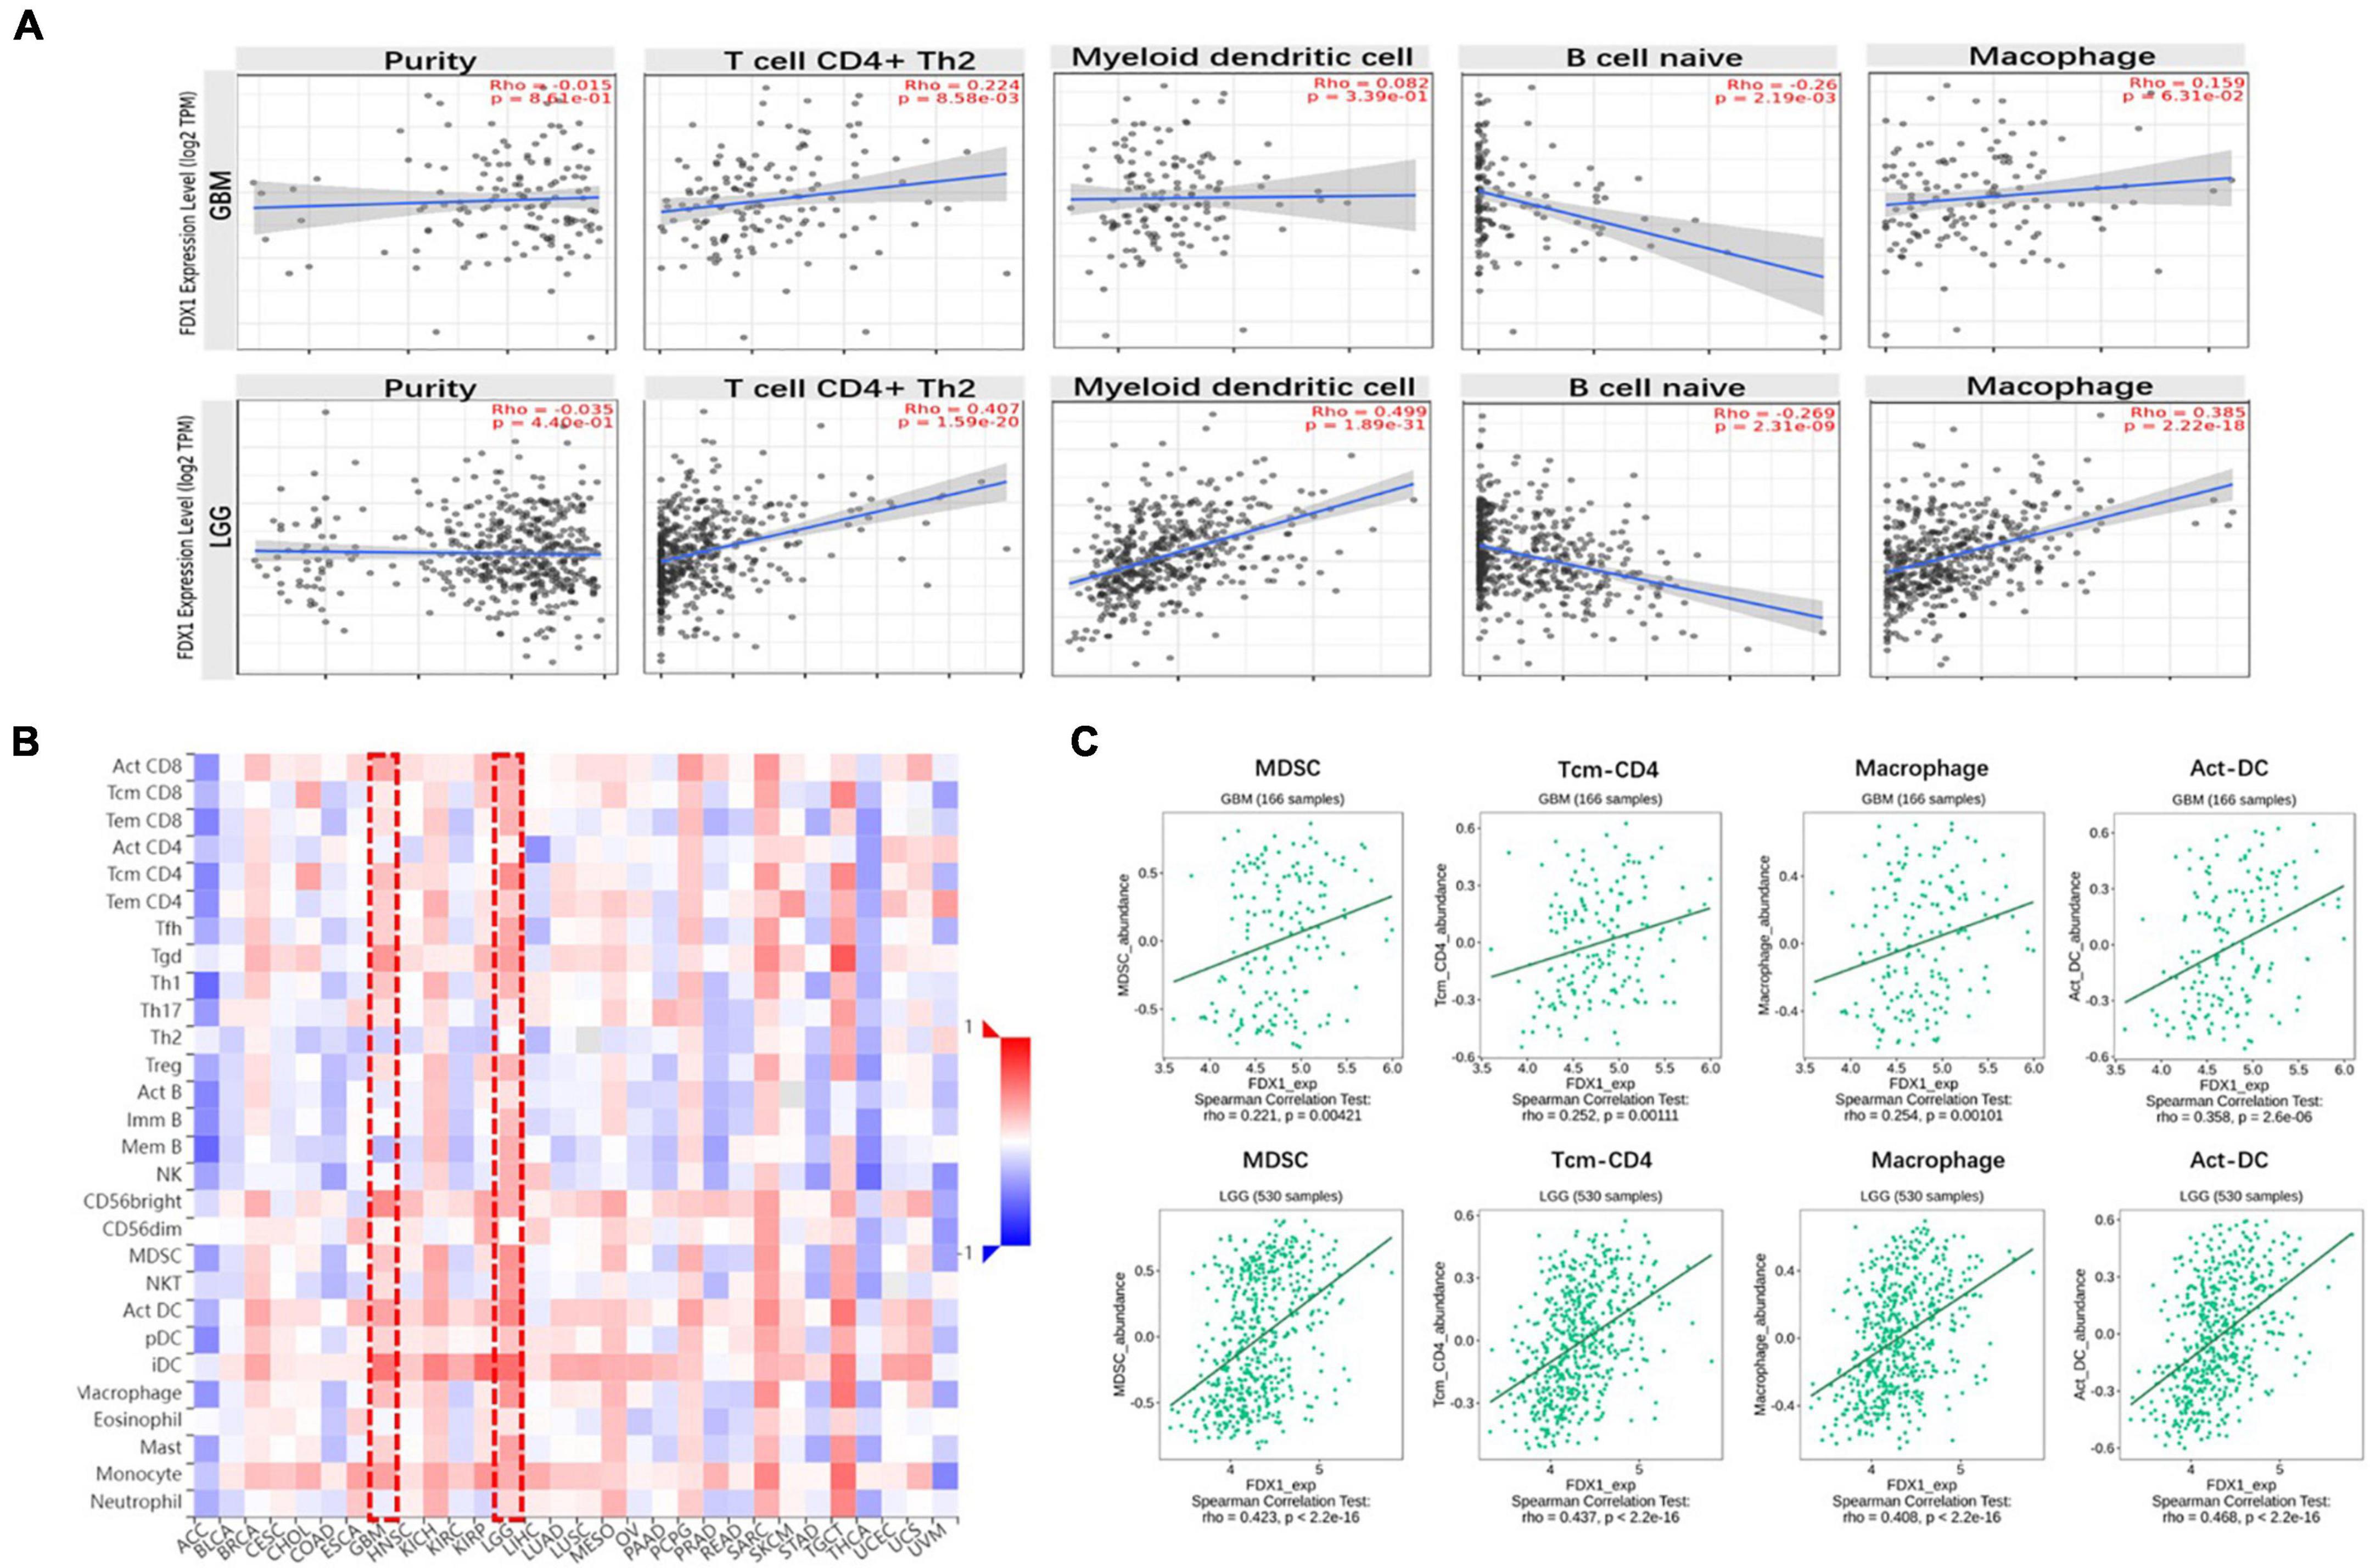
Figure 7. The relationship between FDX1 gene expression and immune infiltration level in glioma. (A) Expression of FDX1 gene related to immune infiltration of CD4 + T cells, Dendritic cells, B cells and macrophage cells in glioma. (B) Analysis between FDX1 gene expression and immune infiltration levels by TISIDB. (C) Correlations between FDX1 gene expression and Dendritic cells, effector memory CD4 T cells, Myeloid-derived suppressor cells and macrophage cells infiltration in glioma.
In order to know more about the relationship between FDX1 expression and immune cells, we analyzed the expression difference of immune cells between the high expression group and the low expression group of FDX1 gene through ssGSEA. The results showed that in FDX1 overexpression group, aDCs (dendritic cells), CD8+ T cells, helper T cells, Th1 cells (helper type 1 T cells) and Treg cells were significantly up-regulated (Figure 8).
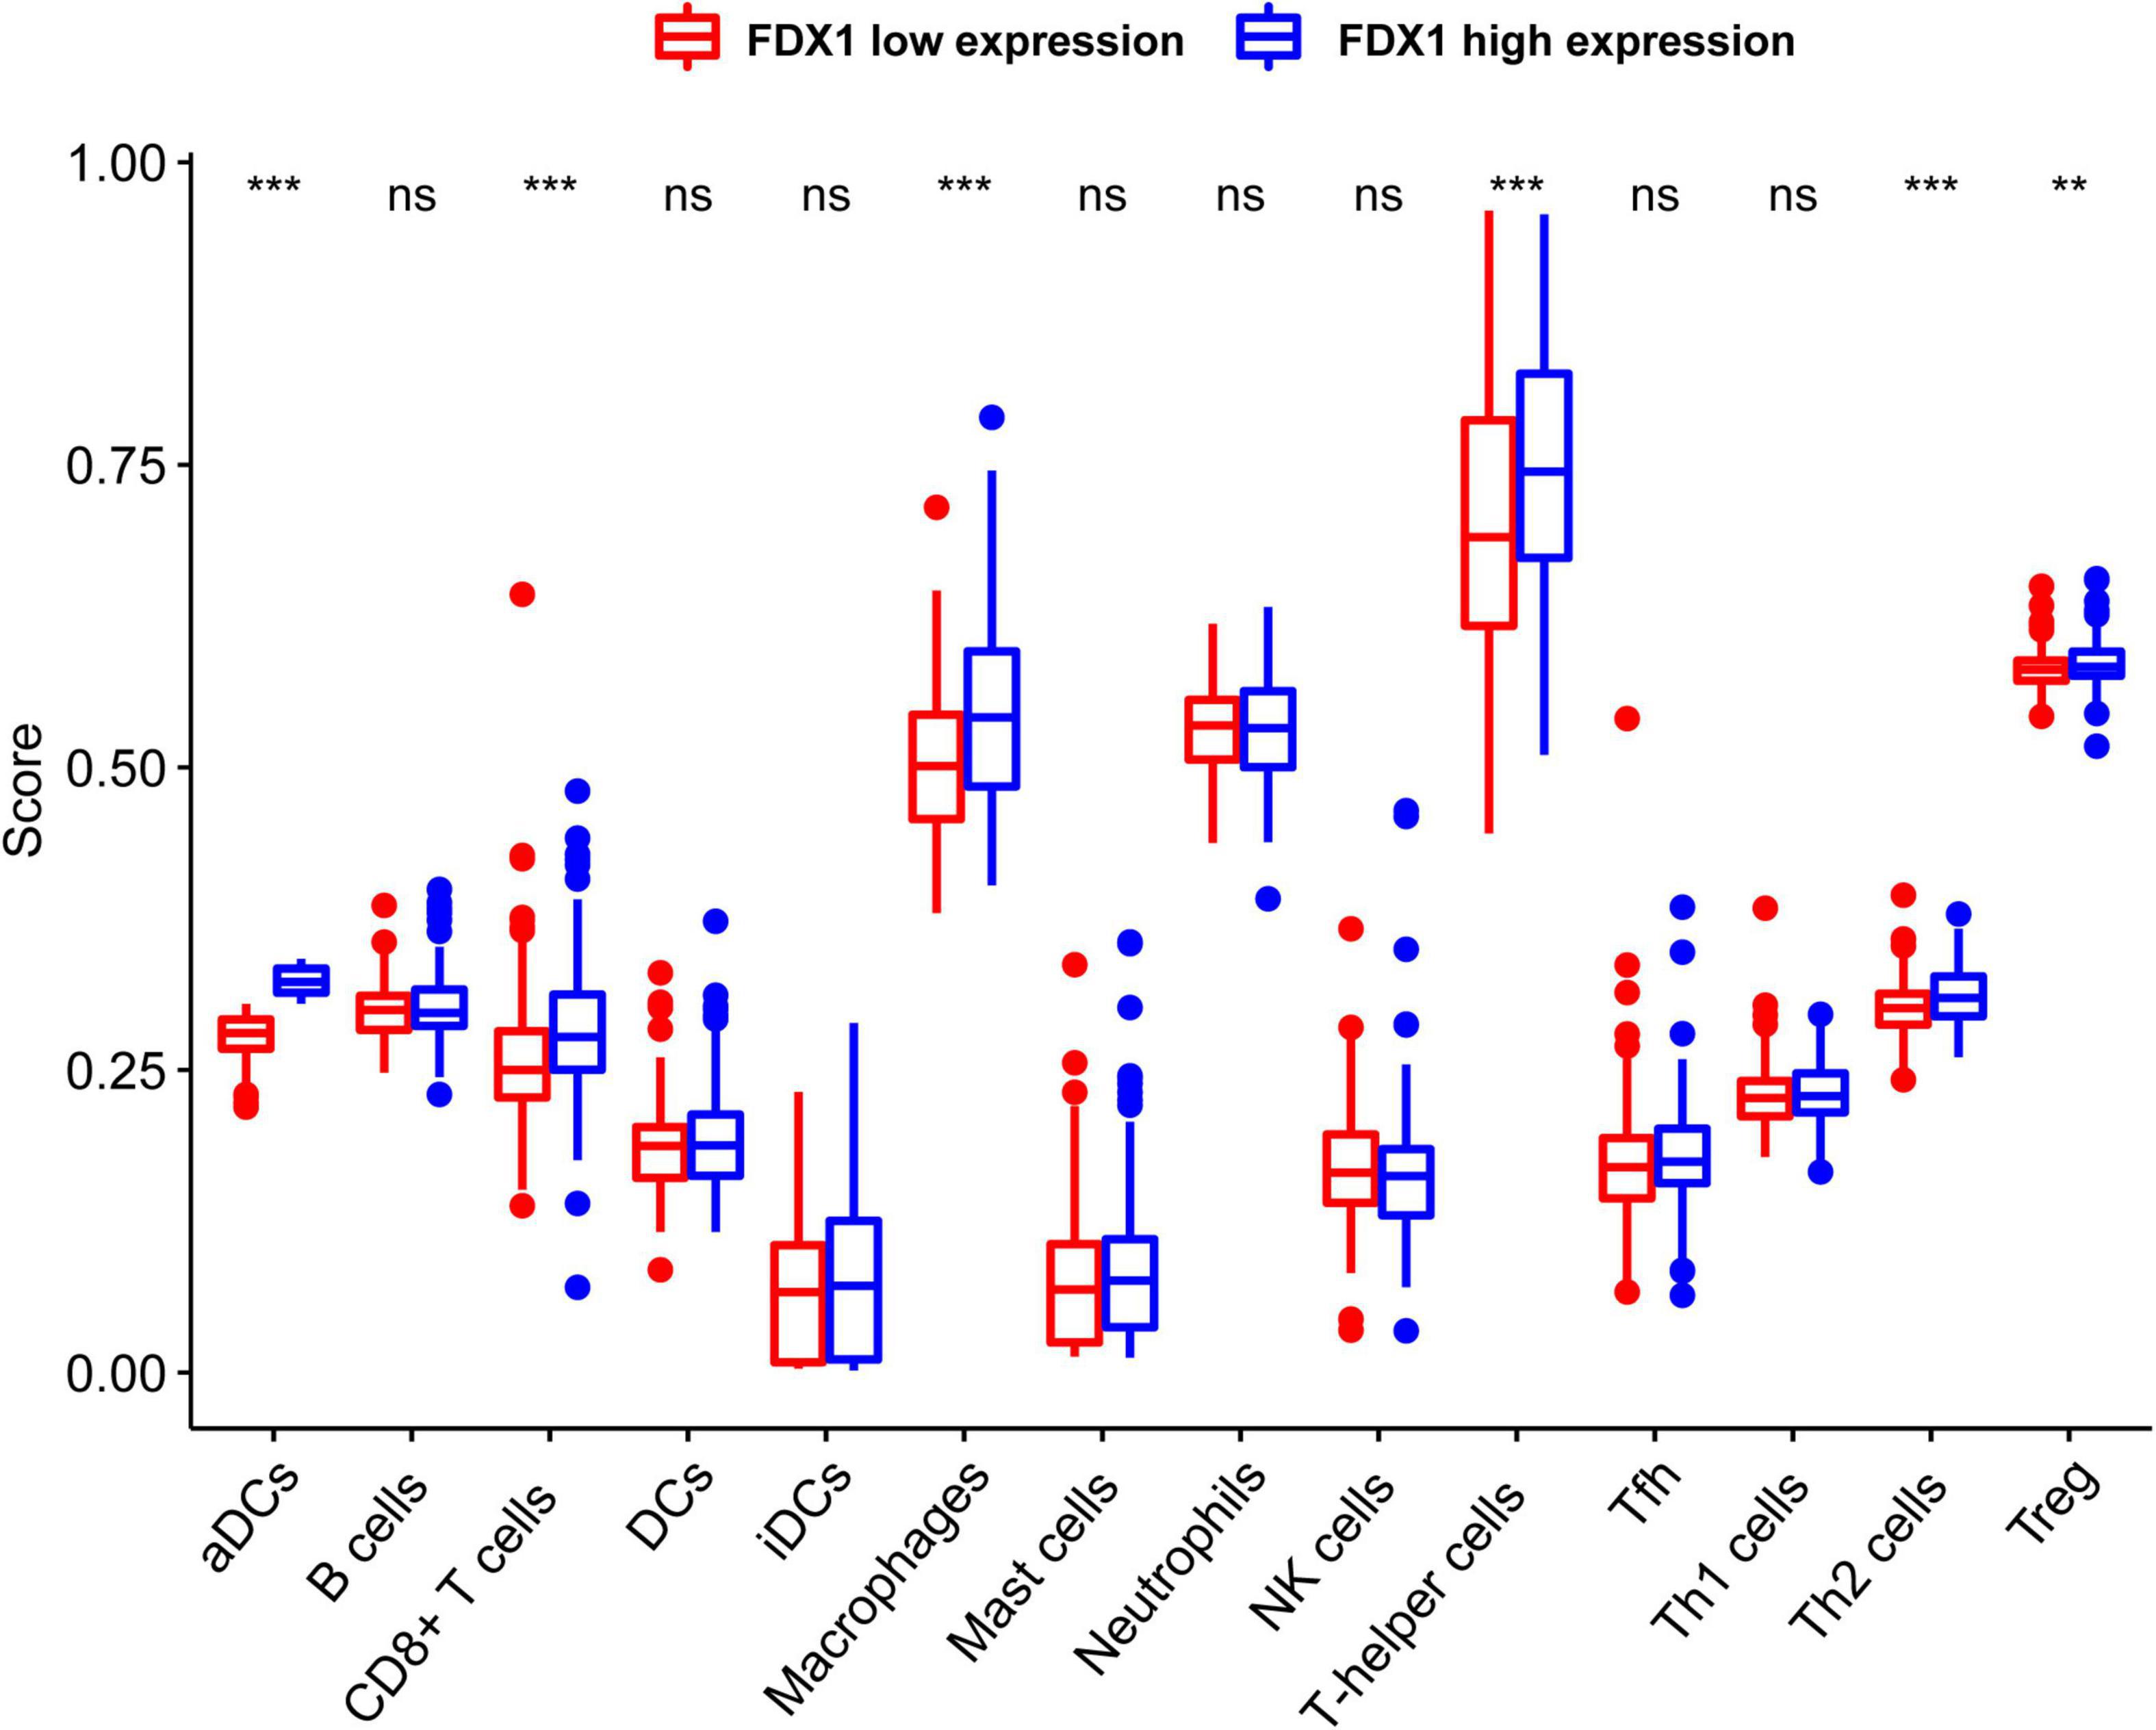
Figure 8. The expression abundance of immune infiltrating cells in Fdx1 high and low expression group was calculated by ssGSEA method (single sample GSEA). P ≤ 0.05, **P ≤ 0.01, and ***P ≤ 0.001.
To clarify the relationship between FDX1 expression and immune microenvironment. Correlation between FDX1 gene expression and immune regulatory genes, and chemokines was analyzed using the TISIDB online tool. The results suggest there was a correlation between FDX1 and immunosuppressive gene expression. The five inhibitor genes that were highly correlated with FDX1 included HAVCR2, TGFB1, CD96, IL10, and IL10Rb (Figure 9A). The genes CD86, CXCR4, MICB, and TNFRSF9 were also positively correlated with FDX1 (Figure 9B). In addition, we analyzed correlation between FDX1 expression with chemokines and apoptosis. The top four significantly positively correlated chemokines included CCL2, CCL8, CXCL14, and CXCL15 (Figure 9C). We also analyzed the relationship between FDX1 expression and chemokine receptors, and the top four receptors included CCR1, CCR5, CXCR4, and CX3CR1 (Figure 9D). Based on the above information, we speculate FDX1 may be an important immune regulatory gene.
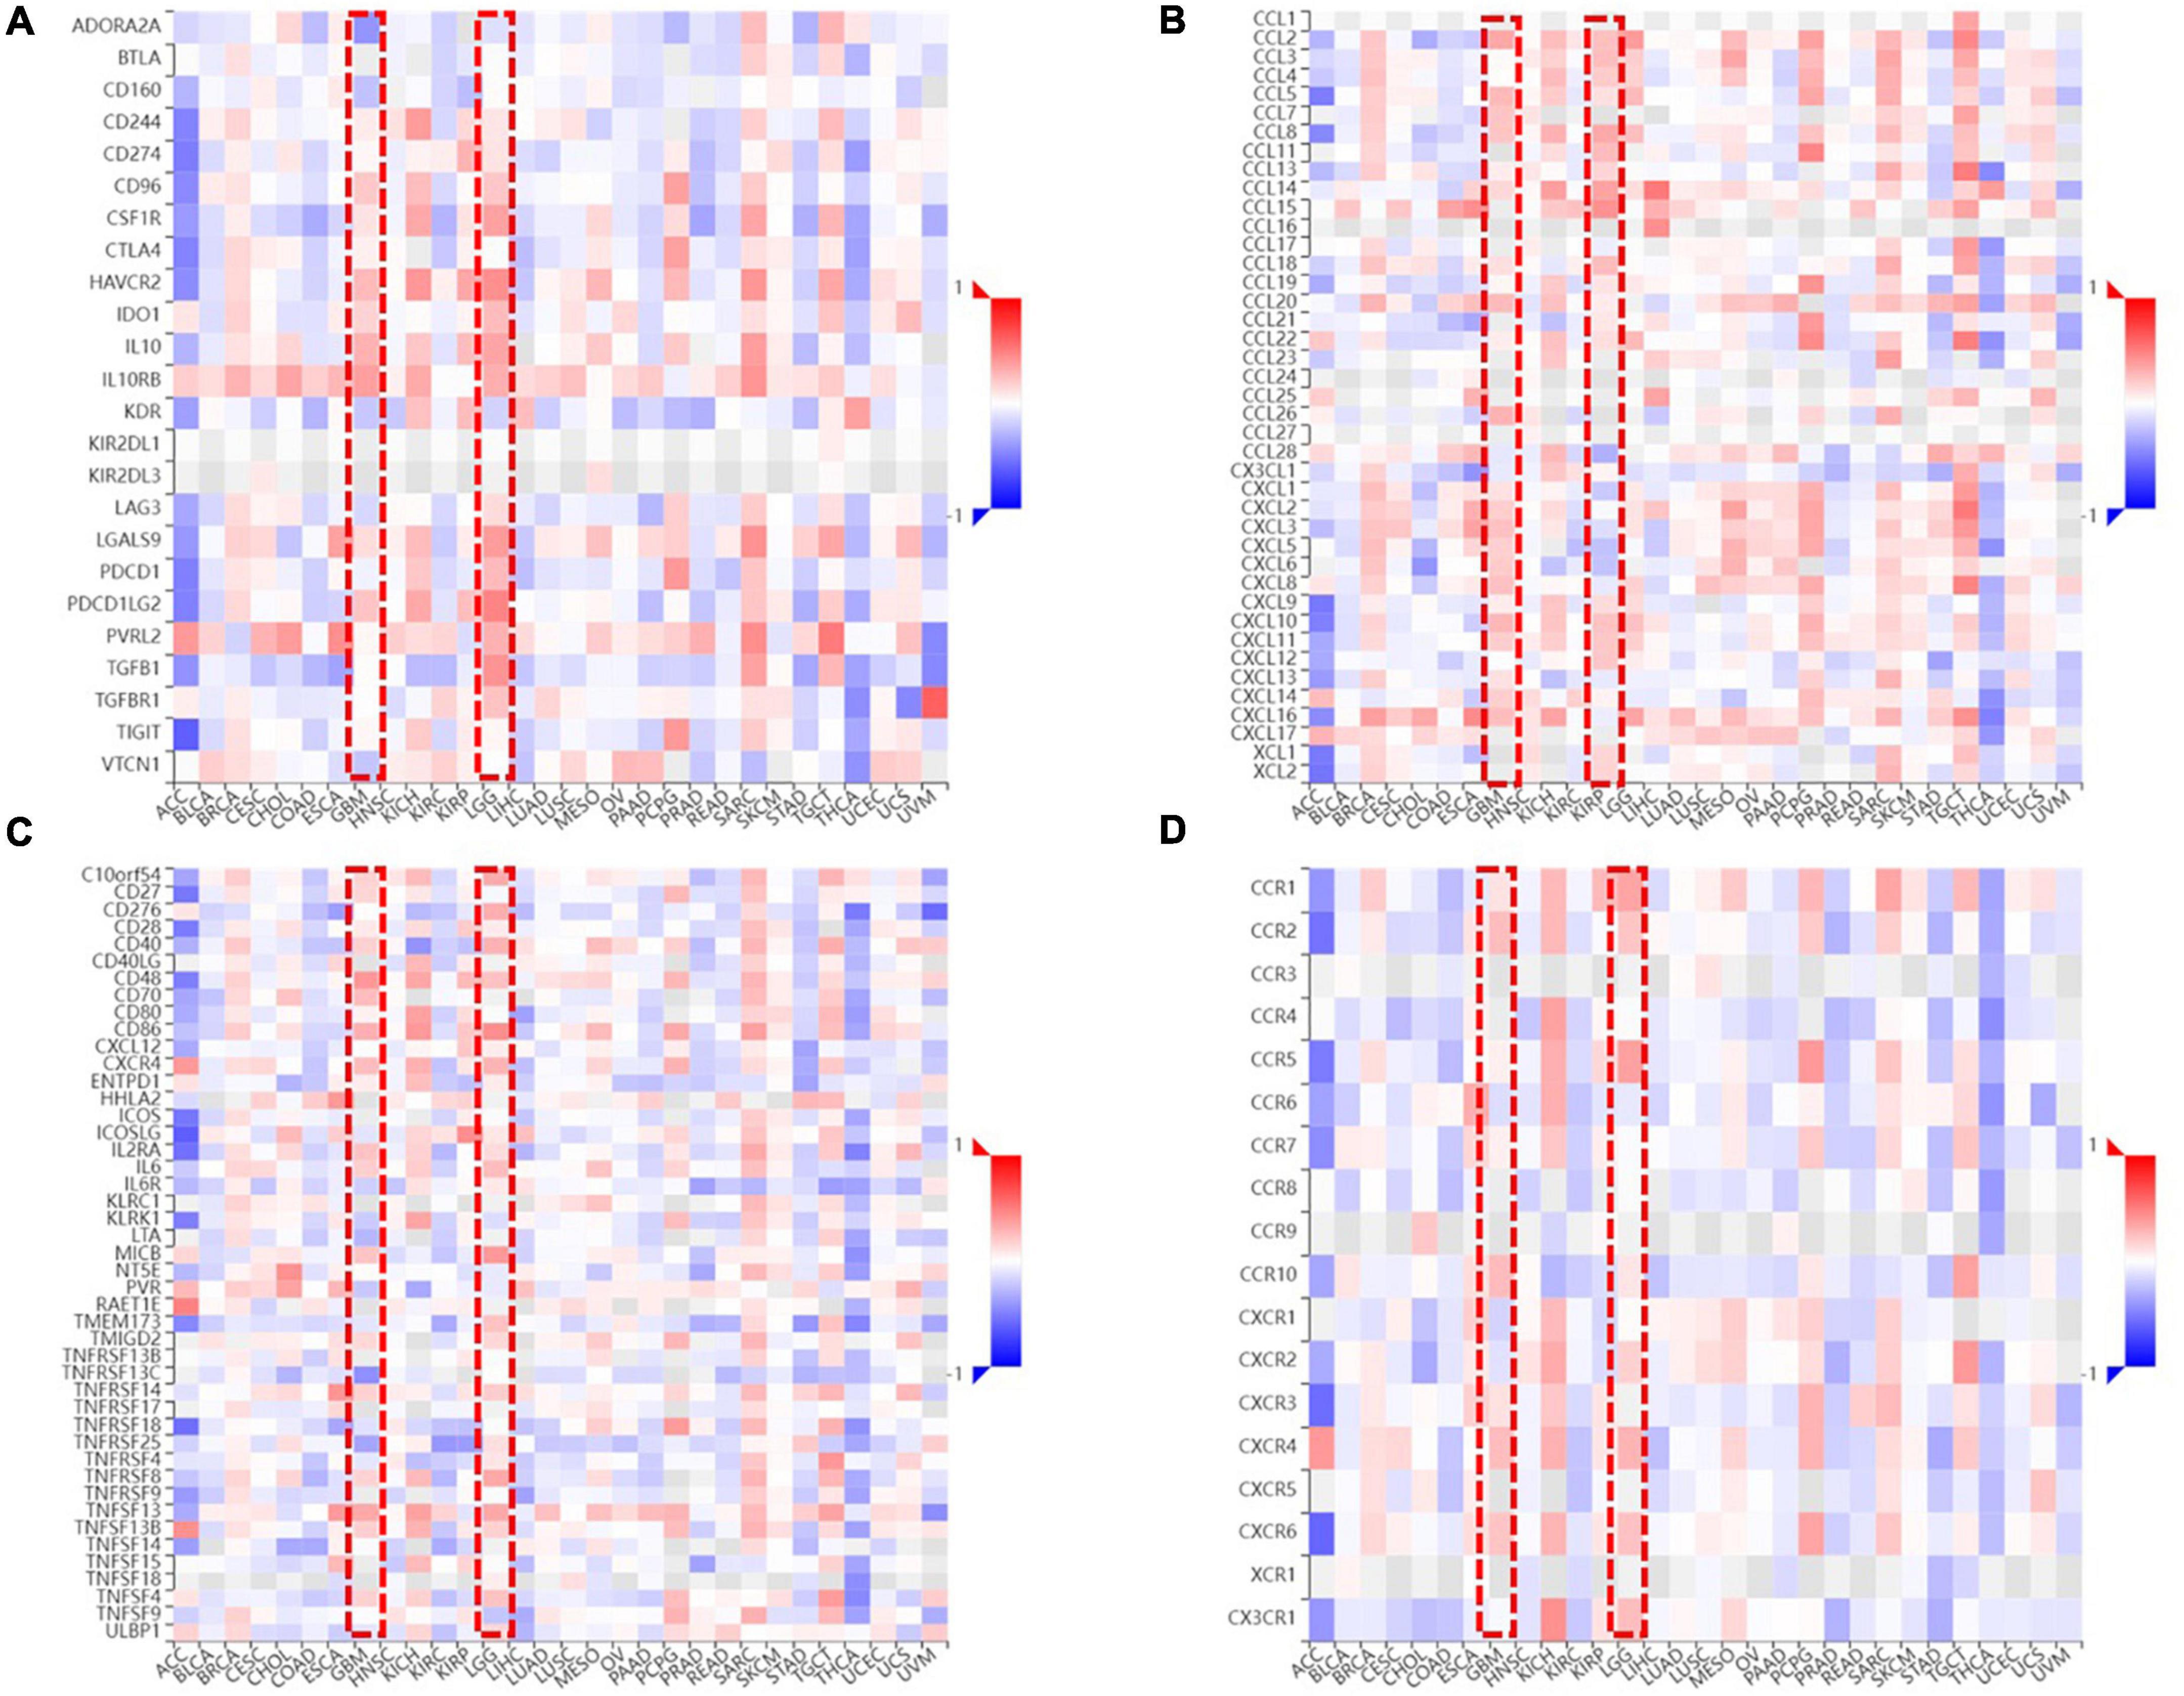
Figure 9. The relationship between FDX1 and immune-related genes expression. (A) The relationship between FDX1 and immunosuppressive genes expression in glioma. (B) The relationship between FDX1 and glioma immunostimulatory genes expression in glioma. (C) The relationship between FDX1 and chemokine genes expression in gliomas. (D) The relationship between FDX1 and receptor genes expression in glioma.
Since the key genes and important regulatory mechanisms of Cuproptosis are still in the preliminary stage of exploration, the upstream regulators of FDX1, downstream effector proteins, Cuproptosis signals transduction and the specific lethal molecular mechanisms have not yet been elucidated. Available evidence indicate that Cuproptosis of tumor cells mainly depend on protein lipoylation process. However, only 10 key genes have been identified so far, and the identification of more Cuproptosis key genes is of great significance for further elucidating its molecular mechanism. It is also due to the programmed death “ferroptosis” induced by metal ions homeostasis inblanced, which is generally considered to be an autophagy-dependent programmed death process. This phenomenon enlightens us, on whether the Cuproptosis process is also an autophagy-dependent death process?
Although, recent reports and our enrichment results in this study indicate that FDX1 expression is associated with cell death. But there are still many questions that remain unexplained. To further explore the potential key genes of Cuproptosis and whether there is a correlation between Cuproptosis and autophagy, we analyzed the relationship between FDX1-related genes through gene co-expression network analysis methods. Correlations between lipoylation and autophagy-related genes.
Interestingly, except identified lipoylation process genes LIAS, LIPT1, DLD, DLAT, PDHA1, PDHB, MTF1, GLS, and CDKN2A. Two other key genes of lipoylation, LIPT2 and PPAT, may be potential Cuproptosis regulator genes, which may be downstream effectors of FDX1 according to the annotation results (Figures 10B,C). At the same time, by analyzing the correlation between the FDX1 gene and autophagy genes, we found that FDX1 was significantly positively correlated with the expression of key genes Atg5, Atg12, BECN-1, and Atg16L in the autophagy process (Figure 10A). This information suggests that Cuproptosis, similar to ferroptosis, may be a programmed death of cells associated with the development of autophagy.
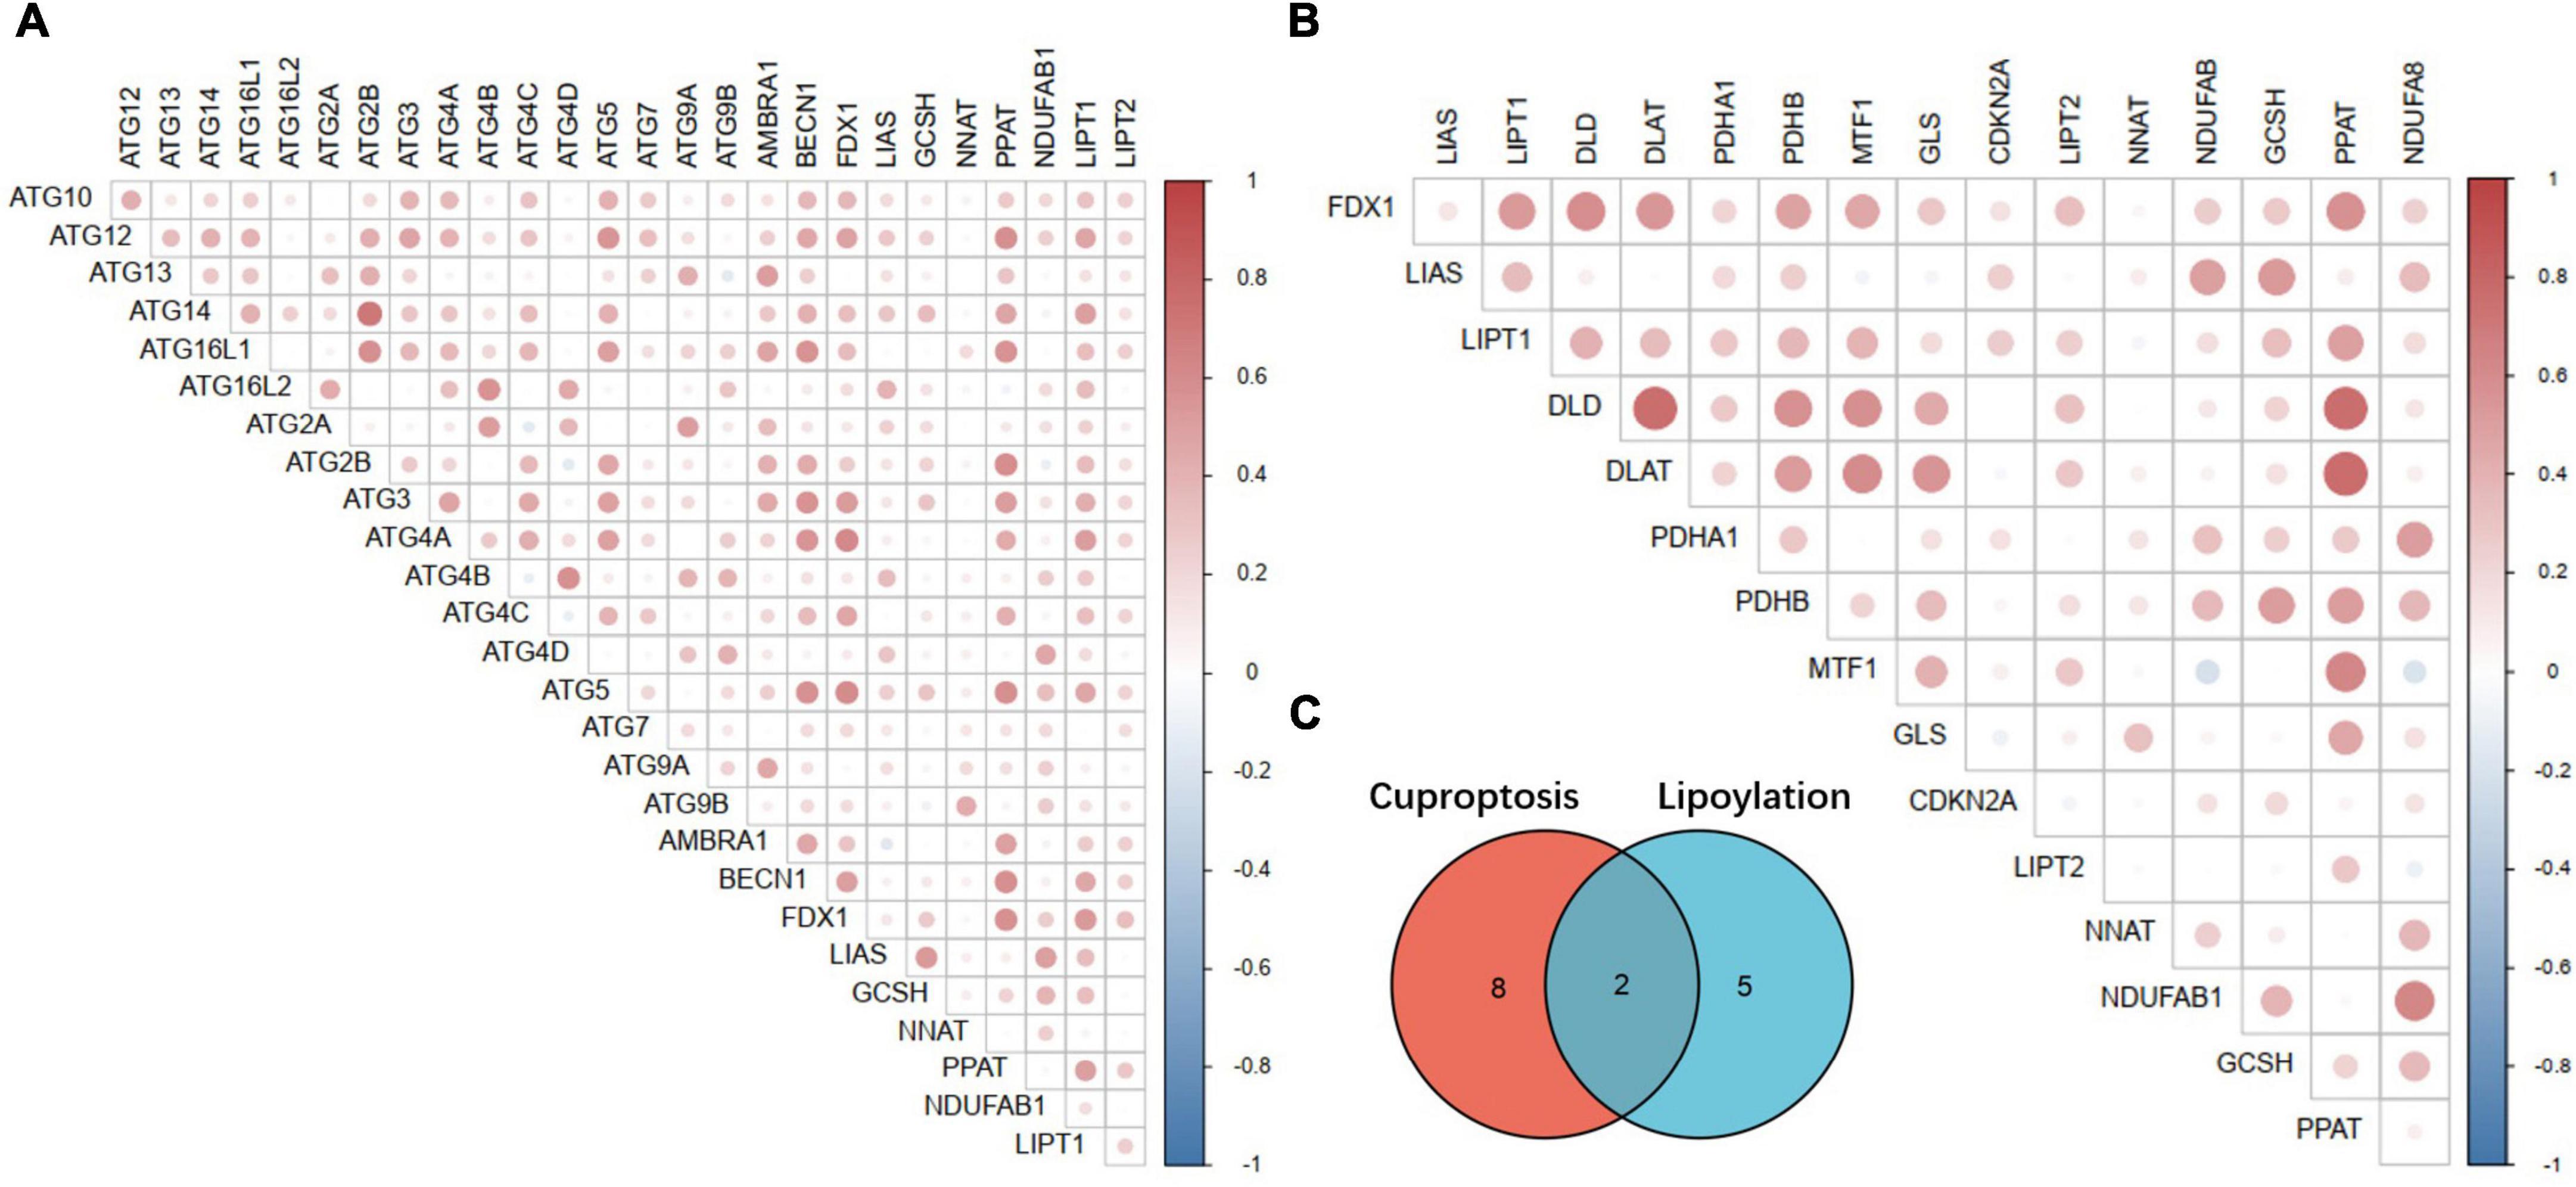
Figure 10. Correlation analysis between key Cuproptosis genes, autophagy-related genes and lipoylation genes. (A) Correlation analysis between Fdx1-related Cuproptosis genes and autophagy-related genes. (B) Correlation analysis between Fdx1-related Cuproptosis genes and key genes of protein lipoylation. (C) Illustration of the intersection of identified Cuproptosis and protein lipoylation genes.
As an vital part of the tumor microenvironment, multiple pieces of evidence have shown that immune cells in the microenvironment are involved in regulating tumor invasion and progression. Due to the recent performance of immunotherapy in clinical applications, immunosuppressants for specific targets represented by PD1 and PD-L1 have been successfully developed. For example, monoclonal antibodies or bispecific antibodies corresponding to antigens such as EGFR, VEGFR, PD-L1, TGFB1, and CTLA-4 have been used to treat tumors, such as acute lymphoma leukemia, colorectal cancer, and breast cancer (62–68). Although according to the existing reports and actual clinical manifestations, the benefit of immunotherapy for patients with brain tumors, especially high-grade gliomas, is limited (66, 69–73). Therefore, we speculate that the heterogeneity of the tumor microenvironment is one of the important factors limiting glioma patients’ benefit from biologically targeted therapies (70–72).
Through the analysis of data from CGGA and TCGA, we found a positive correlation between FDX1 expression and glioma grade. Further, we performed gene annotation on the co-expressed genes of FDX1 in glioma, GO annotation, and KEGG signaling pathway enrichment analysis showed that FDX1 expression is closely related to immune response and inflammation. In this study, we also found that high FDX1 expression was associated with the infiltration of immune cells, including MDSC, Tcm-CD4 cells, macrophage cells and Act-DCs in GBM and LGG.
According to current reports and consensus, the effectiveness of tumor immunotherapy mainly depends on the immune microenvironment of the tumor. One of the key factors affecting the immune microenvironment is the expression of immune checkpoint genes. By exploring the relationship between the FDX1 gene and immune checkpoint genes, we found that there is a strong co-expression relationship between the FDX1 gene and immune checkpoint Suppressor gene TGFB1 in glioma. This evidence suggests that FDX1 expression may be associated with the up-regulation of immune checkpoints.
Previous reports have found that abnormal aggregation of lipoylated proteins interferes with iron-sulfur cluster proteins in the respiratory chain complex, resulting in proteotoxic stress and cell death. FDX1 is an important regulator in the process of protein lipoylation, and its abnormal function may be related to some cell death. It is noteworthy that, Zhang Z et al. found that FDX1 gene was associated with the prognosis of Lung adenocarcinoma (LUAD) and FDX1 can promote ATP production (74). Zhang C et al. found that the expression of FDX1 has prognostic value for the survival of Adrenocortical Cancer (ACC), Kidney Clear Cell Carcinoma (KIRC), Head and Neck Cancer (HNSC), Thyroid Cancer (THCA), and LGG. In addition, the expression level of FDX1 was confirmed to be closely related to immune infiltration (75). Zhang Y. et al. found that FDX1 is an independent prognostic factor and potential prognostic biomarker of WHO grade II/III glioma (76). Wang X et al. found that the high expression of FDX1 was significantly correlated with the overall survival rate of Renal Cell Carcinoma (RCC) (p < 0.05). Variable regression analysis showed that the high expression of FDX1 was an important independent predictor of overall survival, which could be used as a potential prognostic indicator and therapeutic target for RCC (77). Zhang et al. found that the overall survival rate and disease-specific survival rate of colon adenocarcinoma patients (COAD) in the FDX1 high-expression group were better than low expression group. GO-KEGG enrichment analysis showed that FDX1 and its co-expressed genes were related to the pathogenesis of COAD. In addition, the expression of FDX1 in COAD was positively correlated with “inflammation level”. The expression of FDX1 was positively correlated with the infiltration level of CD8+T cells, NK cells and neutrophil cells but negatively correlated with CD4+T cells and cancer associated fibroblasts (78).
Recent blockbuster reports have found that FDX1, a key regulator of Cuproposis, regulates cell death by influencing fatty protein lipoylation. To further explore the role of FDX1 in gliomas, we attempted to identify potential Cuproptosis key genes by bioinformatics analysis, comparing the co-expression gene of FDX1 in gliomas with with an additional 6 lipoacylation-related genes (79–82). The key genes were subjected to intersection analysis and expression correlation analysis, to screen and identify potential Cuproptosis process genes through co-expression network research methods. Our results show that LIPT2 and NNAT and lipoylation genes such as LIAS and GLS have been reported to be strongly correlated with FDX1 expression, but not identified in this report. Therefore, we speculate that LIPT2 and NNAT may be potential key genes for Cuproptosis. Further experimental identification needs to be verified in the follow-up work.
Similar to ferroptosis, Cuproptosis is also a programmed cell death process induced by excessive accumulation of metal ions. More and more reports show that the ferroptosis of cells is an autophagy-dependent programmed death. To further explore the relationship between Cuproptosis and autophagy, we analyzed the correlation between the molecular markers of the Cuproptosis process represented by FDX1 and the key genes of autophagy in glioma by co-expression network analysis. Consistent with our expectations, the key genes for Cuproptosis and autophagy key genes, such as Atg5, Atg12, and BECN-1, were co-expressed and strongly correlated. This evidence suggests that there may be some correlation between the two. Therefore, we boldly put forward the hypothesis that as metal ion toxicity induces programmed cell death, autophagy is also a pre-stress process of Cuproptosis. When cells fail to regulate cellular homeostasis through autophagy to ensure normal cell operation, they switch to the activation of the copper ionophore receptor protein FDX1, which initiates the toxicity-induced Cuproptosis process.
The innovation of this study is that, for the first time, we found that FDX1 in glioma is associated with poor patient prognosis, and also explored the possible mechanism of FDX1 in glioma involved in the immune microenvironment. We further confirmed the correlation of FDX1 with glioma immune infiltration and proposed that FDX1 may serve as a novel immunotherapy biomarker. Therefore, our results will provide a certain reference for immunotherapy of glioma in the future. It is worth mentioning that we discovered the underlying genes LIPT2 and NNAT for Cuproptososis through co-expression analysis. We speculate that there is a certain correlation between Cuproposis and autophagy, but whether the correlation is as autophagic dependent as ferroptosis is more experimental evidence to prove in the future.
The datasets presented in this study can be found in online repositories. The names of the repository/repositories and accession number(s) can be found in the article/Supplementary material.
HL: conceptualization, formal analysis, and manuscript writing. LZ and HY: data curation. ZW: funding acquisition. BZ and YX: manuscript review. All authors contributed to the article and approved the submitted version.
This study was funded by Natural Science Foundation of China (No. 82072777), Xiamen Municipal Bureau of Science and Technology (No. 3502Z20209005), Xiamen Science and Technology Major Project (No. 3502Z2020YJ05), Xiamen Municipal Health Commission, Xiamen Municipal Bureau of Science and Technology (No. 3502Z20209005), and The National Natural Science Foundation of China (No. 81902543).
The authors declare that the research was conducted in the absence of any commercial or financial relationships that could be construed as a potential conflict of interest.
All claims expressed in this article are solely those of the authors and do not necessarily represent those of their affiliated organizations, or those of the publisher, the editors and the reviewers. Any product that may be evaluated in this article, or claim that may be made by its manufacturer, is not guaranteed or endorsed by the publisher.
The Supplementary Material for this article can be found online at: https://www.frontiersin.org/articles/10.3389/fmed.2022.939776/full#supplementary-material
1. Siegel RL, Miller KD, Fuchs HE, Jemal A. Cancer Statistics, 2021. CA Cancer J Clin. (2021) 71:7–33. doi: 10.3322/caac.21654
2. Siegel RL, Miller KD, Fuchs HE, Jemal A. Cancer statistics, 2022. CA Cancer J Clin. (2022) 72:7–33. doi: 10.3322/caac.21708
6. Ostrom QT, Patil N, Cioffi G, Waite K, Kruchko C, Barnholtz-Sloan JS, et al. CBTRUS statistical report: primary brain and other central nervous system tumors diagnosed in the United States in 2013-2017. Neuro Oncol. (2020) 22:iv1–96. doi: 10.1093/neuonc/noaa200
7. Jia Q, Wang A, Yuan Y, Zhu B, Long H. Heterogeneity of the tumor immune microenvironment and its clinical relevance. Exp Hematol Oncol. (2022) 11:24. doi: 10.1186/s40164-022-00277-y
8. Bjorkblom B, Wibom C, Eriksson M, Bergenheim AT, Sjöberg RL, Jonsson P, et al. Distinct metabolic hallmarks of WHO classified adult glioma subtypes. Neuro Oncol. (2022) 24:1454–68. doi: 10.1093/neuonc/noac042
9. Bhargav AG, Domino JS, Chamoun R, Thomas SM. Mechanical properties in the glioma microenvironment: emerging insights and theranostic opportunities. Front Oncol. (2021) 11:805628. doi: 10.3389/fonc.2021.805628
10. Barthel L, Hadamitzky M, Dammann P, Schedlowski M, Sure U, Thakur BK, et al. Glioma: molecular signature and crossroads with tumor microenvironment. Cancer Metastasis Rev. (2022) 41:53–75. doi: 10.1007/s10555-021-09997-9
11. Li P, Qin Z, Zhong Y, Kang H, Zhang Z, Hu Y, et al. Selective single-cell expansion on a microfluidic chip for studying heterogeneity of glioma stem cells. Anal Chem. (2022) 94:3245–53. doi: 10.1021/acs.analchem.1c04959
12. Harrison RA, Ou A, Naqvi SMAA, Naqvi SM, Weathers SS, O’Brien BJ, et al. Aggressiveness of care at end of life in patients with high-grade glioma. Cancer Med. (2021) 10:8387–94. doi: 10.1002/cam4.4344
13. Pouliquen D, Olivier C, Hervouet E, Pedelaborde F, Debien E, Le Cabellec MT, et al. Dietary prevention of malignant glioma aggressiveness, implications in oxidant stress and apoptosis. Int J Cancer. (2008) 123:288–95. doi: 10.1002/ijc.23513
14. Binder DK, Berger MS. Proteases and the biology of glioma invasion. J Neurooncol. (2002) 56:149–58. doi: 10.1023/A:1014566604005
15. Armengaud J, Timmis KN. Molecular characterization of FDX1, a putidaredoxin-type [2Fe-2S] ferredoxin able to transfer electrons to the dioxin dioxygenase of Sphingomonas sp. RW1. Eur J Biochem. (1997) 247:833–42. doi: 10.1111/j.1432-1033.1997.00833.x
16. Ewen KM, Hannemann F, Iametti S, Morleo A, Bernhardt R. Functional characterization of FDX1: evidence for an evolutionary relationship between P450-type and ISC-type ferredoxins. J Mol Biol. (2011) 413:940–51. doi: 10.1016/j.jmb.2011.09.010
17. Sheftel AD, Stehling O, Pierik AJ, Elsässer HP, Mühlenhoff U, Webert H, et al. Humans possess two mitochondrial ferredoxins, FDX1 and Fdx2, with distinct roles in steroidogenesis, heme, and Fe/S cluster biosynthesis. Proc Natl Acad Sci U.S.A. (2010) 107:11775–80. doi: 10.1073/pnas.1004250107
18. Cai K, Tonelli M, Frederick RO, Markley JL. Human Mitochondrial Ferredoxin 1 (FDX1) and Ferredoxin 2 (FDX2) both bind cysteine desulfurase and donate electrons for iron-sulfur cluster biosynthesis. Biochemistry. (2017) 56:487–99. doi: 10.1021/acs.biochem.6b00447
19. van Lis R, Baffert C, Coute Y, Nitschke W, Atteia A. Chlamydomonas reinhardtii chloroplasts contain a homodimeric pyruvate:ferredoxin oxidoreductase that functions with FDX1. Plant Physiol. (2013) 161:57–71. doi: 10.1104/pp.112.208181
20. Tsvetkov P, Coy S, Petrova B, Dreishpoon M, Verma A, Abdusamad M, et al. Copper induces cell death by targeting lipoylated TCA cycle proteins. Science. (2022) 375:1254–61. doi: 10.1126/science.abf0529
21. Zhao Y, Chen D, Yin J, Xie J, Sun CY, Lu M. Comprehensive analysis of tumor immune microenvironment characteristics for the prognostic prediction and immunotherapy of oral squamous cell carcinoma. Front Genet. (2022) 13:788580. doi: 10.3389/fgene.2022.788580
22. Amemiya R, Miyoshi T, Aokage K, Suzuki J, Hoshino H, Udagawa H, et al. Prognostic impact of the tumor immune microenvironment in pulmonary pleomorphic carcinoma. Lung Cancer. (2021) 153:56–65. doi: 10.1016/j.lungcan.2021.01.007
23. Anderson NM, Simon MC. The tumor microenvironment. Curr Biol. (2020) 30:R921–5. doi: 10.1016/j.cub.2020.06.081
24. Ghosh D, Dawson MR. Microenvironment influences cancer cell mechanics from tumor growth to metastasis. Adv Exp Med Biol. (2018) 1092:69–90. doi: 10.1007/978-3-319-95294-9_5
25. Choucair K, Morand S, Stanbery L, Edelman G, Dworkin L, Nemunaitis J. TMB: a promising immune-response biomarker, and potential spearhead in advancing targeted therapy trials. Cancer Gene Ther. (2020) 27:841–53. doi: 10.1038/s41417-020-0174-y
26. Joyce JA. Therapeutic targeting of the tumor microenvironment. Cancer Cell. (2005) 7:513–20. doi: 10.1016/j.ccr.2005.05.024
27. Cook MR, Dunleavy K. Targeting the tumor microenvironment in lymphomas: emerging biological insights and therapeutic strategies. Curr Oncol Rep. (2022) 24:1121–31. doi: 10.1007/s11912-022-01250-y
28. Chyuan IT, Chu CL, Hsu PN. Targeting the tumor microenvironment for improving therapeutic effectiveness in cancer immunotherapy: focusing on immune checkpoint inhibitors and combination therapies. Cancers. (2021) 13:1188. doi: 10.3390/cancers13061188
29. Yin Z, Bai L, Li W, Zeng T, Tian H, Cui J. Targeting T cell metabolism in the tumor microenvironment: an anti-cancer therapeutic strategy. J Exp Clin Cancer Res. (2019) 38:403. doi: 10.1186/s13046-019-1409-3
30. Liu T, Zhou L, Li D, Andl T, Zhang Y. Cancer-associated fibroblasts build and secure the tumor microenvironment. Front Cell Dev Biol. (2019) 7:60. doi: 10.3389/fcell.2019.00060
31. Gajewski T. Innate and adaptive immune cells in Tumor microenvironment. Gulf J Oncol. (2021) 1:77–81.
32. Wei R, Liu S, Zhang S, Min L, Zhu S. Cellular and extracellular components in tumor microenvironment and their application in early diagnosis of cancers. Anal Cell Pathol. (2020) 2020:6283796. doi: 10.1155/2020/6283796
33. Li X, Wang J. Mechanical tumor microenvironment and transduction: cytoskeleton mediates cancer cell invasion and metastasis. Int J Biol Sci. (2020) 16:2014–28. doi: 10.7150/ijbs.44943
34. Andersen RS, Anand A, Harwood DSL, Kristensen BW. Tumor-associated microglia and macrophages in the glioblastoma microenvironment and their implications for therapy. Cancers. (2021) 13:4255. doi: 10.3390/cancers13174255
35. Andersen LB, Nørgaard M, Rasmussen M, Fredsøe J, Borre M, Ulhøi BP, et al. Immune cell analyses of the tumor microenvironment in prostate cancer highlight infiltrating regulatory T cells and macrophages as adverse prognostic factors. J Pathol. (2021) 255:155–65. doi: 10.1002/path.5757
36. Sun B, Zhao H. A study on immune cell infiltration in lung adenocarcinoma. Comb Chem High Throughput Screen. (2022) 25:2082–8. doi: 10.2174/1386207325666220221100429
37. Schaafsma E, Jiang C, Cheng C. B cell infiltration is highly associated with prognosis and an immune-infiltrated tumor microenvironment in neuroblastoma. J Cancer Metastasis Treat. (2021) 7:10.20517/2394–4722.2021.72. doi: 10.20517/2394-4722.2021.72
38. Oswald E, Bug D, Grote A, Lashuk K, Bouteldja N, Lenhard D, et al. Immune cell infiltration pattern in non-small cell lung cancer PDX models is a model immanent feature and correlates with a distinct molecular and phenotypic make-up. J Immunother Cancer. (2022) 10:e004412. doi: 10.1136/jitc-2021-004412
39. Murthy V, Oshi M, Tokumaru Y, Endo I, Takabe K. Increased apoptosis is associated with robust immune cell infiltration and cytolytic activity in breast cancer. Am J Cancer Res. (2021) 11:3674–87.
40. Wang Y, Dong J, Quan Q, Liu S, Chen X, Cai X, et al. Immune cell infiltration of the primary tumor microenvironment predicted the treatment outcome of chemotherapy with or without bevacizumab in metastatic colorectal cancer patients. Front Oncol. (2020) 10:581051. doi: 10.3389/fonc.2020.581051
41. Xu Q, Chen S, Hu Y, Huang W. Landscape of immune microenvironment under immune cell infiltration pattern in breast cancer. Front Immunol. (2021) 12:711433. doi: 10.3389/fimmu.2021.711433
42. Yan Y, Mao X, Zhang Q, Ye Y, Dai Y, Bao M, et al. Molecular mechanisms, immune cell infiltration, and potential drugs for prostate cancer. Cancer Biomark. (2021) 31:87–96. doi: 10.3233/CBM-200939
43. Yang W, Qiu Z, Zhang J, Zhi X, Yang L, Qiu M, et al. Correlation between immune cell infiltration and PD-L1 expression and immune-related lncRNA determination in triple-negative breast cancer. Front Genet. (2022) 13:878658. doi: 10.3389/fgene.2022.878658
44. Zhao H, Chen Y, Shen P, Gong L. Identification of immune cell infiltration landscape and their prognostic significance in uveal melanoma. Front Cell Dev Biol. (2021) 9:713569. doi: 10.3389/fcell.2021.713569
45. Zheng Y, Wen Y, Cao H, Gu Y, Yan L, Wang Y, et al. Global characterization of immune infiltration in clear cell renal cell carcinoma. Onco Targets Ther. (2021) 14:2085–100. doi: 10.2147/OTT.S282763
46. Li X, Liang W, Zhao H, Jin Z, Jin Z, Shi G, et al. Immune cell infiltration landscape of ovarian cancer to identify prognosis and immunotherapy-related genes to aid immunotherapy. Front Cell Dev Biol. (2021) 9:749157. doi: 10.3389/fcell.2021.749157
47. Gong J, Jin B, Shang L, Liu N. Characterization of the immune cell infiltration landscape of thyroid cancer for improved immunotherapy. Front Mol Biosci. (2021) 8:714053. doi: 10.3389/fmolb.2021.714053
48. Zhang Y, Zheng J. Functions of immune checkpoint molecules beyond immune evasion. Adv Exp Med Biol. (2020) 1248:201–26. doi: 10.1007/978-981-15-3266-5_9
49. Gaikwad S, Agrawal MY, Kaushik I, Ramachandran S, Srivastava SK. Immune checkpoint proteins: Signaling mechanisms and molecular interactions in cancer immunotherapy. Semin Cancer Biol. (2022) 86(Pt 3):137–50. doi: 10.1016/j.semcancer.2022.03.014
50. Karasarides M, Cogdill AP, Robbins PB, Bowden M, Burton EM, Butterfield LH. Hallmarks of resistance to immune-checkpoint inhibitors. Cancer Immunol Res. (2022) 10:372–83. doi: 10.1158/2326-6066.CIR-20-0586
51. Wasilewski D, Radke J, Xu R, Raspe M, Trelinska-Finger A, Rosenstock T, et al. Effectiveness of immune checkpoint inhibition vs chemotherapy in combination with radiation therapy among patients with non-small cell lung cancer and brain metastasis undergoing neurosurgical resection. JAMA Netw Open. (2022) 5:e229553. doi: 10.1001/jamanetworkopen.2022.9553
52. Assie JB, Crépin F, Grolleau E, Canellas A, Geier M, Grébert-Manuardi A, et al. Immune-checkpoint inhibitors for malignant pleural mesothelioma: a french, multicenter, retrospective real-world study. Cancers. (2022) 14:1498. doi: 10.3390/cancers14061498
53. Huang JL, Chang YT, Hong ZY, Lin CS. Targeting DNA damage response and immune checkpoint for anticancer therapy. Int J Mol Sci. (2022) 23:3238. doi: 10.3390/ijms23063238
54. Liu TH, Shen YC, Cheng AL. Immune checkpoint inhibitors for hepatocellular carcinoma – a game changer in treatment landscape. J Formos Med Assoc. (2022) 121:1371–83. doi: 10.1016/j.jfma.2022.03.017
55. Mestrallet G, Auvré F, Schenowitz C, Carosella ED, LeMaoult J, Martin MT, et al. Human keratinocytes inhibit CD4(+) T-Cell proliferation through TGFB1 secretion and surface expression of HLA-G1 and PD-L1 immune checkpoints. Cells. (2021) 10:1438. doi: 10.3390/cells10061438
56. Cripps JG, Wang J, Maria A, Blumenthal I, Gorham JD. Type 1 T helper cells induce the accumulation of myeloid-derived suppressor cells in the inflamed Tgfb1 knockout mouse liver. Hepatology. (2010) 52:1350–9. doi: 10.1002/hep.23841
57. Wang HB, Song WG, Liu HQ, Fang F, Xiao Y. Role of TGFB1 polymorphism in the development of metastatic brain tumors in non-small cell lung cancer patients. Genet Mol Res. (2015) 14:3545–50. doi: 10.4238/2015.April.17.3
58. Zhao Z, Zhang KN, Wang Q, Li G, Zeng F, Zhang Y, et al. Chinese Glioma Genome Atlas (CGGA): a comprehensive resource with functional genomic data from chinese glioma patients. Genomics Proteomics Bioinformatics. (2021) 19:1–12. doi: 10.1016/j.gpb.2020.10.005
59. Warde-Farley D, Donaldson SL, Comes O, Zuberi K, Badrawi R, Chao P, et al. The GeneMANIA prediction server: biological network integration for gene prioritization and predicting gene function. Nucleic Acids Res. (2010) 38:W214–20. doi: 10.1093/nar/gkq537
60. Vasaikar SV, Straub P, Wang J, Zhang B. LinkedOmics: analyzing multi-omics data within and across 32 cancer types. Nucleic Acids Res. (2018) 46:D956–63. doi: 10.1093/nar/gkx1090
61. Ru B, Wong CN, Tong Y, Zhong JY, Zhong SSW, Wu WC, et al. TISIDB: an integrated repository portal for tumor-immune system interactions. Bioinformatics. (2019) 35:4200–2. doi: 10.1093/bioinformatics/btz210
62. Li CJ, Lin LT, Hou MF, Chu PY. PDL1/PD1 blockade in breast cancer: The immunotherapy era (Review). Oncol Rep. (2021) 45:5–12. doi: 10.3892/or.2020.7831
63. Liu J, Chen Z, Li Y, Zhao W, Wu J, Zhang Z. PD-1/PD-L1 checkpoint inhibitors in tumor immunotherapy. Front Pharmacol. (2021) 12:731798. doi: 10.3389/fphar.2021.731798
64. Nakamura Y, Namikawa K, Yoshikawa S, Kiniwa Y, Maekawa T, Yamasaki O, et al. Anti-PD-1 antibody monotherapy versus anti-PD-1 plus anti-CTLA-4 combination therapy as first-line immunotherapy in unresectable or metastatic mucosal melanoma: a retrospective, multicenter study of 329 Japanese cases (JMAC study). ESMO Open. (2021) 6:100325. doi: 10.1016/j.esmoop.2021.100325
65. Dantoing E, Piton N, Salaun M, Thiberville L, Guisier F. Anti-PD1/PD-L1 immunotherapy for non-small cell lung cancer with actionable oncogenic driver mutations. Int J Mol Sci. (2021) 22:6288. doi: 10.3390/ijms22126288
66. Cramer JD, Burtness B, Ferris RL. Immunotherapy for head and neck cancer: Recent advances and future directions. Oral Oncol. (2019) 99:104460. doi: 10.1016/j.oraloncology.2019.104460
67. Ciardiello D, Vitiello PP, Cardone C, Martini G, Troiani T, Martinelli E, et al. Immunotherapy of colorectal cancer: challenges for therapeutic efficacy. Cancer Treat Rev. (2019) 76:22–32. doi: 10.1016/j.ctrv.2019.04.003
68. Brunner-Weinzierl MC, Rudd CE. CTLA-4 and PD-1 Control of T-Cell motility and migration: implications for tumor immunotherapy. Front Immunol. (2018) 9:2737. doi: 10.3389/fimmu.2018.02737
69. Grady C, Melnick K, Porche K, Dastmalchi F, Hoh DJ, Rahman M, et al. Glioma immunotherapy: advances and challenges for spinal cord gliomas. Neurospine. (2022) 19:13–29. doi: 10.14245/ns.2143210.605
70. Lechpammer M, Rao R, Shah S, Mirheydari M, Bhattacharya D, Koehler A, et al. Advances in immunotherapy for the treatment of adult glioblastoma: overcoming chemical and physical barriers. Cancers. (2022) 14:1627. doi: 10.3390/cancers14071627
71. Najem H, Khasraw M, Heimberger AB. Immune microenvironment landscape in CNS tumors and role in responses to immunotherapy. Cells. (2021) 10:2032. doi: 10.3390/cells10082032
72. Yuan F, Wang Y, Ma C. Current WHO guidelines and the critical role of genetic parameters in the classification of glioma: opportunities for immunotherapy. Curr Treat Options Oncol. (2022) 23:188–98. doi: 10.1007/s11864-021-00930-4
73. Jain S, Chalif EJ, Aghi MK. Interactions between anti-angiogenic therapy and immunotherapy in glioblastoma. Front Oncol. (2021) 11:812916. doi: 10.3389/fonc.2021.812916
74. Zhang Z, Ma Y, Guo X, Du Y, Zhu Q, Wang X, et al. FDX1 can impact the prognosis and mediate the metabolism of lung adenocarcinoma. Front Pharmacol. (2021) 12:749134. doi: 10.3389/fphar.2021.749134
75. Zhang C, Zeng Y, Guo X, Shen H, Zhang J, Wang K, et al. Pan-cancer analyses confirmed the cuproptosis-related gene FDX1 as an immunotherapy predictor and prognostic biomarker. Front Genet. (2022) 13:923737. doi: 10.3389/fgene.2022.923737
76. Ye Z, Zhang S, Cai J, Ye L, Gao L, Wang Y, et al. Development and validation of cuproptosis-associated prognostic signatures in WHO 2/3 glioma. Front Oncol. (2022) 12:967159. doi: 10.3389/fonc.2022.967159
77. Zhang WT, Gong YM, Zhang CY, Pan JS, Huang T, Li YXA. Novel cuprotosis-related Gene FDX1 signature for overall survival prediction in clear cell renal cell carcinoma patients. Biomed Res Int. (2022) 2022:9196540. doi: 10.1155/2022/9196540
78. Wang L, Cao Y, Guo W, Xu J. High expression of cuproptosis-related gene FDX1 in relation to good prognosis and immune cells infiltration in colon adenocarcinoma (COAD). J Cancer Res Clin Oncol. (2022) [Epub ahead of print]. doi: 10.1007/s00432-022-04382-7
79. Przybyla-Toscano J, Maclean AE, Franceschetti M, Liebsch D, Vignols F, Keech O, et al. Protein lipoylation in mitochondria requires Fe-S cluster assembly factors NFU4 and NFU5. Plant Physiol. (2022) 188:997–1013. doi: 10.1093/plphys/kiab501
80. Rowland EA, Snowden CK, Cristea IM. Protein lipoylation: an evolutionarily conserved metabolic regulator of health and disease. Curr Opin Chem Biol. (2018) 42:76–85. doi: 10.1016/j.cbpa.2017.11.003
81. Zhang X, Nie J, Zheng Y, Ren J, Zeng AP. Activation and competition of lipoylation of H protein and its hydrolysis in a reaction cascade catalyzed by the multifunctional enzyme lipoate-protein ligase A. Biotechnol Bioeng. (2020) 117:3677–87. doi: 10.1002/bit.27526
82. Pacini G, Carotenuto A, Rentier C, Nuti F, Real Fernández F, Brancaccio D, et al. Role of lipoylation of the immunodominant epitope of pyruvate dehydrogenase complex: toward a peptide-based diagnostic assay for primary biliary cirrhosis. J Med Chem. (2015) 58:6619–29. doi: 10.1021/acs.jmedchem.5b00783
Keywords: Cuproptosis, glioma, prognostic biomarker, immune infiltration, lipoylation
Citation: Lu H, Zhou L, Zhang B, Xie Y, Yang H and Wang Z (2022) Cuproptosis key gene FDX1 is a prognostic biomarker and associated with immune infiltration in glioma. Front. Med. 9:939776. doi: 10.3389/fmed.2022.939776
Received: 09 May 2022; Accepted: 26 October 2022;
Published: 29 November 2022.
Edited by:
Jinhui Liu, Nanjing Medical University, ChinaReviewed by:
Xing Niu, China Medical University, ChinaCopyright © 2022 Lu, Zhou, Zhang, Xie, Yang and Wang. This is an open-access article distributed under the terms of the Creative Commons Attribution License (CC BY). The use, distribution or reproduction in other forums is permitted, provided the original author(s) and the copyright owner(s) are credited and that the original publication in this journal is cited, in accordance with accepted academic practice. No use, distribution or reproduction is permitted which does not comply with these terms.
*Correspondence: Zhanxiang Wang, V2FuZ1pYQHhtdS5lZHUuY24=
†These authors share first authorship
Disclaimer: All claims expressed in this article are solely those of the authors and do not necessarily represent those of their affiliated organizations, or those of the publisher, the editors and the reviewers. Any product that may be evaluated in this article or claim that may be made by its manufacturer is not guaranteed or endorsed by the publisher.
Research integrity at Frontiers
Learn more about the work of our research integrity team to safeguard the quality of each article we publish.