 Ryszard Tomasiuk1
 Igor Z. Zubrzycki
- 1Faculty of Medical and Health Sciences, Kazimierz Pułaski University of Technology and Humanities in Radom, Radom, Poland
- 2Department of Biometry and Mathematics, Botswana University of Agriculture and Natural Resources, Gaborone, Botswana
Aging is an independent risk factor for the development of various diseases associated, among others, with detrimental blood levels of fat- and water-soluble vitamins. Thus, the objective of this study is to investigate age-related changes in blood levels of vitamin A, B12, C, D, and E. Subject serum vitamin levels were obtained from the combined National Health and Nutrition Examination Surveys (NHANES). NHANESIII and NHANES 1999–2000, 2001–2002, 2003–2004, and 2005–2006. The raw data set was stratified into five age groups G1- G5: 20 ≤ G1 < 30, 30 ≤ G2 < 40, 40 ≤ G3 < 50, 50 ≤ G4 < 60, and 60 ≤ G5 < 70 years of age. Age stratified data was cleaned using the modified Horn algorithm. The reference range for the vitamin level of a specific age group was defined as data between the first and third quartile of the subject defined by normal blood pressure and normal bone density. Age-dependent changes in serum/plasma vitamin levels were assessed using the bootstrap technique with 10,000 repeats and Bonferroni adjustment. There was a continuous increase in vitamin A, B12, D, and E levels in the blood. However, the vitamin C concentration remained virtually constant in all age groups. There was a lack of cross-correlations between lipid and water-soluble vitamin levels and blood pressure and bone health. The following reference levels for vitamin A, B12, C, D, and E in subjects older than 20 years of age were established: vitamin A: 1.32–2.8 mmol/L, vitamin B12: 257.94–498.33 pmol/L, vitamin C: 38.18–79.2 mmol/L, vitamin D: 76.33–199.36 nmol/L and vitamin E: 3.65–41.12 μmol/L.
Introduction
The standard reference range for biochemical parameters of blood in humans should be derived from sampling the largest possible group of healthy people (1–3). However, analysis of the literature showed that representative samples involving more than a few hundred subjects have been relatively rare (4–7). It is rather surprising because deviations from the optimal concentration of biomolecules, such as, for example, vitamins, may indicate a disturbance of homeostasis (5, 8–13).
Deviation from normality in vitamin levels may result in the following medical complications: (a) age-related deficiency in vitamin D (14) manifests itself as an increased rate of bone fracture, (b) a deficiency in vitamin B12 (15) increases the risk of osteoporosis, cardiovascular diseases, a decrease in cognitive dysfunction, and dementia, (c) low level of vitamin C (16) leads to a decrease in collagen synthesis, resulting in increased fragility of blood vessels and arterial stiffness, (d) a lower level of vitamin E (17, 18) increases the risk of atherosclerosis, oxidative stress, cancer, cataract, and Alzheimer’s disease.
A recent study showed that aging is correlated with the reduced quality and quantity of meals consumed daily (19). This phenomenon induces a specific physiological response (20), resulting in an age-related decrease in fat metabolism that leads to an increased level of body fat tissue. Furthermore, it is often associated with dietary adjustment (21), reducing fat and sugar consumption, resulting in a decrease in the absorption of fat-soluble vitamins (22). Moreover, an age-related decrease in gastric acid production (23) also reduces vitamin bioavailability (24), and age-related dietary changes often decrease serum levels of ascorbic acid (vitamin C) and vitamin B12 (21, 25, 26).
Vitamin levels are also associated with the astronomical seasons (27–31). Seasonal changes in serum vitamin concentrations may influence hemodynamics, and blood pressure (32, 33), blood pressure-regulating hormone levels (34), biochemical indexes of bone turnover (35). However, generally accepted normal reference values for most physiological and biochemical parameters are independent of seasonal changes (36, 37). For example, the normal systolic blood pressure ratio (SBP) should be around 120 mmHg/80 mmHg (38), total serum cholesterol (TC), triglycerides (TG), high-density lipoprotein cholesterol (HDL-C), and low-density lipoprotein cholesterol levels (LDL-C), should adopt the following levels TC < 200 mg/dL, TG < 150 mg/dL, 40 mg/dL HDL-C < 60 mg/dL, LDL-C < 100 mg/dl (39).
Materials and methods
Study sample
Data used in this study were obtained from the National Health and Nutrition Examination Surveys (NHANES) conducted by the National Center for Health Statistics (NCHS) carried out in separate stages since 1971 (40). The purpose of NHANES is to gather information and monitor descriptively and quantitatively the physical state, disease, and interrelations of physiological and psychical conditions and nutrition in the population of the U.S.A (41).
NHANES III was conducted in two phases; phase 1: from 1988 to 1991 and phase 2: from 1991 to 1994. In 1999, the NCHS began to operate NHANES as a continuous survey collecting data (42). The measurements and laboratory tests reported in the NHANES surveys are carried out on representative randomly chosen subsamples (43). Subject selection for the data collection process was performed in a manner allowing to nullify the chance of repeated measurements across different NHNAES periods.
Collecting biochemical and anthropometric parameters
Serum lipid levels (SLL), including TC, TG, and HDL-C, were measured using NHANES protocols. TC levels were measured enzymatically in serum or plasma in a series of coupled reactions that hydrolyze cholesterol esters and oxidize the 3-OH cholesterol group. TG levels were assessed using a series of coupled reactions in which triglycerides were hydrolyzed to produce glycerol. HDL-C was measured by precipitation of other lipoproteins with a polyanion/divalent cation mixture. The laboratory procedures are described on the NHANES web page: NHANESI III1 and NHANES 1999–2006.2 The LDL level was calculated using the Friedewald equation: LDL = TC–HDL–TG/5.
According to the NHANES laboratory manual Vitamin D, B12, C, A, and E levels were determined using the following procedures: (a) serum 25-hydroxyvitamin D [25(OH)D] (vitamin D) level was determined using Diasorin-Incstar 25(OH)D assay [which is the limitation of this report due to the variability of the results rendered by this method (44)], (b) vitamin B12 and serum folate (vitamin C) levels were measured using the Bio-Rad Laboratories “Quantaphase Folate” radioassay kit (45), (c) vitamin A (retinol) and vitamin E (α-tocopherol) were measured using isocratic high-performance liquid chromatography (HPCL) with detection at 300, 325, and 450 nm.
According to the NHANES manuals, bone mineral density (BMD) measurements were performed in the Mobile Examination Center using a Hologic QDR-1000 X-ray densitometer.
SBP and diastolic blood pressure (DBP) are the averages of three measurements provided by the NHANES data set.
Standing height was measured using a stadiometer with a fixed vertical backboard and an adjustable headpiece. Body mass was determined using digital weight. Subject body mass index (BMI) was calculated using the formula: BMI (kg/m2) = body mass (kg)/[standing height]2 (m2).
Further details on the adopted methodology can be found in the NHANES examination and laboratory protocols.3
The “raw” data sample was a join NHANESIII, NHANES 1999–2000, 2001—2002, 2003–2004, and 2005—2006 data set comprising N = 34,057 men and 36,113 women. The resulting data were stratified into five age groups (G1–G5): 20 ≤ G1 < 30, 30 ≤ G2 < 40, 40 ≤ G3 < 50, 50 ≤ G4 < 60, and 60 ≤ G5 < 70 and subjected to a data cleaning procedure.
Data cleaning
Figure 1 shows a flow chart of the data cleaning procedure. It was a two-step procedure. The first step was data selection, and the second step was data cleaning. In Step 1, all subjects with (a) missing age on the examination, (b) smoking tobacco with a frequency greater than or equal to one cigarette per day (46), (c) consuming alcohol with an amount greater than or equal to one alcoholic beverage per day (47), (d) undergoing chemotherapy treatment during the examination (48), (e) pregnant during the examination (49), (f) breastfeeding during the examination (50) or (g) younger than 20 years of age, were rejected from the study. In Step 2, all data that fall into the outliers of BMI, waist circumference (WC), SLL, and vitamin levels were deleted. This procedure used the modified Horn algorithm (51). Thus, a sample was subjected to a Box-Cox transformation to normality, and the outliers comprising values less than the mean –2.5 • STD or greater than the mean + 2.5 • STD were removed from the sample (52).
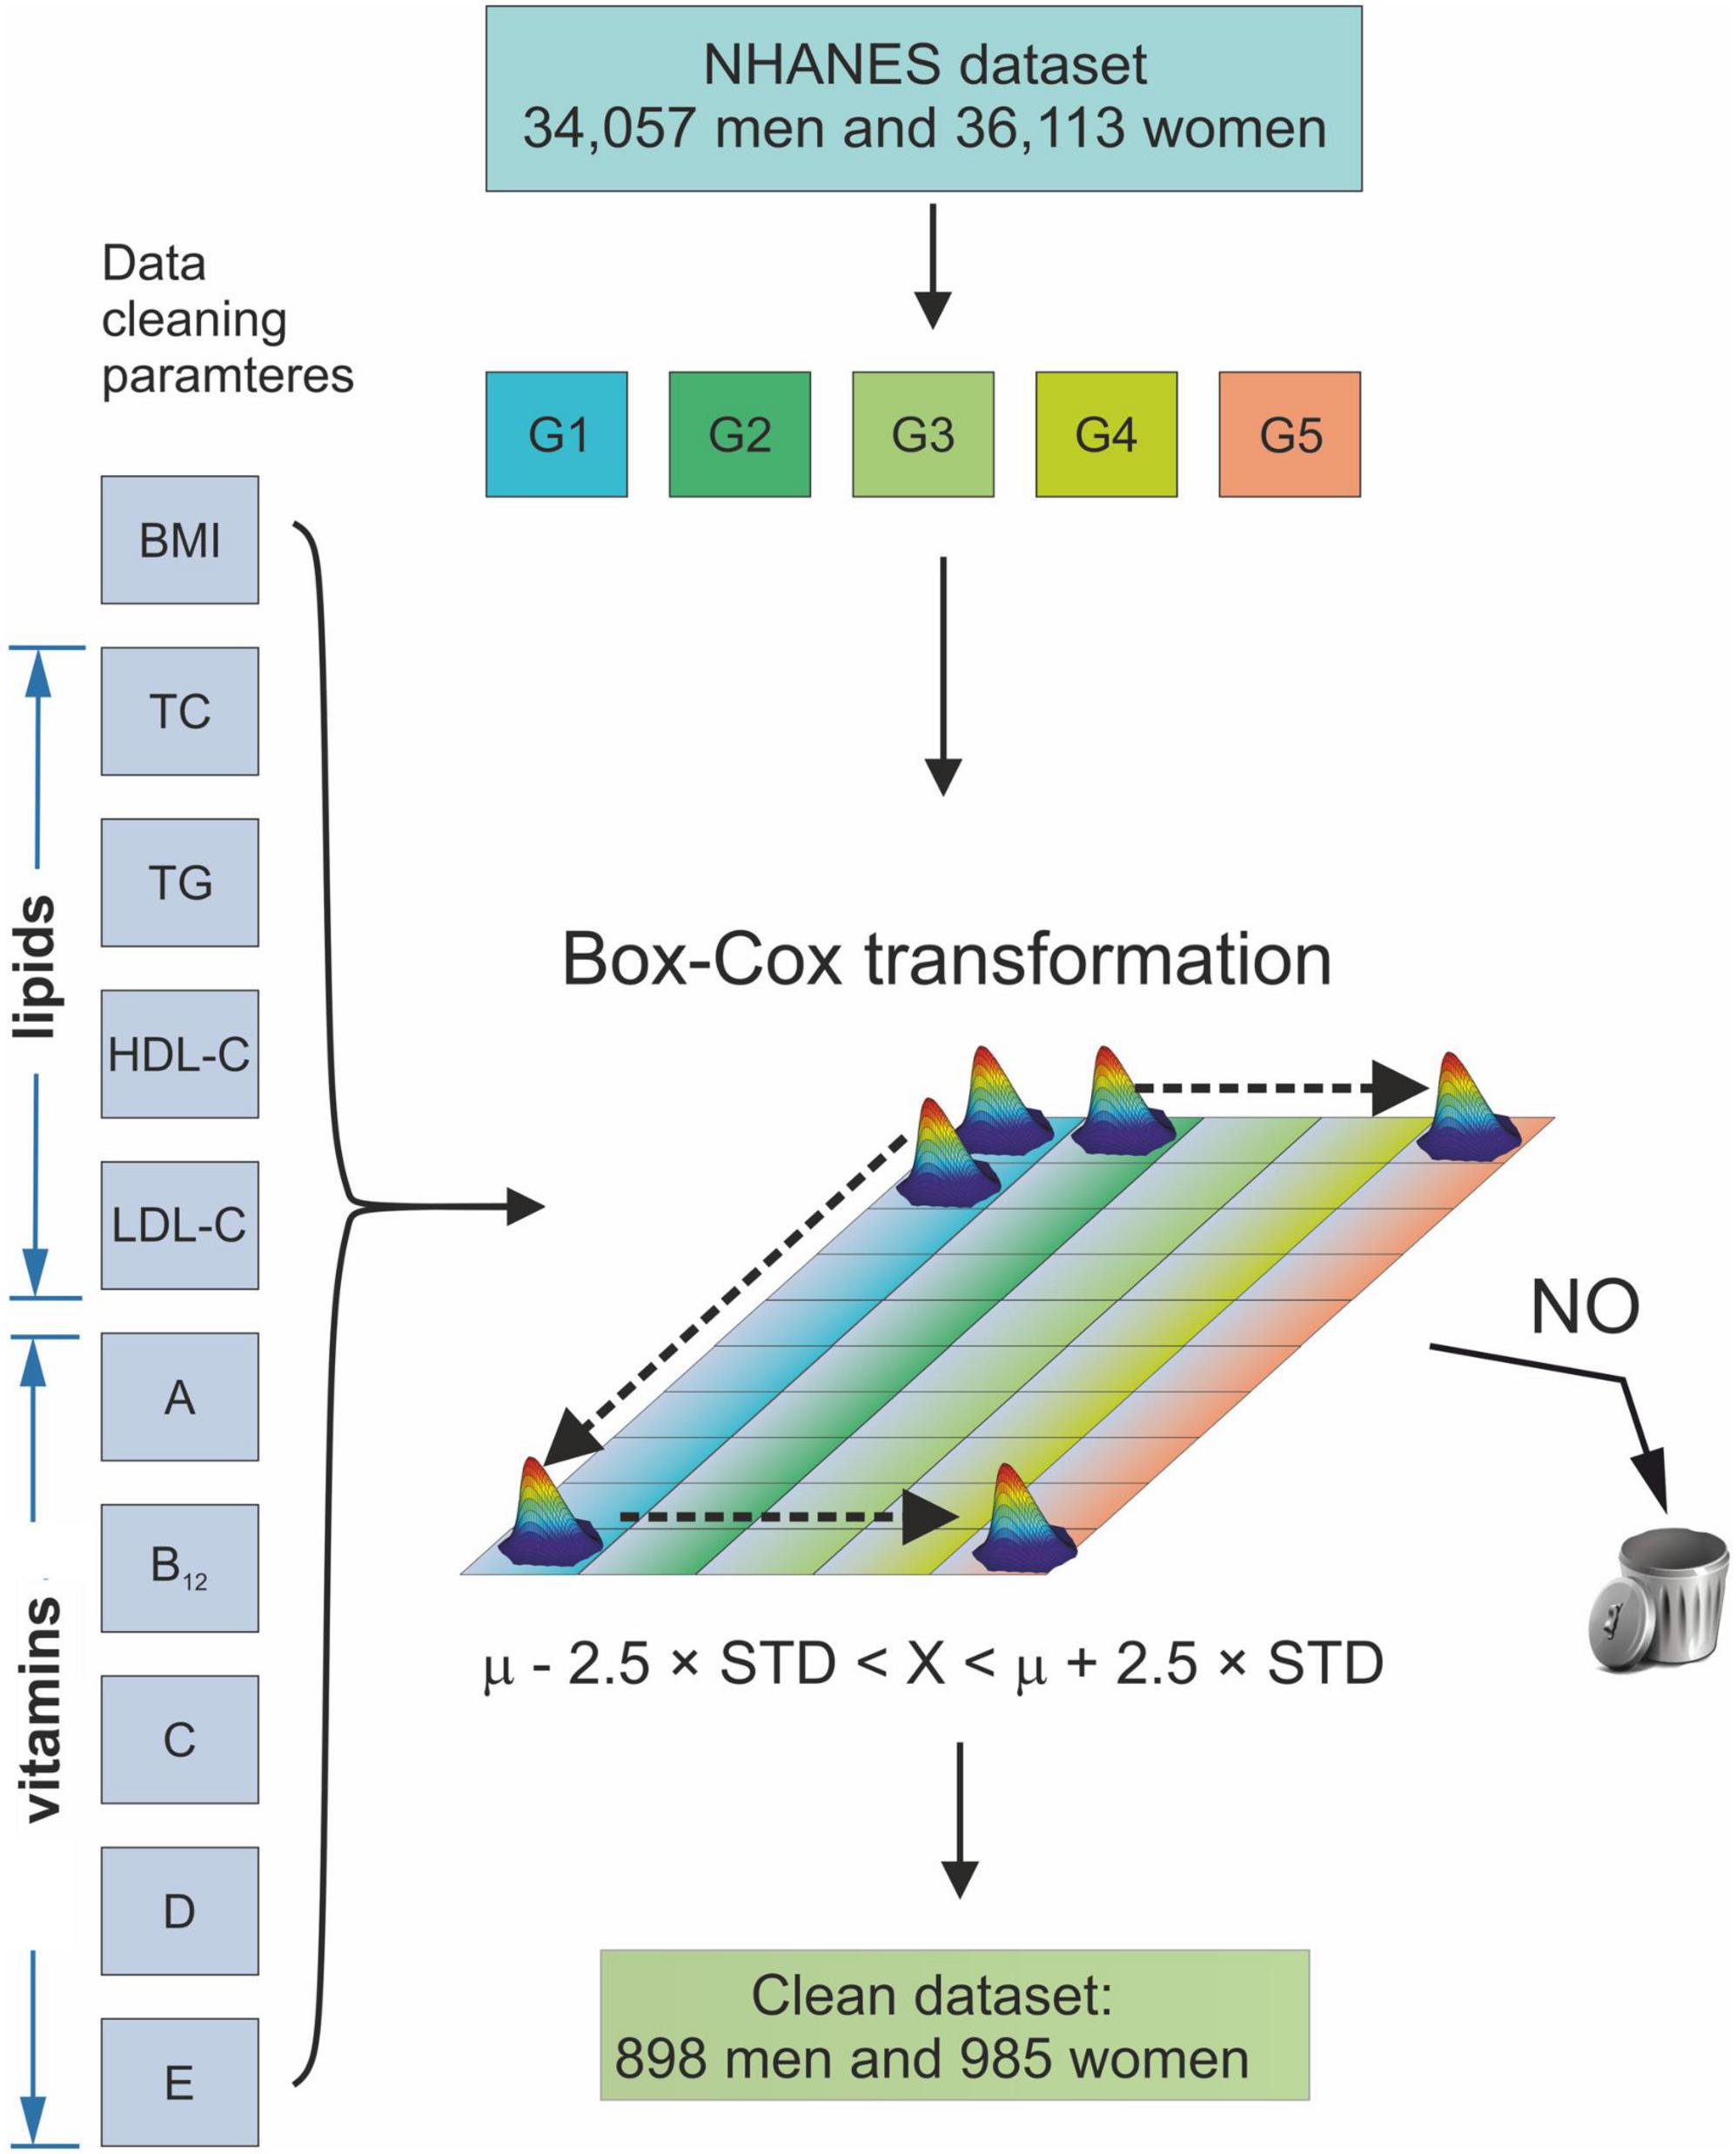
Figure 1. Schematic diagram of the data cleaning procedure. G1–G5 age groups: 20 ≤ G1 < 30, 30 ≤ G2 < 40, 40 ≤ G3 < 50, 50 ≤ G4 < 60, and 60 ≤ G5 < 70 years of age. BMI, Body Mass Index; TC, Total Cholesterol; TG, Triglycerides; HDL-C, High-Density Lipoprotein Cholesterol; LDL, Low-Density Lipoprotein Cholesterol; A, vitamin A; B12, vitamin B12; C, vitamin C; D, vitamin D; E, vitamin E; μ, mean of a sample; STD, standard deviation of a sample.
The clean data set comprised of 9994 non-Hispanic whites, 8,400 non-Hispanic black, 8,391 Mexican American, and 1,250 subjects of other races.
To accommodate technical differences in vitamin D levels assessment between NHANES III and NHANES 1999—2006, the following formula was used: NHANES III, reformulated RIA test of 25 (OH) D = [0.8429* NHANES III 25(OH)D original RIA assay] + 2.5762 nmol/L (r = 0.8966) (53).
Definition of osteoporosis and hypertension
Following the requirements of the World Health Organization (WHO), osteopenia and osteoporosis were defined as BMD adopting values 1 < μ ≤ 2.5 and μ > 2.5 STD from average healthy subjects (54).
Hypertension was defined according to the Guideline for the Prevention, Detection, Evaluation, and Management of High Blood Pressure in Adults (55). Therefore, the following rule was used for the classification of blood pressure (BP) (55)/Thus, normotensive subjects are defined by SBP < 120 and DBP < 80 mmHg, subjects with elevated blood pressure 120 ≤ SBP ≤ 129 and DBP < 80, subjects with hypertension Stage 1: 130 ≤ SBP ≤ 139, or 80 ≤ DBP ≤ 89; subjects with hypertension Stage 2: SBP ≥ 140, or DBP ≥ 90 mmHg.
Statistical analysis
All statistical calculations were calculated using the R programming environment (56). The normality of sample distribution was verified using the Shapiro-Wilk (57) test. Hypothesis testing was performed at the significance level α of 0.05. The reference range for vitamins was defined as an interval between the first and third quartiles of the respective data. Differences in means for specific age groups were tested using a bootstrapped test for differences in means of 10,000 repetitions with replacement. In the longitudinal analysis, an analogous approach was used. However, to accommodate for multiplicity, Bonferroni adjustment was employed.
Results
Reference values for serum/plasma vitamin levels for the multiethnic sample comprising N = 898 male and 985 female subjects are gathered in Table 1.
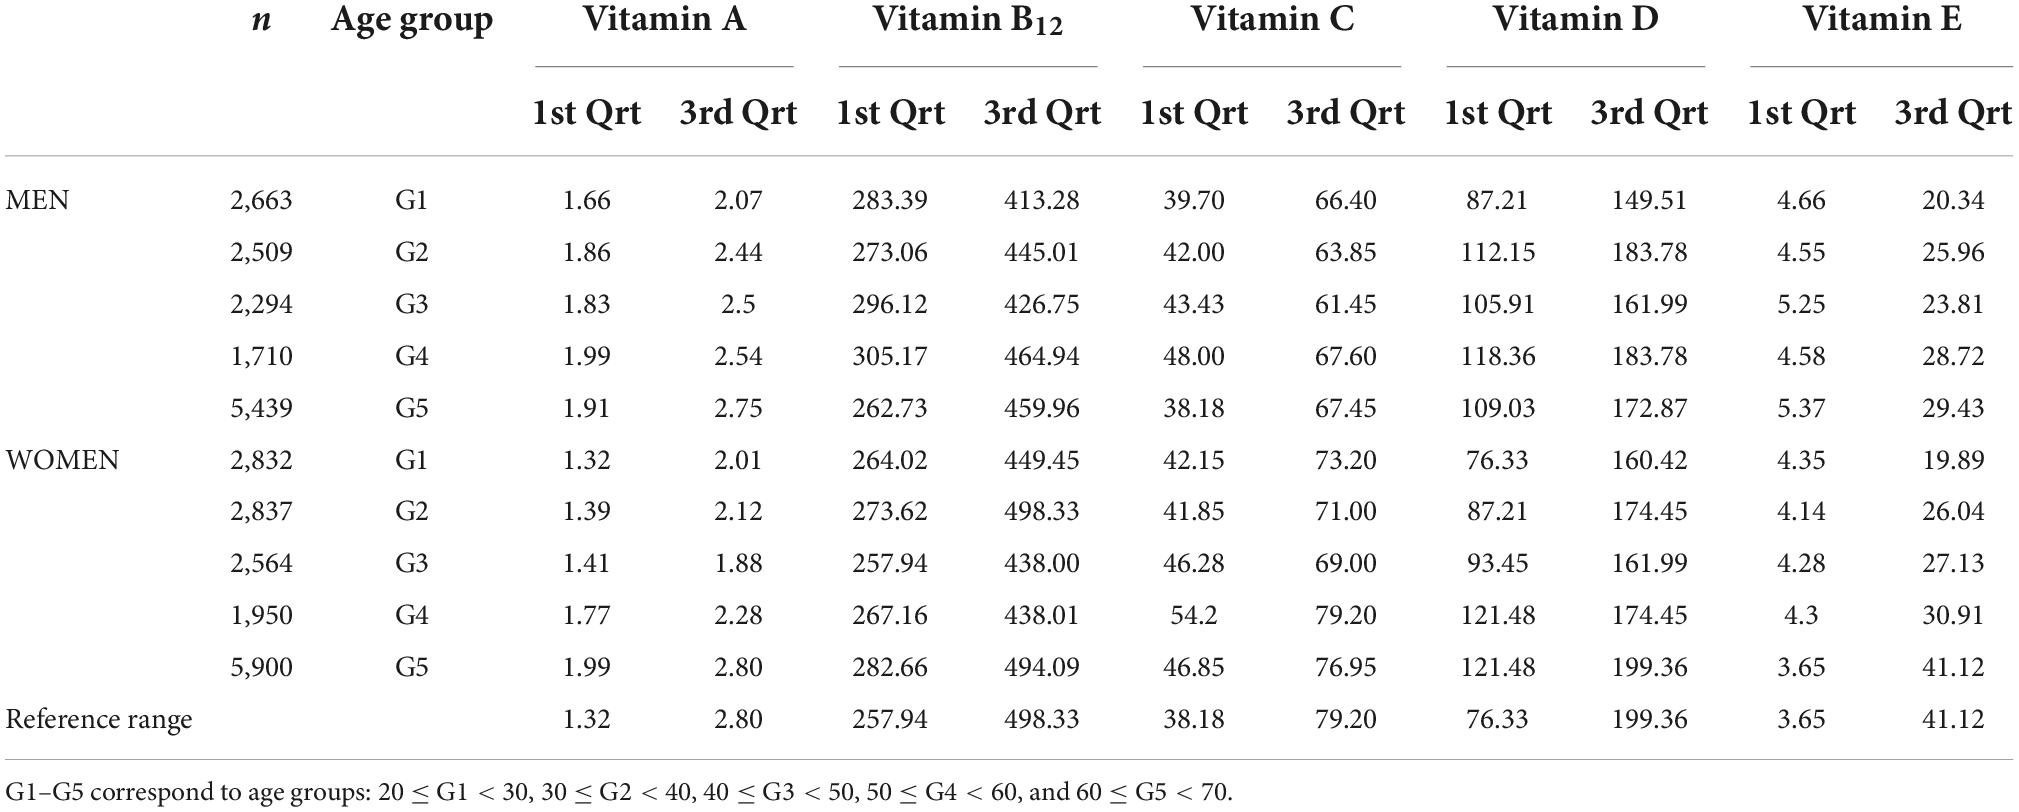
Table 1. Reference interval of blood concentration of vitamin A (μmol/L), B12 (pmol/L), C (μmol/L), D (nmol/L), and E (M mol/L) concentrations stratified by age group in men.
The BMD values for defining normal bone health were obtained by analyzing age-related changes in BMD (Figures 2A,B). Therefore, the mean and standard deviation (STD) of BMD were used in the age range between 23 and 30 years of age and 33–40 years of age in men and women, respectively. The mean and STD for men and women were equal to 1.22 ± 0.11 g/cm2 and 1.23 ± 0.11 g/cm2, respectively.
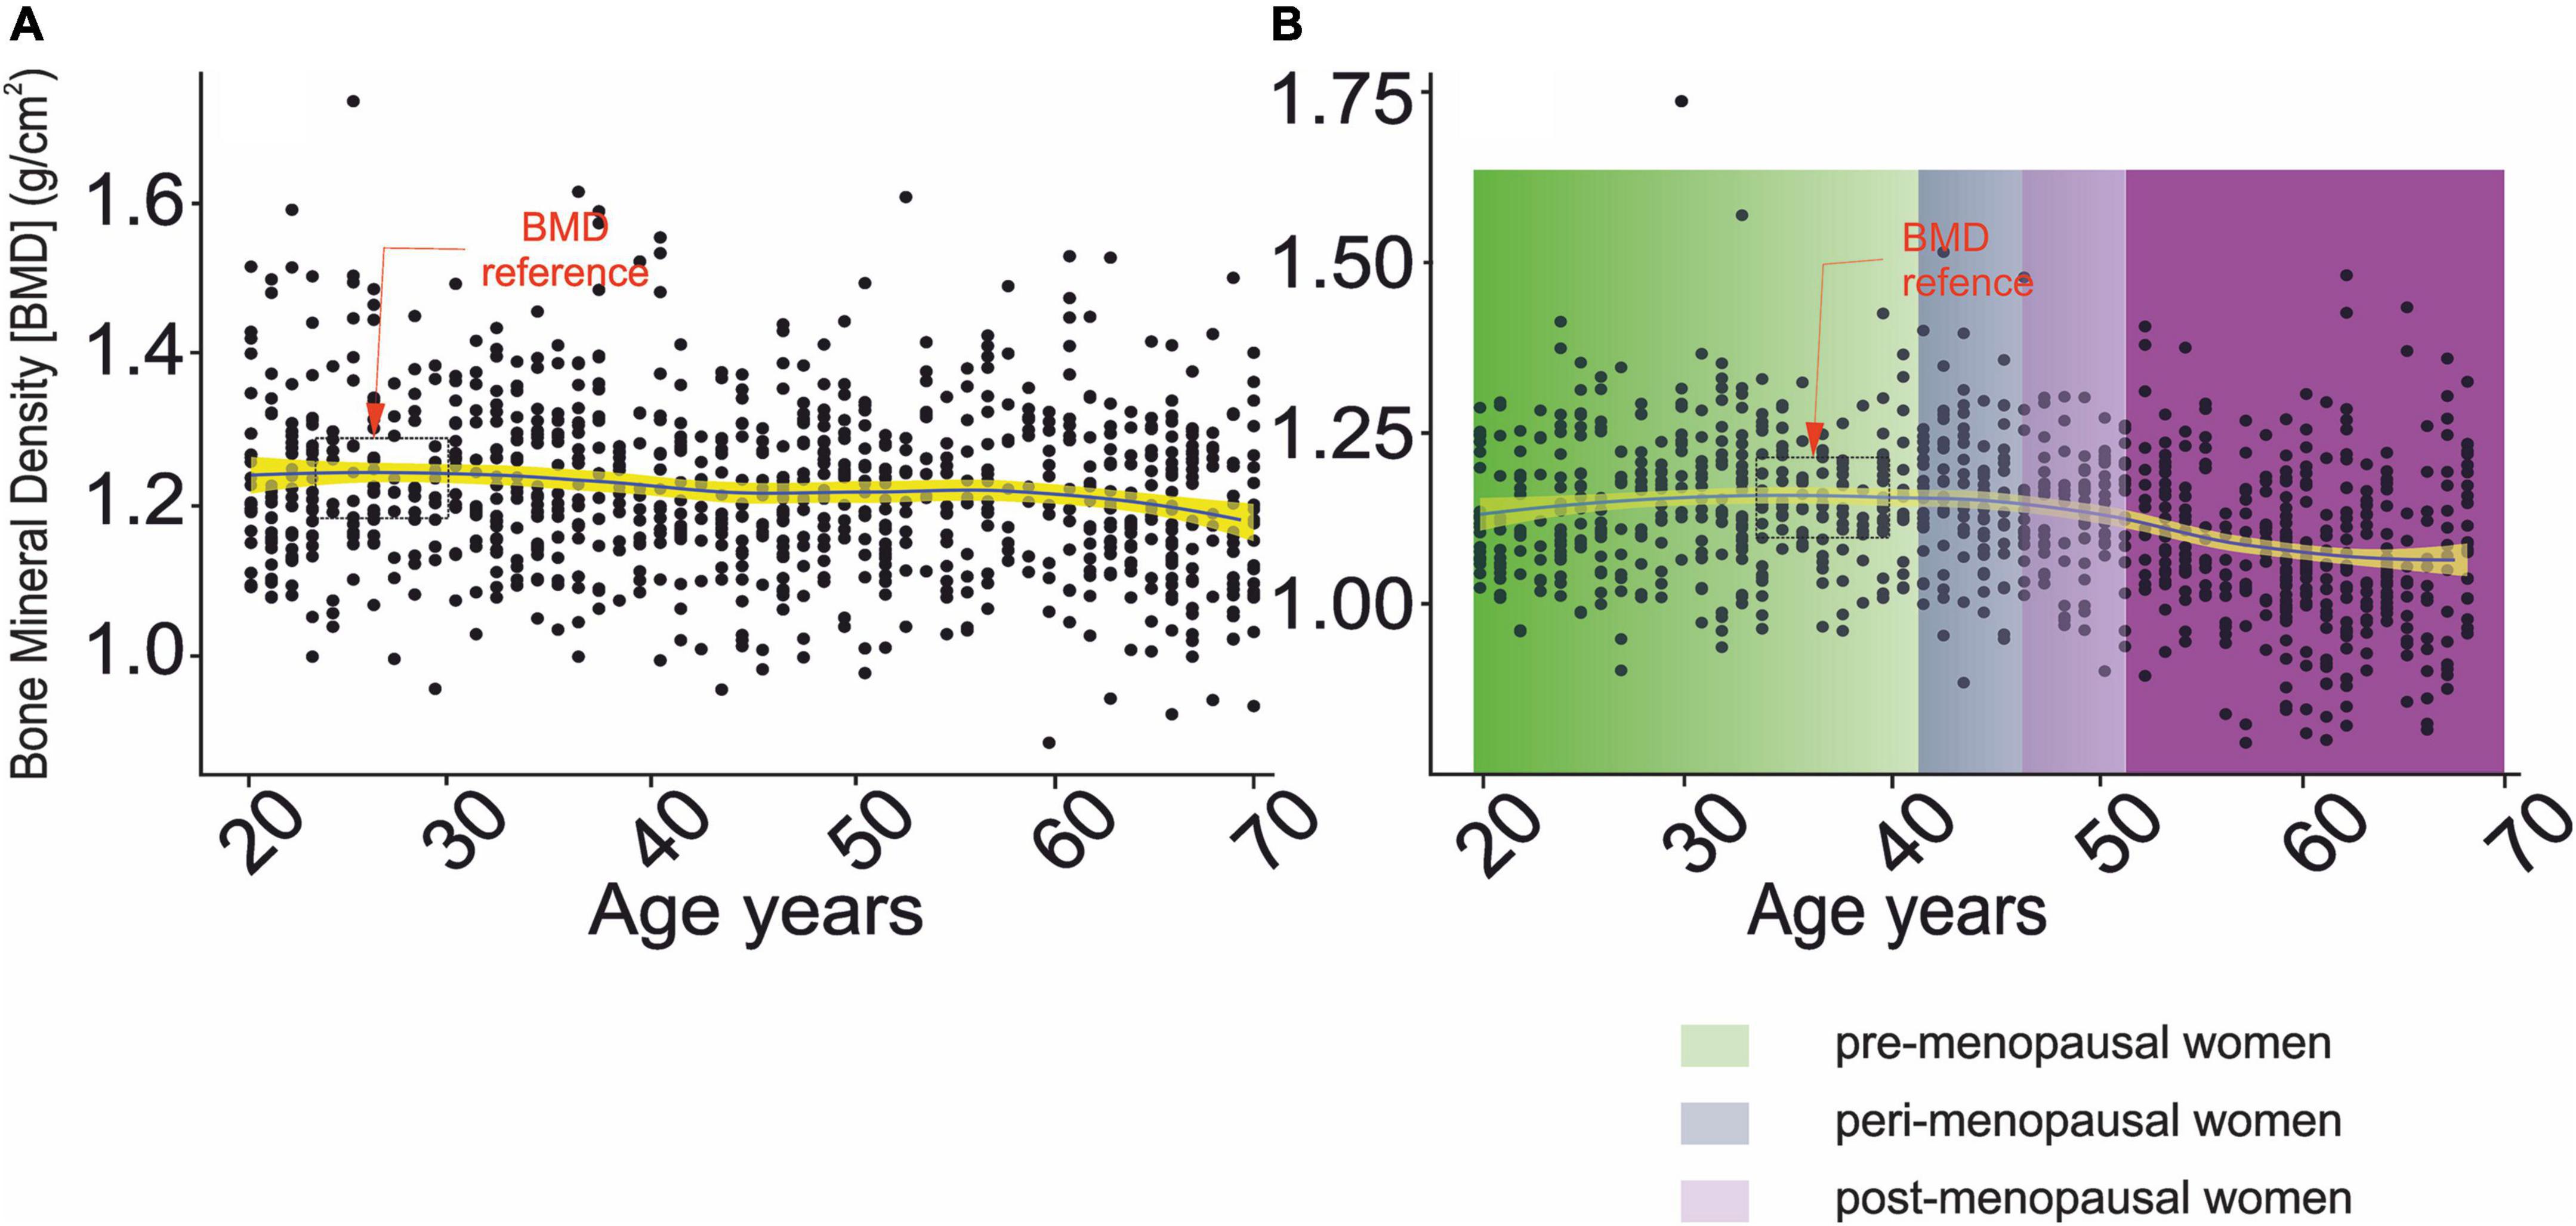
Figure 2. Changes in bone mineral density as a function of chronological age. (A) Men, (B) women.  – denotes confidence interval for the mean,
  ,
,  , and
, and  correspond to pre-, peri- and post-menopausal period (58).
Changes in mean serum levels of vitamins A, B12, C, D, and E as a function of age group, osteoporosis, and blood pressure for men and women are compiled in Tables 2A,B, respectively. Figures 3A,B, 4A,B illustrate the longitudinal changes in vitamin levels for men and women, respectively.
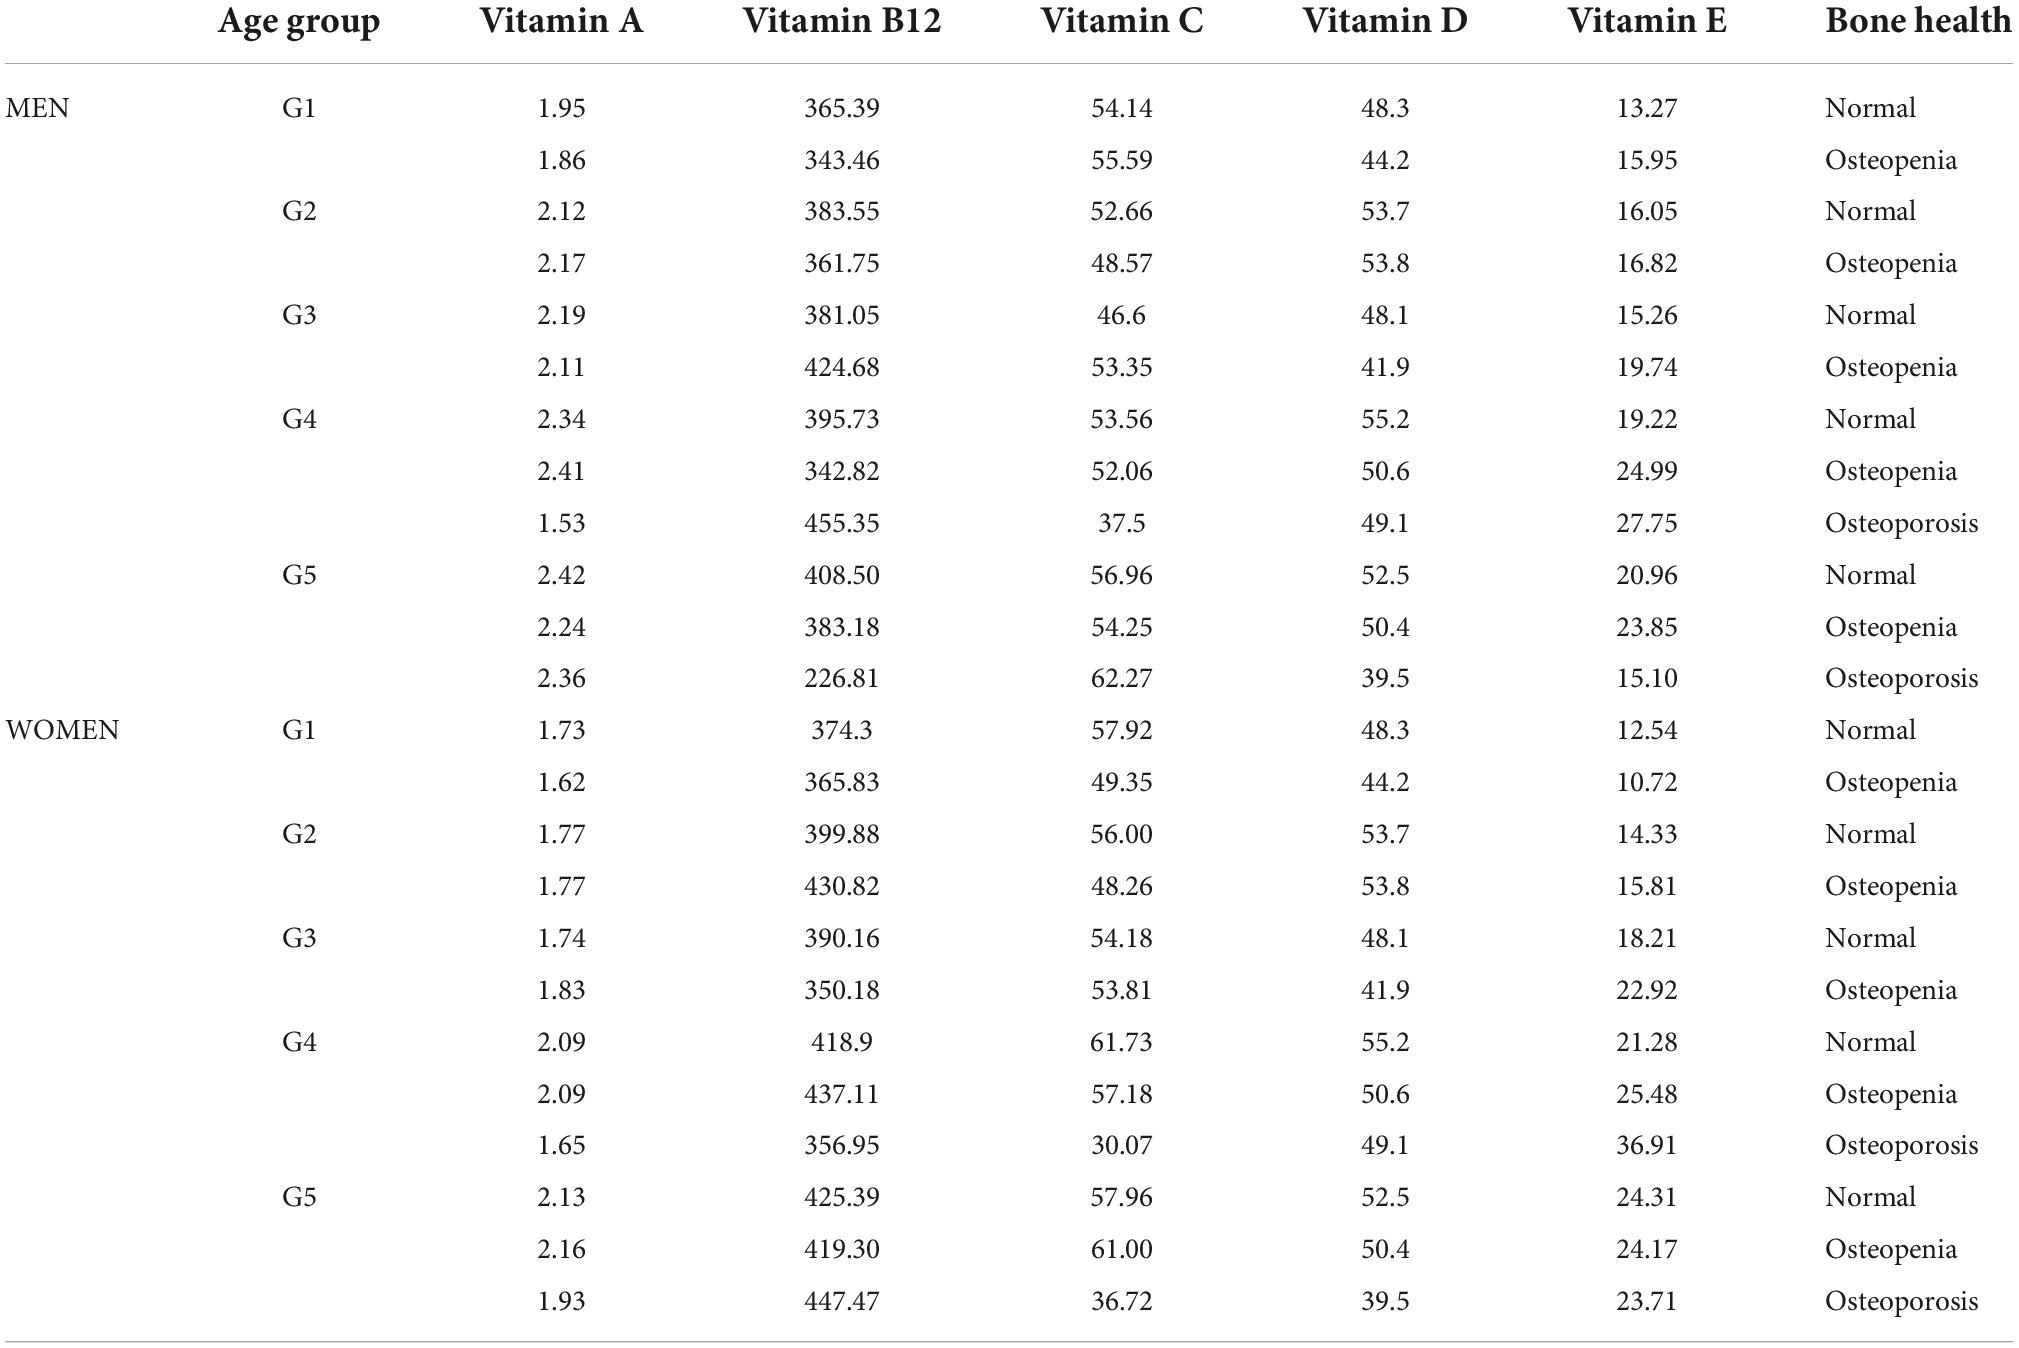
Table 2A. Mean levels of vitamin A (μmol/L), B12 (pmol/L), C (μmol/L), D (nmol/L), and E (μmol/L) concentrations stratified by age group and osteoporosis status in women.
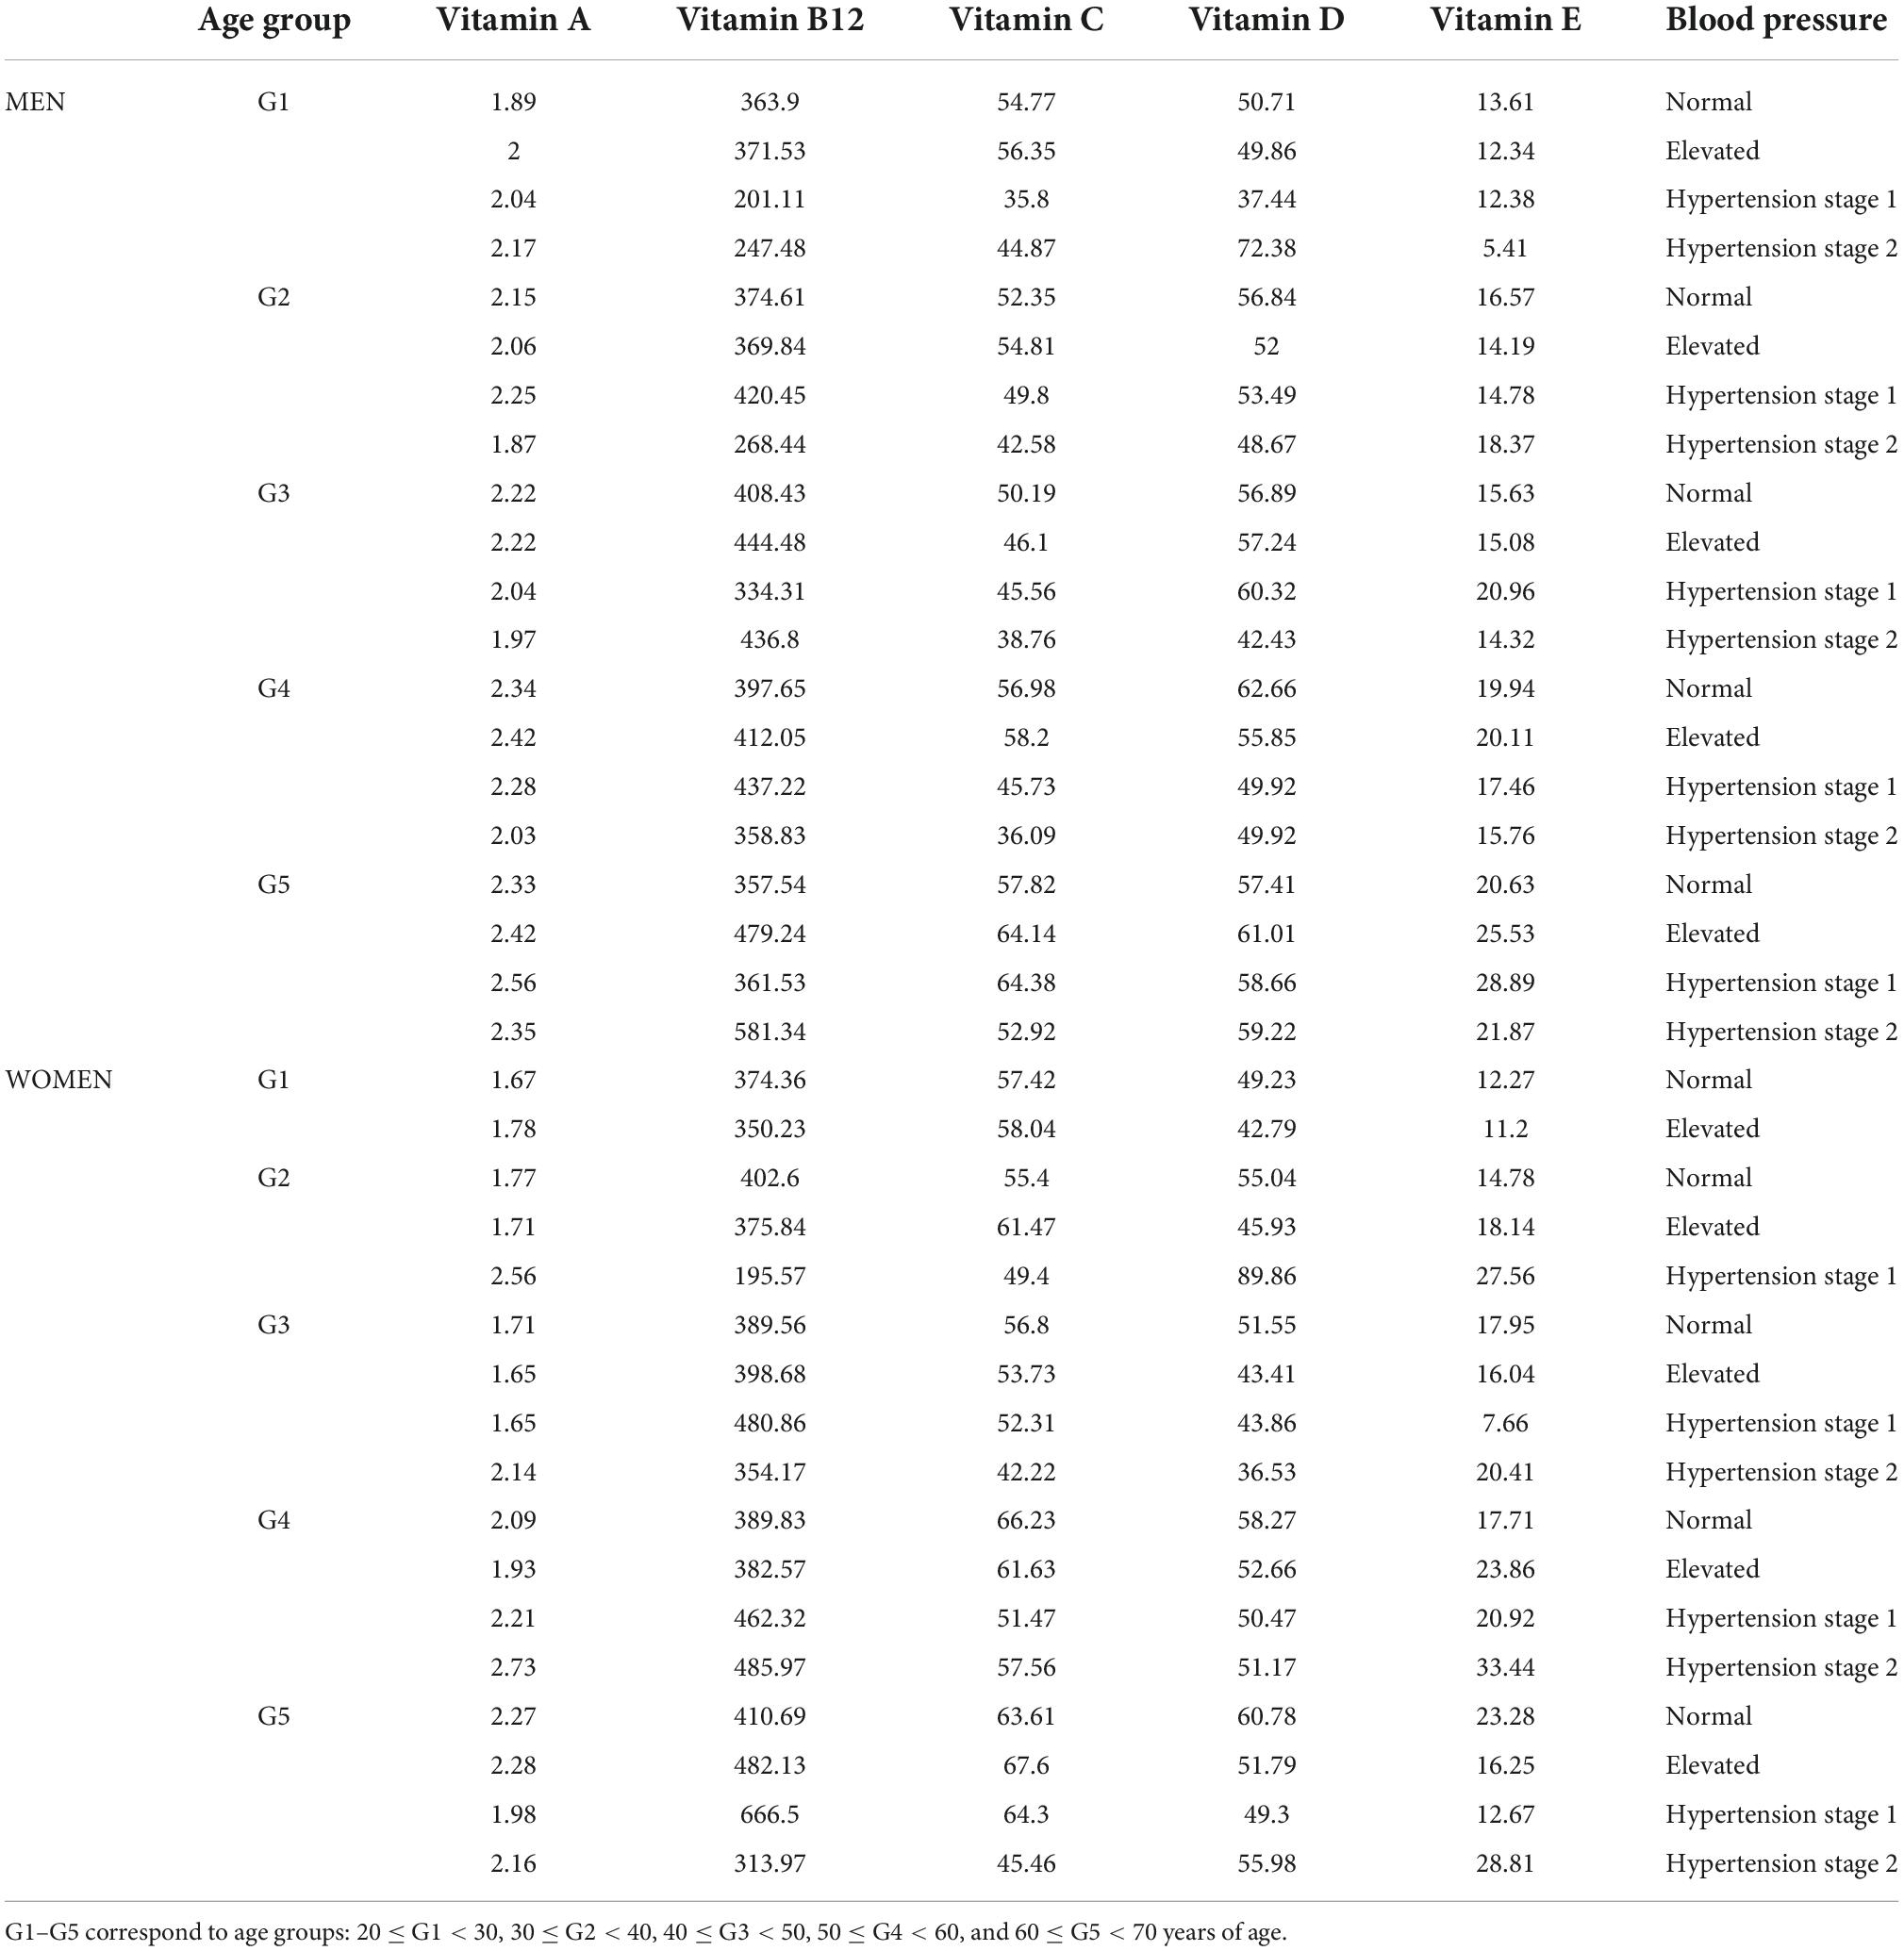
Table 2B. Mean serum concentration of vitamin A (μmol/L), B12 (pmol/L), C (μmol/L), D (nmol/L), and E (μmol/L) concentrations stratified by age group and blood pressure in women.
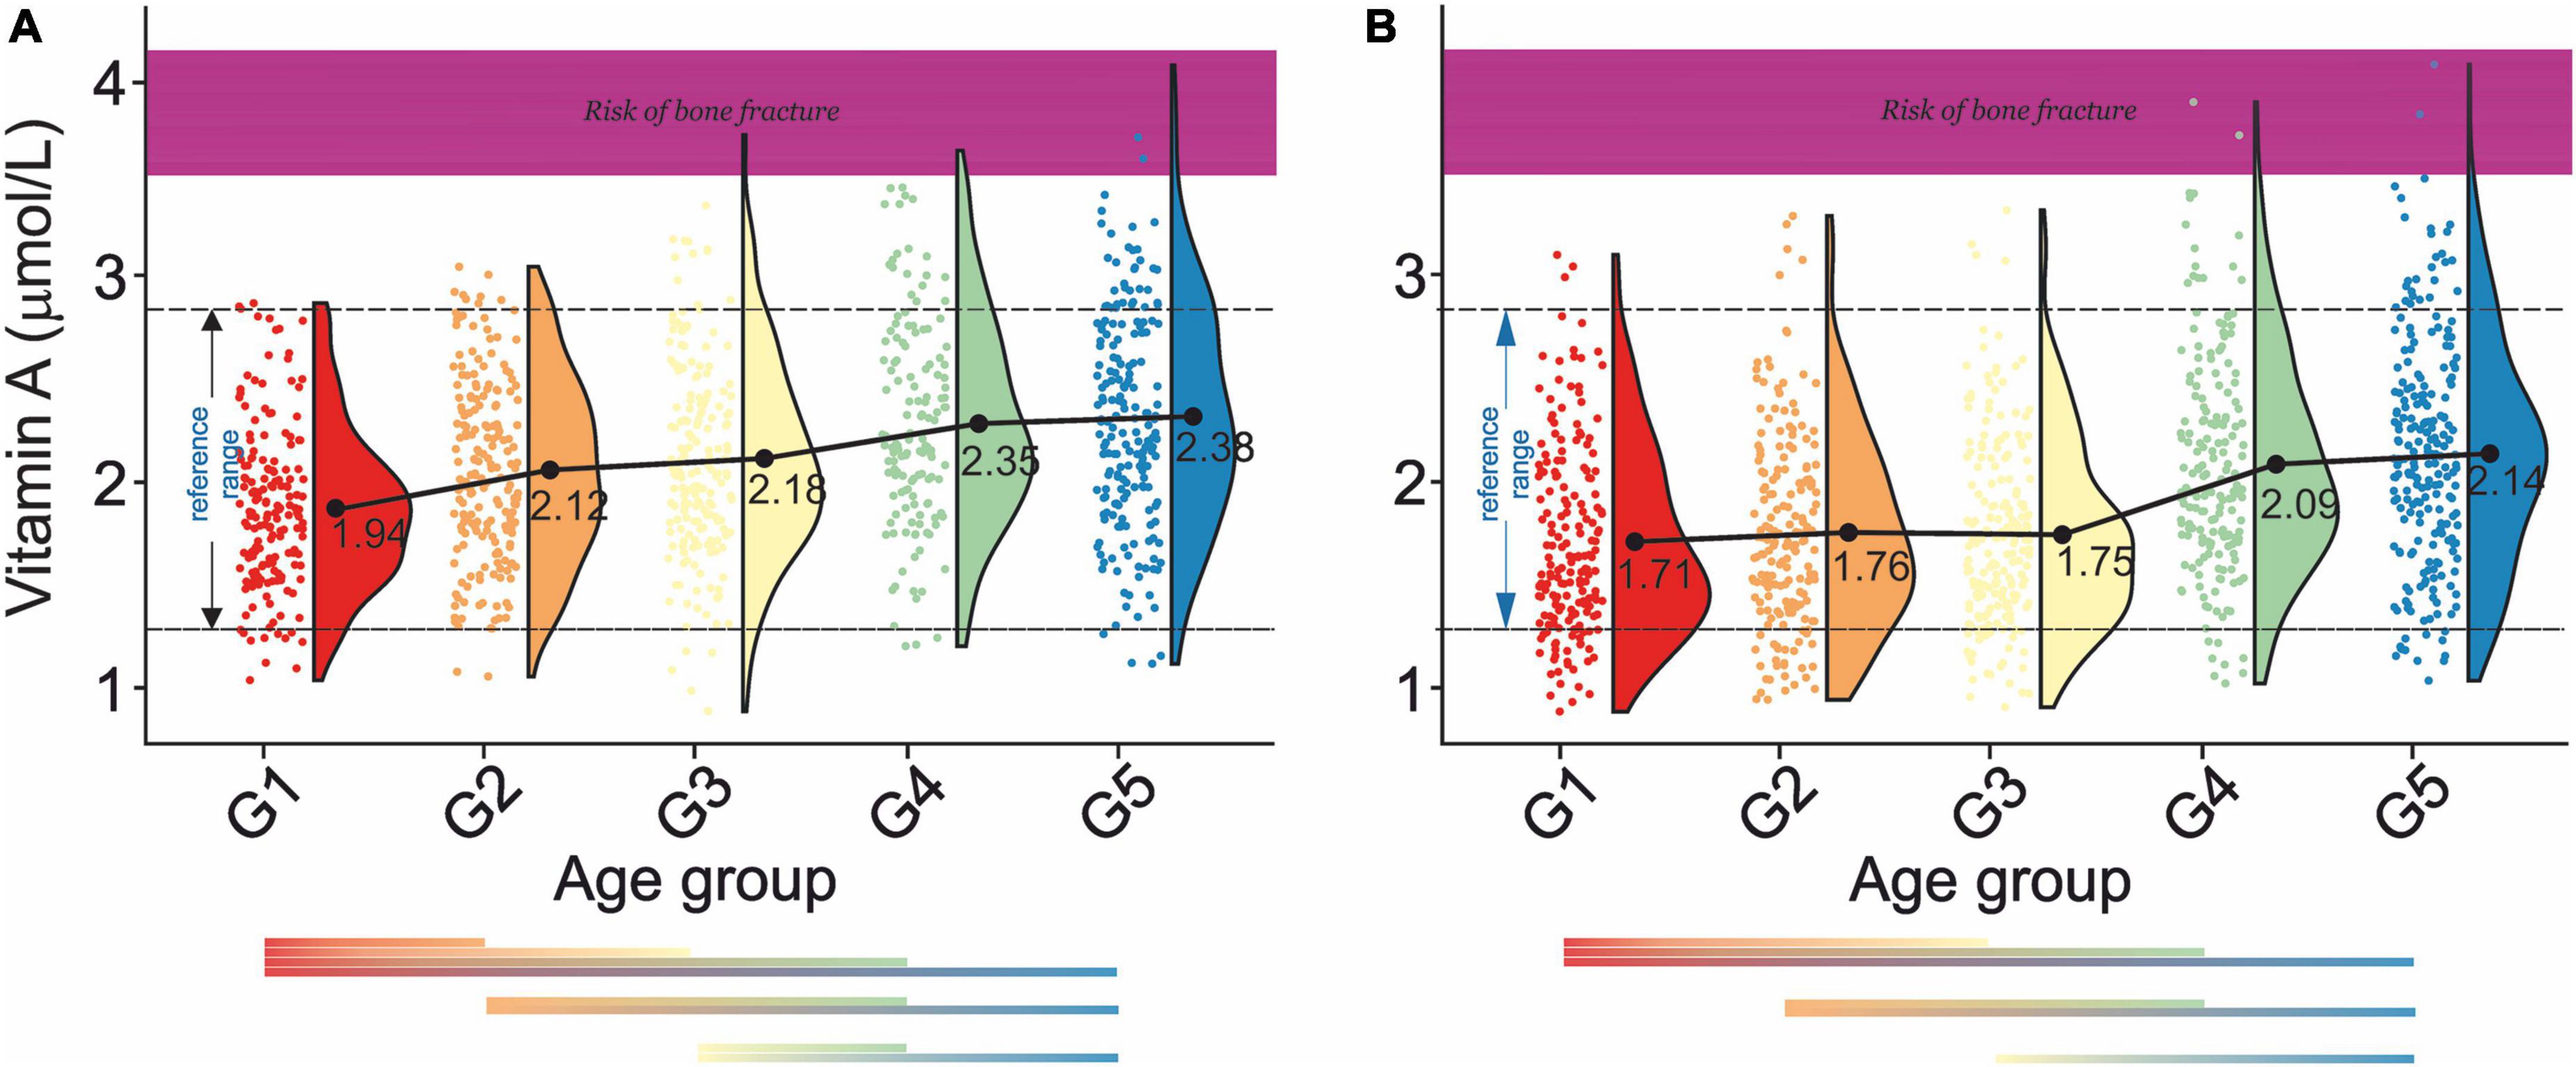
Figure 3. Rain-cloud plots of age-dependent changes in vitamin A levels as a function of age group G1: 20 ≤ 1 < 30, G2: 30 ≤ 2 < 40, G3: 40 ≤ 3 < 50, G4: 50 ≤ 4 < 60, and 60 ≤ G5 < 70 years of age-stratified by gender (A) men, (B) women. Mean values for a specific sample are truncated to one decimal place. Color bars refer to statistically significant differences between groups at P < 0.05. Shaded area corresponds to vitamin A levels at which an increased risk of bone fracture is observed (98).
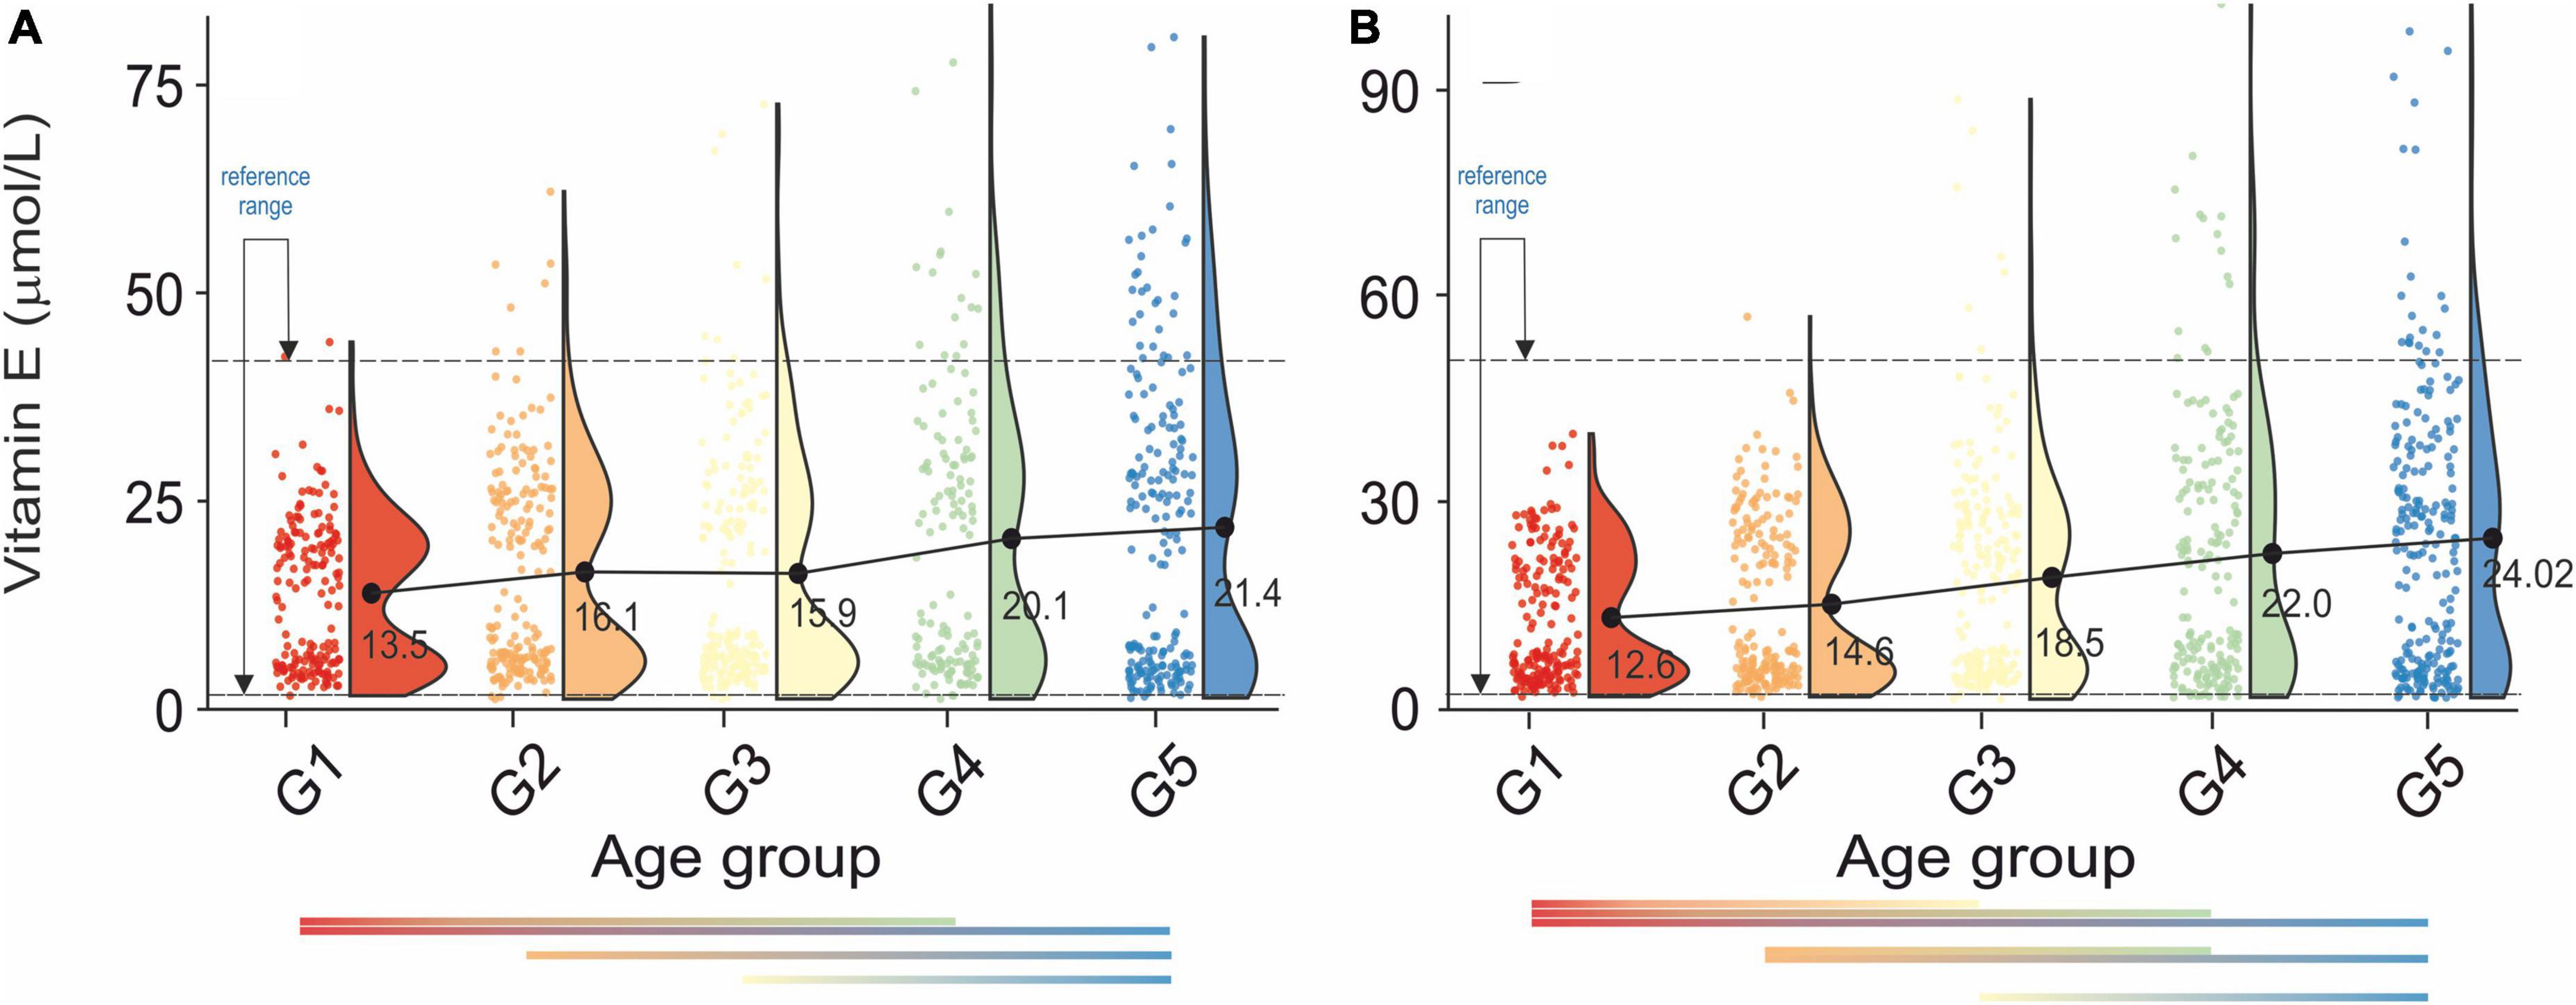
Figure 4. Rain-cloud plots of age-dependent changes in vitamin E levels as a function of age group G1: 20 ≤ 1 < 30, G2: 30 ≤ 2 < 40, G3: 40 ≤ 3 < 50, G4: 50 ≤ 4 < 60, and 60 ≤ G5 < 70 years of age-stratified by gender (A) men, (B) women. Mean values for a specific sample are truncated to one decimal place. Color bars refer to statistically significant differences between groups at P < 0.05.
Analysis of changes of serum vitamin A level in men (Figure 3A) showed a gradual increase (G1:1.94–G5:2.38 μmol/L) with statistically significant differences between G1- G2, G1–G3, G1- G4, and G1–G5, G2–G4, and G2–G5, and G3–G4, G3–G5. In women (Figure 3B), a continuous decrease in serum vitamin A levels between G1 and G5 (1.71–2.14 mol/L) was observed. Statistically, significant differences were also observed between G1-G2, G1-G3, G1-G4, G1-G5, G2-G4, G2-G5, and G3-G5. There was a lack of apparent correlations between serum vitamin A level and normal, osteopenic, and osteoporotic status in all age groups in both sexes (Table 2A). However, in G3 and G4, a decrease in vitamin A concentration was observed between osteopenic and osteoporotic subjects in men and women. There was no correlation between vitamin A levels and blood pressure (Table 2B). However, in women in the G1–G4 groups, hypertension stage 1 was defined by higher levels of vitamin A than hypertension stage 2.
There was a gradual increase in serum vitamin B12 levels between G1 and G5 in both sexes, Figures 5A,B. Vitamin B12 levels are not correlated with bone health (Table 2A). However, osteoporotic subjects are defined by a lower vitamin B12 level than osteopenic subjects. Additionally, vitamin B12 levels do not correlate with blood pressure (Table 2B). However, the difference between stages 1 and 2 of hypertension results in a pronounced change in serum vitamin B12 levels.
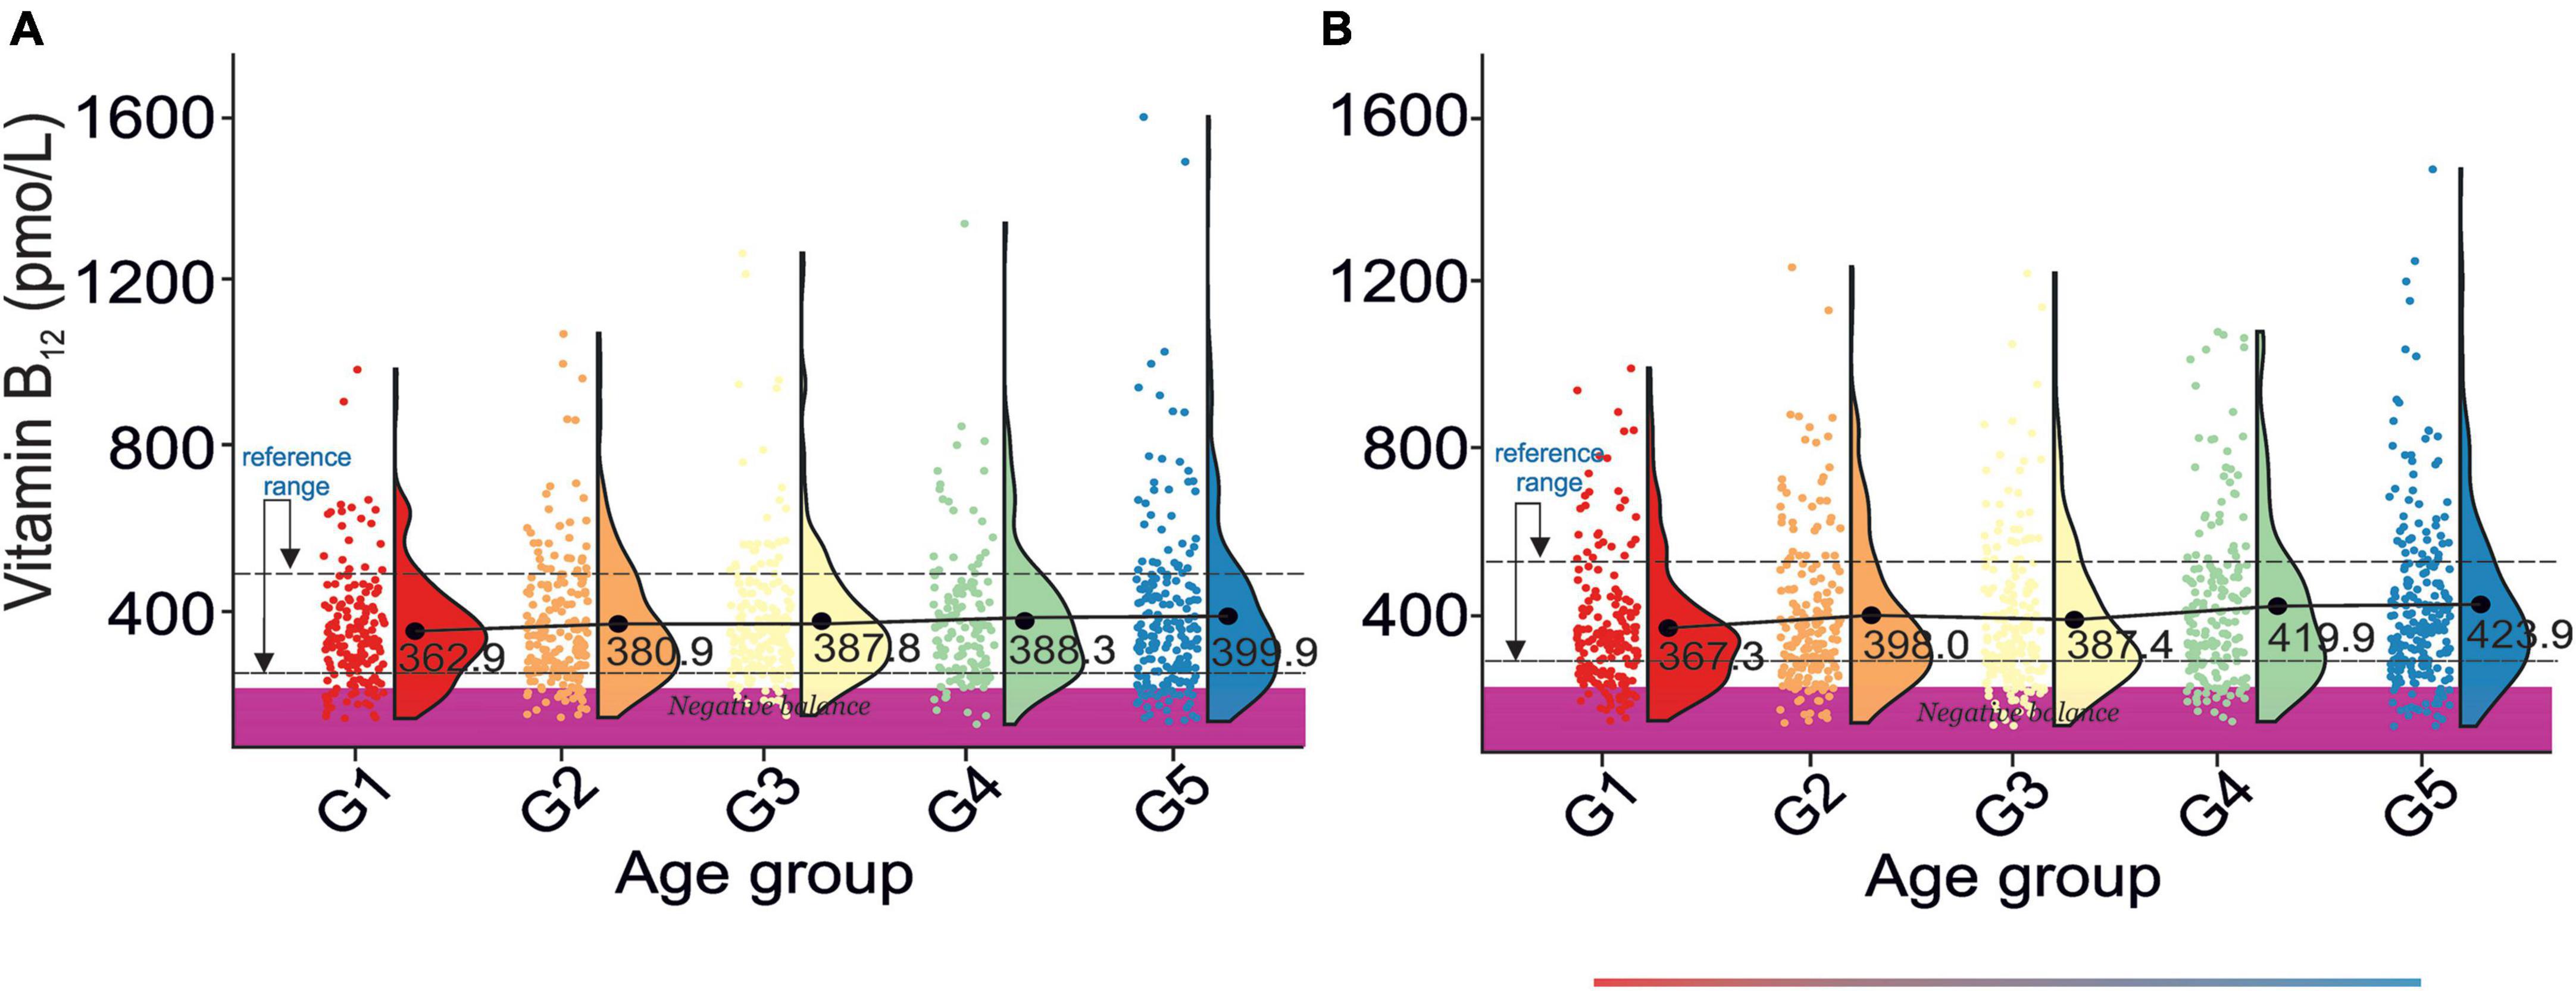
Figure 5. Rain-cloud plots of age-dependent changes in vitamin B12 levels as a function of age group G1: 20 ≤ 1 < 30, G2: 30 ≤ 2 < 40, G3: 40 ≤ 3 < 50, G4: 50 ≤ 4 < 60, and 60 ≤ G5 < 70 years of age-stratified by gender (A) men, (B) women. Mean values for a specific sample are truncated to one decimal place. Color bars refer to statistically significant differences between groups at P < 0.05. Shaded area corresponds to vitamin B12 negative balance levels (82).
Analysis of age-dependent changes in serum vitamin C levels in men and women revealed two distinct periods. First, a decrease between G1–G3 and second an increase between G3–G5, Figures 6A,B. Although there were no clear correlations between bone health and serum vitamin C levels (Table 2A), osteopenic and osteoporotic subjects are defined by markedly different serum vitamin C concentrations. Furthermore, an examination of Table 2B revealed that serum vitamin C levels decreased with an increase in blood pressure in both sexes.
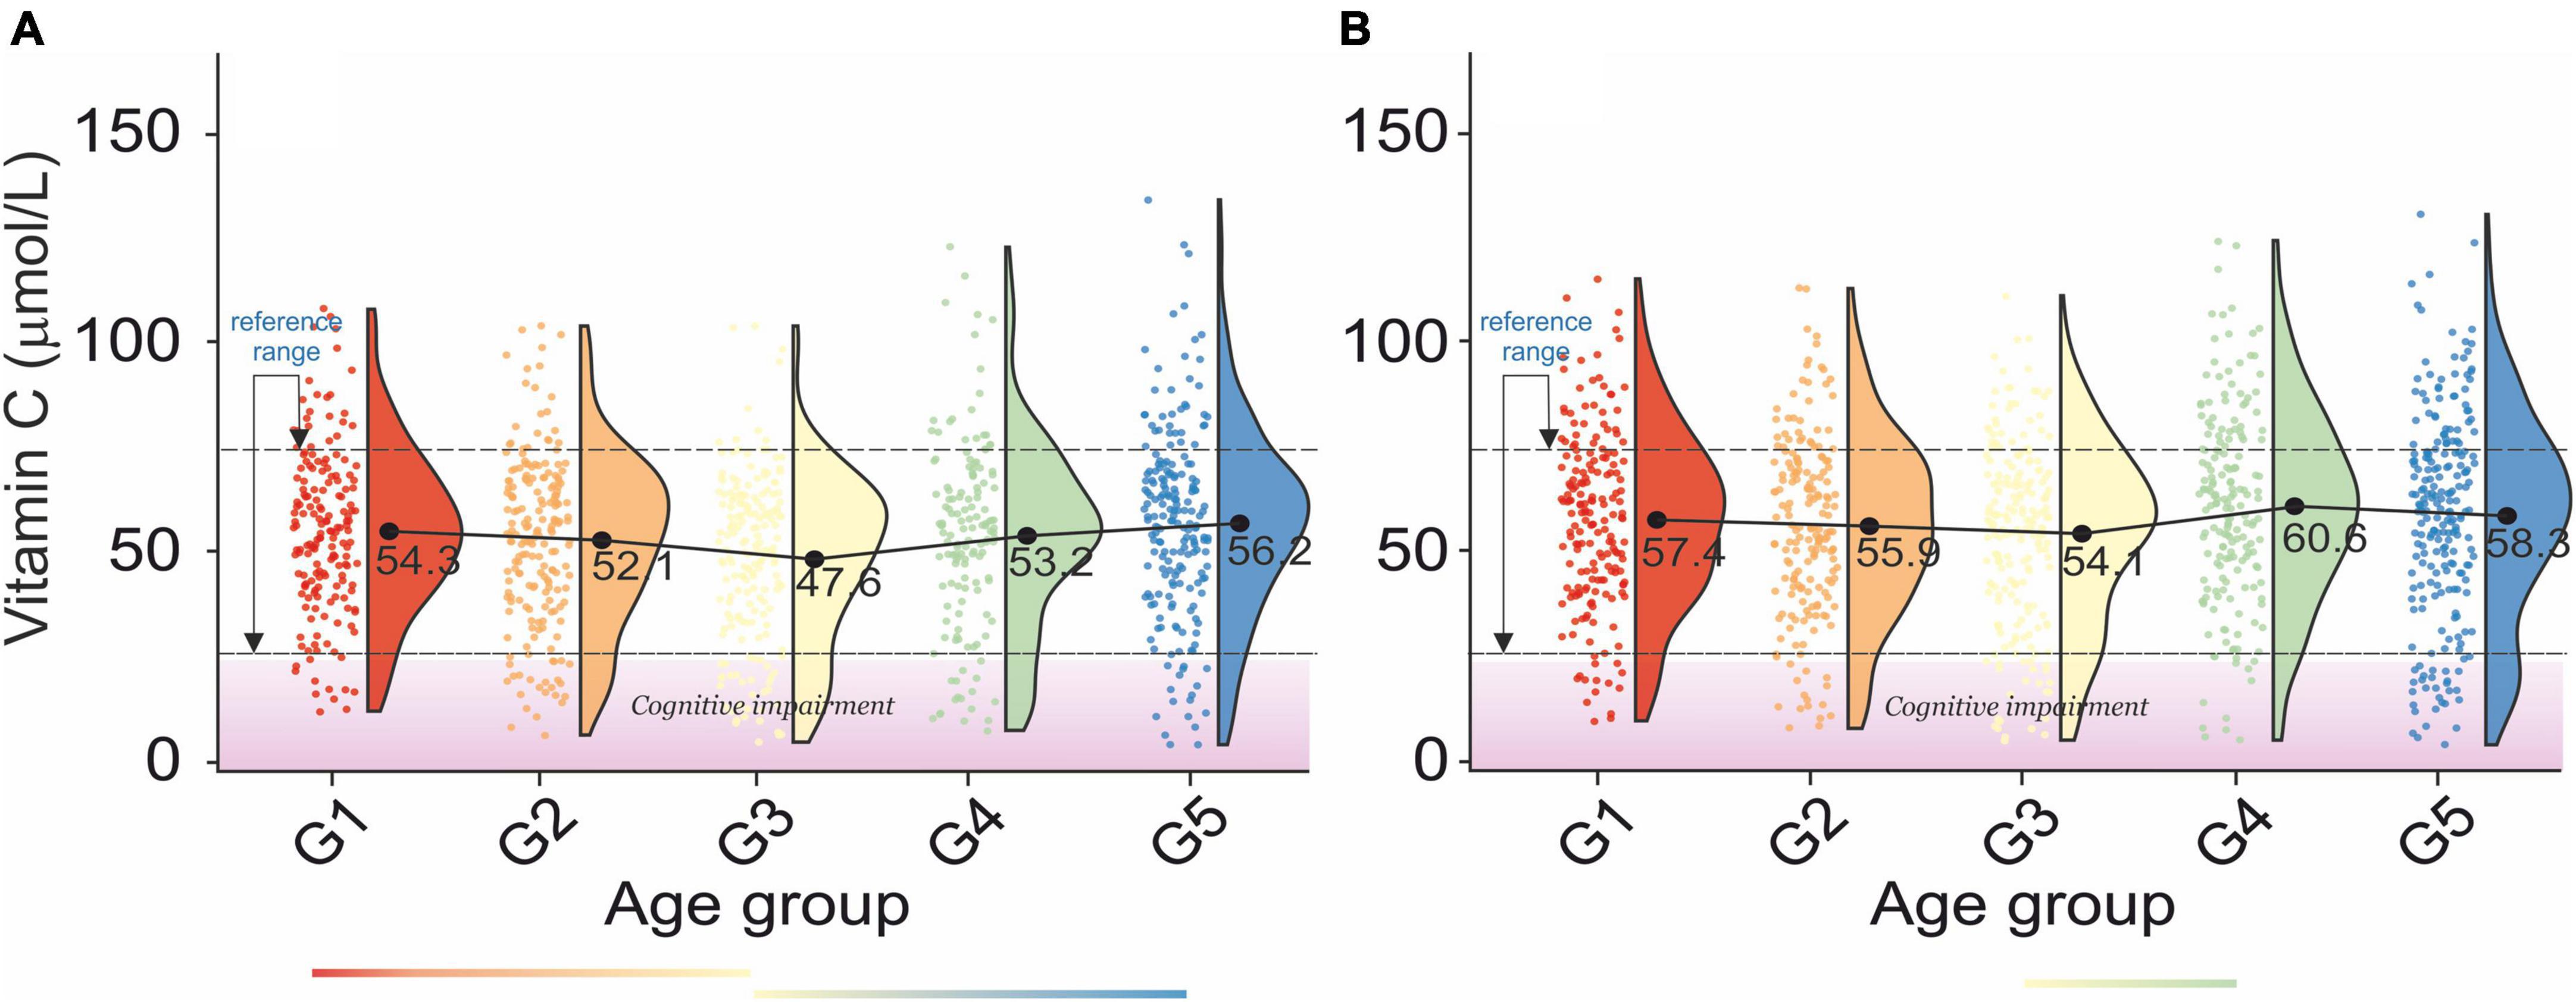
Figure 6. Rain-cloud plots of age-dependent changes in vitamin C levels as a function of age group G1: 20 ≤ 1 < 30, G2: 30 ≤ 2 < 40, G3: 40 ≤ 3 < 50, G4: 50 ≤ 4 < 60, and 60 ≤ G5 < 70 years of age-stratified by gender (A) men, (B) women. Mean values for a specific sample are truncated to one decimal place. Color bars refer to statistically significant differences between groups at P < 0.05. A shaded area corresponds to an increased risk of cognitive impairment vitamin levels (86).
A gradual increase in serum vitamin D levels was observed as a function of age in both genders, Figures 7A,B. A decrease between G2–G3 and an increase between G3–G4, corresponding to menopausal transition (58), was observed in women. In men, changes in serum vitamin D did not directly reflect bone health status, Table 2A. However, the difference between osteopenic and osteoporotic subjects was always associated with a distinct decrease in serum vitamin D levels. A decrease in serum vitamin D was observed among normal, osteoporotic, and osteoporotic women. No cross-correlations were observed between vitamin D levels and blood pressure in both sexes (Table 2B).
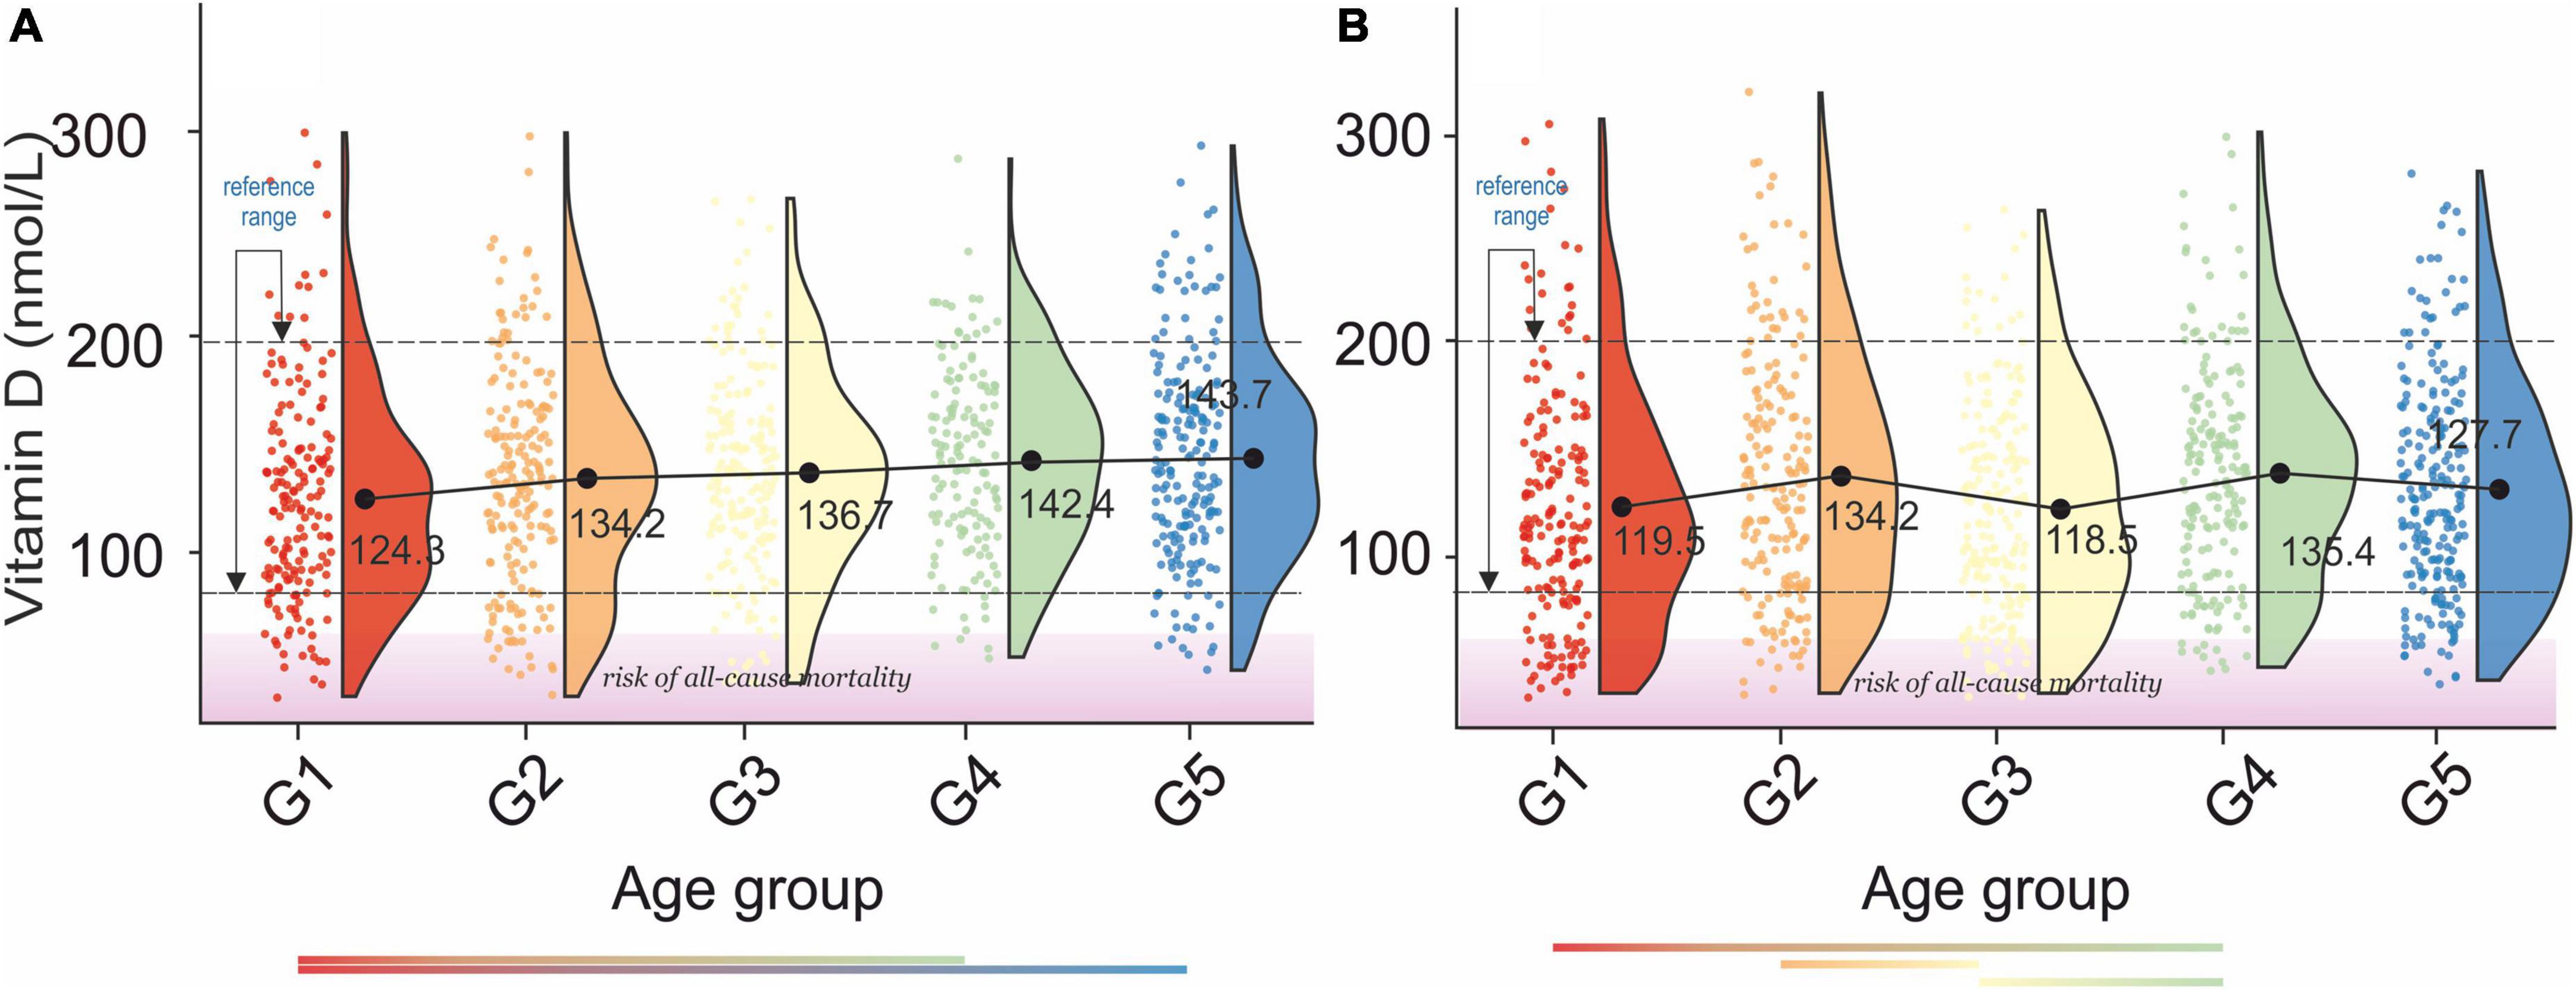
Figure 7. Rain-cloud plots of age-dependent changes in vitamin D levels as a function of age group G1: 20 ≤ 1 < 30, G2: 30 ≤ 2 < 40, G3: 40 ≤ 3 < 50, G4: 50 ≤ 4 < 60, and 60 ≤ G5 < 70 years of age-stratified by gender (A) men, (B) women. Mean values for a specific sample are truncated to one decimal place. Color bars refer to statistically significant differences between groups at P < 0.05. Shaded area corresponds to increased risk of all-cause mortality (91).
A continuous increase in serum vitamin E levels was observed as a function of the age group, Figures 4A,B. Moreover, analysis of Figures 4A,B unfolded bimodality in age groups G1-G3. At present we are unable to explain the observed phenomenon. However, similar behavior was already reported in the study (59). Although there was no cross-correlation between serum vitamin E and bone health in either sex (Table 2A), the difference between osteopenic and osteoporotic status was reflected by a distinct change in serum vitamin E levels. Furthermore, changes in serum vitamin E level did not correspond directly to blood pressure, Table 2B. However, in women, a transition between stages 1 and 2 of hypertension was associated with a marked increase in serum vitamin E levels.
Discussion
Under normal physiological conditions, minimum amounts of vitamins are critical to homeostasis (60). Some studies have shown that small changes in serum vitamin levels, caused, among others, by seasonal variations, can negatively affect human health (61). Despite that, only the Australian government has advised to include seasonal vitamin variation in clinical practice (62). Due to the mobility of the world’s population and population subgroups per se (63), following seasonal changes in serum vitamin levels has limited medical value.
The strength of the presented study is a sample size of studied age groups resulting in significant strength of the elucidated statistical references. The limitation of this study is the technology of assessment of the levels of serum 25-hydroxyvitamin D (25(OH)D) (vitamin D) using Diasorin-Incstar 25(OH)D assay.
Studies on correlations between blood vitamin levels and human health showed that vitamin C deficiency (< 11.4 mol/L) is associated with a higher risk of coronary heart disease (16). Vitamin E supplementation in the form of α-tocopherol plays a positive role in inflammation (64) and protects the skin against sun radiation (65). Vitamin B12 intake inhibits cognitive decline, macular degeneration and maintains bone health (66). Vitamin A deficiency increase the risk of occurrences of measles and diarrhea (67), whileacute and chronic effects of vitamin A toxicity are well documented (68). Vitamin D is essential for preventing osteoporosis, prostate, colon, and breast cancer (69). It is also inversely related to hypertension (70) and type I diabetes mellitus (71).
Although a variety of reports discussed the medical manifestations of changes in serum/plasma levels of vitamin C (72), vitamin D (73), vitamin B12 (74), vitamin C (72), and vitamins A and E (7) in human health, there is a lack of information changes in their levels as a function of age and the respective reference range. Additionally, the results presented depend on the data source.
For example, Merck (75) provided a gender-independent standard range of vitamin A between 0.98 and 3.00 μmol/L, while de Pee and Dary (76) reported a range between 1.13 and 2.63 μmol/L and 1.32–2.44 μmol/L for men and women, respectively. Although these differences are subtle, they may have profound health implications. For example, Wu et al. (77) reported an increased risk of bone fracture in males with serum/plasma vitamin A concentrations greater than 1.40 mol/L.
Our report unfolded a distinct age-dependent increase in serum vitamin A levels in both men and women. With the respective gender-independent reference between 1.32 and 2.80 μmol/L. The results obtained correspond well to the values previously reported (78). Cross-correlation of our data with those on a bone fracture as a function of serum retinol levels (77) revealed that aging is associated with an increase in the number of subjects at risk of bone fracture (Figures 3A,B). This study confirmed a positive association between serum vitamin A levels and blood pressure levels (79) in G1 and G1–G5 in male and female subjects. However, men over 30 years of age were defined by the negative association between serum vitamin A levels and hypertension.
The reference range for serum vitamin B12 levels derived from this study was 257.94–498.33 pmol/L and roughly corresponded to the previously reported values (5, 74, 80, 81). However, apparent differences in vitamin B12 levels between sources are, in our opinion, caused by methodological and ethnic variations among studies. The cross-correlation of our results with those reported by Herber (82) revealed 20% of men and women in all age groups defined by a negative vitamin B12 balance (< 221 pmol/L). Such a large percentage of randomly selected subjects falling into the negative vitamin B12 balance may indicate: (1) a grave vitamin B12 supplementation problem in the U.S.A, (2) the need for amendment of negative vitamin B12 balance cut-off values.
The age and sex-independent plasma vitamin C reference range was 38.18–79.2 μmol/L. Our results are more restricted than those of Hagel et al. (28.41–85.23 μmol/L) (83). Furthermore, the lower bracket of the vitamin C reference range is less than that reported by Zempleni (45–80 μmol/L) (84). However, Tietz’s textbook on molecular diagnostics (85) provided a serum vitamin C range between 23 and 85μmol/L, while the Royal College of Pathologists of Australasia provides a range between 30 and 80μmol/L. The cross-correlation of the results of this study with those on ascorbic acid levels in blood plasma and neuropsychiatric effects (86) revealed that ∼ 25% of the study sample in each age group had an increased risk of cognitive impairment (vitamin C levels < 27.82μmol/L). Our report also revealed the lack of cross-correlation between blood vitamin C levels and bone health in older women. However, there is a marked decrease in vitamin C levels between osteopenic and osteoporotic subjects. In this regard, our report confirmed the previous study (87). Furthermore, the results presented validated the previously reported inverse association between plasma vitamin C and BP (88).
The serum vitamin D reference interval established by this study was 76.33–199.36 nmol/L. The values obtained correlate well with previously reported “optimal” gender, and age-independent reference ranges for serum vitamin D levels in the populations other that the USA (89) 74.88–249.6 nmol/L and 62.4–199.68 nmol/L for USA population (90). An amalgam of the study on the age of menopausal transition with the results of this study indicated that the pre-, peri-, and post-menopausal transition is associated with a decrease in serum vitamin D levels. Furthermore, the cross-correlation of the results of this report with the study on 25-hydroxyvitamin D levels and mortality risk revealed that 10% of the studied population was at risk of all-cause mortality (< 44.43 nmol/L) (91). Although male osteopenic subjects were defined by slightly higher vitamin D levels than normal subjects, osteoporosis is always manifested by a distinct drop in vitamin D levels compared to normal and osteopenic subjects. The later observation is confirmed by the latest study of LeBoff et al. (92). Moreover, the latter study unfolded that supplementation with vitamin D3 (2,000 IU per day) without co-administering calcium did not result in a lower risk of fractures.
Analysis of blood pressure as a function of serum vitamin D concentration unfolded, as in another study (93), lack of distinctive correlations in elderly subjects; see age groups G4 and G5 in men and women, Figures 7A,B. However, the difference between stage 1 hypertension and stage 2 hypertension is associated with a distinct decrease in vitamin D levels. This observation was confirmed by the study of Zhou et al. (94).
The standard reference range of serum vitamin E levels unfolded in this study was 3.65–41.12μmol/L. This result is much stricter than previously reported by Ford et al. (0.8–71.9 μmol/L) (95). Therefore, although the previous study indicated a potential positive role for serum vitamin E in maintaining BMD (96), this study does not support this conclusion. Furthermore, we were unable to confirm the positive and significant association between serum vitamin E with SBP and DBP. Nevertheless, subjects with stage 2 hypertension are defined by a lower vitamin E concentration than the subjects with stage 1 hypertension.
Conclusion
The results of this study unfolded the following vitamin ranges for subjects older than 20 years: vitamin A: 1.32–2.8 mmol/L, vitamin B12: 257.94–498.33 pmol/L, vitamin C: 38.18–79.2 mmol/L, vitamin D: 76.33–199.36 nmol/L, and vitamin E: 3.65–41.12 μmol/L. Furthermore, our results did not confirm direct correlations between cardiovascular—and bone- health and blood vitamin levels. The observed small trend in an increase in serum levels of studied vitamins as a function of age combined with the results of the study on vitamins intakes among elderly (97) confirm that a majority of elderly support their diet with vitamin supplements.
Data availability statement
Publicly available datasets were analyzed in this study. This data can be found here: https://wwwn.cdc.gov/nchs/nhanes/Default.aspx.
Author contributions
All authors listed have made a substantial, direct, and intellectual contribution to the work, and approved it for publication.
Conflict of interest
The authors declare that the research was conducted in the absence of any commercial or financial relationships that could be construed as a potential conflict of interest.
Publisher’s note
All claims expressed in this article are solely those of the authors and do not necessarily represent those of their affiliated organizations, or those of the publisher, the editors and the reviewers. Any product that may be evaluated in this article, or claim that may be made by its manufacturer, is not guaranteed or endorsed by the publisher.
Footnotes
- ^ https://www.cdc.gov/nchs/nhanes/nh3rrm.htm
- ^ https://wwwn.cdc.gov/nchs/nhanes/continuousnhanes/manuals.aspx?BeginYear=1999
- ^ https://www.cdc.gov/nchs/nhanes/about_nhanes.htm
References
1. Addai-Mensah O, Gyamfi D, Duneeh RV, Danquah KO, Annani-Akollor ME, Boateng L, et al. Determination of haematological reference ranges in healthy adults in three regions in Ghana. Biomed Res Int. (2019) 2019:7467512. doi: 10.1155/2019/7467512
2. Miri-Dashe T, Osawe S, Tokdung M, Daniel N, Choji RP, Mamman I, et al. Comprehensive reference ranges for hematology and clinical chemistry laboratory parameters derived from normal Nigerian adults. PLoS One. (2014) 9:e93919.
3. Bakrim S, Motiaa Y, Benajiba M, Ouarour A, Masrar A. Establishment of the hematology reference intervals in a healthy population of adults in the Northwest of Morocco (Tangier-Tetouan region). Pan Afr Med J. (2018) 29:169.
4. Galukande M, Jombwe J, Fualal J, Baingana R, Gakwaya A. Reference values for serum levels of folic acid and vitamin B12 in a young adult Ugandan population. Afr Health Sci. (2011) 11:240–3.
5. Wahlin A, Backman L, Hultdin J, Adolfsson R, Nilsson LG. Reference values for serum levels of vitamin B12 and folic acid in a population-based sample of adults between 35 and 80 years of age. Public Health Nutr. (2002) 5:505–11. doi: 10.1079/PHNPHN200167
6. Ditlefsen EM, Stoa KF. Vitamin-A and carotenoid levels in blood serum with special reference to values observed in diseases of the liver. Scand J Clin Lab Invest. (1954) 6:210–6.
7. Winklhofer-Roob BM, van’t Hof MA, Shmerling DH. Reference values for plasma concentrations of vitamin E and A and carotenoids in a Swiss population from infancy to adulthood, adjusted for seasonal influences. Clin Chem. (1997) 43:146–53.
8. Keaney JF Jr, Simon DI, Freedman JE. Vitamin E and vascular homeostasis: implications for atherosclerosis. FASEB J. (1999) 13:965–75. doi: 10.1096/fasebj.13.9.965
9. Fleet JC. The role of vitamin D in the endocrinology controlling calcium homeostasis. Mol Cell Endocrinol. (2017) 453:36–45. doi: 10.1016/j.mce.2017.04.008
10. Basu TK, Basualdo C. Vitamin A homeostasis and diabetes mellitus. Nutrition. (1997) 13:804–6. doi: 10.1016/s0899-9007(97)00192-5
11. Birn H. The kidney in vitamin B12 and folate homeostasis: characterization of receptors for tubular uptake of vitamins and carrier proteins. Am J Physiol Renal Physiol. (2006) 291:F22–36. doi: 10.1152/ajprenal.00385.2005
12. Harris SS, Dawson-Hughes B, Perrone GA. Plasma 25-hydroxyvitamin D responses of younger and older men to three weeks of supplementation with 1800 IU/day of vitamin D. J Am Coll Nutr. (1999) 18:470–4. doi: 10.1080/07315724.1999.10718885
13. Han SN, Adolfsson O, Lee CK, Prolla TA, Ordovas J, Meydani SN. Age and vitamin E-induced changes in gene expression profiles of T cells. J Immunol. (2006) 177:6052–61. doi: 10.4049/jimmunol.177.9.6052
14. Wei J, Zhu A, Ji JSA. Comparison study of vitamin D deficiency among older adults in China and the United States. Sci Rep. (2019) 9:19713. doi: 10.1038/s41598-019-56297-y
15. Oliveira Martinho K, Luiz Araújo Tinôco A, Queiroz Ribeiro A. Prevalence and factors associated with vitamin b12 deficiency in elderly from viçosa/mg, Brasil. Nutr Hosp. (2015) 32:2162–8. doi: 10.3305/nh.2015.32.5.9648
16. Moser MA, Chun OK. Vitamin C and heart health: a review based on findings from epidemiologic studies. Int J Mol Sci. (2016) 17:1328. doi: 10.3390/ijms17081328
17. Nascimento AL, Diniz Ada S, Arruda I. [Vitamin A deficiency in elderly attending the Health Family Programme in Camaragibe, PE, Brazil]. Arch Latinoam Nutr. (2007) 57:213–8.
18. Rizvi S, Raza ST, Ahmed F, Ahmad A, Abbas S, Mahdi F. The role of vitamin e in human health and some diseases. Sultan Qaboos Univ Med J. (2014) 14:e157–65.
19. Morley JE. Decreased food intake with aging. J Gerontol A Biol Sci Med Sci. (2001) 56:81–8. doi: 10.1093/gerona/56.suppl_2.81
20. Drewnowski A, Shultz JM. Impact of aging on eating behaviors, food choices, nutrition, and health status. J Nutr Health Aging. (2001) 5:75–9.
21. Everitt AV, Hilmer SN, Brand-Miller JC, Jamieson HA, Truswell AS, Sharma AP, et al. Dietary approaches that delay age-related diseases. Clin Interv Aging. (2006) 1:11–31. doi: 10.2147/ciia.2006.1.1.11
22. Gille D. Overview of the physiological changes and optimal diet in the golden age generation over 50. Eur Rev Aging Phys Act. (2010) 7:27–36. doi: 10.1007/s11556-010-0058-5
23. Feldman M, Cryer B, McArthur KE, Huet BA, Lee E. Effects of aging and gastritis on gastric acid and pepsin secretion in humans: a prospective study. Gastroenterology. (1996) 110:1043–52. doi: 10.1053/gast.1996.v110.pm8612992
24. Russell RM. Factors in aging that effect the bioavailability of nutrients. J Nutr. (2001) 131(4 Suppl):1359s–61s. doi: 10.1093/jn/131.4.1359S
25. Brouwer-Brolsma EM, Dhonukshe-Rutten RAM, van Wijngaarden JP, Zwaluw NL, Velde NV, de Groot LC. Dietary sources of Vitamin B-12 and their association with Vitamin B-12 status markers in healthy older adults in the B-PROOF study. Nutrients. (2015) 7:7781–97. doi: 10.3390/nu7095364
26. García-Closas R, Berenguer A, José Tormo M, José Sánchez M, Quirós JR, Navarro C, et al. Dietary sources of vitamin C, vitamin E and specific carotenoids in Spain. Br J Nutr. (2004) 91:1005–11. doi: 10.1079/bjn20041130
27. MacRury SM, Muir M, Hume R. Seasonal and climatic variation in cholesterol and Vitamin C: effect of vitamin C supplementation. Scott Med J. (1992) 37:49–52. doi: 10.1177/003693309203700208
28. Levis S, Gomez A, Jimenez C, Veras L, Ma F, Lai S, et al. Vitamin D deficiency and seasonal variation in an adult south florida population. J Clin Endocrinol Metabol. (2005) 90:1557–62. doi: 10.1210/jc.2004-0746
29. Ohwada K, Taga N. Distribution and seasonal variation of vitamin B12, thiamine and biotin in the sea. Mar Chem. (1972) 1:61–73. doi: 10.1016/0304-4203(72)90007-2
30. Arnaud J, Fleites P, Chassagne M, Verdura T, Barnouin J, Richard MJ, et al. Seasonal variations of antioxidant imbalance in Cuban healthy men. Eur J Clin Nutr. (2001) 55:29–38. doi: 10.1038/sj.ejcn.1601118
31. Heidari B, Haji Mirghassemi MB. Seasonal variations in serum vitamin D according to age and sex. Caspian J Intern Med. (2012) 3:535–40.
32. Charach G, Shochat M, Argov O, Weintraub M, Charach L, Rabinovich A, et al. Seasonal changes in blood pressure: cardiac and cerebrovascular morbidity and mortality. World J Hypertens. (2013) 1:1–8.
33. Fares A. Winter hypertension: potential mechanisms. Int J Health Sci. (2013) 7:210–9. doi: 10.12816/0006044
34. Radke KJ, Izzo JL. Seasonal variation in haemodynamics and blood pressure-regulating hormones. J Hum Hypertens. (2010) 24:410–6. doi: 10.1038/jhh.2009.75
35. Woitge HW, Scheidt-Nave C, Kissling C, Leidig-Bruckner G, Meyer K, Grauer A, et al. Seasonal variation of biochemical indexes of bone turnover: results of a population-based study1. J Clin Endocrinol Metab. (1998) 83:68–75. doi: 10.1210/jcem.83.1.4522
36. Modesti PA, Morabito M, Massetti L, Rapi S, Orlandini S, Mancia G, et al. Seasonal blood pressure changes. Hypertension. (2013) 61:908–14. doi: 10.1161/HYPERTENSIONAHA.111.00315
37. Ockene IS, Chiriboga DE, Stanek EJ III, Harmatz MG, Nicolosi R, Saperia G, et al. Seasonal variation in serum cholesterol levels: treatment implications and possible mechanisms. Arch Intern Med. (2004) 164:863–70. doi: 10.1001/archinte.164.8.863
38. Chobanian AV, Bakris GL, Black HR, Cushman WC, Green LA, Izzo JL Jr, et al. The Seventh Report of the Joint National Committee on prevention, detection, evaluation, and treatment of high blood pressure: the JNC 7 report. JAMA. (2003) 289:2560–72. doi: 10.1001/jama.289.19.2560
39. National Cholesterol Education Program Expert Panel on Detection, Evaluation, and Treatment of High Blood Cholesterol in Adults (Adult Treatment Panel III). Third Report of the National Cholesterol Education Program (NCEP) expert panel on detection, evaluation, and treatment of high blood cholesterol in adults (Adult Treatment Panel III) final report. Circulation. (2002) 106:3143–421.
40. National Center for Health Statistics. National Health and Nutrition Examination Survey 1600 Clifton Rd. Atlanta, GA: National Center for Health Statistics (2012).
41. National Research Council (US) Coordinating Committee on Evaluation of Food Consumption Surveys. National Survey Data on Food Consumption: Uses and Recommendations. Washington DC: National Survey Data on Food Consumption (1984).
42. Zipf G, Chiappa M, Porter KS, Ostchega Y, Lewis BG, Dostal J. National health and nutrition examination survey: plan and operations, 1999-2010. Vit Health Stat 1. (2013) 56:1–37.
43. Curtin LR, Mohadjer LK, Dohrmann SM, Montaquila JM, Kruszan-Moran D, Mirel LB, et al. The National Health and nutrition examination survey: sample design, 1999-2006. Vit Health Stat 2. (2012) 155:1–39.
44. Wise SA, Camara JE, Sempos CT, Lukas P, Le Goff C, Peeters S, et al. Vitamin D Standardization Program (VDSP) intralaboratory study for the assessment of 25-hydroxyvitamin D assay variability and bias. J Steroid Biochem Mol Biol. (2021) 212:105917. doi: 10.1016/j.jsbmb.2021.105917
45. BR Laboratories. Bio-Rad Quantaphase II Folate Radioassay Kit. Hercules, CA: Bio-Rad Laboratories (1993).
47. Hoyumpa AM. Mechanisms of vitamin deficiencies in alcoholism. Alcohol Clin Exp Res. (1986) 10:573–81. doi: 10.1111/j.1530-0277.1986.tb05147.x
48. Schreurs WH, Odink J, Egger RJ, Wedel M, Bruning PF. The influence of radiotherapy and chemotherapy on the vitamin status of cancer patients. Int J Vitam Nutr Res. (1985) 55:425–32.
49. Urrutia-Pereira M, Solé D. [Vitamin D deficiency in pregnancy and its impact on the fetus, the newborn and in childhood]. Rev Paul Pediatr. (2015) 33:104–13.
50. Gellert S, Ströhle A, Hahn A. Breastfeeding woman are at higher risk of vitamin D deficiency than non-breastfeeding women - insights from the German VitaMinFemin study. Int Breastfeed J. (2017) 12:19. doi: 10.1186/s13006-017-0105-1
51. Horn PS, Feng L, Li Y, Pesce AJ. Effect of outliers and nonhealthy individuals on reference interval estimation. Clin Chem. (2001) 47:2137–45.
52. Rousseeuw PJ, Croux C. Alternatives to the Median Absolute Deviation. J Am Stat Assoc. (1993) 88:1273–83. doi: 10.1080/01621459.1993.10476408
53. Centers for Disease Control and Prevention. Revised Analytical Note for NHANES 2000-2006 and NHANES III (1988-1994) 25-Hydroxyvitamin D Analysis. Atlanta, GA: Centers for Disease Control and Prevention (2012).
55. Whelton PK, Carey RM, Aronow WS, Casey DE Jr, Collins KJ, Dennison Himmelfarb C, et al. 2017 ACC/AHA/AAPA/ABC/ACPM/AGS/APhA/ASH/ASPC/NMA/PCNA Guideline for the Prevention, Detection, Evaluation, and Management of High Blood Pressure in Adults: Executive Summary: A Report of the American College of Cardiology/American Heart Association Task Force on Clinical Practice Guidelines. Hypertension. (2018) 71:1269–324. doi: 10.1161/hyp.0000000000000066
56. R Core Team. A Language and Environment for Statistical Computing. Vienna: R Foundation for Statistical Computing (2020).
57. Shapiro SS, Wilk MB, Chen HJ. A comparative study of various tests of normality. J Am Stat Assoc. (1968) 63:1343–72.
58. Wiacek M, Zubrzycki IZ, Bojke O, Kim HJ. Menopause and age-driven changes in blood level of fat- and water-soluble vitamins. Climacteric. (2013) 16:689–99. doi: 10.3109/13697137.2012.742504
59. McBurney M, Yu E, Ciappio E, Bird J, Eggersdorfer M, Mehta S, et al. Suboptimal serum α-tocopherol concentrations observed among younger adults and those depending exclusively upon food sources, NHANES 2003-2006. PLoS One. (2015) 10:e135510. doi: 10.1371/journal.pone.0135510
60. Young VR, Newberne PM. Vitamins and cancer prevention: issues and dilemmas. Cancer. (1981) 47(5 Suppl):1226–40.
61. Uribe N, Reig García-Galbis M, María R, Martínez-Espinosa R. New Advances about the Effect of Vitamins on Human Health: Vitamins Supplements and Nutritional Aspects. Vienna: Intech (2017). p. 57–75.
62. Nowson CA, McGrath JJ, Ebeling PR, Haikerwal A, Daly RM, Sanders KM, et al. Vitamin D and health in adults in Australia and New Zealand: a position statement. Med J Austr. (2012) 196:686–7.
63. Kraemer MUG, Sadilek A, Zhang Q, Marchal NA, Tuli G, Cohn EL, et al. Mapping global variation in human mobility. Nat Hum Behav. (2020) 4:800–10. doi: 10.1038/s41562-020-0875-0
64. Asbaghi O, Sadeghian M, Nazarian B, Sarreshtedari M, Mozaffari-Khosravi H, Maleki V, et al. The effect of vitamin E supplementation on selected inflammatory biomarkers in adults: a systematic review and meta-analysis of randomized clinical trials. Sci Rep. (2020) 10:17234. doi: 10.1038/s41598-020-73741-6
65. Keen MA, Hassan I. Vitamin E in dermatology. Indian Dermatol Online J. (2016) 7:311–5. doi: 10.4103/2229-5178.185494
66. O’Leary F, Samman S. Vitamin B12 in health and disease. Nutrients. (2010) 2:299–316. doi: 10.3390/nu2030299
67. Underwood BA, Arthur P. The contribution of vitamin A to public health. FASEB J. (1996) 10:1040–8.
68. Penniston KL, Tanumihardjo SA. The acute and chronic toxic effects of vitamin A. Am J Clin Nutr. (2006) 83:191–201. doi: 10.1093/ajcn/83.2.191
69. Heaney RP. Vitamin D in health and disease. Clin J Am Soc Nephrol. (2008) 3:1535–41. doi: 10.2215/cjn.01160308
70. Bucher HC, Guyatt GH, Cook RJ, Hatala R, Cook DJ, Lang JD, et al. Effect of calcium supplementation on pregnancy-induced hypertension and preeclampsia: a meta-analysis of randomized controlled trials. JAMA. (1996) 275:1113–7.
71. Hyppönen E, Läärä E, Reunanen A, Järvelin M-R, Virtanen SM. Intake of vitamin D and risk of type 1 diabetes: a birth-cohort study. Lancet. (2001) 358:1500–3.
72. Ness AR, Cappuccio FP, Atkinson RW, Khaw KT, Cook DG. Plasma vitamin C levels in men and women from different ethnic backgrounds living in England. Int J Epidemiol. (1999) 28:450–5. doi: 10.1093/ije/28.3.450
73. Ross AC, Manson JE, Abrams SA, Aloia JF, Brannon PM, Clinton SK, et al. The 2011 report on dietary reference intakes for calcium and vitamin D from the Institute of Medicine: what clinicians need to know. J Clin Endocrinol Metab. (2011) 96:53–8. doi: 10.1210/jc.2010-2704
74. Lindenbaum J, Rosenberg IH, Wilson PW, Stabler SP, Allen RH. Prevalence of cobalamin deficiency in the Framingham elderly population. Am J Clin Nutr. (1994) 60:2–11. doi: 10.1093/ajcn/60.1.2
75. Porter R, Kaplan J. The Merck Manual for Health Care Professionals. Whitehouse Station, N.J: Merck Sharp & Dohme Corp (2012).
76. de Pee S, Dary O. Biochemical indicators of vitamin A deficiency: serum retinol and serum retinol binding protein. J Nutr. (2002) 132(9 Suppl):2895S–901S.
77. Wu A-M, Huang C-Q, Lin Z-K, Tian N-F, Ni W-F, Wang X-Y, et al. The relationship between vitamin A and risk of fracture: meta-analysis of prospective studies. J Bone Miner Res. (2014) 29:2032–9. doi: 10.1002/jbmr.2237
78. Albahrani A, Greaves RF, Ward G, Fitzpatrick M, Harrower T. Vitamin A and E gender and age stratification in adults. Clin Chem Lab Med. (2020) 58:e79–82. doi: 10.1515/cclm-2019-0823
79. Tian T, Wang Y, Xie W, Zhang J, Ni Y, Peng X, et al. Associations between Serum Vitamin A and metabolic risk factors among eastern Chinese children and adolescents. Nutrients. (2022) 14:610. doi: 10.3390/nu14030610
80. Lindeman RD, Romero LJ, Koehler KM, Liang HC, LaRue A, Baumgartner RN, et al. Serum vitamin B12, C and folate concentrations in the New Mexico elder health survey: correlations with cognitive and affective functions. J Am Coll Nutr. (2000) 19:68–76. doi: 10.1080/07315724.2000.10718916
81. Abildgaard A, Knudsen CS, Hoejskov CS, Greibe E, Parkner T. Reference intervals for plasma vitamin B12 and plasma/serum methylmalonic acid in Danish children, adults and elderly. Clin Chim Acta. (2022) 525:62–8. doi: 10.1016/j.cca.2021.12.015
82. Herbert V. Vitamin-B12. 7th ed. In: EE Ziegler, LJ Filer editors. Present Knowledge in Nutrition. Washington, DC: ILSI Press (1996). p. 191–205.
83. Hagel AF, Albrecht H, Dauth W, Hagel W, Vitali F, Ganzleben I, et al. Plasma concentrations of ascorbic acid in a cross section of the German population. J Int Med Res. (2018) 46:168–74. doi: 10.1177/0300060517714387
85. Rifai N. Tietz Textbook of Clinical Chemistry and Molecular Diagnostics. Amsterdam: Elsevier (2018).
86. Plevin D, Galletly C. The neuropsychiatric effects of vitamin C deficiency: a systematic review. BMC Psychiatry. (2020) 20:315. doi: 10.1186/s12888-020-02730-w
87. Simon JA, Hudes ES. Relation of ascorbic acid to bone mineral density and self-reported fractures among US adults. Am J Epidemiol. (2001) 154:427–33. doi: 10.1093/aje/154.5.427
88. Ran L, Zhao W, Tan X, Wang H, Mizuno K, Takagi K, et al. Association between serum Vitamin C and the blood pressure: a systematic review and meta-analysis of observational studies. Cardiovasc Therapeut. (2020) 2020:4940673. doi: 10.1155/2020/4940673
89. Kader S, Comakli H, Tekindal M. Evaluation of serum Vitamin D levels according to gender and age at karapinar city: a follow-up study from turkey. Dubai Med J. (2019) 2:1–5. doi: 10.1159/000503899
90. Kennel KA, Drake MT, Hurley DL. Vitamin D deficiency in adults: when to test and how to treat. Mayo Clin Proc. (2010) 85:752–7.
91. Melamed ML, Michos ED, Post W, Astor B. 25-hydroxyvitamin D levels and the risk of mortality in the general population. Arch Intern Med. (2008) 168:1629–37. doi: 10.1001/archinte.168.15.1629
92. LeBoff MS, Chou SH, Ratliff KA, Cook NR, Khurana B, Kim E, et al. Supplemental Vitamin D and incident fractures in midlife and older adults. N Engl J Med. (2022) 387:299–309. doi: 10.1056/NEJMoa2202106
93. Mehta V, Agarwal S. Does Vitamin D Deficiency Lead to Hypertension? Cureus. (2017) 9:e1038. doi: 10.7759/cureus.1038
94. Zhou A, Selvanayagam JB, Hyppönen E. Non-linear Mendelian randomization analyses support a role for vitamin D deficiency in cardiovascular disease risk. Eur Heart J. (2022) 43:1731–9. doi: 10.1093/eurheartj/ehab809
95. Ford L, Farr J, Morris P, Berg J. The value of measuring serum cholesterol-adjusted vitamin E in routine practice. Ann Clin Biochem. (2006) 43(Pt 2):130–4. doi: 10.1258/000456306776021526
96. Wong SK, Mohamad NV, Ibrahim N, Chin KY, Shuid AN, Ima-Nirwana S. The molecular mechanism of vitamin E as a bone-protecting agent: a review on current evidence. Int J Mol Sci. (2019) 20:1453. doi: 10.3390/ijms20061453
97. Troesch B, McBurney M, Weber P, Eggersdorfer M. NHANES Data indicates that adequate vitamin intake remains a challenge for a large part of the elderly even in affluent societies. Int J Food Nutr Sci. (2016) 3:189–94. doi: 10.15436/2377-0619.16.035
Keywords: aging, vitamins, health implications, reference range, health
Citation: Tomasiuk R, Zubrzycki IZ and Wiacek M (2022) Age-dependent changes in fat- and water-soluble vitamins—National Health and Nutrition Examination Surveys study. Front. Med. 9:907067. doi: 10.3389/fmed.2022.907067
Received: 13 April 2022; Accepted: 28 September 2022;
Published: 25 October 2022.
Edited by:
Ihsan Ullah, Khyber Medical University, PakistanReviewed by:
Gregory Dolnikowski, Tufts University, United StatesWilliam B. Grant, Sunlight Nutrition and Health Research Center, United States
Copyright © 2022 Tomasiuk, Zubrzycki and Wiacek. This is an open-access article distributed under the terms of the Creative Commons Attribution License (CC BY). The use, distribution or reproduction in other forums is permitted, provided the original author(s) and the copyright owner(s) are credited and that the original publication in this journal is cited, in accordance with accepted academic practice. No use, distribution or reproduction is permitted which does not comply with these terms.
*Correspondence: Magdalena Wiacek, bS53aWFjZWtAdXRocmFkLnBs