
94% of researchers rate our articles as excellent or good
Learn more about the work of our research integrity team to safeguard the quality of each article we publish.
Find out more
ORIGINAL RESEARCH article
Front. Med., 12 May 2022
Sec. Nephrology
Volume 9 - 2022 | https://doi.org/10.3389/fmed.2022.905464
 Shuai Han1,2,3,4
 Wenjun Zhao1,2,3,4
 Cuili Wang1,2,3,4
 Yucheng Wang1,2,3,4
 Rong Song5
 Hermann Haller5
 Hong Jiang1,2,3,4*
 Jianghua Chen1,2,3,4*
A kidney transplant is often the best treatment for end-stage renal disease. Although immunosuppressive therapy sharply reduces the occurrence of acute allograft rejection (AR), it remains the main cause of allograft dysfunction. We aimed to identify effective biomarkers for AR instead of invasive kidney transplant biopsy. We integrated the results of several proteomics studies related to AR and utilized public data sources. Gene ontology (GO) and pathway analyses were used to identify important biological processes and pathways. The performance of the identified proteins was validated using several public gene expression omnibus (GEO) datasets. Samples that performed well were selected for further validation through RNA sequencing of peripheral blood mononuclear cells of patients with AR (n = 16) and non-rejection (n = 19) from our medical center. A total of 25 differentially expressed proteins (DEPs) overlapped in proteomic studies of urine and blood samples. GO analysis showed that the DEPs were mainly involved in the immune system and blood coagulation. Pathway analysis showed that the complement and coagulation cascade pathways were well enriched. We found that immunoglobulin heavy constant alpha 1 (IGHA1) and immunoglobulin κ constant (IGKC) showed good performance in distinguishing AR from non-rejection groups validated with several GEO datasets. Through RNA sequencing, the combination of IGHA1, IGKC, glomerular filtration rate, and donor age showed good performance in the diagnosis of AR with ROC AUC 91.4% (95% CI: 82–100%). Our findings may contribute to the discovery of potential biomarkers for AR monitoring.
Renal transplantation is considered the best treatment for patients with end-stage renal disease (ESRD), which leads to a higher survival rate and a better quality of life (1). Although advances have been made in immunosuppressive drugs and surgical methods, the long-term outcomes of transplanted kidneys are not satisfactory. Patients with acute rejection (AR) after kidney transplantation are at an increased risk of developing chronic allografts and have reduced long-term graft survival (2).
Rapid advancements in genomics, transcriptomics, and proteomics technologies have promoted their application in understanding graft injury mechanisms. They have revealed promising biomarkers for reflecting the underlying biological processes (3). The genome is relatively unchanged and static; however, the proteome shows profound variation between different conditions and individuals. Proteomics is an effective technique for discovering biomarkers that can be used to understand the pathogenesis of various diseases and for non-invasive diagnoses. A large amount of data has been obtained from proteomics, with a deeper understanding of the pathophysiology of renal allograft rejection.
In recent years, many researchers have uploaded experimental data to public databases for validation or further use by other scientific researchers. Therefore, public databases have become an advantageous resource in disease research, especially for the discovery and verification of biomarkers. They have saved valuable time and resources for subsequent researchers. There are already some good examples showing that mining public databases is an effective and practical method for optimizing studies (4).
In this study, we acquired differentially expressed proteins (DEPs) in urine and blood samples from proteomic studies related to acute renal allograft rejection. Gene ontology (GO) and pathway analysis of the DEPs revealed that some biological processes were associated with the immune system and probably played important roles in acute allograft rejection. We then used public datasets to identify potential biomarkers for the diagnosis of AR and non-rejection groups. For further validation, we performed RNA sequencing of peripheral blood mononuclear cells (PBMCs) of patients with AR and in the non-rejection groups. The results showed that immunoglobulin κ constant (IGKC) region and immunoglobulin heavy constant alpha 1 (IGHA1) had good performance in distinguishing AR from non-rejection. The insights of this study may help deepen the understanding of the mechanism of acute allograft rejection and identify potential biomarkers for further characterization.
We included 12 proteomic studies related to renal allograft rejection from 2011 to 2021, including six used urine samples and six used blood samples (Table 1). For further analysis, we integrated the results to identify DEPs between renal allograft rejection and non-rejection.
Robust DAVID tools1 were applied to GO analysis and pathway analysis, which supply a significant set of functional annotations to investigators to better understand the biological significance of DEPs. The GO terms included cellular component (CC), molecular function (MF), and biological process (BP). Significant pathways and GO items were defined for an adjusted p-value of < 0.05.
Nephroseq2 is a robust database that integrates many publicly available kidney gene expression profiles. It provides researchers with gene expression data for data mining and visualization. Additionally, it uses different expression data for meta-analysis, a function that has been widely used in recent years (5). Hence, we uploaded the DEPs to Nephroseq for meta-analysis to reduce the inspection scale and discover potential biomarkers for acute renal allograft rejection. The search parameters were set as follows: p-value, 0.05; fold change, 1.5; and group, acute rejection. We then downloaded the search results for further analysis.
Human microarray data were downloaded from the GEO database.3 Normalized bulk RNA-Seq expression data (FPKM) were used to calculate the expression of candidate biomarkers in human samples. Among different samples, the receiver operating characteristic (ROC) curve was applied to evaluate the performance of biomarkers in distinguishing AR from non-rejection groups.
Thirty-five ESRD patients who underwent kidney transplantation at the Kidney Disease Center of the First Affiliated Hospital of Zhejiang University were included. Patient demographics are shown in Table 2. PBMCs were isolated from the blood of 16 patients with biopsy-proven AR and 19 patients without rejection. For RNA sequencing, approximately 3 ml of peripheral blood was stored at –80°C. We used Trizol Reagent (Invitrogen) to extract total RNA (1,000 ng) and then used the NanoDrop 2000 spectrophotometer (Thermo Fisher Scientific, Waltham, MA) to measure the quantity and quality of the total RNA. Agilent 2100 Bioanalyzer (Agilent Technologies Inc., Santa Clara, CA, United States) was used to measure RNA integrity. The mRNA sequencing and raw RNA-seq data were processed as previously described. FPKM was used to calculate the expression of the candidate biomarkers in the PBMCs of the patients, and ROC analysis was applied to evaluate the performance of biomarkers in distinguishing AR from non-rejection groups among different samples. This study was approved by the Institutional Review Board of Zhejiang University School of Medicine. The patients provided written informed consent to participate in the study.
After integrating the reported DEPs between AR and non-rejection samples, 158 DEPs and 119 DEPs were identified from the blood and urine samples, respectively. A total of 25 DEPs overlapped between the two groups (Table 3). To identify the important DEPs more accurately, we excluded proteins with high intensity in blood and urine samples, including albumin, transferrin, alpha-1 acid glycoprotein, complement, immunoglobulin, fibrinogen, ceruloplasmin, alpha-2-macroglobulin, alpha-1-antitrypsin, apolipoprotein, plasminogen, haptoglobin, and prealbumin. Finally, the 25 DEPs that overlapped between the blood and urine samples were identified by proteomic analysis. We thought that these 25 DEPs had significant implications in renal allograft rejection, and they were further analyzed.
DEPs from urine and blood samples were further analyzed using DAVID tools. As shown in Figure 1, GO terms, including BP (Figures 1A–C), MF (Figures 1D–F), and CC (Figures 1G–I) were analyzed in detail. Several important BP items were enriched in urinary DEPs, including positive regulation of B-cell activation, phagocytosis, the B-cell receptor signaling pathway, regulation of immune response, and platelet degranulation. Similarly, some important BP items were enriched in blood samples, including platelet degranulation, acute-phase response, innate immune response, complement activation, phagocytosis, and the B cell receptor signaling pathway. The overlapping DEPs also showed many important BP items, including platelet degranulation, innate immune response, phagocytosis, and blood coagulation. In summary, most GO items were involved in the immune system and blood coagulation, suggesting that they probably play an important role in the process of acute allograft rejection.
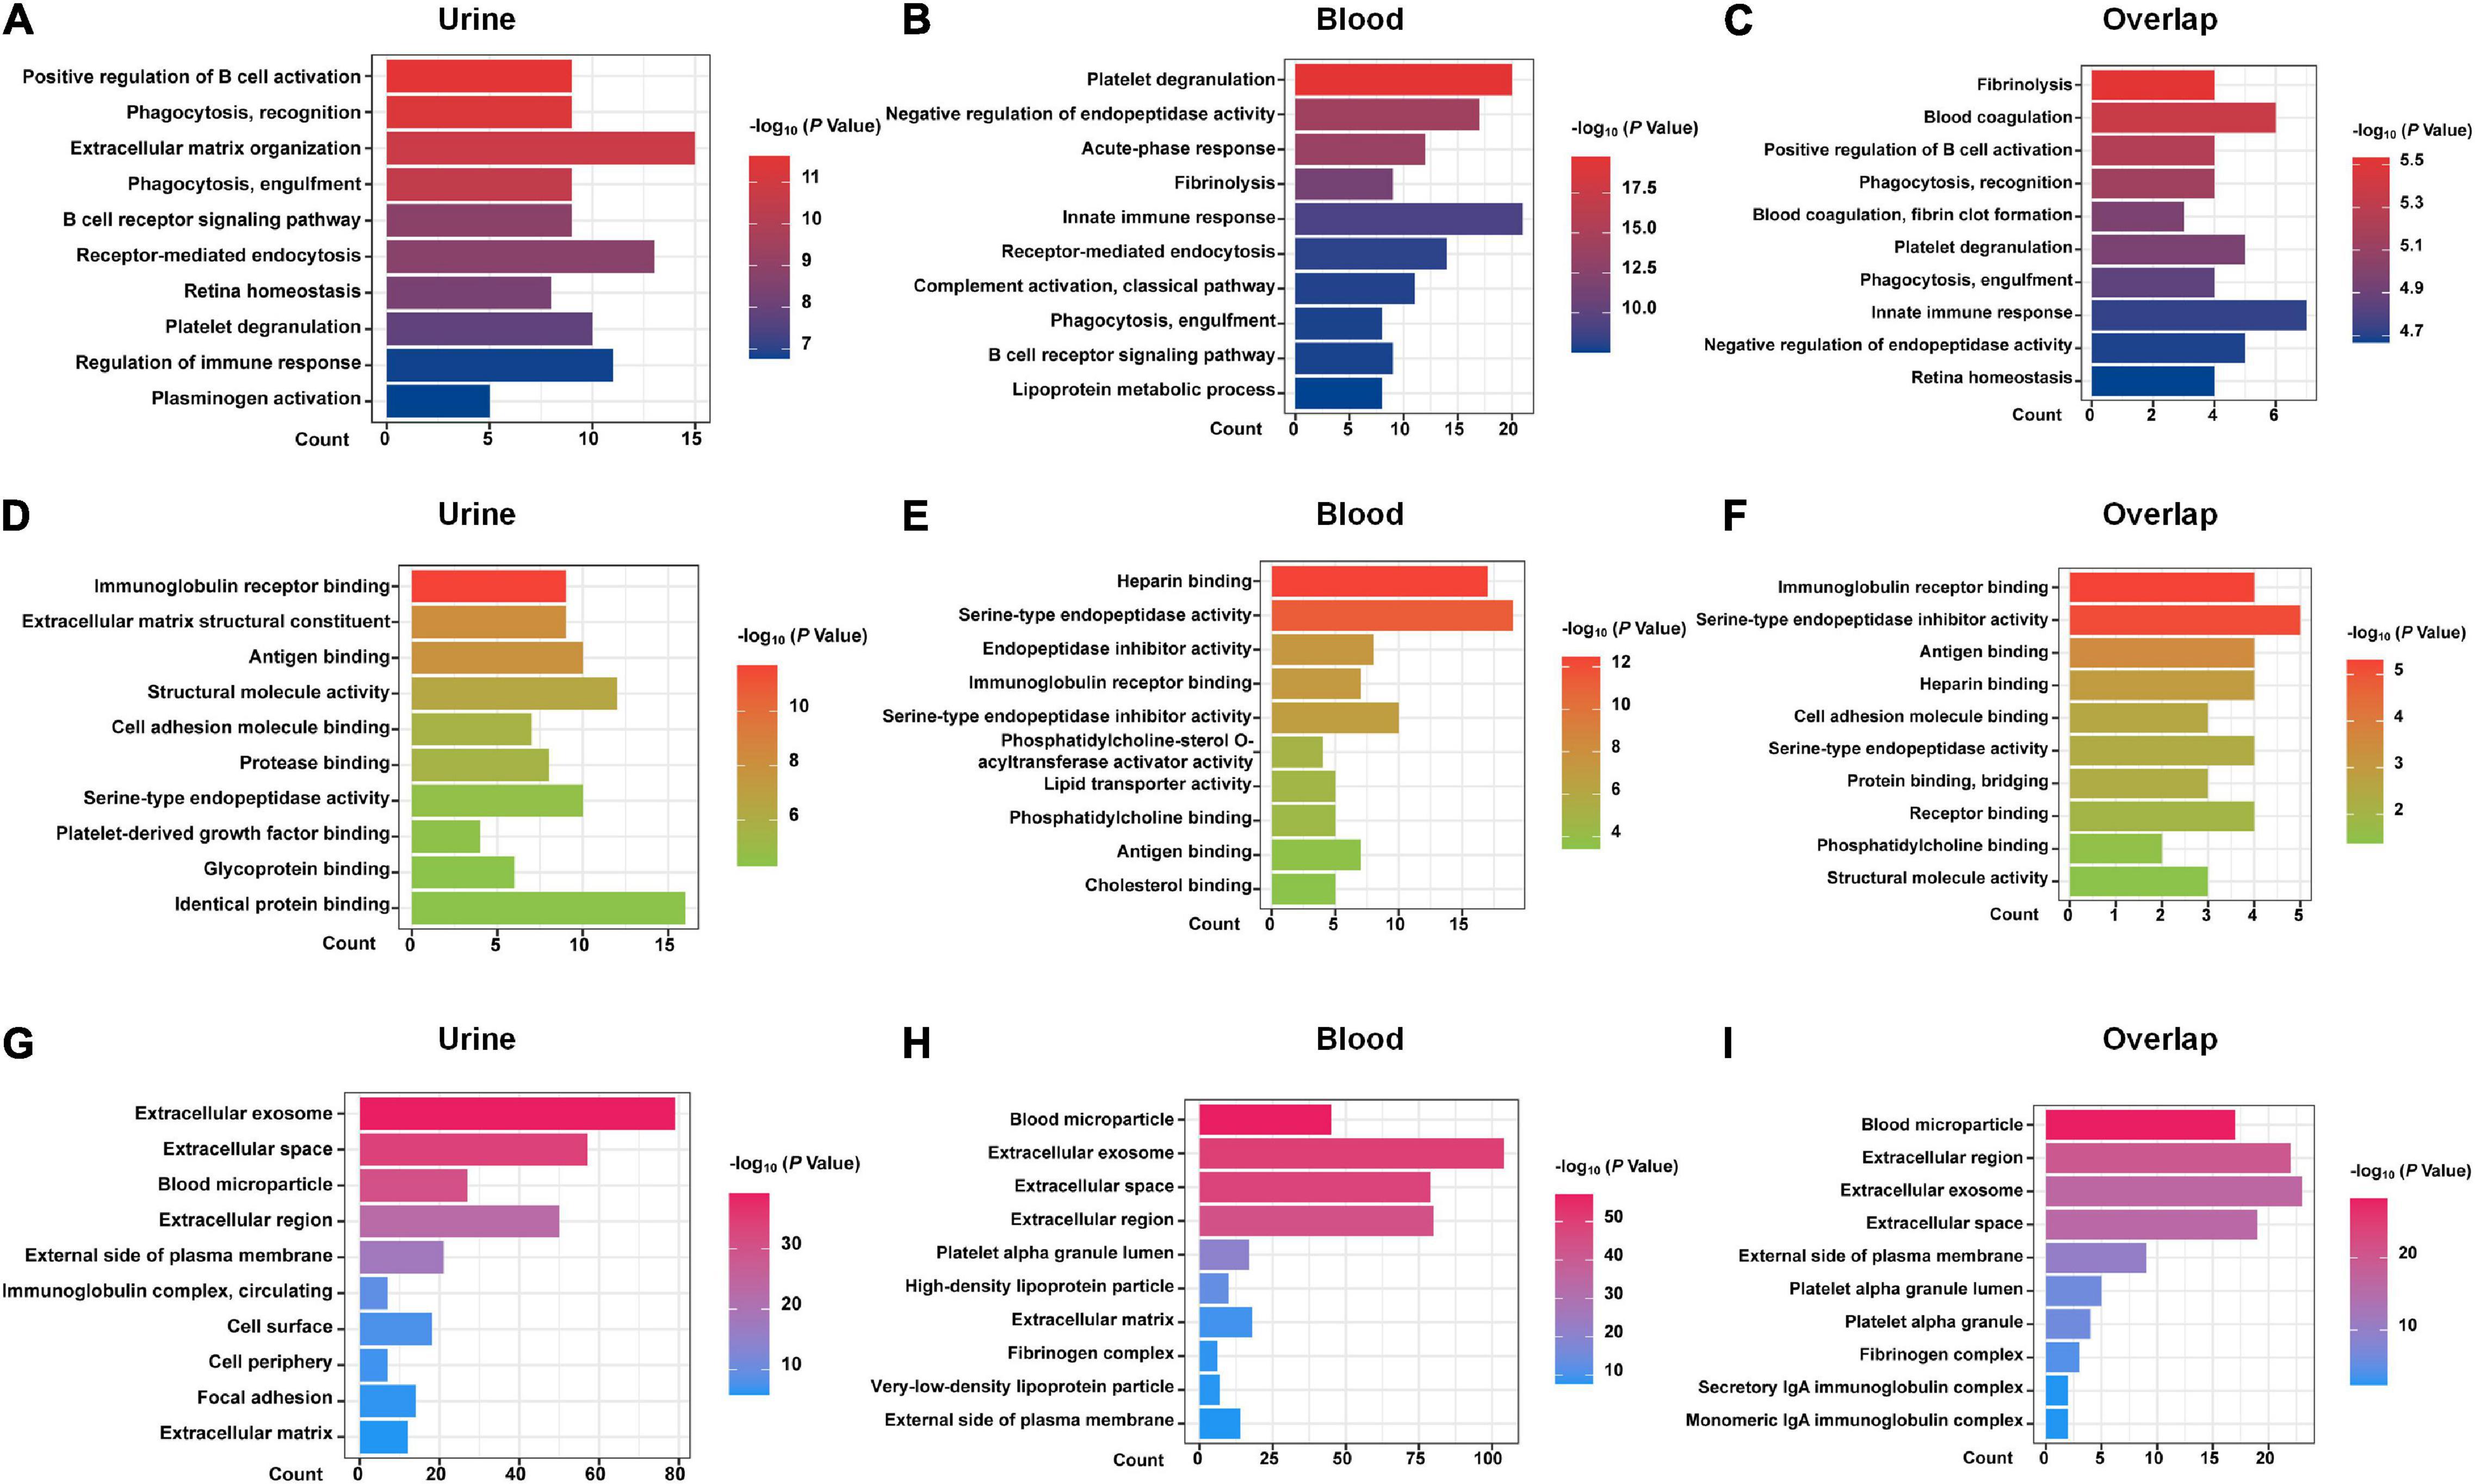
Figure 1. GO analysis with DAVID. GO analysis of the DEPs of urine samples, blood samples, and 25 shared DEPs based on proteomics studies are shown. (A–C) biological process (BP) items. (D–F) molecular function (MF) items. (G–I) cellular component (CC) items.
As shown in Figure 2A, the pathway analysis of the DEPs detected from blood samples was not well enriched, and only two items were identified, including complement and coagulation cascades and Staphylococcus aureus infection. We found that the complement and coagulation cascade pathways were enriched both in the DEPs of urine samples and blood samples, as well as in the overlapped DEPs, suggesting that this pathway probably played an important role in the occurrence of acute allograft rejection.
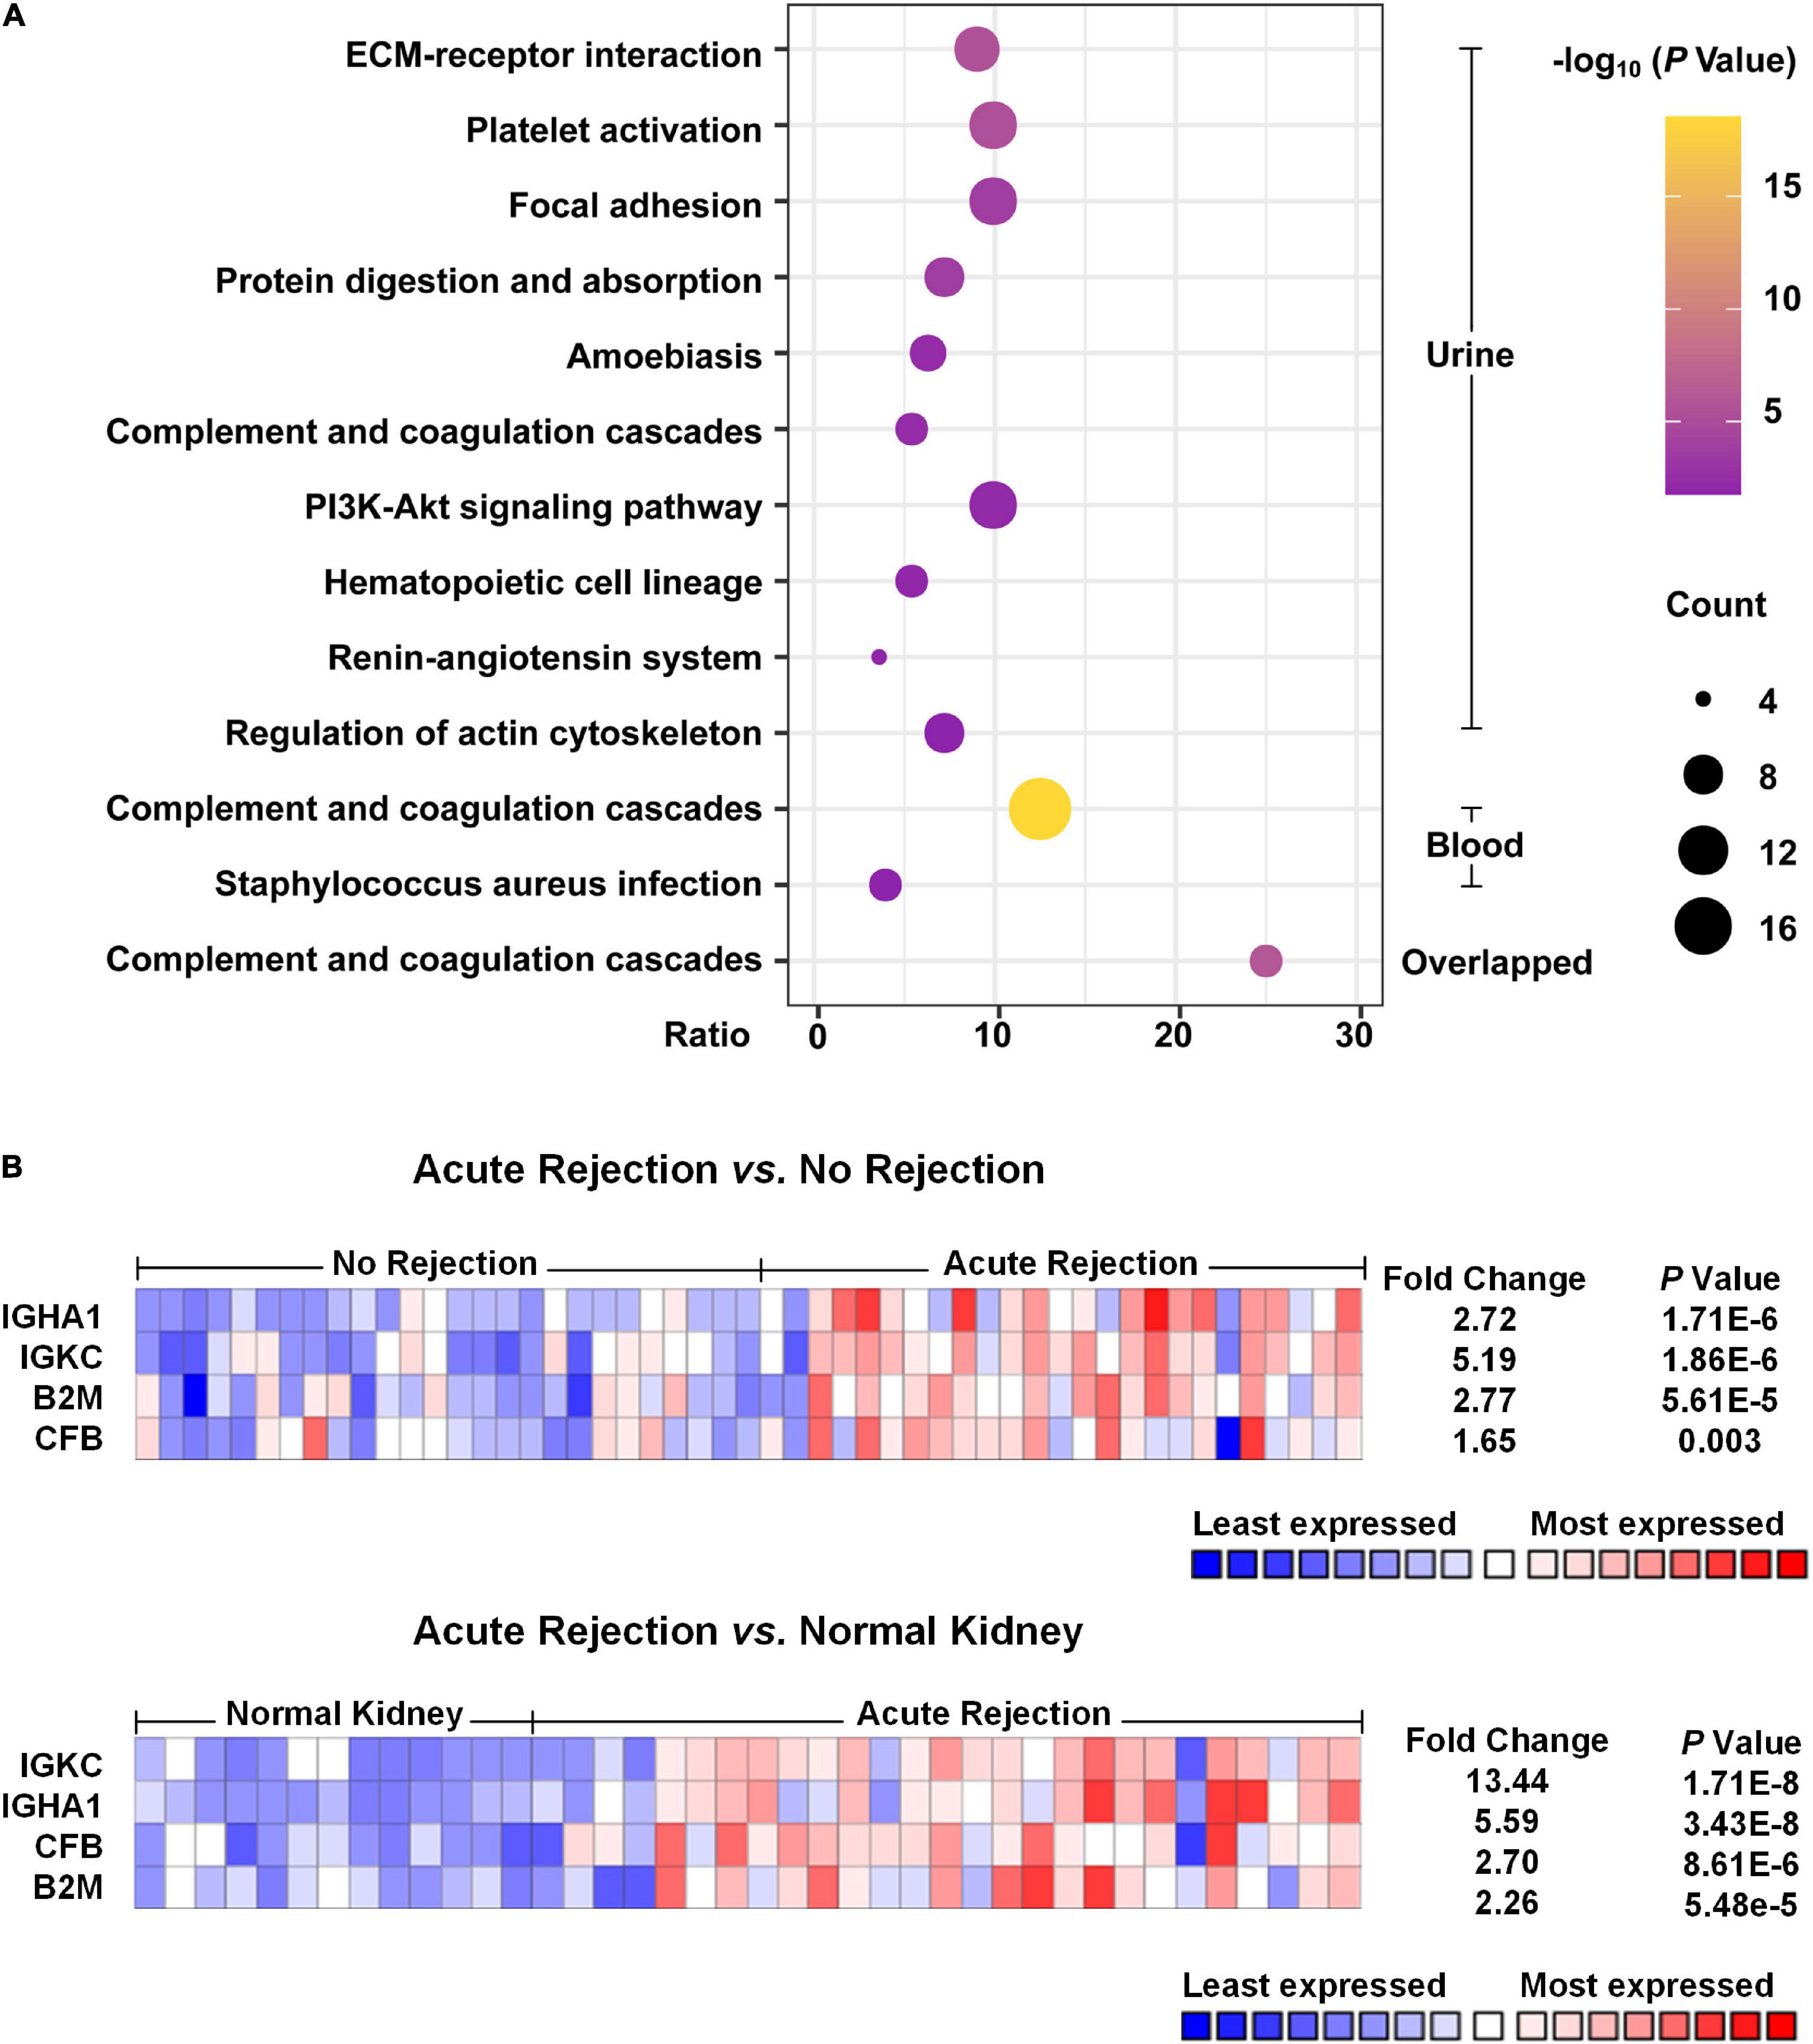
Figure 2. Pathway enrichment analysis and Nephroseq usage. (A) Pathway enrichment analysis of the DEPs was performed with DAVID. The top 10 pathways of urinary DEPs are shown. As for analysis of the DEPs from blood samples, only two pathways were identified with an adjusted p-value < 0.05. (B) Heat map of the expression of potential biomarkers based on Nephroseq. Compared with non-rejection and normal kidney tissue groups, acute rejection showed that IGKC, IGHA1, B2M and CFB were significantly different with a p-value < 0.05 and fold change > 1.5.
According to the meta-analysis of Nephroseq, 25 DEPs were uploaded to the website to determine whether they were differentially expressed in patients with AR. As shown in Figure 2B, beta-2-microglobulin (B2M), complement factor B (CFB), IGHA1, and IGKC showed significant differences between patients with AR and non-rejection patients based on the Sarwal Transplant Kidney Dataset (6) with a p-value < 0.05 and a fold change > 1.5. Similar results were also observed in patients with AR and with normal kidney tissues. Since IGHA1, IGKC, B2M, and CFB play important roles in the immune system, we further validated the four biomarkers in other public datasets. As shown in Table 4, we examined four publicly available transcriptome datasets (GSE14328, GSE21374, GSE48581, and GSE147089) to test the performance of these four biomarkers in distinguishing AR from non-rejection groups (7–10). As depicted in Figure 3, the four biomarkers showed relatively good performance (most AUC areas were larger than 0.7), suggesting their potential as efficient biomarkers. We also described the expression levels of the four biomarkers in the different datasets using boxplots. As shown in Figure 4, the expression of most biomarkers in the AR group was significantly higher than that in the non-rejection group.
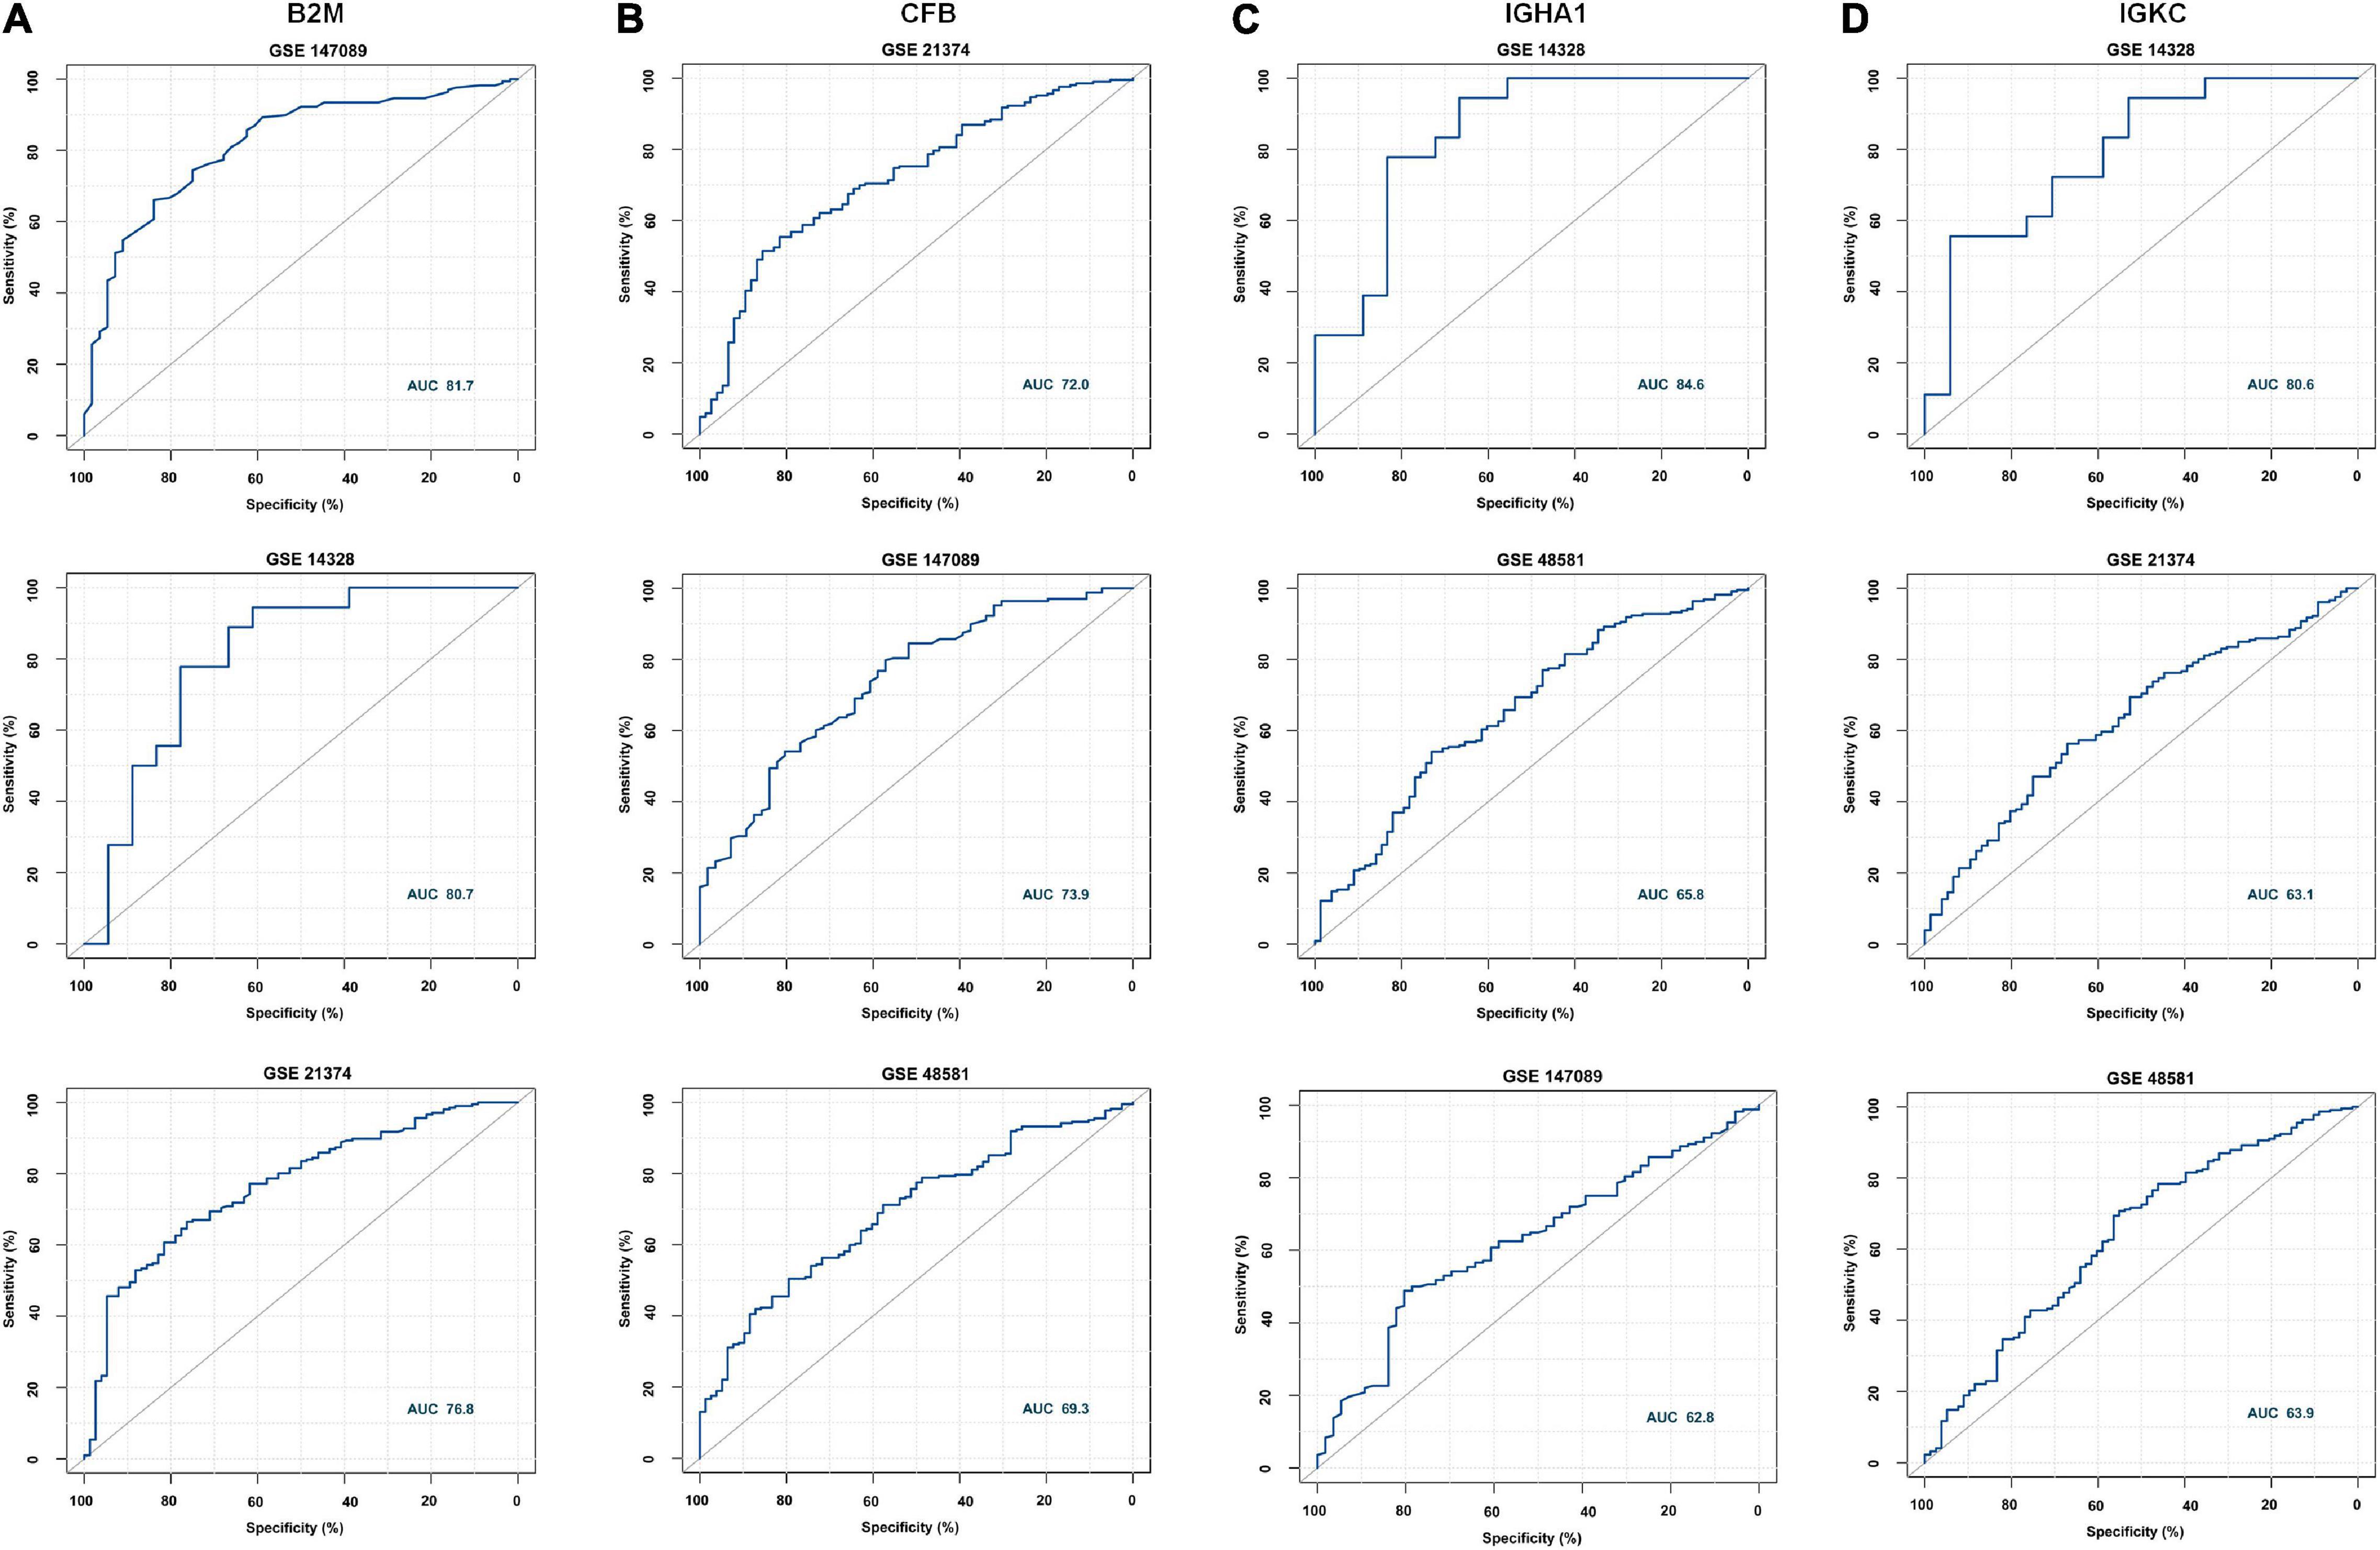
Figure 3. Receiver operating characteristic (ROC) curve of B2M, CFB, IGHA1, and IGKC in different GEO data sets. (A) ROC of B2M in GSE147089, GSE14328, and GSE21374 with AUC values of 81.7, 80.7, and 76.8, respectively. (B) ROC of CFB in GSE21374, GSE147089, and GSE48581 with AUC values of 72, 73.9, and 69.3, respectively. (C) ROC of IGHA1 in GSE14328 and GSE147089 with AUC values of 84.5, 65.8, and 62.8, respectively. (D) ROC of IGKC in GSE14328, GSE21374, and GSE48581 with AUC values of 80.6, 63.1, and 63.9, respectively.
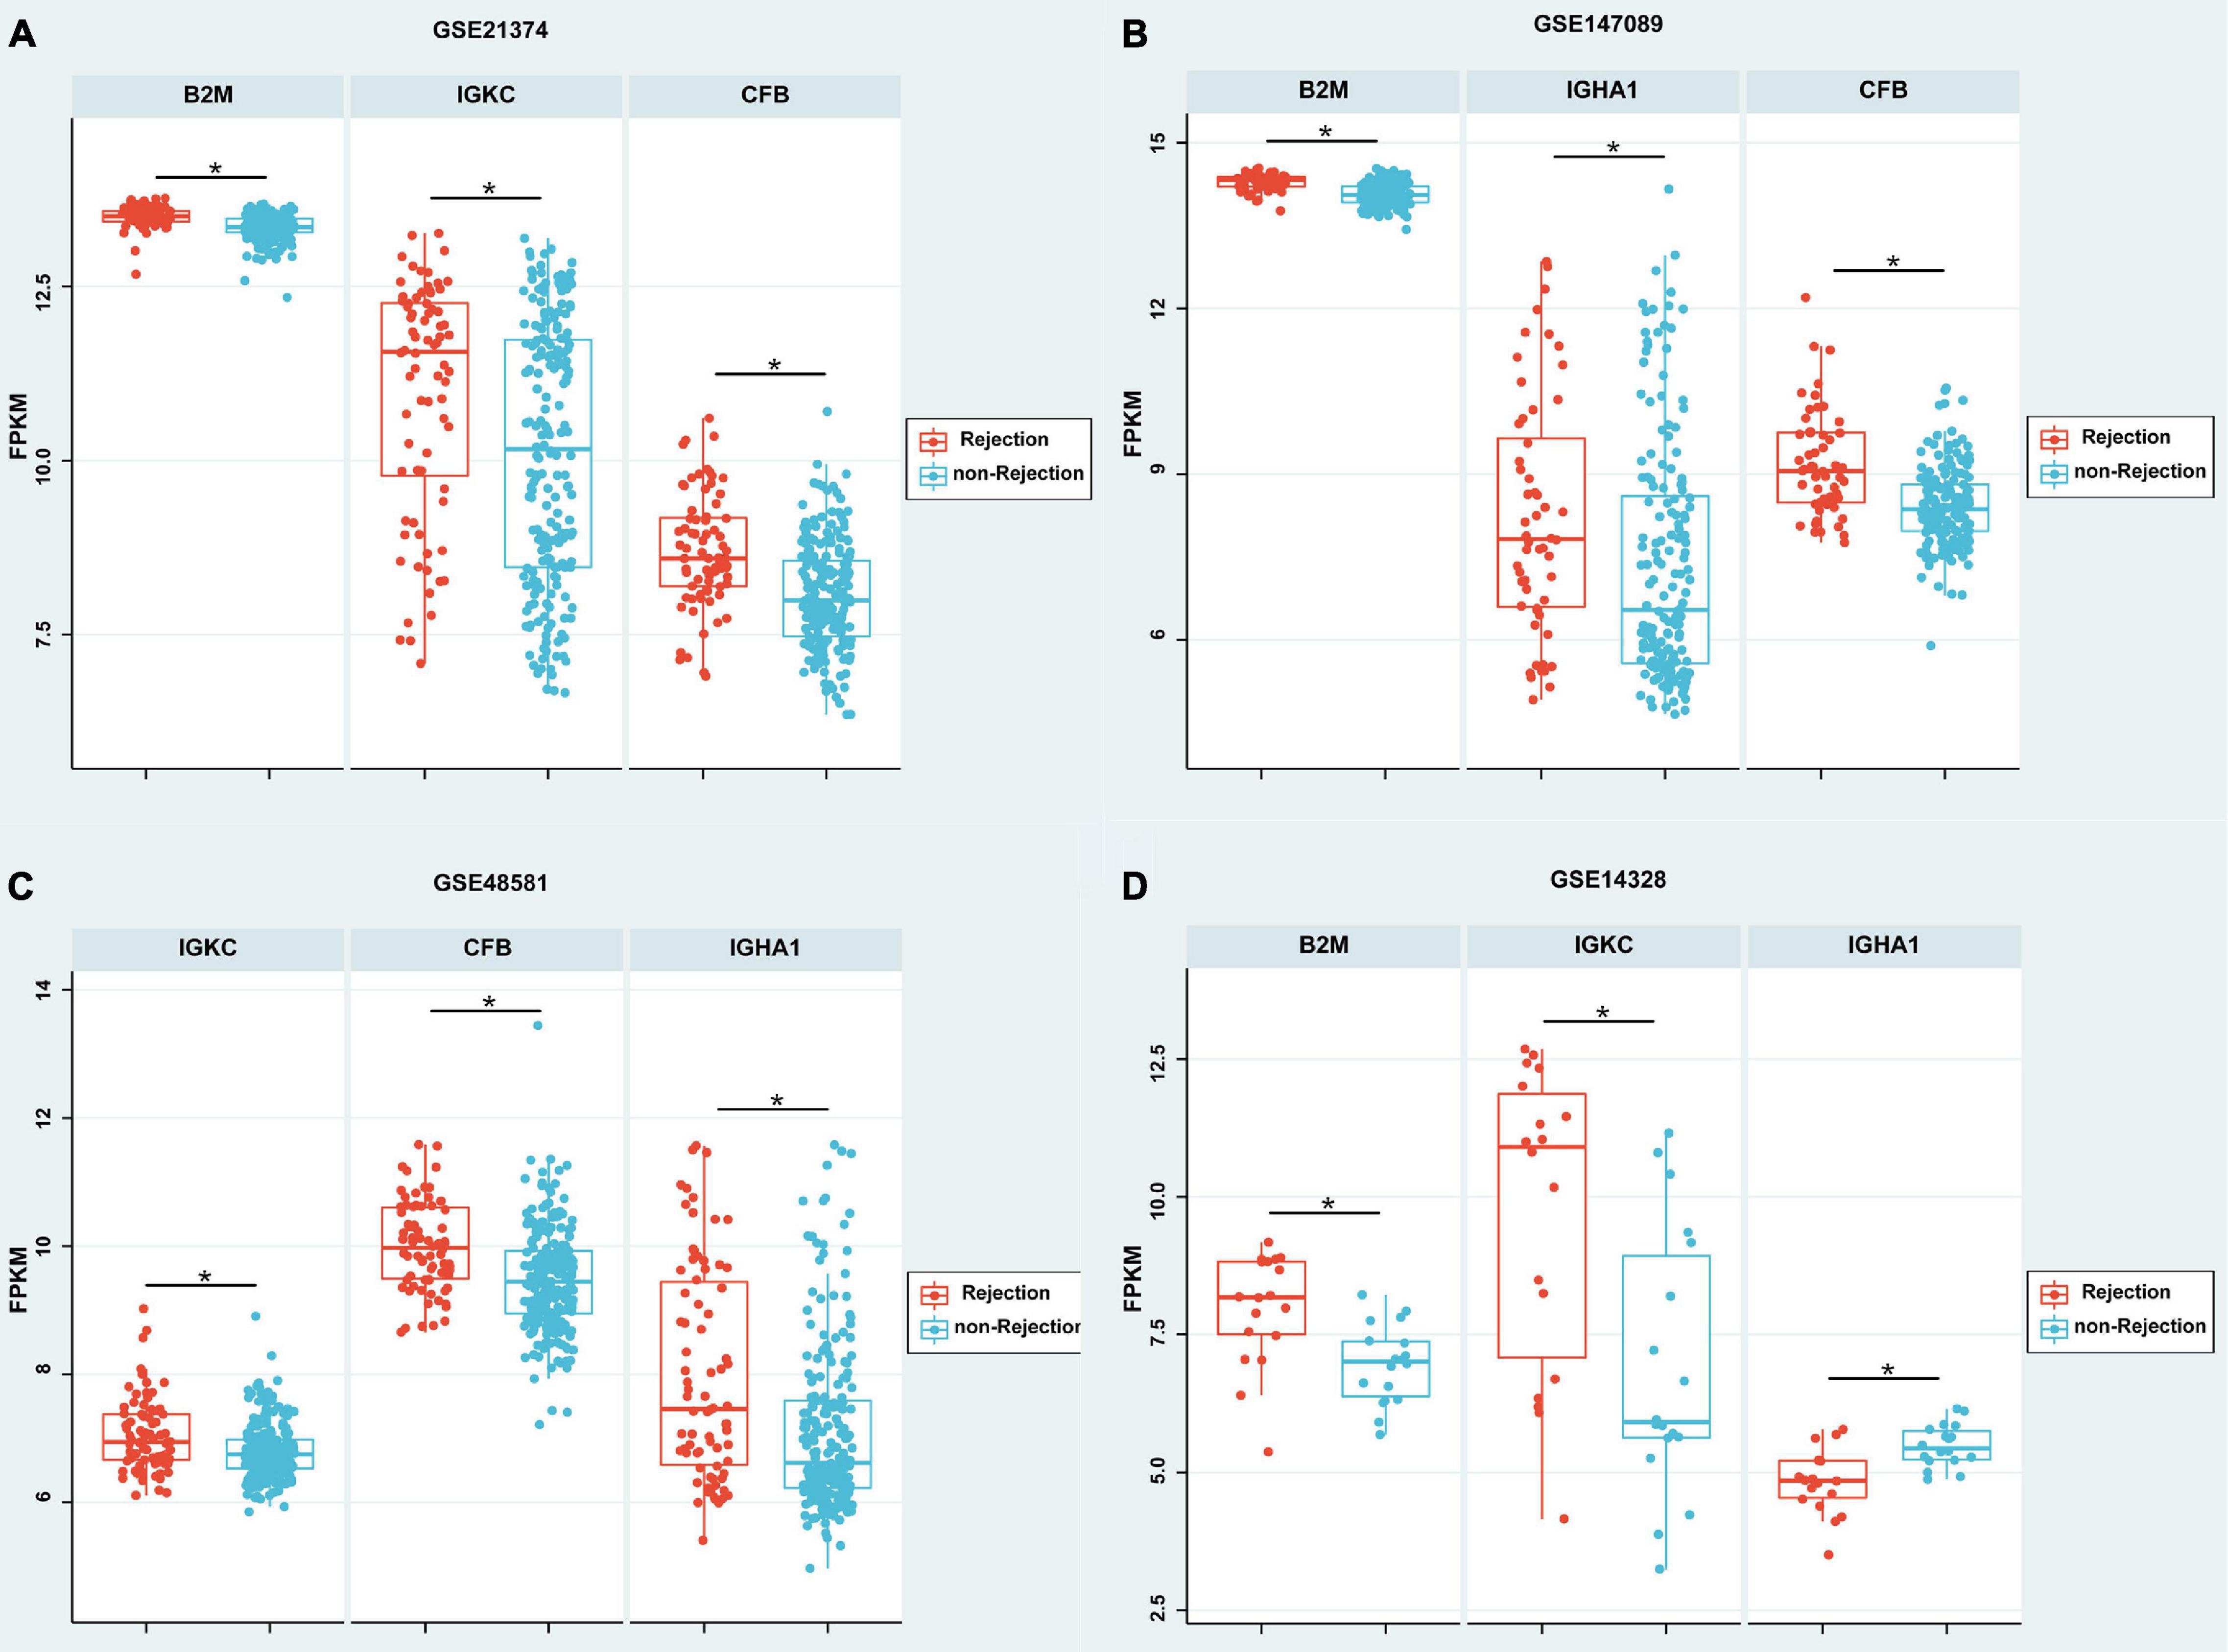
Figure 4. Boxplot of the expressions of B2M, CFB, IGHA1, and IGKC in different GEO data sets. (A–C) According to GSE21374, GSE147089, and GSE48581, the expression of B2M, IGHA1, IGKC, and CFB were significantly higher in the rejection group than in the non-rejection group. (D) According to GSE21374, the expressions of B2M and IGKC were significantly higher; however, IGHA1 was significantly lower in the rejection group than in the non-rejection group. Each point represents a patient. *p < 0.05.
The demographic and clinical characteristics of the patients are presented in Table 2. The donor age and glomerular filtration rate (GFR) were significantly different between AR recipients and non-rejection recipients. There were no statistically significant differences between the two groups in terms of recipient age/sex, donor sex, cold ischemia time, blood urea nitrogen, serum creatinine, 24-h urine protein quantification, and uric acid levels. The four biomarkers were also detected by RNA-Seq, and we then used ROC analysis to evaluate their individual performance in distinguishing AR from the non-rejection group. As shown in Figure 5A, IGHA1 and IGKC showed relatively good performance, with AUCs of 83.6 and 80.2, respectively. Subsequently, we combined the four features, including donor age, GFR, IGHA1, and IGKC, to determine their performance in distinguishing AR from non-rejection. As shown in Figure 5B, the ROC of the four-index combination showed good performance with an ROC AUC of 91.4% (95% CI: 82–100%), suggesting its potential clinical use in monitoring transplant patients.
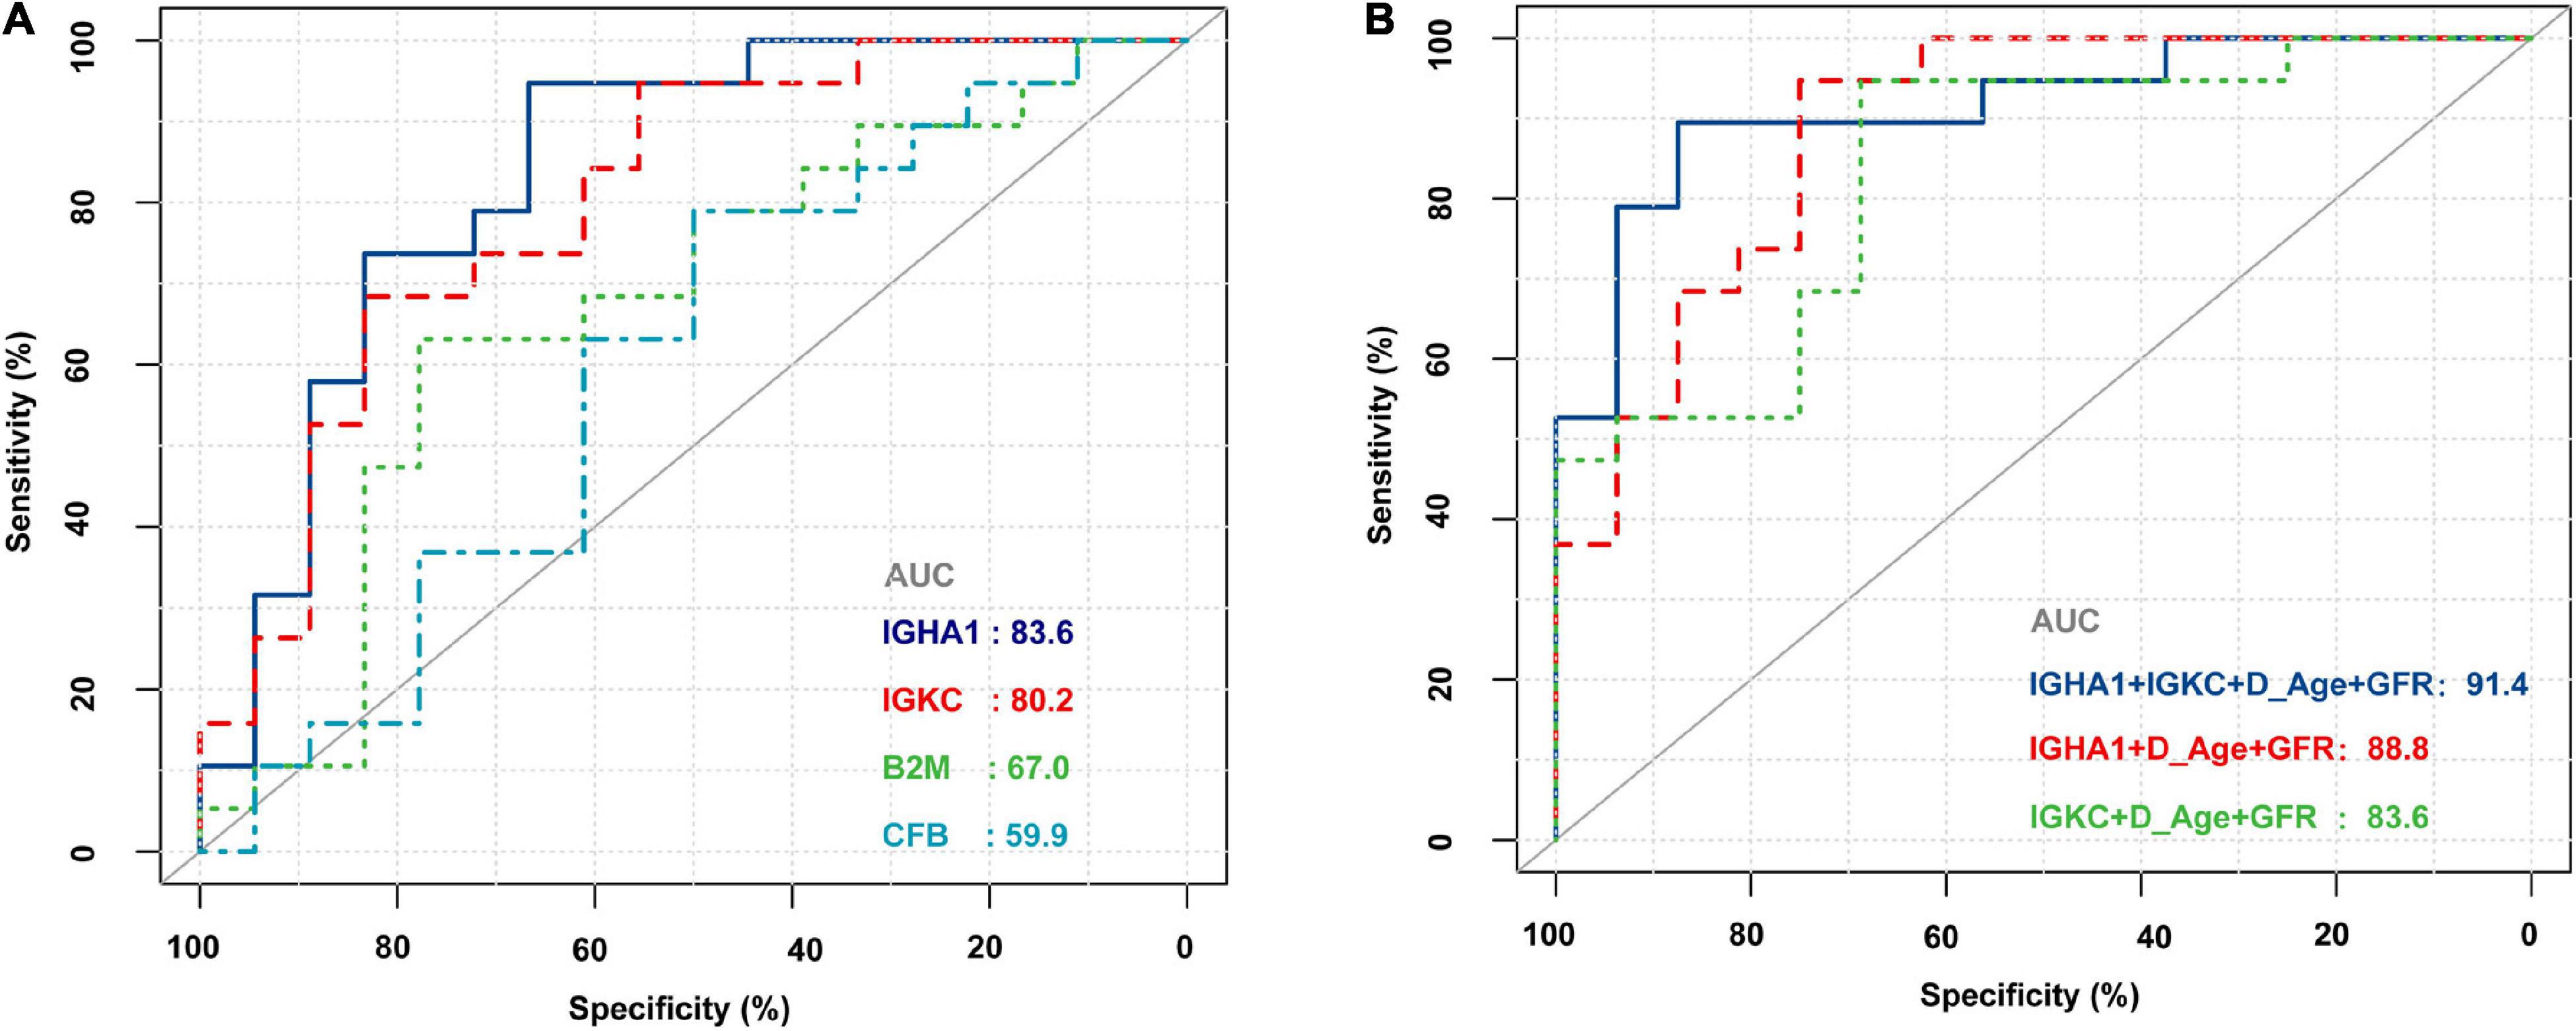
Figure 5. Receiver operating characteristic (ROC) curves of B2M, CFB, IGHA1, and IGKC based on RNA sequencing in PBMCs of renal allograft transplant patients. (A) ROC of B2M, CFB, IGHA1, and IGKC merely based on the expression of RNA-Seq. (B) ROC of different combinations of IGHA1, IGKC, GFR, and donor age. D_Age represents the donor age. IGHA1 + IGKC + D_Age + GFR AUC 91.4% (95% CI: 82–100%). IGHA1 + D_Age + GFR AUC 88.8% (95% CI: 77.8–99.9%). IGKC + D_Age + GFR AUC 83.6% (95% CI: 70.1–97%).
The results are presented as the means ± SD for continuous variables. Categorical variables were expressed in terms of rate (%) or composition ratio (%). For statistical comparisons of the clinical data between two groups, we used unpaired, two-tailed t-tests and chi-squared test. P-values < 0.05 were considered significant. All data were statistically analyzed using SPSS Statistics V20 (IBM Analytics), and statistical charts were created using GraphPad Prism software (version 8.0.1; GraphPad Software, San Diego, CA).
In recent years, the effective use of immunosuppressive drugs has sharply reduced the rate of renal graft rejection; however, AR still occurs in approximately 10–20% of total reported cases. It has been reported that every episode of rejection is closely associated with a poor graft survival rate, even after immunosuppressive treatment (11, 12). Therefore, it is necessary to further understand acute renal allograft rejection. Traditional non-invasive graft functional parameters for monitoring rejection, include glomerular filtration rate, serum creatinine levels, measurement of donor-specific human leukocyte antigen antibodies, proteinuria, lack sensitivity and specificity. Unmet clinical needs include non-invasive biomarkers with excellent sensitivity and specificity for kidney allograft rejection processes (13).
In the past decade, proteomics has been widely used in scientific research, especially for the discovery of effective biomarkers for various diseases. Many biomarkers detected by proteomic methods have shown good accuracy and sensitivity in the diagnosis of various types of rejection (14–16); however, there are some prominent flaws that limit their application. The results of proteomic studies often show significant differences among different researchers, laboratories, and methodologies. This condition is also reflected in the present study to some extent (Table 1). Therefore, we sought to identify meaningful proteins by reviewing proteomic studies related to acute allograft rejection, with the aim of reducing the variance among different studies. After excluding proteins with high abundance in body fluid, a total of 25 DEPs were shared between urine and blood samples. DEPs were considered to be potential markers and play an important role in acute allograft rejection.
Through GO and pathway analyses, we found common features shared by urine and blood samples, including B cell activation, phagocytosis, immune response, and platelet degranulation. These biological processes are involved in the immune system and play an important role in acute allograft rejection. It is well known that the immune system is closely related to AR, which can occur any time after allograft transplantation, including antibody-mediated rejection and acute T cell-mediated rejection. Both of these rejections include the detected biological processes. As for pathway analysis, complement and coagulation cascade pathways were found to be enriched in DEPs from urine and blood samples, suggesting that it is a key pathway that mediates the process of acute allograft rejection.
In our analysis, we found four proteins that were significantly increased in the AR groups compared to both non-rejection groups and normal kidney tissues (Figure 2B). To validate their performance in diagnosing AR, we used several GEO datasets published in the public. We found that the expression of B2M, CFB, IGHA1, and IGKC was very similar in different datasets, even though the absolute expression was different.
IGKC is an important component of immunoglobulins, which are involved in innate and adaptive immunity, and is an effective prognostic biomarker for breast cancer and non-small cell lung carcinoma (NSCLC) (17). Schmidt et al. reported that IGKC is a novel diagnostic marker for risk stratification in NSCLC and supported concepts to exploit the humoral immune response for anticancer therapy, which could be validated by transcriptomics and immunostaining at the protein level (17).
IGHA1 is an adaptive immune effector that is a highly abundant circulating protein with relatively stable blood concentrations (18). It was found to be differentially expressed in several diseases, such as chronic kidney disease, glioblastoma, hyperthyroidism, breast cancer, NSCLC, clear cell renal cell carcinoma, and autoimmune disease (18–23). Chitnis et al. reported a novel functional role of the human leukocyte antigen-B (HLA-B) locus, mediated by its intron-encoded miR-6891-5p. They identified a conserved miR-6891-5p target site in both IGHA1 and IGHA2 transcripts, suggesting that this miRNA modulates the expression of IGHA1 and IGHA2 (19). Since allograft rejection is usually associated with HLA, we considered that the role of miR-6891-5p and IGHA1 in allograft rejection mediated by HLA should be investigated further. We noticed that studies related to IGHA1 were based on proteomic methods, such as SWATH mass spectrometry, multiple reaction monitoring mass spectrometry assays, and matrix-assisted laser desorption/ionization time-of-flight mass spectrometry. Interestingly, several studies have reported that a combination of biomarkers, including IGKC and IGHA1, has good prognostic value in clear cell renal cell carcinoma and autoimmune diseases (24, 25). Similarly, our study showed that the combination of biomarkers, including IGKC and IGHA1, had potential prognostic value in acute renal allograft rejection.
As shown in Figure 3, most ROC had an AUC > 0.7. Hence, we hypothesized that these molecules are likely to have the potential to be effective biomarkers. For further validation, we performed RNA-Seq on PBMCs from patients whose clinical features and individual information were relatively abundant. As shown in Table 2, the clinical features of donor age and GFR were significantly different between the AR and non-AR groups. We also examined the performance of B2M, CFB, IGHA1, and IGKC in AR diagnosis using RNA-Seq data. IGHA1, IGKC, and B2M showed relatively good performances, especially for the previous two biomarkers (Figure 5A). Hence, we combined IGHA1, IGKC, clinical features of donor age, and GFR to evaluate their performance in the diagnosis of AR. The ROC of the four-index combination showed good performance with an ROC AUC of 91.4% (95% CI: 82–100%), suggesting its potential for clinical use in monitoring transplant patients, which should be validated further.
Our study had few limitations. First, in the process of identifying DEPs, we were unable to acquire whole raw data from the included studies for reanalysis, and the methods used to define DEPs were different among the studies, which might have influenced the results. Second, the sample size was relatively small, and more studies are needed to validate our findings. Third, recipients usually receive immunosuppressive treatments before transplantation, which may have an unaddressed effect on our results. Therefore, these limitations should be considered when testing the clinical utility of identified biomarkers in blinded prospective studies.
In summary, our study integrated the results of several proteomic studies and utilized public data sources to identify proteins of interest related to acute allograft rejection. Through bioinformatic analysis, we identified some important biological processes and pathways that probably play an important role in AR. Finally, we performed RNA-Seq of PBMCs obtained from patients in our study and found that the combination of IGHA1, IGKC, GFR, and donor age showed good performance with an ROC AUC of 91.4% (95% CI: 82–100%). An in-depth integrated analysis of proteomics and transcriptomic data revealed that IGHA1, IGKC, GFR, and donor age had potential for clinical use in monitoring transplant patients.
The data presented in the study are deposited in the China National Center for Bioinformation repository, accession number OMIX001115 (https://ngdc.cncb.ac.cn/omix/release/OMIX001115).
This study was approved by the Institutional Review Board of the Zhejiang University School of Medicine. The patients/participants provided their written informed consent to participate in this study.
SH participated in the writing of the manuscript, performance of the research, and data analysis. WZ participated during the research with patients. CW participated in data analysis and in the writing of the manuscript. YW contributed in the research design. RS participated in data analysis. HH contributed analytic tools and data analysis. HJ contributed in the research design and in the writing of the manuscript. JC contributed in the research design and in the writing and revision of the manuscript. All authors contributed to the article and approved the submitted version.
This work was supported by the National Natural Science Foundation of China (Grant Nos. 81970651 and U21A20350) and Sino-German Center (Grant No. GZ1572).
The authors declare that the research was conducted in the absence of any commercial or financial relationships that could be construed as a potential conflict of interest.
All claims expressed in this article are solely those of the authors and do not necessarily represent those of their affiliated organizations, or those of the publisher, the editors and the reviewers. Any product that may be evaluated in this article, or claim that may be made by its manufacturer, is not guaranteed or endorsed by the publisher.
We would like to acknowledge the collaboration and commitment of all patients, physicians and nurses from the Kidney Disease Centre of the First Affiliated Hospital of Zhejiang University for Assistance.
1. Wolfe RA, Ashby VB, Milford EL, Ojo AO, Ettenger RE, Agodoa LY, et al. Comparison of mortality in all patients on dialysis, patients on dialysis awaiting transplantation, and recipients of a first cadaveric transplant. N Engl J Med. (1999) 341:1725–30. doi: 10.1056/NEJM199912023412303
2. Nankivell BJ, Chapman JR. Chronic allograft nephropathy: current concepts and future directions. Transplantation. (2006) 81:643–54. doi: 10.1097/01.tp.0000190423.82154.01
3. Yazdani S, Callemeyn J, Gazut S, Lerut E, de Loor H, Wevers M, et al. Natural killer cell infiltration is discriminative for antibody-mediated rejection and predicts outcome after kidney transplantation. Kidney Int. (2019) 95:188–98. doi: 10.1016/j.kint.2018.08.027
4. Aharinejad S, Krenn K, Zuckermann A, Schafer R, Gmeiner M, Thomas A, et al. Serum matrix metalloprotease-1 and vascular endothelial growth factor–a predict cardiac allograft rejection. Am J Transplant. (2009) 9:149–59. doi: 10.1111/j.1600-6143.2008.02470.x
5. Lindenmeyer MT, Alakwaa F, Rose M, Kretzler M. Perspectives in systems nephrology. Cell Tissue Res. (2021) 385:475–88. doi: 10.1007/s00441-021-03470-3
6. Sarwal M, Chua MS, Kambham N, Hsieh SC, Satterwhite T, Masek M, et al. Molecular heterogeneity in acute renal allograft rejection identified by DNA microarray profiling. N Engl J Med. (2003) 349:125–38. doi: 10.1056/NEJMoa035588
7. Callemeyn J, Lerut E, de Loor H, Arijs I, Thaunat O, Koenig A, et al. Transcriptional Changes in Kidney Allografts with Histology of Antibody-Mediated Rejection without Anti-HLA Donor-Specific Antibodies. J Am Soc Nephrol. (2020) 31:2168–83. doi: 10.1681/ASN.2020030306
8. Halloran PF, Pereira AB, Chang J, Matas A, Picton M, De Freitas D, et al. Potential impact of microarray diagnosis of T cell-mediated rejection in kidney transplants: the INTERCOM study. Am J Transplant. (2013) 13:2352–63. doi: 10.1111/ajt.12387
9. Einecke G, Reeve J, Sis B, Mengel M, Hidalgo L, Famulski KS, et al. A molecular classifier for predicting future graft loss in late kidney transplant biopsies. J Clin Invest. (2010) 120:1862–72. doi: 10.1172/JCI41789
10. Chen R, Sigdel TK, Li L, Kambham N, Dudley JT, Hsieh SC, et al. Differentially expressed RNA from public microarray data identifies serum protein biomarkers for cross-organ transplant rejection and other conditions. PLoS Comput Biol. (2010) 6:1000940. doi: 10.1371/journal.pcbi.1000940
11. Nankivell BJ, Borrows RJ, Fung CL, O’Connell PJ, Allen RD, Chapman JR. Natural history, risk factors, and impact of subclinical rejection in kidney transplantation. Transplantation. (2004) 78:242–9. doi: 10.1097/01.tp.0000128167.60172.cc
12. Kurtkoti J, Sakhuja V, Sud K, Minz M, Nada R, Kohli HS, et al. The utility of 1- and 3-month protocol biopsies on renal allograft function: a randomized controlled study. Am J Transplant. (2008) 8:317–23. doi: 10.1111/j.1600-6143.2007.02049.x
13. Mertens I, Willems H, Van Loon E, Schildermans K, Boonen K, Baggerman G, et al. Urinary Protein Biomarker Panel for the Diagnosis of Antibody-Mediated Rejection in Kidney Transplant Recipients. Kidney Int Rep. (2020) 5:1448–58. doi: 10.1016/j.ekir.2020.06.018
14. Sigdel TK, Gao Y, He J, Wang A, Nicora CD, Fillmore TL, et al. Mining the human urine proteome for monitoring renal transplant injury. Kidney Int. (2016) 89:1244–52. doi: 10.1016/j.kint.2015.12.049
15. Van Loon E, Gazut S, Yazdani S, Lerut E, de Loor H, Coemans M, et al. Development and validation of a peripheral blood mRNA assay for the assessment of antibody-mediated kidney allograft rejection: a multicentre, prospective study. EBioMedicine. (2019) 46:463–72. doi: 10.1016/j.ebiom.2019.07.028
16. Oellerich M, Sherwood K, Keown P, Schutz E, Beck J, Stegbauer J, et al. Liquid biopsies: donor-derived cell-free DNA for the detection of kidney allograft injury. Nat Rev Nephrol. (2021) 17:591–603. doi: 10.1038/s41581-021-00428-0
17. Schmidt M, Hellwig B, Hammad S, Othman A, Lohr M, Chen Z, et al. A comprehensive analysis of human gene expression profiles identifies stromal immunoglobulin kappa C as a compatible prognostic marker in human solid tumors. Clin Cancer Res. (2012) 18:2695–703. doi: 10.1158/1078-0432.CCR-11-2210
18. Vidova V, Stuchlikova E, Vrbova M, Almasi M, Klanova J, Thon V, et al. Multiplex Assay for Quantification of Acute Phase Proteins and Immunoglobulin A in Dried Blood Spots. J Proteome Res. (2019) 18:380–91. doi: 10.1021/acs.jproteome.8b00657
19. Chitnis N, Clark PM, Kamoun M, Stolle C, Brad Johnson F, Monos DS. An Expanded Role for HLA Genes: HLA-B Encodes a microRNA that Regulates IgA and Other Immune Response Transcripts. Front Immunol. (2017) 8:583. doi: 10.3389/fimmu.2017.00583
20. Makridakis M, Kontostathi G, Petra E, Stroggilos R, Lygirou V, Filip S, et al. Multiplexed MRM-based protein quantification of putative prognostic biomarkers for chronic kidney disease progression in plasma. Sci Rep. (2020) 10:4815. doi: 10.1038/s41598-020-61496-z
21. Hsu HM, Chu CM, Chang YJ, Yu JC, Chen CT, Jian CE, et al. Six novel immunoglobulin genes as biomarkers for better prognosis in triple-negative breast cancer by gene co-expression network analysis. Sci Rep. (2019) 9:4484. doi: 10.1038/s41598-019-40826-w
22. Masood A, Benabdelkamel H, Ekhzaimy AA, Alfadda AA. Plasma-based proteomics profiling of patients with hyperthyroidism after antithyroid treatment. Molecules. (2020) 25:25122831. doi: 10.3390/molecules25122831
23. Miyauchi E, Furuta T, Ohtsuki S, Tachikawa M, Uchida Y, Sabit H, et al. Identification of blood biomarkers in glioblastoma by SWATH mass spectrometry and quantitative targeted absolute proteomics. PLoS One. (2018) 13:e0193799. doi: 10.1371/journal.pone.0193799
24. Streicher K, Morehouse CA, Groves CJ, Rajan B, Pilataxi F, Lehmann KP, et al. The plasma cell signature in autoimmune disease. Arthritis Rheumatol. (2014) 66:173–84. doi: 10.1002/art.38194
Keywords: biomarkers, renal allograft rejection, proteomics studies, gene expression omnibus datasets, RNA sequencing
Citation: Han S, Zhao W, Wang C, Wang Y, Song R, Haller H, Jiang H and Chen J (2022) Preliminary Investigation of the Biomarkers of Acute Renal Transplant Rejection Using Integrated Proteomics Studies, Gene Expression Omnibus Datasets, and RNA Sequencing. Front. Med. 9:905464. doi: 10.3389/fmed.2022.905464
Received: 27 March 2022; Accepted: 11 April 2022;
Published: 12 May 2022.
Edited by:
Xu-jie Zhou, Peking University First Hospital, ChinaReviewed by:
Guochun Chen, Central South University, ChinaCopyright © 2022 Han, Zhao, Wang, Wang, Song, Haller, Jiang and Chen. This is an open-access article distributed under the terms of the Creative Commons Attribution License (CC BY). The use, distribution or reproduction in other forums is permitted, provided the original author(s) and the copyright owner(s) are credited and that the original publication in this journal is cited, in accordance with accepted academic practice. No use, distribution or reproduction is permitted which does not comply with these terms.
*Correspondence: Hong Jiang, amlhbmdob25nOTYxMTA2QHpqdS5lZHUuY24=; Jianghua Chen, Y2hlbmppYW5naHVhQHpqdS5lZHUuY24=
Disclaimer: All claims expressed in this article are solely those of the authors and do not necessarily represent those of their affiliated organizations, or those of the publisher, the editors and the reviewers. Any product that may be evaluated in this article or claim that may be made by its manufacturer is not guaranteed or endorsed by the publisher.
Research integrity at Frontiers

Learn more about the work of our research integrity team to safeguard the quality of each article we publish.