
94% of researchers rate our articles as excellent or good
Learn more about the work of our research integrity team to safeguard the quality of each article we publish.
Find out more
ORIGINAL RESEARCH article
Front. Med. , 17 June 2022
Sec. Intensive Care Medicine and Anesthesiology
Volume 9 - 2022 | https://doi.org/10.3389/fmed.2022.881267
This article is part of the Research Topic Perioperative Hemodynamic Monitoring and Management View all 10 articles
 Sunthiti Morakul1
 Naruemol Prachanpanich1Pattarada Permsakmesub1Pimwatana Pinsem1
 Wasineenart Mongkolpun2*†
 Konlawij Trongtrakul3*†
Introduction: Excessive or inadequate fluid administration during perioperative period affects outcomes. Adjustment of volume expansion (VE) by performing fluid responsiveness (FR) test plays an important role in optimizing fluid infusion. Since changes in stroke volume (SV) during lung recruitment maneuver (LRM) can predict FR, and peripheral perfusion index (PI) is related to SV; therefore, we hypothesized that the changes in PI during LRM (ΔPILRM) could predict FR during perioperative period.
Methods: Patients who were scheduled for elective non-laparoscopic surgery under general anesthesia with a mechanical ventilator and who required VE (250 mL of crystalloid solution infusion over 10 min) were included. Before VE, LRM was performed by a continuous positive airway pressure of 30 cm H2O for 30 sec; hemodynamic variables with their changes (PI, obtained by pulse oximetry; and ΔPILRM, calculated by using [(PI before LRM—PI after LRM)/PI before LRM]*100) were obtained before and after LRM. After SV (measured by esophageal doppler) and PI had returned to the baseline values, VE was infused, and the values of these variables were recorded again, before and after VE. Fluid responders (Fluid-Res) were defined by an increase in SV ≥10% after VE. Receiver operating characteristic curves of the baseline values and ΔPILRM were constructed and reported as areas under the curve (AUC) with 95% confidence intervals, to predict FR.
Results: Of 32 mechanically ventilated adult patients included, 13 (41%) were in the Fluid-Res group. Before VE and LRM, there were no differences in the mean arterial pressure (MAP), heart rate, SV, and PI between patients in the Fluid-Res and fluid non-responders (Fluid-NonRes) groups. After LRM, SV, MAP, and, PI decreased in both groups, ΔPILRM was greater in the Fluid-Res group than in Fluid-NonRes group (55.2 ± 17.8% vs. 35.3 ± 17.3%, p < 0.001, respectively). After VE, only SV and cardiac index increased in the Fluid-Res group. ΔPILRM had the highest AUC [0.81 (0.66–0.97)] to predict FR with a cut-off value of 40% (sensitivity 92.3%, specificity 73.7%).
Conclusions: ΔPILRM can be applied to predict FR in mechanical ventilated patients during the perioperative period.
Perioperative fluid administration has a crucial role during perioperative management. Both excessive (1–3) and insufficient fluid infusion (4, 5) are related to poor outcomes including the development of organ dysfunction or death in patients undergoing abdominal surgery. The benefit of hemodynamic parameters such as cardiac output (CO) or stroke volume (SV)-guided fluid infusion on mortality or postoperative complication such as surgical site infection, acute kidney injury, has been demonstrated in recent meta-analyses (6, 7). However, this benefit seems to be limited in high-risk surgical patients (8, 9). Nevertheless, in the FEDORA trial (10), the advantage of CO-guided volume expansion (VE) or vasopressor titration on the development of acute kidney injury or pulmonary edema during post operative period in low-to-moderate-risk surgical patients undergoing major abdominal surgery has been demonstrated.
Dynamic parameters such as pulse pressure variation (PPV) or stroke volume variation (SVV) predict fluid responsiveness better than static parameters such as mean arterial pressure (MAP) or central venous pressure (CVP) (11–13). Nevertheless, the abilities of PPV or SVV to predict fluid responsiveness in patients with either open abdominal wall (14), abdominal hypertension (15), or in surgical patients during general anesthesia (16) are limited. Cannesson et al. (16) demonstrated inconclusive evidence of the ability of PPV to detect fluid responsiveness in ~25% of patients during general anesthesia. However, to measure the dynamic change of PPV and SVV during a transient increase in the intrathoracic pressure lung recruitment maneuver (LRM) (17, 18) or tidal volume challenge (19–21) improved the accuracy of PPV or SVV to predict fluid responsiveness. Nevertheless, PPV or SVV require arterial catheter insertion with its inherent risk (22); therefore, a non-invasive measure such as pleth variation index (PVI) using pulse oximetry might be an alternative measurement (23–25).
Peripheral perfusion index (PI), which shows the ratio between pulsatile and non-pulsatile portions, is obtained using pulse oximetry, similar to PVI, which is a measure of the dynamic changes in PI that occur during one or more complete respiratory cycles. PI depends on SV, CO, and peripheral vascular tone (26, 27). Therefore, PI can be used to track changes in the systemic hemodynamic parameters (28). However, studies reporting changes in PI during LRM in surgical patients are limited. Therefore, in this study, we hypothesized that PI would be reduced during LRM and this change might predict fluid responsiveness in surgical patients.
This prospective diagnostic study was conducted in operating rooms at the Faculty of Medicine, Ramathibodi Hospital, Bangkok, Thailand, from November 2020 to April 2021. The study protocol was approved by the local ethical committee (approval number COA. MURA2020/1844). The informed consent was obtained from each patient on the day before surgery. Patients were included if they were aged ≥18 years, were scheduled for elective non-laparoscopic surgery under general anesthesia with a controlled mechanical ventilation, and required their first VE during perioperative period. We excluded patients who had uncontrolled hemodynamic status (29, 30), intracranial hypertension, severe chronic obstructive pulmonary disease, broncho alveolar fistula, severe emphysema, and those with pre-existing comorbidities including severe left and right ventricular dysfunction, severe pulmonary hypertension (30, 31), severe obesity (BMI >40 kg/m2), and pregnancy.
After anesthesia induction, an endotracheal tube and arterial catheter were placed in all included patients. The dose or type of anesthesia agents and an anesthesia mechanical ventilator were managed by the attending anesthesiologists. An anesthesia machine ventilator was set to achieve a low tidal volume (6–8 mL/kg predicted body weight, aiming for an expired ratio of 1:2), positive end-expiratory pressure (PEEP) of 3–5 cm H2O, respiratory rate that was adjusted to obtain an appropriate end-tidal carbon dioxide (EtCO2) amount between 30 and 35 mmHg, and an inspiratory oxygen fraction (FiO2) was set to achieve an SpO2 of at least 95%.
Demographic data were recorded from medical record. Continuous blood pressure, continuous electrocardiogram, heart rate (HR), EtCO2, and SpO2 (measured by pulse oximetry), were monitored during the perioperative period. VE, defined as 250 mL of crystalloid solution infusion over 10 min, was decided by the attending physicians. Esophageal Doppler probe (DCQ ODM, Deltex, Chichester, Sussex, UK) and PI (on the third or fourth finger) were placed before the initiation of LRM until the end of VE. The esophageal Doppler probe was positioned to attain the best aortic blood velocity signal. LRM had been performed before surgery began and thus with closed abdomen by applying a continuous positive airway pressure (CPAP) of 30 cm H2O for 30 s before VE was infused. Systolic blood pressure (SBP), diastolic blood pressure (DBP), MAP, CO, SV, PVV, SVV, PVI, and PI were obtained before LRM as the first baseline values (T1) and after LRM (T2). After SV and PI returned to their baseline values (variations <10%), hemodynamic variables and PI were obtained as the second baseline values (T3); then, VE was infused and these hemodynamic variables and PI were recorded immediately after VE (T4) [Supplemental Digital Content (SDC), Figure 1]. Changes in hemodynamic variables and PI during LRM and VE were recorded and presented as relative percent change from the baseline value before LRM and VE, respectively. These were calculated using the following formula:
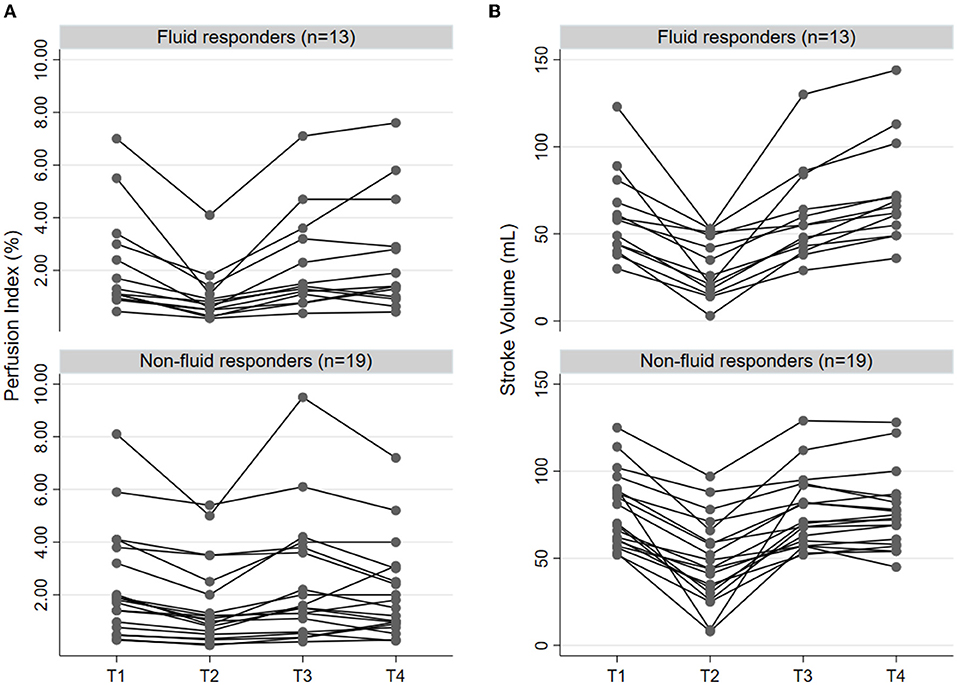
Figure 1. Individual change of prefusion index (A) and stroke volume (B) according to the status of fluid responsiveness (n = 13) and non-responsiveness (n = 19) in four time points, including before LRM (T1), after LRM (T2), before VE (T3), and immediately after VE (T4). LRM, lung recruitment maneuver; VE, volume expansion.
Before (T1) vs. after LRM (T2)
Relative change of SV (ΔSVLRM) = ([SVT1- SVT2]/SVT1)*100
Relative change of CO (ΔCOLRM) = ([COT1- COT2]/COT1)*100
Relative change of MAP (ΔMAPLRM) = ([MAPT1- MAPT2]/MAPT1)*100
Relative change of PPV (ΔPPVLRM) = ([PPVT2- PPVT1]/PPVT1)*100
Relative change of PVI (ΔPVILRM) = ([PVIT2- PVIT1]/PVIT1)*100
Before (T3) vs. after VE (T4)
Relative change of SV (ΔSVVE) = ([SVT4-SVT3]/SVT3)*100
Relative change of CO (ΔCOVE) = ([COT4- COT3]/COT3)*100
Relative change of MAP (ΔMAPVE) = ([MAPT4- MAPT3]/MAPT3)*100
SV, SVV, and CO were derived from the esophageal Doppler. PPV was derived from the Philips® IntelliVue MP 50 monitor. All the patients were grouped according to whether they were fluid responders or not, which was defined by an increase in SV (obtained by esophageal Doppler) ≥10% after VE. All the patients were included once.
PI, a unit expressed as a percentage, was measured using a pulse oximeter, the Radical-7 Pulse CO-Oximeter device (Masimo Corporation, Irvine, CA, USA) with an adult disposable spectrophotometric sensor, ReSposableTM R2–25 (Masimo Corporation, Irvine, CA, USA). The PI was calculated as the ratio of the pulsatile over non-pulsatile amplitudes detected by the sensor. The short-time method was used to display the PI values during LRM. A percent decrease in PI according to the LRM (ΔPILRM) was calculated using this formula:
Relative change of PI (ΔPILRM) = ([PIT1- PIT2]/PIT1)*100
The sample size was calculated based on the assumption that ΔPILRM could determine fluid responsiveness at an AUC of 0.80, corresponding to a good discriminative ability for the diagnostic test. The null hypothesis value of AUC was set at 0.50. The proportion of fluid responders was 45%, corresponding to a fluid responsiveness ratio (negative-to-positive) of 1.222. The risk of alpha error at 5% and beta error at 10% were accounted for. In total, 27 patients were needed. The sample size was calculated using Obuchowski's method (32) via a web tool for ROC curve analysis (version 1.3.1) (33). To counteract the 15% dropout rate, 32 patients were planned for inclusion.
Continuous data are expressed as the mean ± standard deviation (SD). Categorical data are expressed as counts (n) and percentages (%). The comparison of hemodynamic parameters before (T1) and after LRMs (T2) and before (T3) and after VE (T4) were performed using the paired t-test or Wilcoxon signed rank test as appropriate. Comparisons between fluid responders and non-responders were performed using the two-tailed Student t-tests or the Wilcoxon test as appropriate. The diagnostic performances of ΔPILRM, ΔSVLRM, ΔCOLRM, and ΔMAPLRM for detecting fluid responsiveness were estimated by the area under the receiver operating characteristic curves (AUCs). Sensitivity (Sn), specificity (Sp), positive predictive value, negative predictive value, positive likelihood ratio (LR+), and negative likelihood ratio (LR-) were reported accordingly. The best cut-off value was determined by the Youden Index (Sn + Sp−1).
The gray zone approach to identifying inconclusive ranges of ΔPILRM that could not determine whether the patients were fluid responders or non-responders, was constructed using two approaches. First, the bootstrap resampling of 1,000 replications was performed to identify the best cut-off point and its 95% confidence interval (CI) (representative of the gray zone). Second, the three class responses for ΔPILRM, including inclusion, inconclusion, and exclusion, were determined. Thresholds related to the Sn <90% and Sp <90% were set. Then, the remaining area was deemed inconclusive or designated a gray zone. The larger size from the two approaches was used to indicate the gray zone (34, 35). Correlation was performed by linear correlation, according to the data distribution. A p-value < 0.05 was considered statistically significant. All analyses were performed using the STATA statistical software version 16.0 (StataCorp LP, College Station, Tx, USA).
The baseline characteristics of the 32 patients included in this study are shown in Table 1. Thirteen (40.6%) patients were fluid responders and 19 were not. There were no differences in baseline characteristics between fluid responders and fluid non-responders (SDC, Supplementary Table 1).
Table 1. Patient baseline characteristics (n = 32).
Before LRM, there were no differences in MAP, CO, PVI, PI between fluid responders and non-responders (Table 2). PVV and SVV were greater in fluid responders than in non-responders (Table 2). After LRM, CO, SV, MAP, PI reduced, while PVI, PPV, and SVV increased in both groups (Table 2). ΔPILRM were greater in fluid responders than in non-responders (55.2 ± 17.8% vs. 35.3 ± 17.3%, p = 0.004, respectively). ΔSVLRM (49.4 ± 21.5% vs. 39.8 ± 21.4%, p = 0.222, respectively), ΔMAPLRM (26.3 ± 10.9% vs. 19.5 ± 9.6%, p = 0.073, respectively), ΔPVILRM (45.3 ± 10.0% vs. 35.9 ± 6.4%, p = 0.410, respectively), and ΔPPVLRM (58.1 ± 84.8% vs. 95.9 ± 102.5%, p = 0.297, respectively) did not differ between fluid responders and non-responders. Individual changes in PI and SV in fluid responders and non-responders are presented in Figure 1.
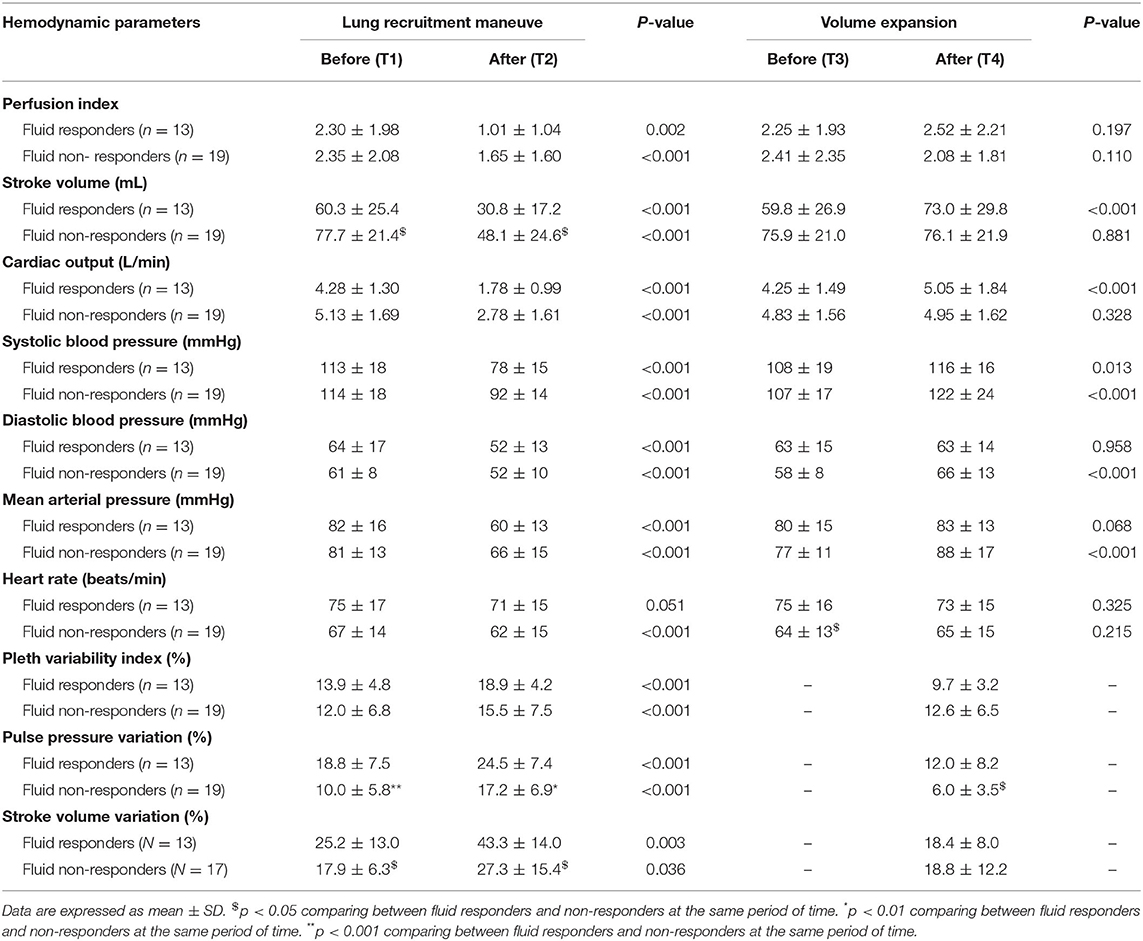
Table 2. Hemodynamic parameters before and after lung recruitment maneuver and volume expansion.
Before VE, MAP, CO, SV, and HR did not differ between fluid responders and non-responders (Table 2). After VE, only SV increased in fluid responders while MAP and HR were not different before and after VE in fluid responders (Table 2). PI did not change after VE in both groups (Table 2). Changes in PI and SV in fluid responders and non-responders during VE are shown in Figure 1.
ΔPILRM [0.81 (0.66–0.97)] and PPVT1 [0.82 (0.66–0.99)] showed higher AUCs than ΔCOLRM, ΔSBPLRM, ΔMAPLRM, PVIT1, and PIT1 to predict fluid responsiveness (Table 3; Figure 2) with cut-off values ≥40% [Sn of 92.3% (95% CI, 64.0–99.8%); Sp of 73.7% (95% CI, 48.8–90.9%); positive predictive value of 70.6% (95% CI, 44.0–89.7%); negative predictive value of 93.3% (95% CI, 68.1–99.8%); and LR+ of 3.51 (95% CI, 1.63–7.57)]. ΔPILRM had similar AUC with PPVT1, p = 0.806.
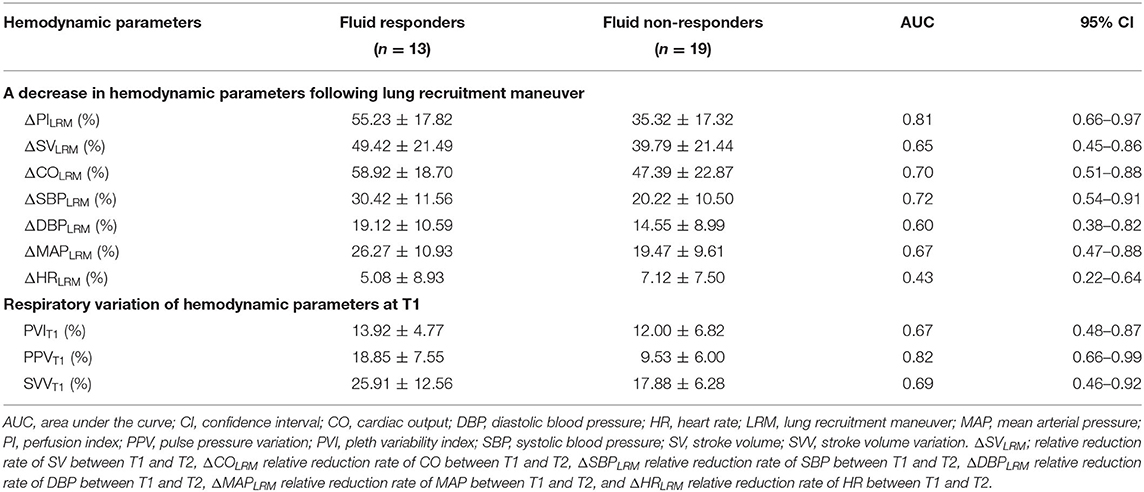
Table 3. The changes in hemodynamic parameters and their AUCs in predicting fluid responsiveness.
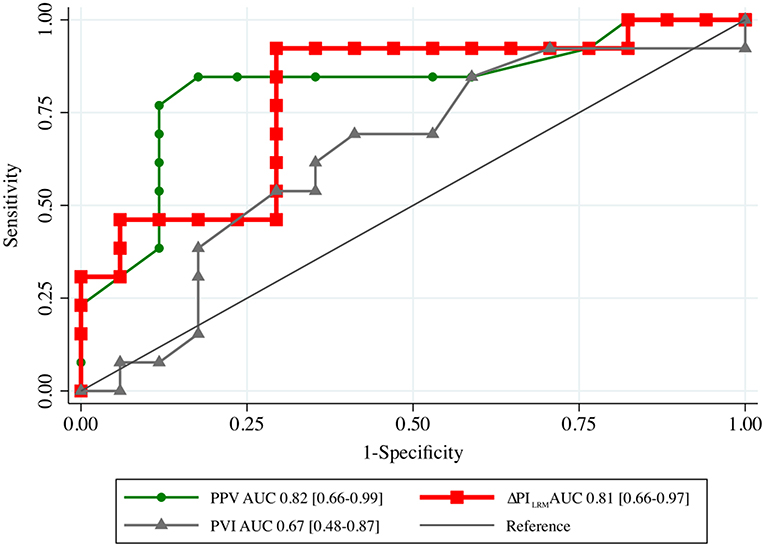
Figure 2. The area under the receiver operating characteristic (AUC) curves generated from the changes in PI following LRM (ΔPILRM), PPV and PVI before lung recruitment maneuver (T1) to predict fluid responsiveness. LRM, lung recruitment maneuver; PPV, pulse pressure variation; PVI, pleth variation index.
ΔPILRM and PPVT1 showed significant correlations with ΔSVVE (r2 = 0.36, p = 0.040 and r2 = 0.40, p = 0.028, respectively) and ΔSVLRM (r2 = 0.16, p = 0.020 and r2 = 0.17, p = 0.038, respectively) (Figure 3). The relative change of PI and SV were correlated when considering all interventions (both LRM and VE) (r2 = 0.14, p = 0.028, concordance rate = 29.64%) (SDC, Figure 2). There was a significant correlation between PVIT1 and ΔSVVE (r2 = 0.25, p = 0.036), but not with ΔSVLRM.
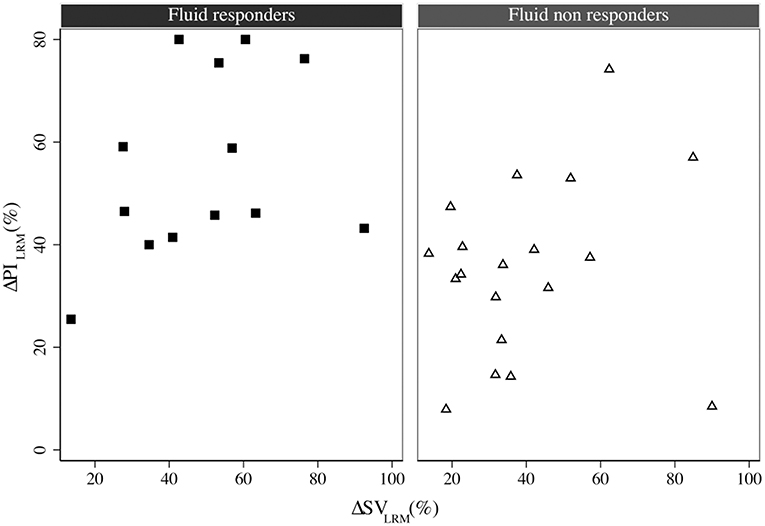
Figure 3. The correlation between ΔSVLRM and ΔPILRM in fluid responders (square) and non-responders (triangle), r2 = 0.16, p = 0.020. LRM, lung recruitment maneuver; SV, stroke volume; PI, perfusion index.
Figure 4 depicts the gray zone approach for the ΔPILRM. A decrease in ΔPILRM of <35% could guide the decision-making for fluid non-responders with a Sn ≥90%. In contrast, a decrease in ΔPILRM of more than 60% could detect fluid responsiveness with a Sp ≥90%. Over 21.9 and 50.0% of our population, respectively, could undergo guided decision-making by the ΔPILRM regarding whether to receive VE or not. However, in 28.1% of the population, this was inconclusive.
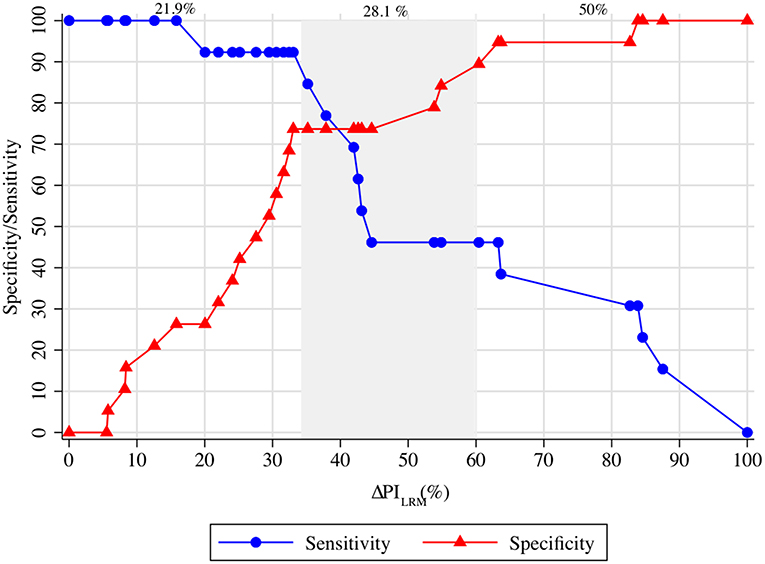
Figure 4. The gray zone approach of ΔPILRM and ΔSVVE. ΔPILRM <35.0% represents fluid non-responsiveness with a sensitivity >90%. Moreover, ΔPILRM >60.0% represents fluid responsiveness with a specificity >90%. The inconclusive zone of ΔPILRM is spread between 35.0 and 60.0%, which represents 28.1% of the population. LRM, lung recruitment maneuver; SV, stroke volume; PI, perfusion index.
In this study, we demonstrated that a reduction in PI during LRM and the baseline PPV had better ability to predict fluid responsiveness in surgical patients who underwent elective open abdominal surgery than the baseline MAP, CO, and PVI.
Predicting fluid responsiveness plays an important role in optimizing perioperative fluid infusion. Inappropriate fluid administration including inadequate fluid infusion during perioperative period are related to the development of acute kidney injury or an increase in postoperative complications such as infection, which is associated with mortality (1–5). Dynamic hemodynamic parameters which rely on heart-lung interactions, such as PPV and SVV are better indicators to predict fluid responsiveness than static hemodynamic variables such as MAP or CVP (11–13). However, PPV and SVV are less reliable in patients under mechanical ventilator with tidal volume <6 mL/kg (15). To overcome these limitations, end-expiratory occlusion test (36) and LRM (17, 18) are applied to evaluate the dynamic response of PPV or SVV.
Biais et al. (18) and Watanabe et al. (17) showed that a decrease in SV after LRM indicate fluid responsiveness during perioperative period. However, a change in SV during LRM in this study did not differ between fluid responders and non-responders, and it did not indicate fluid responsiveness. This finding can be explained by the differences in the sites of operation and devices between their publications (17, 18) and our study. The patients in this present study underwent open abdominal surgery whereas those in Biais et al. (18) and Watanabe et al. (17) underwent neurological and spine surgery, respectively. Additionally, SV in their publications (17, 18) were obtained by pulse contour analysis while in this present study, it was derived by esophageal Doppler. LRM might interfere with the aortic signal, leading to SV (37).
The PI signal represents the peripheral perfusion and depends on the global blood flow (SV and CO) and peripheral vasomotor tone. Thus, low PI could indicate either vasoconstriction and/or low SV (26, 27). While, high PI suggests vasodilatory state or high CO (38). When performing a preload test, as vascular tone does not change during this transient test, changes in PI track changes in CO (28). Courson et al. (35) demonstrated that a reduction in PI after LRM can predict fluid responsiveness in patients undergoing neurological surgery. In this study, we showed that the ΔPILRM was related with changes in SV during LRM and after VE and ΔPILRM was a good indicator to predict fluid responsiveness in patients undergoing open abdominal surgery; similar to the baseline PPV. Therefore, these findings confirmed the use of PI to detect a change in SV during LRM or VE. Moreover, ΔPILRM can be applied in patients with mechanical ventilator who are not requiring arterial catheter to detect fluid responsiveness. Furthermore, in this study, ΔPILRM had better ability to indicate fluid responders than PVI at baseline. This finding is similar to that of a previous meta-analysis (39), which reported that PVI reliability to predict fluid responsiveness in surgical patients under mechanical ventilators might be reduced. Nevertheless, further studies should be performed to validate these findings. Regarding the reduction in MAP and SV, LRM should be performed with caution in patients with hypotension or those requiring vasopressors.
In this study, PI did not change after VE in both fluid responders and non-responders. Ryu et al. (40) reported that sevoflurane and desflurane affected the PI values by inducing vasodilatation. Patients in this study received sevoflurane or desflurane, suggesting that in these patients, PI might have affected various vasoplegia states because of the anesthetic agents. This might explain the unchanged PI values after VE in fluid responders and non-responders (40, 41).
In fluid non-responders, PI and SV also decreased; this may be explained by the negative effect of the increase in the intrathoracic pressure during LRM on hemodynamic variables (29, 30) and volume status (42), or the degree of vasoplegia due to the anesthetic agents (40, 41). Moreover, the decrease in SV in fluid non-responders was similar to that reported by Biais et al. (18) and Watanabe et al. (17).
Our study also had some limitations. The first related to the esophageal Doppler technique. The cross-sectional area of the descending aorta was not applied in our technique. Therefore, this could lead to an underestimation of SV (37). Although with some considerations, this technique remains acceptable for tracking the trending ability when comparing it with the pulmonary artery thermodilution technique (43). Second, we performed LRM on patients in the supine position who mostly underwent open-abdominal surgery. The study period with LRM were performed before the surgery started; therefore, the results cannot be inferred to patients in other positions or other clinical situations, including laparoscopic surgery. The utilization of such a high tidal volume (8.7 ± 0.7 mL/predicted kg) in our study may limit the applicability of our ΔPILRM in a low tidal volume setting (6–8 mL/predicted kg). Moreover, a higher tidal volume, rather than a lower tidal volume, could emphasize the effects of LRM and thus produce a greater ΔPILRM, even in patients with good lung compliance and good transmission of pleural pressure. Therefore, confirming this hypothesis requires further investigations. Third, the sample size calculation did not take into account the accuracy of the esophageal Doppler to detect the changes in SV. Therefore, the number of participants in this study might be smaller than the actual required sample size. Fourth, an inconclusive zone of ΔPILRM between 35 and 60% needs further attention. Another test to predict fluid responsiveness is needed for these populations. Fifth, LRM in this study was performed shortly after an induction of the anesthetic agents; therefore, the effect of LRM on hemodynamic status might have been impacted by the degree of vasodilatation due to the anesthetic agents. Nevertheless, fluid administration in patients with various vasoplegia during anesthetic period should be based on clinical decision.
Despite these limitations, a reduction in PI after LRM obtained non-invasively by pulse oximetry can be applied as an indicator to predict fluid responsiveness in patients undergoing abdominal surgery, similar to the baseline PPV.
The original contributions presented in the study are included in the article/Supplementary Material, further inquiries can be directed to the corresponding author/s.
The study protocol was approved by the Institutional Review Board of Human Research Ethics Committee of the Faculty of Medicine, Ramathibodi Hospital, Mahidol University, Bangkok, Thailand (COA. MURA2020/1844). The study was registered with the Thai Clinical Trials Registry, code TCTR20201202001 (http://www.thaiclinicaltrials.org/show/TCTR 20201202001), on 2 December 2020. The patients/participants provided their written informed consent to participate in this study.
SM and NP created the conception and designation of the study. PPer wrote and submitted the proposal. PPer and SM obtained the data. NP, SM, PPin, and KT analyzed and interpreted the results. PPer and PPin drafted the work. NP, SM, WM, and KT substantively revised the manuscript. SM provided the greatest contribution to the study. All authors read and approved the final version of the manuscript.
Grant support for the study was provided by the Faculty of Medicine Ramathibodi Hospital, Mahidol University, Bangkok, Thailand. The funder had no role in the study design, data collection, analysis, interpretation of the data, and preparation of the manuscript. In addition, all equipments in this study were provided by the Department of Anesthesiology, Faculty of Medicine Ramathibodi Hospital.
The authors declare that the research was conducted in the absence of any commercial or financial relationships that could be construed as a potential conflict of interest.
All claims expressed in this article are solely those of the authors and do not necessarily represent those of their affiliated organizations, or those of the publisher, the editors and the reviewers. Any product that may be evaluated in this article, or claim that may be made by its manufacturer, is not guaranteed or endorsed by the publisher.
We would like to sincerely thank Mrs. Antika Wongthanee (MSc.), Statistician, Department of Internal Medicine, Faculty of Medicine, Chiang Mai University, Chiang Mai 50200, Thailand, who assisted with the statistical analysis of this project. Also, we would like to thank Jonathan Stream (Ba.), English Consultant, for English proofreading assistance.
The Supplementary Material for this article can be found online at: https://www.frontiersin.org/articles/10.3389/fmed.2022.881267/full#supplementary-material
1. Som A, Maitra S, Bhattacharjee S, Baidya DK. Goal directed fluid therapy decreases postoperative morbidity but not mortality in major non-cardiac surgery: a meta-analysis and trial sequential analysis of randomized controlled trials. J Anesth. (2017) 31:66–81. doi: 10.1007/s00540-016-2261-7
2. Chong MA, Wang Y, Berbenetz NM, McConachie I. Does goal-directed haemodynamic and fluid therapy improve peri-operative outcomes?: a systematic review and meta-analysis. Eur J Anaesthesiol. (2018) 35:469–83. doi: 10.1097/EJA.0000000000000778
3. Thacker JK, Mountford WK, Ernst FR, Krukas MR, Mythen MM. Perioperative fluid utilization variability and association with outcomes: considerations for enhanced recovery efforts in sample US surgical populations. Ann Surg. (2016) 263:502–10. doi: 10.1097/SLA.0000000000001402
4. Shin CH, Long DR, McLean D, Grabitz SD, Ladha K, Timm FP, et al. Effects of intraoperative fluid management on postoperative outcomes: a hospital registry study. Ann Surg. (2018) 267:1084–92. doi: 10.1097/SLA.0000000000002220
5. Myles PS, Bellomo R, Corcoran T, Forbes A, Peyton P, Story D, et al. Restrictive versus liberal fluid therapy for major abdominal surgery. N Engl J Med. (2018) 378:2263–74. doi: 10.1056/NEJMoa1801601
6. Jessen MK, Vallentin MF, Holmberg MJ, Bolther M, Hansen FB, Holst JM, et al. Goal-directed haemodynamic therapy during general anaesthesia for noncardiac surgery: a systematic review and meta-analysis. Br J Anaesth. (2022) 128:416–33. doi: 10.1016/j.bja.2021.10.046
7. Messina AA-O, Robba C, Calabrò L, Zambelli D, Iannuzzi F, Molinari E, et al. Association between perioperative fluid administration and postoperative outcomes: a 20-year systematic review and a meta-analysis of randomized goal-directed trials in major visceral/noncardiac surgery. Crit Care. (2021) 25:43. doi: 10.1186/s13054-021-03464-1
8. Wrzosek A, Jakowicka-Wordliczek J, Zajaczkowska R, Serednicki WT, Jankowski M, Bala MM, et al. Perioperative restrictive versus goal-directed fluid therapy for adults undergoing major non-cardiac surgery. Cochrane Database Syst Rev. (2019) 12:CD012767. doi: 10.1002/14651858.CD012767
9. McEvoy MA-O, Wanderer JP, Shi Y, Ramanujan KS, Geiger TM, Shotwell MS, et al. The effect of adding goal-directed hemodynamic management for elective patients in an established enhanced recovery program for colorectal surgery: results of quasi-experimental pragmatic trial. Perioper Med. (2020) 9:35. doi: 10.1186/s13741-020-00163-3
10. Calvo-Vecino JM, Ripolles-Melchor J, Mythen MG, Casans-Frances R, Balik A, Artacho JP, et al. Effect of goal-directed haemodynamic therapy on postoperative complications in low-moderate risk surgical patients: a multicentre randomised controlled trial (FEDORA trial). Br J Anaesth. (2018) 120:734–44. doi: 10.1016/j.bja.2017.12.018
11. Jozwiak M, Monnet X, Teboul JL. Prediction of fluid responsiveness in ventilated patients. Ann Transl Med. (2018) 6:352. doi: 10.21037/atm.2018.05.03
12. Monnet X, Marik PE, Teboul JL. Prediction of fluid responsiveness: an update. Ann Intensive Care. (2016) 6:111. doi: 10.1186/s13613-016-0216-7
13. Marik PE, Cavallazzi R. Does the central venous pressure predict fluid responsiveness? An updated meta-analysis and a plea for some common sense. Crit Care Med. (2013) 41:1774–81. doi: 10.1097/CCM.0b013e31828a25fd
14. van Lavieren M, Veelenturf J, Hofhuizen C, van der Kolk M, van der Hoeven J, Pickkers P, et al. Dynamic preload indicators decrease when the abdomen is opened. BMC Anesthesiol. (2014) 14:90. doi: 10.1186/1471-2253-14-90
15. Teboul JL, Monnet X, Chemla D, Michard F. Arterial pulse pressure variation with mechanical ventilation. Am J Respir Crit Care Med. (2019) 199:22–31. doi: 10.1164/rccm.201801-0088CI
16. Cannesson M, Le Manach Y, Hofer CK, Goarin JP, Lehot JJ, Vallet B, et al. Assessing the diagnostic accuracy of pulse pressure variations for the prediction of fluid responsiveness: a “gray zone” approach. Anesthesiology. (2011) 115:231–41. doi: 10.1097/ALN.0b013e318225b80a
17. Watanabe R, Suehiro K, Mukai A, Tanaka K, Yamada T, Mori T, et al. Changes in stroke volume induced by lung recruitment maneuver can predict fluid responsiveness during intraoperative lung-protective ventilation in prone position. BMC Anesthesiol. (2021) 21:303. doi: 10.1186/s12871-021-01527-y
18. Biais M, Lanchon R, Sesay M, Le Gall L, Pereira B, Futier E, et al. Changes in stroke volume induced by lung recruitment maneuver predict fluid responsiveness in mechanically ventilated patients in the operating room. Anesthesiology. (2017) 126:260–7. doi: 10.1097/ALN.0000000000001459
19. Messina A, Montagnini C, Cammarota G, De Rosa S, Giuliani F, Muratore L, et al. Tidal volume challenge to predict fluid responsiveness in the operating room: an observational study. Eur J Anaesthesiol. (2019) 36:583–91. doi: 10.1097/EJA.0000000000000998
20. Messina A, Montagnini C, Cammarota G, Giuliani F, Muratore L, Baggiani M, et al. Assessment of fluid responsiveness in prone neurosurgical patients undergoing protective ventilation: role of dynamic indices, tidal volume challenge, and end-expiratory occlusion test. Anesth Analg. (2020) 130:752–61. doi: 10.1213/ANE.0000000000004494
21. Min JJ, Gil N-S, Lee J-H, Ryu DK, Kim CS, Lee SM. Predictor of fluid responsiveness in the ’grey zone': augmented pulse pressure variation through a temporary increase in tidal volume. Br J Anaesth. (2017) 119:50–6. doi: 10.1093/bja/aex074
22. Scheer B, Perel A, Pfeiffer UJ. Clinical review: complications and risk factors of peripheral arterial catheters used for haemodynamic monitoring in anaesthesia and intensive care medicine. Crit Care. (2002) 6:199–204. doi: 10.1186/cc1489
23. Cannesson M, Desebbe O, Rosamel P, Delannoy B, Robin J, Bastien O, et al. Pleth variability index to monitor the respiratory variations in the pulse oximeter plethysmographic waveform amplitude and predict fluid responsiveness in the operating theatre. Br J Anaesth. (2008) 101:200–6. doi: 10.1093/bja/aen133
24. Coeckelenbergh S, Delaporte A, Ghoundiwal D, Bidgoli J, Fils J-F, Schmartz D, et al. Pleth variability index versus pulse pressure variation for intraoperative goal-directed fluid therapy in patients undergoing low-to-moderate risk abdominal surgery: a randomized controlled trial. BMC Anesthesiol. (2019) 19:34 doi: 10.1186/s12871-019-0707-9
25. Forget P, Lois F, de Kock M. Goal-directed fluid management based on the pulse oximeter–derived pleth variability index reduces lactate levels and improves fluid management. Anesth Analg. (2010) 111:910–4. doi: 10.1213/ANE.0b013e3181eb624f
26. van Genderen ME, Bartels SA, Lima A, Bezemer R, Ince C, Bakker J, et al. Peripheral perfusion index as an early predictor for central hypovolemia in awake healthy volunteers. Anesthesia Analgesia. (2013) 116:351–6. doi: 10.1213/ANE.0b013e318274e151
27. Hasanin A, Mukhtar A, Nassar H. Perfusion indices revisited. J Intensive Care. (2017) 5:24. doi: 10.1186/s40560-017-0220-5
28. Højlund J, Agerskov M, Clemmesen CG, Hvolris LE, Foss NB. The peripheral perfusion index tracks systemic haemodynamics during general anaesthesia. J Clin Monit Comput. (2020) 34:1177–84. doi: 10.1007/s10877-019-00420-x
29. Lovas A, Szakmány T. Haemodynamic effects of lung recruitment manoeuvres. Biomed Res Int. (2015) 2015:478970. doi: 10.1155/2015/478970
30. Das A, Haque M, Chikhani M, Cole O, Wang W, Hardman JG, et al. Hemodynamic effects of lung recruitment maneuvers in acute respiratory distress syndrome. BMC Pul Med. (2017) 17:34. doi: 10.1186/s12890-017-0369-7
31. Pensier J, de Jong A, Hajjej Z, Molinari N, Carr J, Belafia F, et al. Effect of lung recruitment maneuver on oxygenation, physiological parameters and mortality in acute respiratory distress syndrome patients: a systematic review and meta-analysis. Int Care Med. (2019) 45:1691–702. doi: 10.1007/s00134-019-05821-9
32. Obuchowski NA. ROC analysis. AJR Am J Roentgenol. (2005) 184:364–72. doi: 10.2214/ajr.184.2.01840364
33. Goksuluk D, Korkmaz S, Zararsiz G, Karaagaoglu E. easyROC: an interactive web-tool for ROC curve analysis using R language environment. R J. (2016) 8:213–30. doi: 10.32614/RJ-2016-042
34. Cannesson M, Pestel G, Ricks C, Hoeft A, Perel A. Hemodynamic monitoring and management in patients undergoing high risk surgery: a survey among North American and European anesthesiologists. Crit Care. (2011) 15:R197. doi: 10.1186/cc10364
35. de Courson H, Michard F, Chavignier C, Verchère E, Nouette-Gaulain K, Biais M. Do changes in perfusion index reflect changes in stroke volume during preload-modifying manoeuvres? J Clin Monit Comput. (2020) 34:1193–8. doi: 10.1007/s10877-019-00445-2
36. Georges D, de Courson H, Lanchon R, Sesay M, Nouette-Gaulain K, Biais M. End-expiratory occlusion maneuver to predict fluid responsiveness in the intensive care unit: an echocardiographic study. Crit Care. (2018) 22:32. doi: 10.1186/s13054-017-1938-0
37. Cholley BP, Singer M. Esophageal doppler: noninvasive cardiac output monitor. Echocardiography. (2003) 20:763–9. doi: 10.1111/j.0742-2822.2003.03033.x
38. Lima AP, Beelen P, Bakker J. Use of a peripheral perfusion index derived from the pulse oximetry signal as a noninvasive indicator of perfusion. Crit Care Med. (2002) 30:1210–3. doi: 10.1097/00003246-200206000-00006
39. Liu T, Xu C, Wang M, Niu Z, Qi D. Reliability of pleth variability index in predicting preload responsiveness of mechanically ventilated patients under various conditions: a systematic review and meta-analysis. BMC Anesthesiol. (2019) 19:67. doi: 10.1186/s12871-019-0744-4
40. Ryu KH, Hwang SH, Shim JG, Ahn JH, Cho EA, Lee SH, et al. Comparison of vasodilatory properties between desflurane and sevoflurane using perfusion index: a randomised controlled trial. Br J Anaesth. (2020) 125:935–42. doi: 10.1016/j.bja.2020.07.050
41. Iizuka Y, Sanui M, Otsuka Y, Yoshinaga K, Nakatomi T, Lefor AK. Changes in peripheral perfusion index during intraoperative end-expiratory occlusion tests do not predict the response to fluid administration in patients undergoing lung protective ventilation. J Anesth. (2021) 35:837–43. doi: 10.1007/s00540-021-02988-8
42. Nielsen J, Nilsson M, Fredén F, Hultman J, Alström U, Kjaergaard J, et al. Central hemodynamics during lung recruitment maneuvers at hypovolemia, normovolemia and hypervolemia. A study by echocardiography and continuous pulmonary artery flow measurements in lung-injured pigs. Int Care Med. (2006) 32:585–94. doi: 10.1007/s00134-006-0082-0
Keywords: perfusion index (PI), fluid responsiveness, lung recruitment maneuver, mechanical ventilation, perioperative period
Citation: Morakul S, Prachanpanich N, Permsakmesub P, Pinsem P, Mongkolpun W and Trongtrakul K (2022) Prediction of Fluid Responsiveness by the Effect of the Lung Recruitment Maneuver on the Perfusion Index in Mechanically Ventilated Patients During Surgery. Front. Med. 9:881267. doi: 10.3389/fmed.2022.881267
Received: 22 February 2022; Accepted: 25 May 2022;
Published: 17 June 2022.
Edited by:
Xavier Monnet, Hôpitaux universitaires Paris-Sud (APHP), FranceReviewed by:
Gaetano Scaramuzzo, University of Ferrara, ItalyCopyright © 2022 Morakul, Prachanpanich, Permsakmesub, Pinsem, Mongkolpun and Trongtrakul. This is an open-access article distributed under the terms of the Creative Commons Attribution License (CC BY). The use, distribution or reproduction in other forums is permitted, provided the original author(s) and the copyright owner(s) are credited and that the original publication in this journal is cited, in accordance with accepted academic practice. No use, distribution or reproduction is permitted which does not comply with these terms.
*Correspondence: Konlawij Trongtrakul, a29ubGF3aWpAbGl2ZS5jb20=; Wasineenart Mongkolpun, d2FzaW5lZW5hcnQubW9uZ2tvbHB1bkB5YWhvby5jb20=
†These authors have contributed equally to this work
Disclaimer: All claims expressed in this article are solely those of the authors and do not necessarily represent those of their affiliated organizations, or those of the publisher, the editors and the reviewers. Any product that may be evaluated in this article or claim that may be made by its manufacturer is not guaranteed or endorsed by the publisher.
Research integrity at Frontiers
Learn more about the work of our research integrity team to safeguard the quality of each article we publish.