- 1Department of Ophthalmology, Faculty of Medicine and University Hospital Cologne, University of Cologne, Cologne, Germany
- 2Eye Center, Second Affiliated Hospital, Zhejiang University School of Medicine, Hangzhou, China
- 3Center for Integrated Oncology (CIO), Aachen-Bonn-Cologne-Duesseldorf, Cologne, Germany
Purpose: Portable three-dimensional imaging systems are becoming increasingly common for facial measurement analysis. However, the reliability of portable devices may be affected by the necessity to take three pictures at three time points. The purpose of this study was to evaluate the effectiveness of portable devices for assessing the periocular region.
Methods: In 60 Caucasian volunteers (120 eyes), four facial scans (twice for each instrument) using the portable VECTRA H2 and static VECTRA M3 devices were performed; patients' heads were kept straight, looking ahead, with a neutral facial expression. One assessor set 52 periocular landmarks in the periocular area of each image and subsequently assessed intra- and inter-device reliability by comparing two within-device measurements and one between-device measurement, respectively.
Results: The mean absolute difference (MAD) (0.13 and 0.12 units), relative error of measurement (REM) (0.61 and 0.68%), technical error of measurement (TEM)(1.02 and 0.80 units), relative TEM (rTEM) (5.51 and 4.43%), and intraclass correlation coefficient (ICC) (0.89, 0.89) showed good intra-device reliability for M3 and H2; MAD (0.63, 0.62 units), REM (2.83, 2.69%), TEM (1.31, 1.10 units), rTEM (7.62, 5.57%), and ICC (0.79, 0.83) indicated that inter-device reliability deteriorated compared to intra-device reliability and that the inter-device reliability of the first scan (moderate) was lower than that of the average of the two scans (good).
Conclusions: The portable VECTRA H2 device proved reliable in assessing most periocular linear distances, curve distances, and angles; some improvement in inter-device reliability can be achieved by using the average of two scans.
Introduction
The anthropometric data of facial soft tissues are widely used in plastic (1) and craniomaxillofacial surgery (2–4). These data are important to develop surgical plans (5) and assess outcome prognosis (6–8). Particularly, the periocular region plays an important role in facial attractiveness, emotional expression, and differentiation by ethnicity (9, 10), gender, and age (11, 12). It is also a major reference indicator for corrective, restorative, or cosmetic surgery (13). In recent years, non-invasive three-dimensional (3D) surface imaging methods, including VECTRA, Artec EVA, and 3D MD systems (14–16) have gradually replaced traditional direct anthropometric techniques (using rulers and calipers) and two-dimensional (2D) photography. Most of the existing 3D photogrammetry systems are static devices, which prominently feature in capturing photos of participants from three different angles at a single time point and composing a 3D photo using a computer. Previous studies have proposed the first standardized periocular anthropometric protocol (17, 18) and showed potential clinical applications, including a novel standardized lower eyelid tension distraction test and a lateral distraction test (19, 20). The reliability (repeatability) and accuracy of the VECTRA M3 static device is very high for linear, curvilinear, angular, area, and volume measurements (21–25). However, the device is expensive, bulky, untransportable, and requires frequent calibration (2, 14, 26–28) to reach this high reliability, which are considerable limitations, especially for patients who cannot walk independently or reside in remote and poor areas.
Currently, portable 3D imaging devices are available in the market. These systems comprise only one digital single-lens reflex camera in addition to a computer system (5). Due to low cost, no need for calibration, and portability, portable 3D photogrammetry systems have high potential to be used extensively in research and routine clinical measurements in the future. Although several publications have conducted facial analyses using older portable devices (5, 16, 29–31), including studies on the reproducibility of these devices (VECTRA H1) in comparison with static devices (3D MD or VECTRA M3) (5, 31), some issues remain to be addressed. First, the primary portable device used in previous studies was the VECTRA H1; the newest generation, VECTRA H2, was not used. Second, there are no studies on the application of portable devices in the periocular area with newly developed standardized landmarks protocols. Finally, many factors, including head and eye movements, camera movements, user dependence, and facial expressions, may affect the reliability of the portable device during the three shots. Therefore, this study aimed to evaluate the reliability of a novel portable stereophotogrammetric device VECTRA H2 compared to the static VECTRA M3 (the current gold-standard 3D imaging system) for three-dimensional periocular analysis and subsequently provide a basis for the feasibility of VECTRA H2 in periocular applications.
Methods
Study Participants
Sixty Caucasian volunteers (30 men and 30 women, 120 eyes) aged 18–48 years (28.2 ± 6.2 years) were recruited for this study. The study sample size was calculated based on the results of the interdevice comparison between M3 and H2 for 10 volunteers in the pre-test study (LCAm: 67.77 ± 10.65° vs. 62.98 ± 7.09°). With a 2-sided 5% significance level and 80% power, a sample size of 34 patients per group was determined by PASS software (Version 15, UT, USA). Exclusion criteria were deformities, lesions, surgical, or traumatic events involving the face. All participants signed an informed consent form, and this study was performed in accordance with the principles of the Declaration of Helsinki and approved by the ethics committee of Cologne University (approval no: 17-199).
3D Image Acquisition and Data Collection
Before the images were obtained, all volunteers were asked to remove their makeup, take off their jewelry, and pull their hair back to ensure complete exposure of their forehead and eyebrows. Thereafter, the facial images of each volunteer were captured twice by a static VECTRA M3 and a portable VECTRA H2 system (Canfield Scientific, Inc., Parsippany, NJ, USA). Scanning with both devices was performed consecutively in the same room, and the volunteers sat in a neutral posture. For the static VECTRA M3, calibration was performed according to device guidance before each capture. During acquisition, participants looked at the upper-middle mirror in the machine, keeping their eyes between the vertical and horizontal reference lines on the screen. For the portable VECTRA H2, the operator took three consecutive photographs from three angles as required by the device instructions: the first photograph was taken 30 cm below 45 degrees on the right side of the volunteer's face, and the second photograph was taken with the camera in front of the face. Subsequently, the third picture was taken on the left side of the face at 30 cm below 45 degrees (Figure 1). Finally, the computer connected to the camera merged the three photos into one 3D photo using VAM software version 2.8.2 (Canfield Scientific, Inc.).
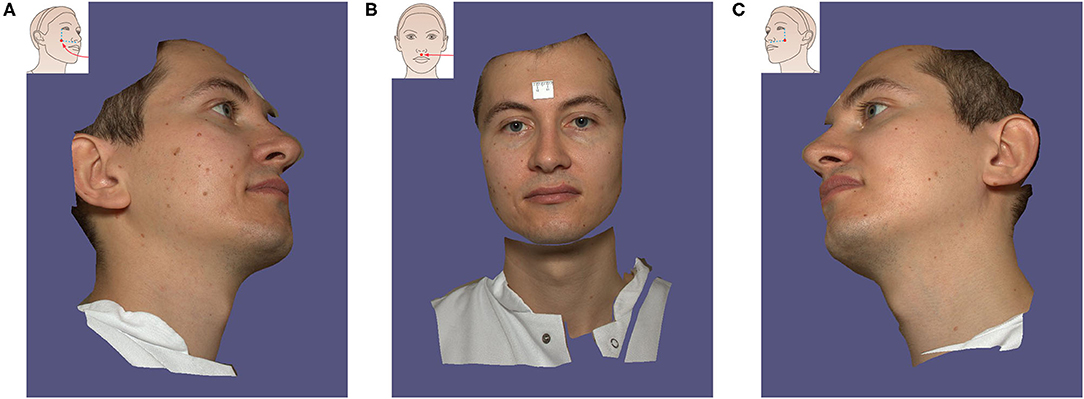
Figure 1. The process of 3D image acquisition with Vectra H2 portable camera. The volunteer follows the instructions to turn the head to the left (A), turn the head to look forward (B), and finally turn the head to the right (C). The application instruction screen for each step is displayed in the upper right corner.
This study employed 52 3D anthropometric landmarks of the periocular region developed and validated by our research group (Figure 2). The definitions of these landmarks and measurements are detailed in Tables 1, 2. Subsequently, the study measured three categories of data (linear distances, curves, and angles).
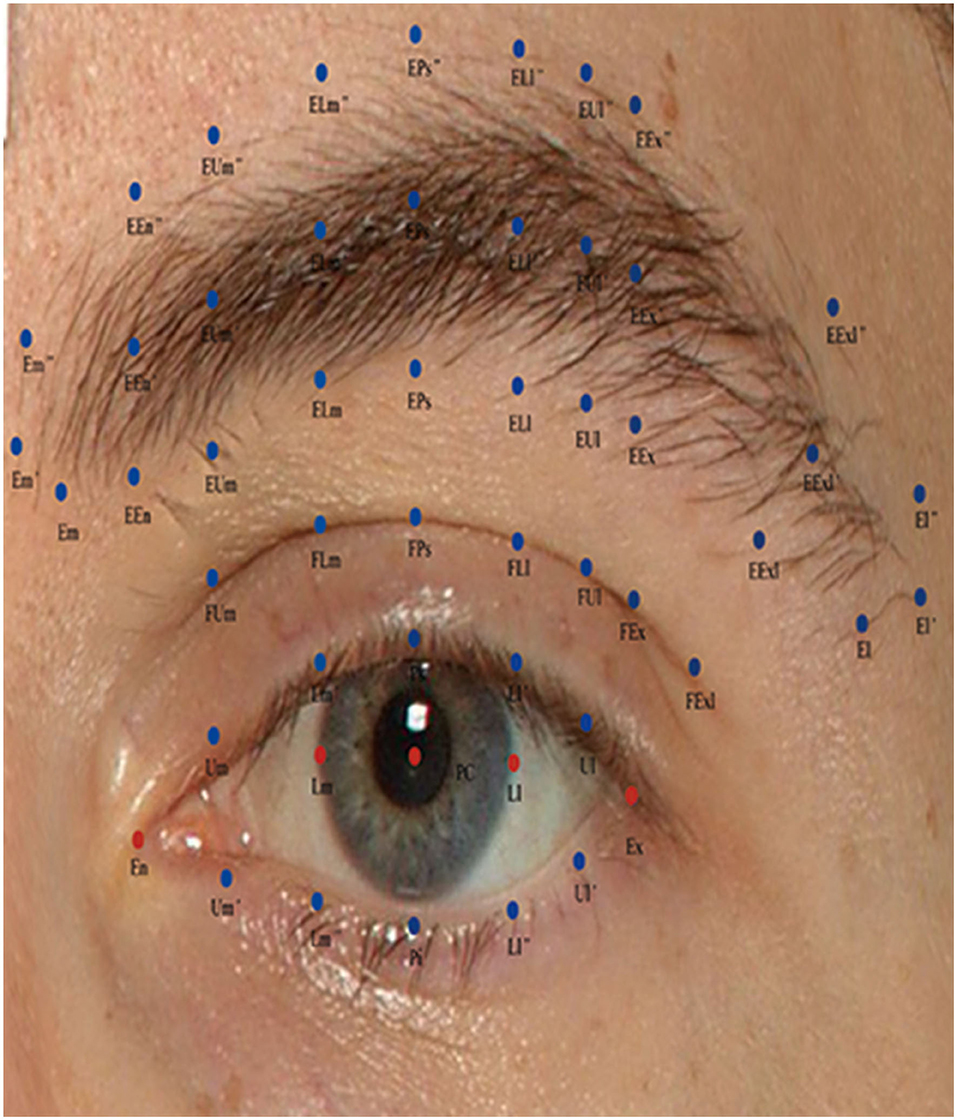
Figure 2. Description of periocular anthropometric landmarks used in this study. Periocular anthropometry was performed according to Guo et al. (17).

Table 1. Definition of abbreviations for periocular landmarks, modified from Guo et al. (17).

Table 2. List of linear distance, curve, and angle measurement variables for the periocular region, derived from Guo et al. (17).
Statistical Analysis
Statistical analysis was performed using SPSS 23.0 software (Armonk, NY: IBM Corp.), and graphs were created by GraphPad Prism 9 (GraphPad Software, San Diego, CA, USA). Differences in the age distribution of men and women among volunteers were assessed using the Wilcoxon's signed rank-sum test. All measured data were tested for normality using the Kolmogorov-Smirnov test. For data conforming to a normal distribution, paired t-tests were conducted to assess differences within and between devices. For non-normally distributed data, Wilcoxon's signed-rank test was used. P-values <0.05 were considered to indicate statistical significance.
Intra-device reliability was analyzed by comparing the images captured twice by each device (VECTRA M3 and VECTRA H2), and inter-device reliability was analyzed by comparing the metric parameters obtained from the first scan (using VECTRA H2 and VECTRA M3) and the measured average of the images scanned twice with each device. The intraclass correlation coefficient (ICC) has a value between 0 and 1, and a value closer to 1 indicates high reliability. ICC values allowed the classification of the agreement into three classes: <0.4, poor agreement; 0.4–0.75, satisfactory; and ≥0.75, excellent (32). Given the small periocular measurements, we set the minimum error threshold for the mean absolute difference (MAD) and technical error of measurement (TEM) to 1 unit (millimeter or degree). Relative error of measurement (REM) and relative TEM (rTEM) values can be classified into five categories (excellent, <1%; very good, 1–3.9%; good, 4–6.9%; moderate, 7–9.9%; and poor, >10%) based on the scale proposed by Camison et al. and Andrade et al. (5, 33).
Results
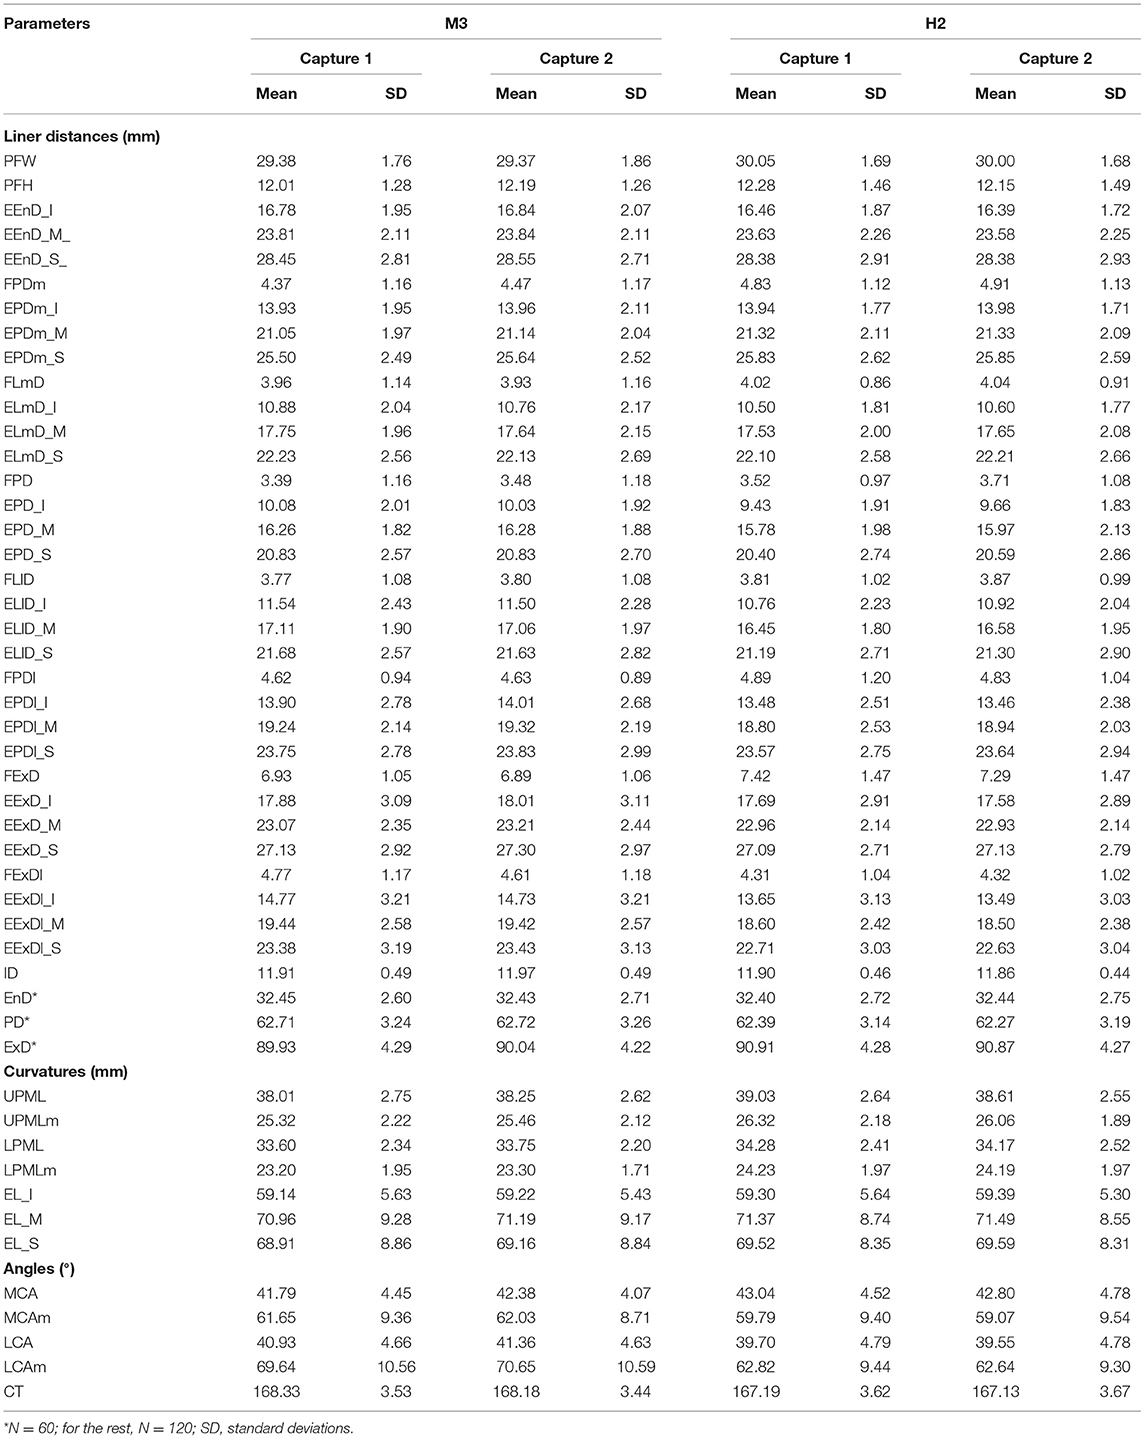
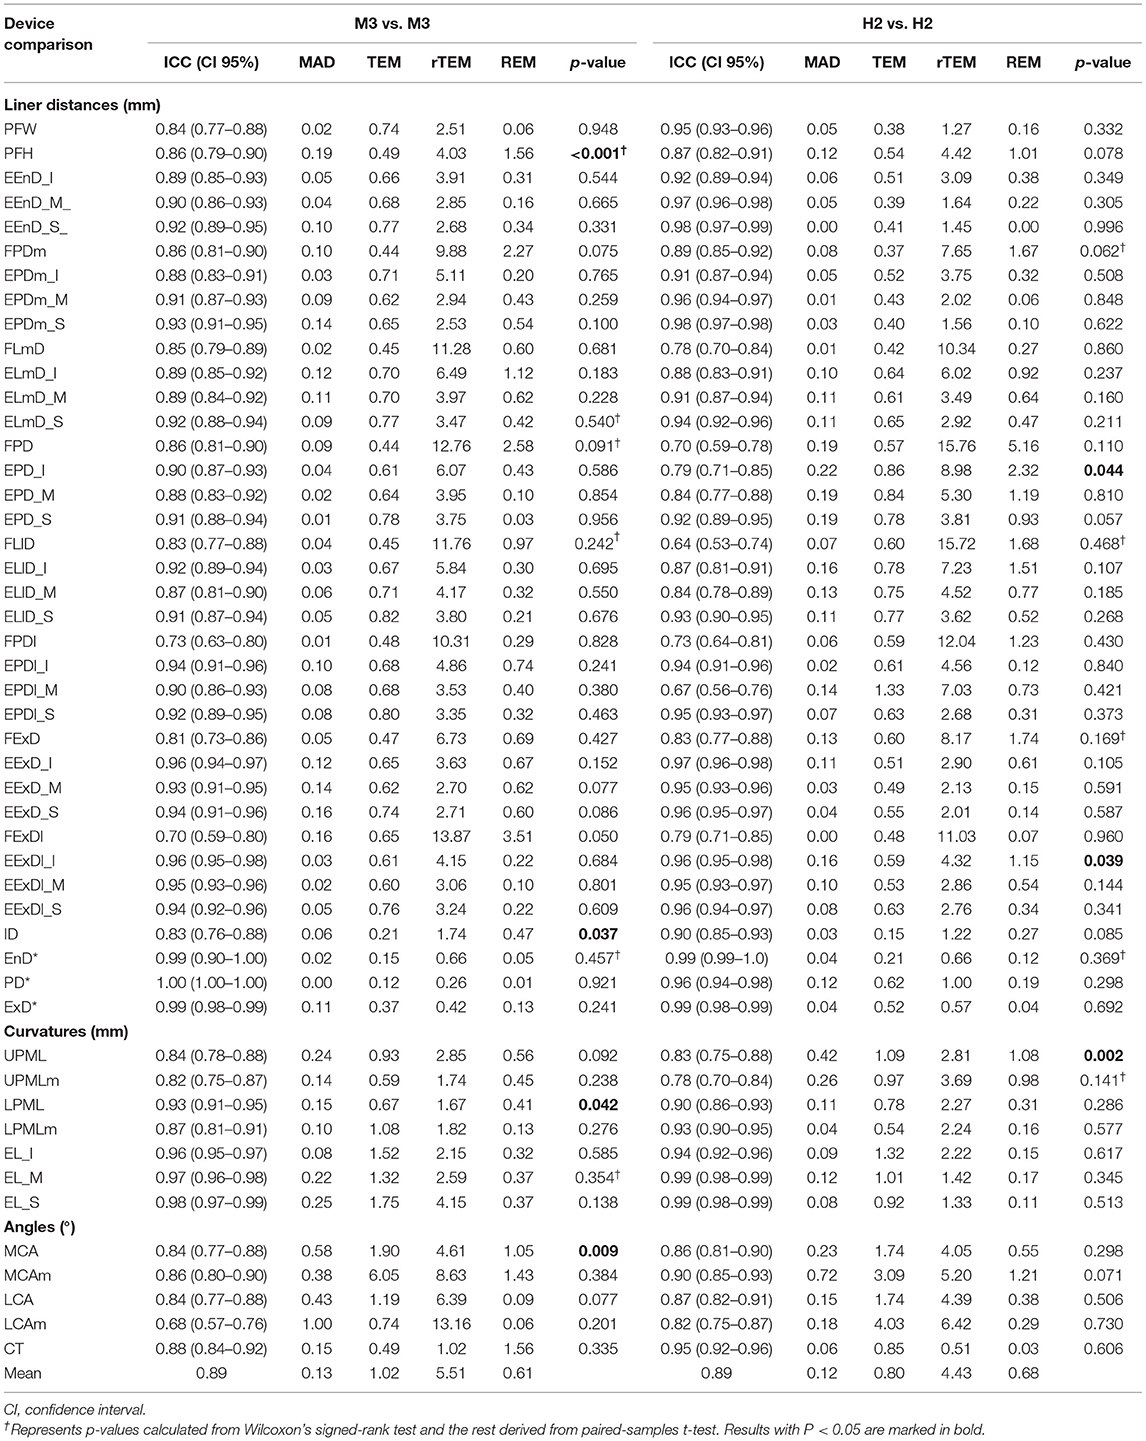
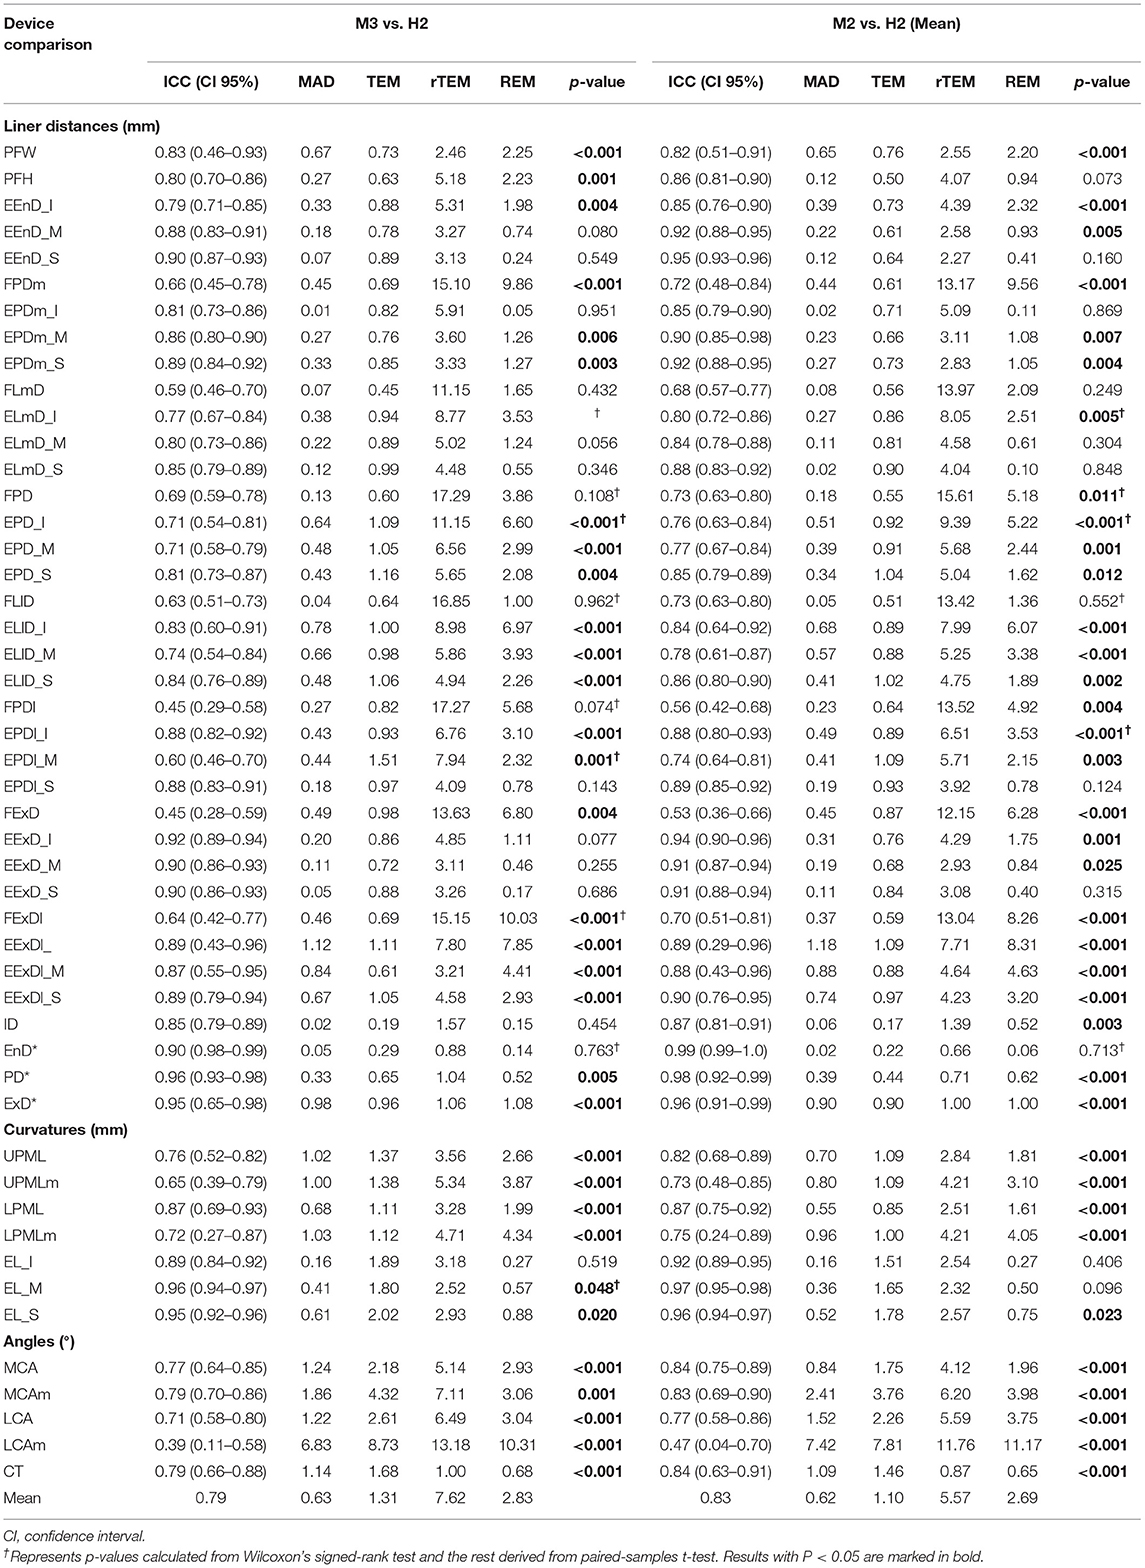
The measurement results (means and standard error, SD) of the M3 and H2 system are shown in Table 3. Repeatability parameters (ICC, MAD, TEM, REM, and rTEM) within and between the VECTRA M3 and H2 devices are presented in Tables 4, 5.
Intra-Device Reliability With VECTRA M3
ICC (Table 4, Figure 3) estimates for most M3 intra-device comparisons were excellent (0.81–1.00), except for two upper lid fold-related variables (FPDI: 0.73, FExDI: 0.70) and one eyelid fissure-related variable (LCAm: 0.68). As shown in Table 6 and Figure 4, MAD was <1 unit for 48 of the 49 parameters, and LCAm was between 1 and 2 units. TEM was <1 unit for 42 parameters (87.5% eyebrow-related variables, 100% upper lid fold-related variables, and 60% palpebral fissure-related variables); the largest measurement error was for the palpebral fissure-related variable MCAm (6.05°). The REM and rTEM results for each comparison are shown in Figure 5 and Figure 6. Of seven upper lid fold-related variables, 57.1% of REM values were <1 and 42.9% of values were between 1 and 3.9%. As for rTEM, 71.4% of variables were >10%, except for FExD, which was <7%, and FDPm, which was <10%. FExDI (rTEM = 13.87%) had the largest value. REM was <1% for 73.3% of palpebral fissure-related variables, and 26.7% were in the 1–3.9% range. Except for MCAm (rTEM = 8.63%) and LCAm (rTEM = 13.61%), 86.7% of palpebral fissure-related values showed an rTEM <7% (20% of variables were <1%, 46.7% were between 1 and 3.9%, and 20% were between 4 and 6.9%). Moreover, the rTEM and REM of all brow-related variables were <7%. Additionally, 95.8% of REM values were <1%, 75% of rTEM and 4.2% of REM values were between 1 and 3.9%, and 25% of rTEM values were between 4 and 6.9%.
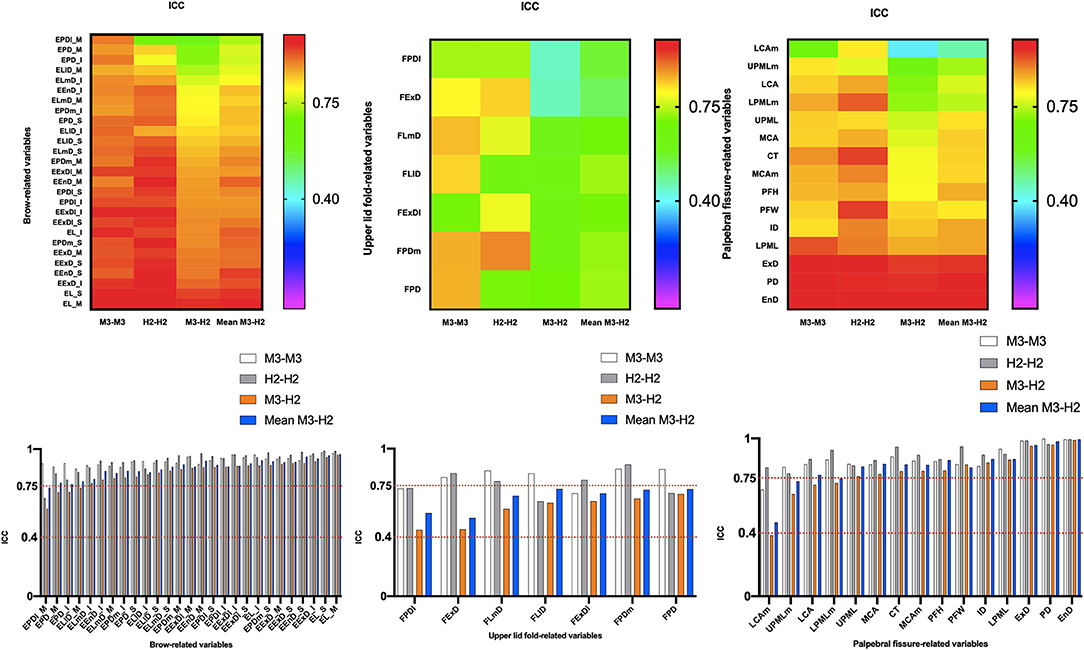
Figure 3. Intra- and inter-device of intraclass correlation coefficient (ICC) for all periocular region measurements of 3D images. ICC values allowed the classification of the agreement into three classes: <0.4, poor agreement; 0.4–0.75, satisfactory; and ≥0.75, excellent.
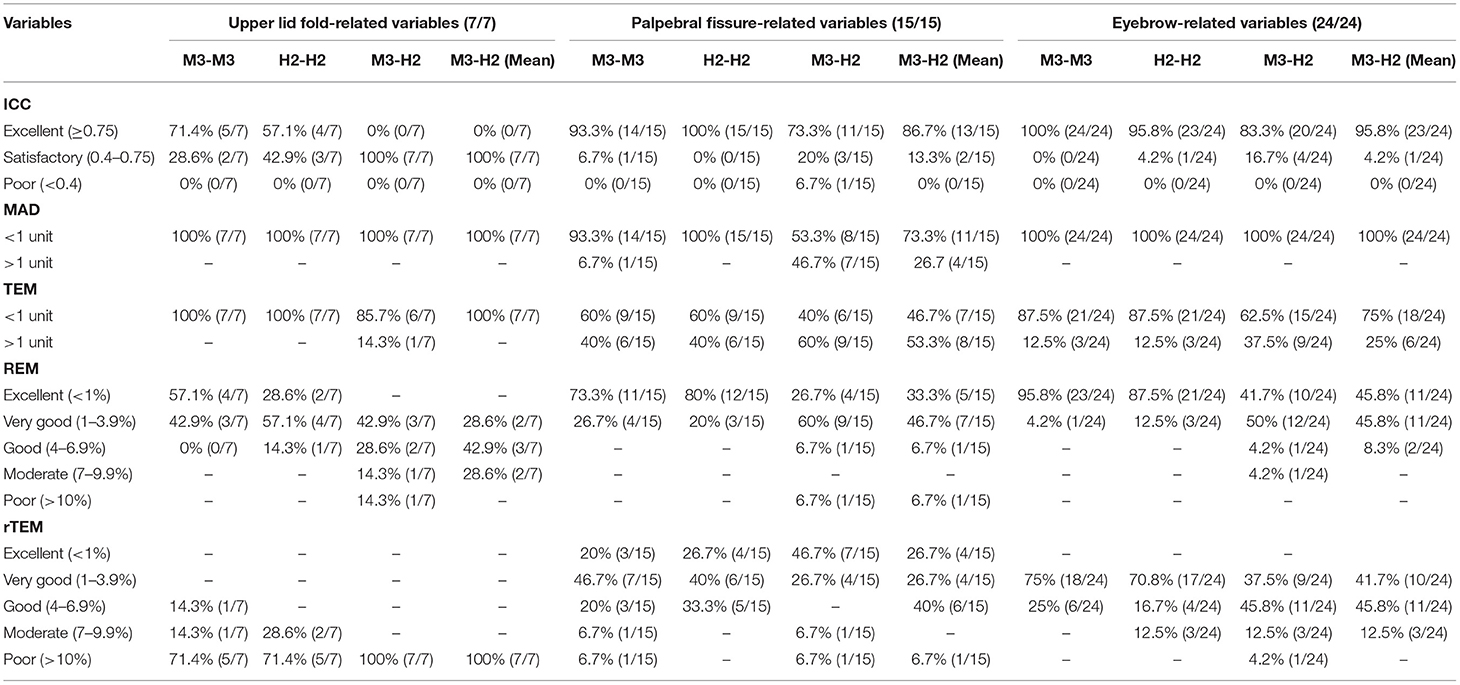
Table 6. Percentage of different periocular measurement variables in each reliability rating classification for VECTRA M3 and H2.
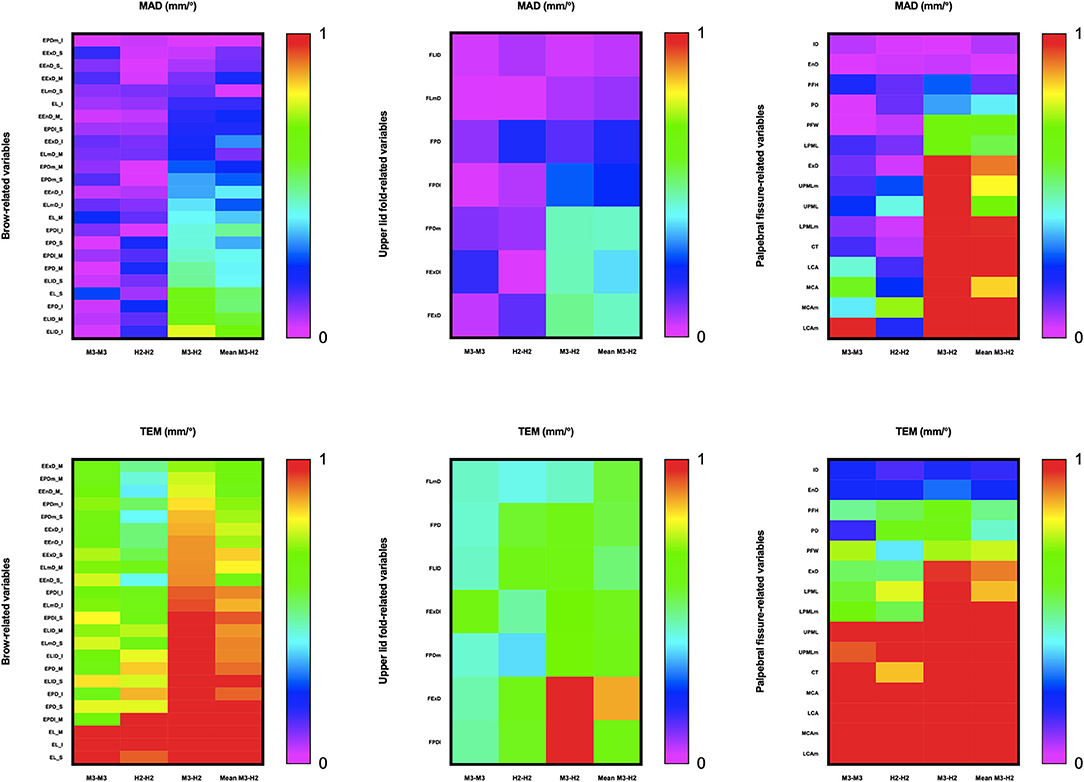
Figure 4. Intra- and inter-device mean absolute difference (MAD) and technical error of measurement (TEM) for periocular measurements on all 3D images. The acceptable error threshold is set to 1 unit.
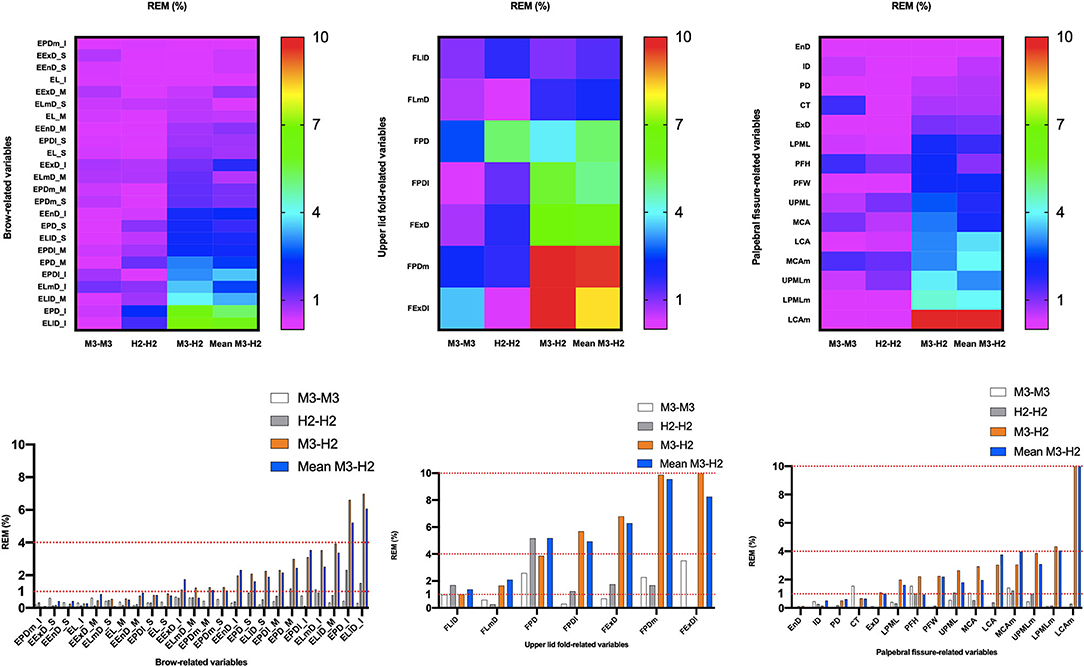
Figure 5. Intra- and inter-device relative error of measurement (REM) for all periocular region measurements of 3D images. Reliability category criteria were as follows: excellent, <1%; very good, 1–3.9%; good, 4–6.9%; moderate, 7–9.9%; and poor, >10%.
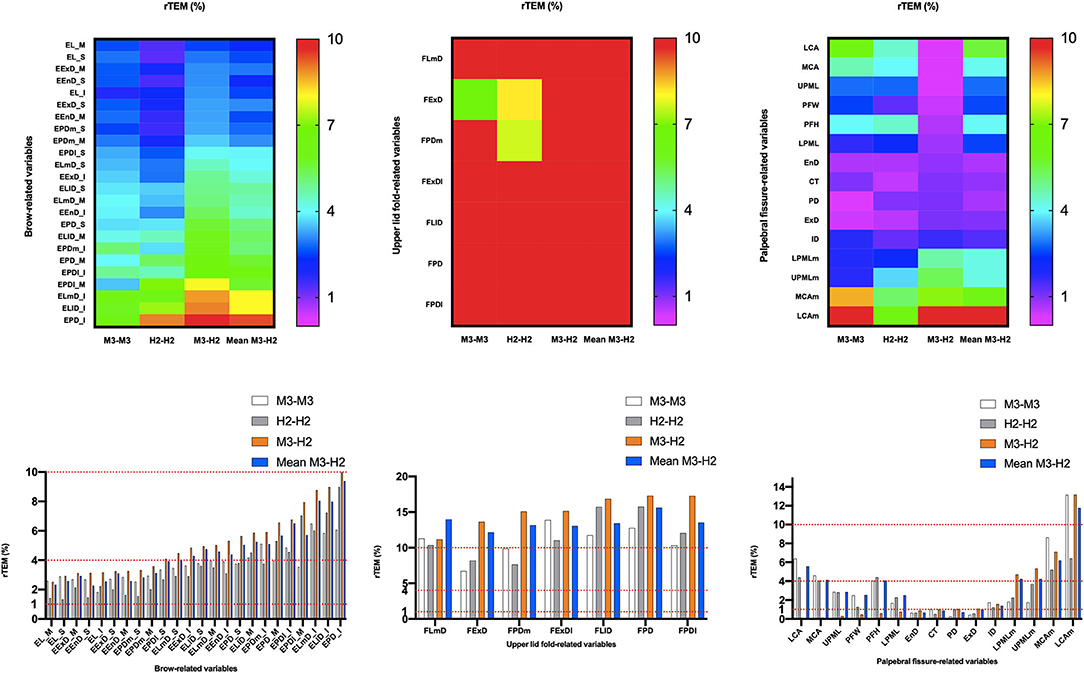
Figure 6. Intra- and inter-device of relative technical error of measurement (rTEM) for all periocular region measurements of 3D images. Reliability category criteria were as follows: excellent, <1%; very good, 1–3.9%; good, 4–6.9%; moderate, 7–9.9%; and poor, >10%.
Intra-Device Reliability With VECTRA H2
Intra-device ICC (Table 4, Figure 3) was above 0.75 for most variables measured by device H2, except for one eyebrow-related parameter (EPDl_M) and three upper lid fold-related variables (FPD, FLl, and FPDl), with an ICC between 0.4 and 0.75. Figure 4 and Table 6 show that all 49 parameters with a MAD and 41 parameters with TEM had a value of <1 unit (87.5% of eyebrow-related variables, 100% of upper lid fold-related variables, and 60% of palpebral fissure-related variables). The largest measurement error was the palpebral fissure-related variable LCAm (4.03°); 28.6% of upper lid fold-related variables showed an REM <1%, 57.1% had variables between 1 and 3.9%, and the maximum value of FPD was 5.163%. All these variables had an rTEM >7%, 28.6% of these variables had an rTEM between 7 and 10%, and 71.4% had an rTEM >10%; the maximum value was FPD (rTEM = 15.76%). All palpebral fissure-related variables showed an REM and rTEM <7% (80% of REM and 26.7% of rTEM values were <1%, 20% of REM and 40% of rTEM values were between 1 and 3.9%, and 33.3% of rTEM values were between 4 and 6.9%). Except for EPDl_M, ELlD_I, and EPD_I with an rTEM >7%, REM and rTEM were <7% across all brow-related variables (87.5% of variables had an REM <1%, 70.8% of rTEM and 12.5% of REM variables were between 1 and 3.9%, and 16.7% of rTEM values were between 4 and 6.9%).
Inter-Device Reliability Between VECTRA H2 and VECTRA M3
When the first captures of both devices (M3 and H2) were used to compare inter-device reliability; 33 variables showed an ICC (Table 5) >0.75 (83.3% of brow-related variables and 73.3% of palpebral fissure-related variables), 15 variables had ICC values between 0.4 and 0.75 (16.7% of brow-related variables, 100% of upper eyelid fold-related variables, and 20% of palpebral fissure-related variables). The smallest ICC value was for a palpebral fissure-related variable, LCAm (ICC = 0.39). Forty-one variables had an MAD <1 unit (100% of eyebrow-related variables, 100% of upper eyelid fold-related variables, and 53.3% of palpebral fissure-related variables), and the highest MAD value was for LCAm (6.825°). Twenty-eight measurements had a TEM <1 unit (62.5% of brow-related variables, 85.7% of upper eyelid fold-related variables, and 40% of palpebral fissure-related variables), and LCAm (8.731°) had the highest TEM value. Only the rTEM of EnD and 14 variables (including EnD) of REM were <1% (41.7% of eyebrow-related variables and 26.7% of palpebral fissure-related variables; Figure 5). Thirteen variables of rTEM (37.5% of eyebrow-related variables and 26.7% of palpebral fissure-related variables) and 24 variables of REM (50% of brow-related variables, 42.9% of upper eyelid fold-related variables, and 60% of palpebral fissure-related variables) were between 1 and 3.9%, respectively; 13 rTEM (45.8% of brow-related variables and 13.3% of palpebral fissure-related variables) and five REM (37.5% of brow-related variables, 28.6% of upper eyelid fold-related variables, and 6.7% of palpebral fissure-related variables) variables were between 4 and 6.9%; four rTEM (12.5% of eyebrow-related variables and 28.6% of upper eyelid fold-related variables) and one REM (28.6% of upper eyelid fold-related variables) variables were between 7 and 10%. Nine rTEM (4.2% of brow-related variables, 100% of upper eyelid fold-related variables, and 6.7% [1/15] of palpebral fissure-related variables) and two REM values (28.6% [1/7] of upper eyelid fold-related variables and 6.7% of palpebral fissure-related variables) were >10%. The largest rTEM value was FPD (17.29%), while the largest REM value was LCAm (10.31%).
When the mean of two scans for each device was used for comparison, 39 variables had an ICC >0.75, and the remaining 10 variables were between 0.4 and 0.75. Forty-four measurements had a MAD of <1 unit, and 35 measurements had a TEM of <1 unit. Four rTEM and 16 REM values were <1%, 14 rTEM and 21 REM values were between 1 and 3.9%, and 17 rTEM and 6 REM values were between 4 and 6.9%. Three rTEM and two REM values were between 7 and 10%, and eight rTEM and one REM values were >10%. Overall, applying the average of the two captures mildly improved inter-device reliability compared to using only the first capture.
Discussion
We validated the reliability of portable devices in periocular applications for the first time using a periocular marker developed by Guo et al. (21). The mean results for the intra-device reliability metrics of MAD (0.13 and 0.12 units), REM (0.61 and 0.68%), TEM (1.02 and 0.80 units), rTEM (5.51 and 4.43%), and ICC (0.89 and 0.89) for devices M3 and H2 were highly comparable. For inter-device comparisons, the mean MAD, REM, TEM, rTEM, and ICC were 0.63 units, 2.83%, 1.31 units, 7.62%, and 0.79 units, respectively (0.62 units, 2.69%, 1.10 units, 5.57%, and 0.83 units if the mean values of H2 and M3 were used). Inter-device reliability decreased compared to intra-device reliability and all reliability metrics improved when quoting average values, indicating that we can reduce inter-device variation by using the average of the two captured images when the H2 device is used for photography.
Guo et al. first introduced 52 new periocular landmarks and validated the high reliability of the static VECTRA M3 stereophotogrammetric system for periocular anthropometry (21). The imaging system and landmarks were highly reliable for most measurements. Intra-rater measurements had the highest reliability, followed by inter-rater and intra-device measurements. The results of the M3 intra-device reliability analysis included MAD (0.98 units), REM (4.66%), TEM (0.96 units), rTEM (4.64%), and ICC (0.96). Our results were generally consistent with the aforementioned study, and some indicators were even more reliable.
Several recent studies have validated the reliability of portable stereophotogrammetric devices for facial imaging (5, 31). Camison et al. (5) verified that the portable VECTRA H1 and static 3dMD devices were highly comparable in facial imaging: 136 linear distances had an inter-device mean rTEM value of 1.13% (range, 0.44–2.48%). Fifty-five of these distances (40.4%) were in the “excellent” category (<1%), while the remaining 81 distances (59.6%) were in the “very good” range (<3.9%) (TEM, 0.84 mm). Gibelli et al. (31) and Kim et al. (34) compared the portable VECTRA H1 device with the static VECTRA M3 device in terms of the linear, angular, surface area, and volume measurement for reliability. The results, except for the lip and periocular regions, showed high repeatability for most linear, angular, and surface area measurements in M3 vs. M3, H1 vs. H1, and M3 vs. H1 comparisons (range, 82.2–98.7%; TEM, range, 0.3–2.0 mm, 0.4–1.8 degrees; rTEM, range, 0.2–3.1%). rTEM was primarily classified to provide excellent intra-device and good inter-device comparisons. Notably, they validated the results mainly for the non-periocular regions of the face, thus assessing significant differences in the linear distance and angular type of validation. The current results are generally less reliable than previous studies, possibly due to the eye movements reported in the previous literature (35, 36). Furthermore, the measurements in the periocular region are all small, and previous studies have reported that reliability decreases as measurements decrease (37, 38).
Specifically, the highest reliability was found for most palpebral fissure-related variables in various comparisons, with rTEM primarily categorized as excellent, very good, or good within devices (M3 vs. M3: 0.26–6.39% and H2 vs. H2: 0.51–6.42%). Simultaneously, M3 and H2 comparisons were also excellent, very good, or good (0.02–5.34% and 0.66–6.20%) (first assessment and mean). The next most reliable assessment was for eyebrow-related variables, and within-device rTEM was mainly classified as very good or good (M3 vs. M3: 1.82–6.49% and H2 vs. H2: 1.33–6.02%), while M3 and H2 comparisons were also good (2.52–6.76% and 2.27–6.51%, respectively) (first evaluation and mean). The worst reliability was for the upper eyelid fold-related variables. Within-device rTEM was mainly classified as moderate or poor (M3 vs. M3: 9.88–13.87% and H2 vs. H2: 7.65–15.76%), while M3 compared to H1 (first evaluation and mean) had poor rTEM (11.15–17.29% and 12.15–15.61%, respectively).
TEM and rTEM values were generally consistent and reliable in their respective intra-device comparisons when using M3 and H2 scans for periocular data measurements. In contrast, TEM and rTEM values deteriorated in the M3 vs. H2 comparison. This result may be due to the strong effect of involuntary head and eye movements during acquisition using the H2 device as it requires three consecutive images to be acquired, while the static M3 device acquires the same images simultaneously.
One limitation of the current study comes from the volunteers; only cooperative adults could be invited to participate because it is difficult to ensure that head, eye, and eyelid positions do not shift in children and non-cooperative individuals. Additionally, all data were collected at a fixed location, thus not fully reflecting the portability of the H2 device. Furthermore, the current study involved linear distance, curve, and angle measurements of the periocular region, without measuring its area and volume. Therefore, this study focused on comparing the differences in periocular measurements between healthy Caucasian adults on the two devices and did not include age, race, and patients in the study. Further studies should evaluate the device's reliability in different age groups, different ethnicities, bedside or other indoor settings for patients with limited mobility and the periocular area and volume measurement.
Conclusions
The intra-device reliability of the two categories of devices in this study was generally consistent, with a slightly poorer inter-device agreement. The palpebral fissure-related variables and eyebrow-related variables had good reliability both within and between devices. This validation study explored the measurement of linear distance, angle, and curve values in the periocular region with the new portable device VECTRA H2, making an essential contribution to validating the VECTRA H2 device in the periocular region. Previous studies used the earlier generation of portable devices, VECTRA H1, and mainly verified the reliability in non-ocular locations of the face. Compared to static devices, portable instruments are relatively inexpensive and location-independent, allowing photography for patients with limited mobility or in remote areas. However, it is disadvantageous in that it has slightly lower reliability than static devices. Therefore, we need to select the most suitable instrument for future clinical applications according to what the actual situation presents.
Data Availability Statement
The original contributions presented in the study are included in the article/supplementary material, further inquiries can be directed to the corresponding authors.
Ethics Statement
The studies involving human participants were reviewed and approved by the Ethics Committee of Cologne University. The patients/participants provided their written informed consent to participate in this study. Written informed consent was obtained from the individual(s) for the publication of any potentially identifiable images or data included in this article.
Author Contributions
WF, AR, and LH: conception, design, and provision of study materials and participants. LH: administrative support. All authors: collection and assembly of data, data analysis and interpretation, and manuscript writing. All authors contributed to the article and approved the submitted version.
Funding
This study was supported by State Scholarship Fund from the China Scholarship Council (No. 202008080258).
Conflict of Interest
The authors declare that the research was conducted in the absence of any commercial or financial relationships that could be construed as a potential conflict of interest.
Publisher's Note
All claims expressed in this article are solely those of the authors and do not necessarily represent those of their affiliated organizations, or those of the publisher, the editors and the reviewers. Any product that may be evaluated in this article, or claim that may be made by its manufacturer, is not guaranteed or endorsed by the publisher.
Acknowledgments
The authors thank Editage (www.editage.com) for English language editing. The authors also thank Canfield Scientific GmbH, Bielefeld, Germany for providing the H2 free of charge.
References
1. Verhulst A, Hol M, Vreeken R, Becking A, Ulrich D, Maal T. Three-dimensional imaging of the face: a comparison between three different imaging modalities. Aesthetic Surg J. (2018) 38:579–85. doi: 10.1093/asj/sjx227
2. Choi JW, Lee JY, Oh T-S, Kwon SM, Yang SJ, Koh KS. Frontal soft tissue analysis using a 3 dimensional camera following two-jaw rotational orthognathic surgery in skeletal class III patients. J Cranio Maxillofacial Surg. (2014) 42:220–6. doi: 10.1016/j.jcms.2013.05.004
3. Jung J, Lee CH, Lee JW, Choi BJ. Three dimensional evaluation of soft tissue after orthognathic surgery. Head Face Med. (2018) 14:21. doi: 10.1186/s13005-018-0179-z
4. Terzic A, Schouman T, Scolozzi P. Accuracy of morphological simulation for orthognatic surgery. Assessment of a 3D image fusion software. Rev Stomatol Chir Maxillofac Chir Orale. (2013) 114:276–82. doi: 10.1016/j.revsto.2013.06.007
5. Camison L, Bykowski M, Lee WW, Carlson JC, Roosenboom J, Goldstein JA, et al. Validation of the Vectra H1 portable three-dimensional photogrammetry system for facial imaging. Int J Oral Maxillofacial Surg. (2018) 47:403–10. doi: 10.1016/j.ijom.2017.08.008
6. Meier JD, Glasgold RA, Glasgold MJ. 3D photography in the objective analysis of volume augmentation including fat augmentation and dermal fillers. Facial Plast Surg Clin North Am. (2011) 19:725–35, ix. doi: 10.1016/j.fsc.2011.07.012
7. Miller TR. Long-term 3-dimensional volume assessment after fat repositioning lower blepharoplasty. JAMA Facial Plast Surg. (2016) 18:108–13. doi: 10.1001/jamafacial.2015.2184
8. Jacono AA, Bryant LM, Ahmedli NN. A novel extended deep plane facelift technique for jawline rejuvenation and volumization. Aesthet Surg J. (2019) 39:1265–81. doi: 10.1093/asj/sjy292
9. Kunjur J, Sabesan T, Ilankovan V. Anthropometric analysis of eyebrows and eyelids: an inter-racial study. Br J Oral Maxillofac Surg. (2006) 44:89–93. doi: 10.1016/j.bjoms.2005.03.020
10. Liu Y, Kau CH, Pan F, Zhou H, Zhang Q, Zacharopoulos GV. A 3-dimensional anthropometric evaluation of facial morphology among Chinese and Greek population. J Craniofac Surg. (2013) 24:e353–8. doi: 10.1097/SCS.0b013e3182902e5d
11. Erbagci I, Erbagci H, Kizilkan N, Gumusburun E, Bekir N. The effect of age and gender on the anatomic structure of Caucasian healthy eyelids. Saudi Med J. (2005) 26:1535–8.
12. Sforza C, Grandi G, Catti F, Tommasi DG, Ugolini A, Ferrario VF. Age- and sex-related changes in the soft tissues of the orbital region. Forensic Sci Int. (2009) 185:115.e1–8. doi: 10.1016/j.forsciint.2008.12.010
13. Cartwright MJ, Kurumety UR, Nelson CC, Frueh BR, Musch DC. Measurements of upper eyelid and eyebrow dimensions in healthy white individuals. Am J Ophthalmol. (1994) 117:231–4. doi: 10.1016/S0002-9394(14)73081-8
14. Metzler P, Sun Y, Zemann W, Bartella A, Lehner M, Obwegeser JA, et al. Validity of the 3D VECTRA photogrammetric surface imaging system for cranio-maxillofacial anthropometric measurements. Oral Maxillofacial Surg. (2014) 18:297–304. doi: 10.1007/s10006-013-0404-7
15. Dindaroglu F, Kutlu P, Duran GS, Görgülü S, Aslan E. Accuracy and reliability of 3D stereophotogrammetry: a comparison to direct anthropometry and 2D photogrammetry. Angle Orthodontist. (2016) 86:487–94. doi: 10.2319/041415-244.1
16. Modabber A, Peters F, Kniha K, Goloborodko E, Ghassemi A, Lethaus B, et al. Evaluation of the accuracy of a mobile and a stationary system for three-dimensional facial scanning. J Cranio Maxillofacial Surg. (2016) 44:1719–24. doi: 10.1016/j.jcms.2016.08.008
17. Guo Y, Schaub F, Mor JM, Jia R, Koch KR, Heindl LM. A simple standardized three-dimensional anthropometry for the periocular region in a European population. Plast Reconstr Surg. (2020) 145:514e−23e. doi: 10.1097/PRS.0000000000006555
18. Guo Y, Rokohl AC, Lin M, Heindl LM. Three-dimensional anthropometry in periorbital region. Ann Eye Sci. (2020) 6:8. doi: 10.21037/aes-20-99
19. Hou X, Rokohl AC, Meinke MM, Li S, Liu J, Fan W, et al. A novel standardized distraction test to evaluate lower eyelid tension using three-dimensional stereophotogrammetry. Quantitative Imaging Med Surg. (2021) 11:3735–48. doi: 10.21037/qims-20-1016
20. Hou X, Rokohl AC, Meinke MM, Liu J, Li S, Fan W, et al. Standardized three-dimensional lateral distraction test: its reliability to assess medial canthal tendon laxity. Aesthetic Plast Surg. (2021) 45:2798–807. doi: 10.1007/s00266-021-02440-y
21. Guo Y, Rokohl AC, Schaub F, Hou X, Liu J, Ruan Y, et al. Reliability of periocular anthropometry using three-dimensional digital stereophotogrammetry. Graefes Arch Clin Exp Ophthalmol. (2019) 257:2517–31. doi: 10.1007/s00417-019-04428-6
22. Guo Y, Hou X, Rokohl AC, Jia R, Heindl LM. Reliability of periocular anthropometry: a comparison of direct, 2-dimensional, 3-dimensional techniques. Dermatol Surg. (2020) 46:e23–31. doi: 10.1097/DSS.0000000000002243
23. Guo Y, Liu J, Ruan Y, Rokohl AC, Hou X, Li S, et al. A novel approach quantifying the periorbital morphology: a comparison of direct, 2-dimensional, 3-dimensional technologies. J Plast Reconstr Aesthet Surg. (2021) 74:1888–99. doi: 10.1016/j.bjps.2020.12.003
24. Liu J, Guo Y, Arakelyan M, Rokohl AC, Heindl LM. Accuracy of areal measurement in the periocular region using stereophotogrammetry. J Oral Maxillofac Surg. (2021) 79:1106.e1–9. doi: 10.1016/j.joms.2020.12.015
25. Liu J, Rokohl AC, Guo Y, Li S, Hou X, Fan W, et al. Reliability of stereophotogrammetry for area measurement in the periocular region. Aesthetic Plast Surg. (2021) 45:1601–10. doi: 10.1007/s00266-020-02091-5
26. Tzou C-HJ, Artner NM, Pona I, Hold A, Placheta E, Kropatsch WG, et al. Comparison of three-dimensional surface-imaging systems. J Plastic Reconstructive Aesthetic Surg. (2014) 67:489–97. doi: 10.1016/j.bjps.2014.01.003
27. Birgfeld CB, Saltzman BS, Luquetti DV, Latham K, Starr JR, Heike CL. Comparison of two-dimensional and three-dimensional images for phenotypic assessment of craniofacial microsomia. Cleft Palate Craniofac J. (2013) 50:305–14. doi: 10.1597/11-173
28. Naudi KB, Benramadan R, Brocklebank L, Ju X, Khambay B, Ayoub A. The virtual human face: superimposing the simultaneously captured 3D photorealistic skin surface of the face on the untextured skin image of the CBCT scan. Int J Oral Maxillofac Surg. (2013) 42:393–400. doi: 10.1016/j.ijom.2012.10.032
29. Yamamoto S, Miyachi H, Fujii H, Ochiai S, Watanabe S, Shimozato K. Intuitive facial imaging method for evaluation of postoperative swelling: a combination of 3-dimensional computed tomography and laser surface scanning in orthognathic surgery. J Oral Maxillofac Surg. (2016) 74:2506.e1–10. doi: 10.1016/j.joms.2016.08.039
30. Knoops PG, Beaumont CA, Borghi A, Rodriguez-Florez N, Breakey RW, Rodgers W, et al. Comparison of three-dimensional scanner systems for craniomaxillofacial imaging. J Plast Reconstr Aesthet Surg. (2017) 70:441–9. doi: 10.1016/j.bjps.2016.12.015
31. Gibelli D, Pucciarelli V, Cappella A, Dolci C, Sforza C. Are portable stereophotogrammetric devices reliable in facial imaging? A validation study of VECTRA H1 device. J Oral Maxillofac Surg. (2018) 76:1772–84. doi: 10.1016/j.joms.2018.01.021
32. Ulijaszek SJ, Kerr DA. Anthropometric measurement error and the assessment of nutritional status. Br J Nutr. (1999) 82:165–77. doi: 10.1017/S0007114599001348
33. Andrade LM, Rodrigues da Silva AMB, Magri LV, Rodrigues da Silva MAM. Repeatability study of angular and linear measurements on facial morphology analysis by means of stereophotogrammetry. J Craniofac Surg. (2017) 28:1107–11. doi: 10.1097/SCS.0000000000003554
34. Kim AJ, Gu D, Chandiramani R, Linjawi I, Deutsch ICK, Allareddy V, et al. Accuracy and reliability of digital craniofacial measurements using a small-format, handheld 3D camera. Orthod Craniofac Res. (2018) 21:132–9. doi: 10.1111/ocr.12228
35. de Menezes M, Rosati R, Allievi C, Sforza C. A photographic system for the three-dimensional study of facial morphology. Angle Orthod. (2009) 79:1070–7. doi: 10.2319/111008-570
36. Ferrario VF, Sforza C, Poggio CE, Cova M, Tartaglia G. Preliminary evaluation of an electromagnetic three-dimensional digitizer in facial anthropometry. Cleft Palate Craniofac J. (1998) 35:9–15. doi: 10.1597/1545-1569(1998)035<0009:PEOAET>2.3.CO;2
37. Jamison PL, Ward RE. Brief communication: measurement size, precision, and reliability in craniofacial anthropometry: bigger is better. Am J Phys Anthropol. (1993) 90:495–500. doi: 10.1002/ajpa.1330900409
Keywords: three-dimensional anthropometry, portable stereophotogrammetry devices, validity, reliability, periocular morphology
Citation: Fan W, Guo Y, Hou X, Liu J, Li S, Ju S, Matos PAW, Simon M, Rokohl AC and Heindl LM (2022) Validation of the Portable Next-Generation VECTRA H2 3D Imaging System for Periocular Anthropometry. Front. Med. 9:833487. doi: 10.3389/fmed.2022.833487
Received: 11 December 2021; Accepted: 08 February 2022;
Published: 11 March 2022.
Edited by:
Peng Xiao, Sun Yat-sen University, ChinaReviewed by:
Jules-Raymond Tapamo, University of KwaZulu-Natal, South AfricaMin Wang, University of Texas at San Antonio, United States
Copyright © 2022 Fan, Guo, Hou, Liu, Li, Ju, Matos, Simon, Rokohl and Heindl. This is an open-access article distributed under the terms of the Creative Commons Attribution License (CC BY). The use, distribution or reproduction in other forums is permitted, provided the original author(s) and the copyright owner(s) are credited and that the original publication in this journal is cited, in accordance with accepted academic practice. No use, distribution or reproduction is permitted which does not comply with these terms.
*Correspondence: Alexander C. Rokohl, YWxleGFuZGVyLnJva29obEB1ay1rb2Vsbi5kZQ==; Ludwig M. Heindl, bHVkd2lnLmhlaW5kbEB1ay1rb2Vsbi5kZQ==
†These authors have contributed equally to this work and share senior authorship
 Wanlin Fan
 Yongwei Guo
 Xiaoyi Hou
 Jinhua Liu
 Senmao Li
 Sitong Ju
 Philomena Alice Wawer Matos
 Michael Simon
 Alexander C. Rokohl
 Ludwig M. Heindl