 Cheng Ding1
 Ming Hu1Yanwan Shangguan1Wanru Guo1Shuting Wang1Xuewen Feng1Zunjing Zhang2Ying Zhang1*
 Kaijin Xu1*
- 1State Key Laboratory for Diagnosis and Treatment of Infectious Diseases, National Clinical Research Center for Infectious Diseases, National Medical Center for Infectious Diseases, Collaborative Innovation Center for Diagnosis and Treatment of Infectious Diseases, The First Affiliated Hospital, Zhejiang University School of Medicine, Hangzhou, China
- 2Lishui Hospital of TCM, Lishui, China
Objective: To estimate the epidemic trends of tuberculosis (TB) in 30 high burden countries (HBCs) over the past 30 years, which is crucial for tracking the status of disease control, especially at the country level.
Methods: Annual data on incidence and mortality of TB in these 30 HBCs were extracted from the Global Burden of Disease database. The average annual percent change (AAPC) was used to evaluate the trends of incidence and mortality. The trajectory analysis was used to identify different trends among the subgroup countries. The predicted incidence and mortality rates in 2025, 2030, and 2035 were also calculated.
Results: The incidence and mortality decreased in most of the HBCs. The AAPCs of incidence ranged between −4.0 (Indonesia) and −0.2% (DR Congo) (all p < 0.05). The incidence trends in Lesotho (AAPC: 0%, 95% CI: −0.4, 0.3, p = 0.8) and South Africa (AAPC: −0.2%, 95% CI: −0.5, 0, p = 0.1) were stable, and increased in Kenya with AAPC of 0.1% (95% CI: 0.1, 0.2, p < 0.05). The AAPCs for mortality ranged between −5.8 (Ethiopia) and −0.6% (Central African Republic) (all p < 0.05). The mortality trends in DPR Korea (AAPC: 0.1%, 95% CI: −0.3, 0.4, p = 0.6) and Russian Federation (AAPC: −0.5%, 95% CI: −1.9, 0.9, p = 0.5) were stable, and increased in Lesotho and Zimbabwe with AAPC of 1.3% (95% CI: 1.1, 1.4, p < 0.05) and 1.6% (95% CI: 1.0, 2.2, p < 0.05), respectively. Trajectory analysis showed that the Central African Republic, Lesotho, Cambodia, Namibia, and South Africa had higher incidences, and the Central African Republic had higher mortality. Brazil and China had relatively lower rates of incidence and mortality. Predictions showed that reduction rates of incidence and mortality could hardly be reached compared with those set for the global targets for the majority HBCs.
Conclusions: The disease burden of TB has been reduced among the majority HBCs over the last three decades. According to the current control levels, achieving the ambitious global targets at the country level for these 30 HBCs is challenging.
Introduction
Tuberculosis (TB) is caused by Mycobacterium tuberculosis and has affected humans for thousands of years (1) as the disease has occurred in every country around the world. Although TB can be completely cured with the proper treatment regimen, it remains one of the top 10 causes and the leading cause of death from a single infectious agent in 2019 (2) and the second only behind COVID-19 in 2020 (1.5 million died due to TB) (3). Although a reduction was observed in the absolute number of deaths from 2.38 million in 2000 to 1.41 million in 2019, the number of cases declined slowly in both absolute terms and per capita in recent years (2).
Global Burden of Disease (GBD) studies illustrated a heavy global burden of TB with 9.02 million incident cases and 1.21 million deaths in 2016 (4). Among all diseases judged by prevalent cases, TB ranked the third leading cause in 1990 and became the fourth in 2017 (5). Burden of TB varies greatly among countries and territories. Geographically, most TB cases were in the WHO regions of South-East Asia (44%), Africa (25%), and the Western Pacific (18%) in 2019. Particularly, the top 20 countries with the largest absolute numbers of estimated incident TB cases accounted for 84% of global incident cases (2). To provide a focus for global action, the 20 countries plus the top 10 countries with the highest estimated TB incidence rate are currently listed as the 30 high burden countries (HBCs) (2).
Global efforts to reduce the disease burden were focused on achieving targets within the context of the Millennium Development Goals (6), which were succeeded by the Sustainable Development Goals (7), and the post-2015 global TB strategy—the End TB Strategy—for the period 2016−2035 (8, 9). The main milestones and targets are quantified as 75% reduction in deaths and 50% reduction in the incidence (or <55 per 100,000) in 2025, and 90 and 80% (or <20 per 100,000) in 2030, and 95 and 90% (or <10 per 100,000) in 2035, compared with levels of 2015, respectively (8).
Evaluating epidemic trends and remaining challenges is crucial to tracking the success of TB prevention and control. The epidemics in these HBCs have a huge impact on achieving the goal of ending TB. However, currently, there is limited information on this issue. This study aims to assess the long-term epidemic trends among these HBCs, and additionally to provide unique insights on the feasibility of achieving the global targets at the country level.
Materials and Methods
Data Sources
Annual data on TB among the 30 HBCs from 1990 to 2019 were extracted by the Global Health Data Exchange (GHDx) query tool (10). Countries in the HBCs are: Angola, Bangladesh, Brazil, Cambodia, Central African Republic, China, Congo, Democratic People's Republic of Korea (DPR Korea), the Democratic Republic of the Congo (DR Congo), Ethiopia, India, Indonesia, Kenya, Lesotho, Liberia, Mozambique, Myanmar, Namibia, Nigeria, Pakistan, Papua New Guinea, Philippines, Russian Federation, Sierra Leone, South Africa, Thailand, United Republic of Tanzania (UR Tanzania), Vietnam, Zambia, and Zimbabwe (2).
The GHDx is a data catalog created and supported by the Institute for Health Metrics and Evaluation (IHME), which captures the health related data to populate the information for more than 350 diseases and injuries in 195 countries worldwide since 1990. The flexible design of the GBD makes it available for regular updates with new data and epidemiological studies involved (11). Protocols, data resources, definitions, efforts to improve the quality, and modeling were described in detail elsewhere (5, 12–14). Ethical approval was not required since the data included in this study were de-identified and publicly available.
Statistical Analysis
The incidence and mortality were used as the main indicators, and age-standardized rates (ASRs) of which were adjusted by the world standard population (15). The average annual percent change (AAPC, %) and its 95% CI were estimated. The natural logarithm of rate was assumed to be linear along with time; that was Y = α + βX + ε, where Y referred to ln (rate), X represented the calendar year, and ε was the error, β represented the trend of the period segment for rate. AAPC was calculated as [(Exp (β) – 1)] × 100, and its 95% CI was obtained from the linear model. The Z-test was used to assess whether an AAPC value was different from zero. Subgroup trend analyses, such as age groups (1–14, 15–59, and ≥60 years) and sexes were involved. The mortality to incidence (MI) ratio was used as an indicator of disease severity as well as the capability level of clinical treatment and management strategies. The mean socio-demographic index (SDI) during 1990 and 2019 was also calculated, which was a composite indicator based on income, education, and fertility (5, 16).
To estimate a discrete mixture model for clustering of longitudinal data, the trajectory analysis with a censored normal model was conducted to identify distinct epidemic trends of TB and to classify countries into different subgroups. The Bayesian Information Criterion (BIC) log Bayes factor was used as the degree of evidence favoring the alternative model to classify the subgroups of countries. Value with more than 6 of BIC log Bayes factor indicated strong evidence to favor the alternative (more complex) model (17). Based on the AAPCs and the predicted linear slopes from the trajectory models, the TB incidence and mortality rates for the HBCs regarding the milestones (2025, 2030) and targets (2035) at the country level were predicted.
Average annual percent changes were calculated by the Joinpoint Regression Program (Version 4.9.0.0. March 2021). The trajectory model was conducted by Proc Traj with SAS 9.4 (SAS Institute Inc., Cary, NC, USA) (18). Origin 2019 (Microcal Software Inc., Northampton, MA, USA) and SAS 9.4 were used to draw the figures. The statistical significance level was set at 0.05 (two-side).
Results
Epidemic Trends of TB in the HBCs
Most of the HBCs are located in areas of Africa and Southeast Asia (Figure 1A). From 1990 to 2019, the incident cases in these HBCs decreased from 7,426,466 to 7,165,583, with the incidence rate decreased from 228.78 (ASR: 368.69) per 100,000 to 148.81 (ASR: 228.74) per 100,000. India had the highest cumulative incidence cases, followed by China, Pakistan, and Indonesia. In 2019, the Central African Republic, Lesotho, Namibia, and South Africa had the highest incidence rates (above 300 per 100,000) compared with that (below 100 per 100,000) in Brazil, China, and Russian Federation (Figure 1B). The incidence in most HBCs decreased with AAPCs ranged between −4.0 (Indonesia) and −0.2% (DR Congo) (all p < 0.05) (Supplementary Figure 1). The incidence trends in Lesotho (AAPC: 0%, 95% CI: −0.4, 0.3, p = 0.8) and South Africa (AAPC: −0.2%, 95% CI: −0.5, 0, p = 0.1) were stable, while it increased in Kenya (AAPC: 0.1%, 95% CI: 0.1, 0.2, p < 0.05) (Figure 1C, Table 1, Supplementary Figure 1).
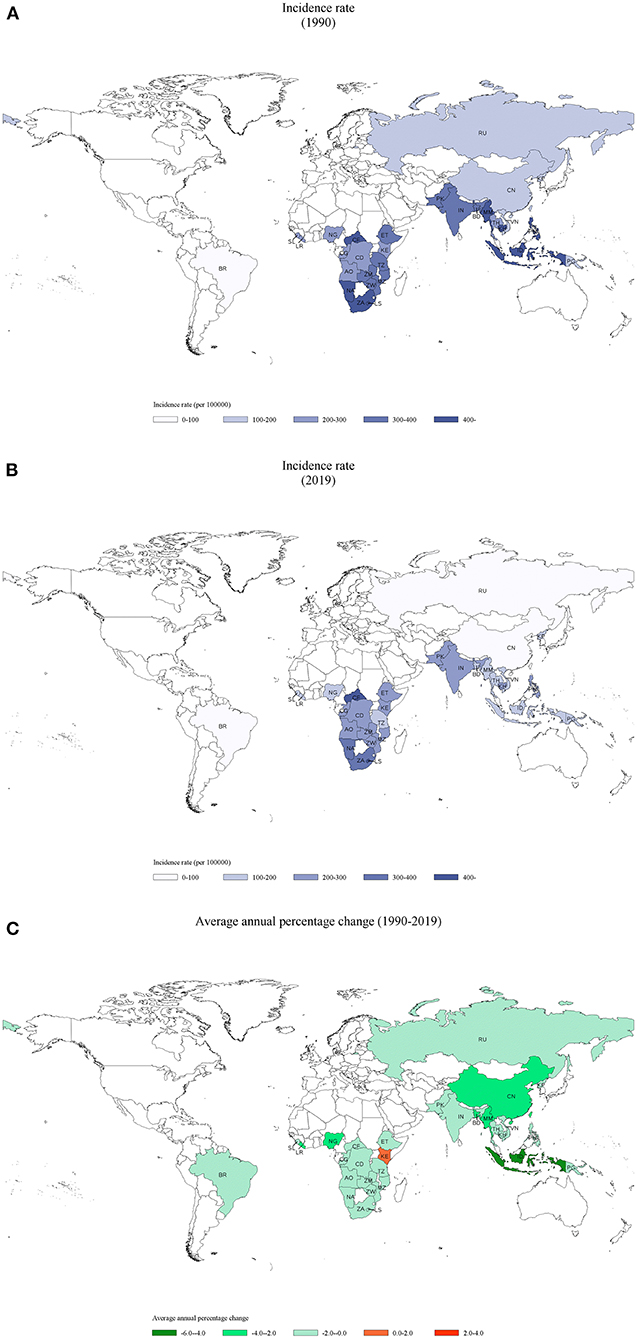
Figure 1. Incidence of tuberculosis in 30 HBCs and its average annual percent change (AAPC): (A) the incidence rate in 1990, (B) the incidence rate in 2019, (C) the AAPC of incidence rate from 1990 to 2019. HBC, high burden country; AO, Angola; BD, Bangladesh; BR, Brazil; KH, Cambodia; CF, Central African Republic; CN, China; CG, Congo; KP, Democratic People's Republic of Korea; CD, Democratic Republic of the Congo; ET, Ethiopia; IN, India; ID, Indonesia; KE, Kenya; LS, Lesotho; LR, Liberia; MZ, Mozambique; MM, Myanmar; NA, Namibia; NG, Nigeria; PK, Pakistan; PG, Papua New Guinea; PH, Philippines; RU, Russian Federation; SL, Sierra Leone; ZA, South Africa; TH, Thailand; TZ, United Republic of Tanzania; VN, Vietnam; ZM, Zambia; ZW, Zimbabwe.
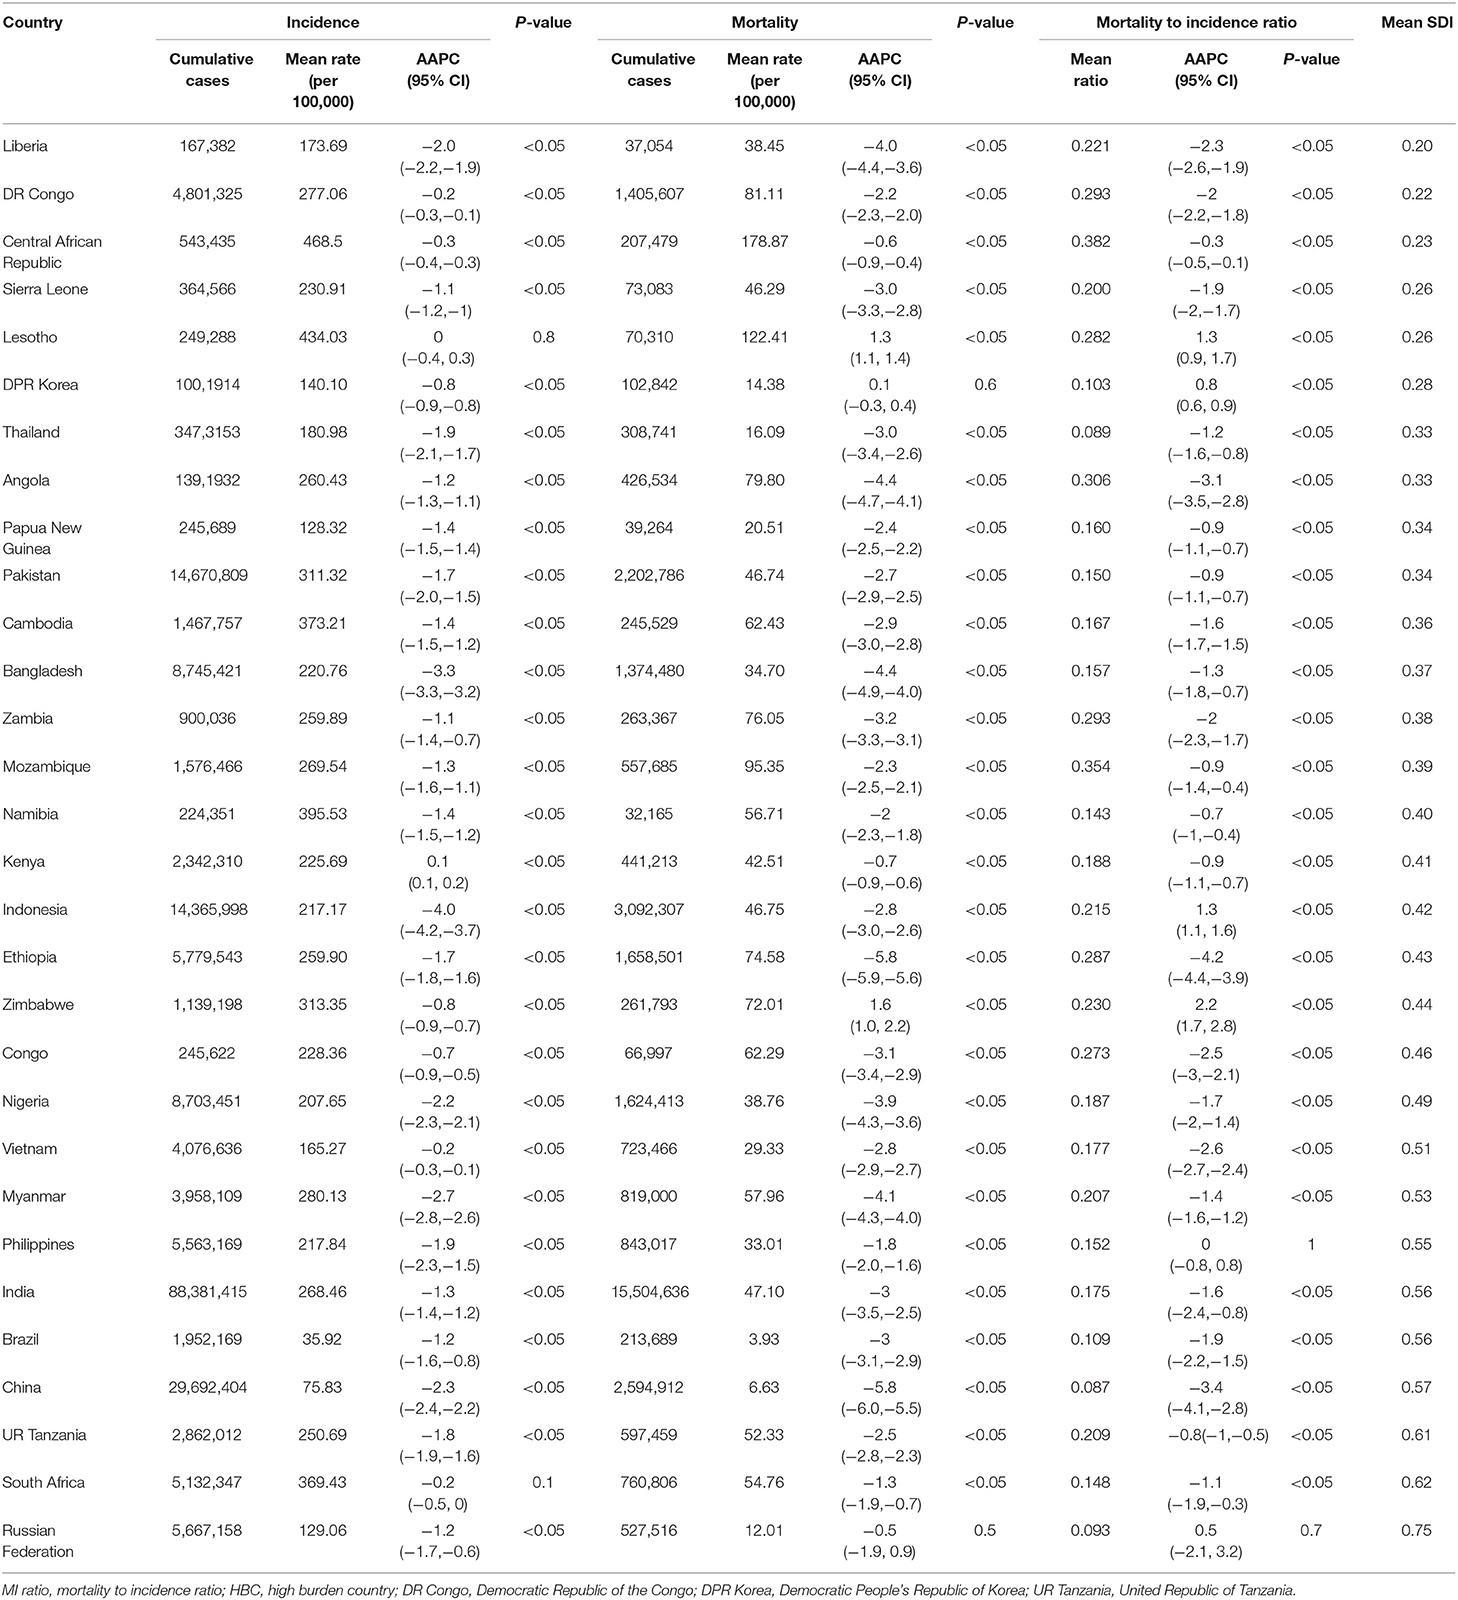
Table 1. Incidence, mortality, and MI ratio trends of tuberculosis (TB) in 30 HBCs, 1990–2019.
The mortality rate decreased from 44 (ASR: 119.01) per 100,000 to 19.71 (ASR: 57.89) per 100,000 from 1990 to 2019. At the county level, India had the highest cumulative deaths of 15,504,636. In 2019, Central African Republic and Lesotho had the highest mortality rates (above 100 per 100,000) compared with that (below 10 per 100,000) in Brazil, China, and Russian Federation. The mortality in most HBCs decreased with AAPCs ranged between −5.8 (Ethiopia) and −0.6% (Central African Republic) (all p < 0.05) (Supplementary Figure 1). The mortality trend in DPR Korea (AAPC: 0.1%, 95% CI: −0.3, 0.4, p = 0.6) and Russian Federation (AAPC: −0.5%, 95% CI: −1.9, 0.9, P = 0.5) were stable, while it increased in Lesotho and Zimbabwe with AAPC of 1.3% (95% CI: 1.1, 1.4, p < 0.05) and 1.6% (95% CI: 1.0, 2.2, p < 0.05), respectively (Table 1, Supplementary Figures 1, 2C).
The mean MI ratio varied from 0.087 (China) to 0.382 (Central African Republic), and decreased in most HBCs, with AAPCs ranging from −4.2 (Ethiopia) to −0.3% (Central African Republic) (all p < 0.05). The trends were stable in Philippines (AAPC: 0%, 95% CI: −0.8, 0.8, p = 1.0) and Russian Federation (AAPC: 0.5%, 95% CI: −2.1, 3.2, p = 0.7), while it increased in Zimbabwe, Lesotho, Indonesia, and DPR Korea, with the lowest AAPC of 0.8% (all p < 0.05) (Table 1, Supplementary Figure 3C). There was no relationship between the mean SDI values and AAPCs (Spearman's correlation: r = −0.16, p = 0.3883 for incidence; r = −0.06, p = 0.7602 for mortality; r = −0.002, p = 0.9916 for MI ratio).
Disease Burden Change of TB in Age and Sex Subgroups
The incidence and mortality decreased among the three age groups in the majority HBCs (Supplementary Figures 4, 5). Disease burden increased in the group aged 15–59 years in Lesotho (AAPC for incidence: 0.4%, 95% CI: 0.2, 0.7, p < 0.05; AAPC for mortality: 1.6%, 95% CI: 1.4, 1.8, p < 0.05). In South Africa, the incidence increased with AAPC of 0.1% (95% CI: 0.1, 0.2, p < 0.05) among aged 1–14 years group. The incidence trends were stable in the group aged 15–59 years in the Central African Republic, DR Congo, Kenya, and South Africa (p > 0.05). Increasing mortality trends was observed in the group aged 15–59 years in Lesotho (AAPC: 1.6%, 95% CI: 1.4, 1.8, p < 0.05) and Zimbabwe (AAPC: 1.8%, 95% CI: 0.9, 2.7, p < 0.05), and in the group aged ≥ 60 years in Zimbabwe (AAPC: 0.4%, 95% CI: 0.1, 0.7, p < 0.05). Among the groups aged 1–14 and 15–59 years in both sexes, Indonesia decreased most in incidence with the lowest AAPCs among those HBCs.
There were different incidence trends between men and women in South Africa, Zimbabwe, and Vietnam. The mortality increased in Lesotho (AAPC for men: 1.4%, 95% CI: 1.2, 1.5, p < 0.05; AAPC for women: 0.8%, 95% CI: 0.4, 1.2, p < 0.05) and Zimbabwe (AAPC for men: 1.4%, 95% CI: 0.8, 2.1, p < 0.05; AAPC for women: 1.5%, 95% CI: 1.0, 2.0, p < 0.05). Women had higher incidence rates in countries, such as DR Congo, Lesotho, Angola, Papua New Guinea, Pakistan, Namibia, Zimbabwe, Congo, UR Tanzania, and South Africa. Most of the above countries are located in Africa (Figure 2). Increasing trends in incidence were observed among men in groups aged 1–14 years (South Africa) and 15–59 years (DR Congo, Lesotho, Kenya, Zimbabwe, and Vietnam) (Figure 3). Mortality rates increased among men (Lesotho and Zimbabwe) and women (Lesotho, Zimbabwe, and Russian Federation) in the group aged 15–59 years, and among both sexes in the group aged ≥60 years (Zimbabwe) (Supplementary Figure 6).
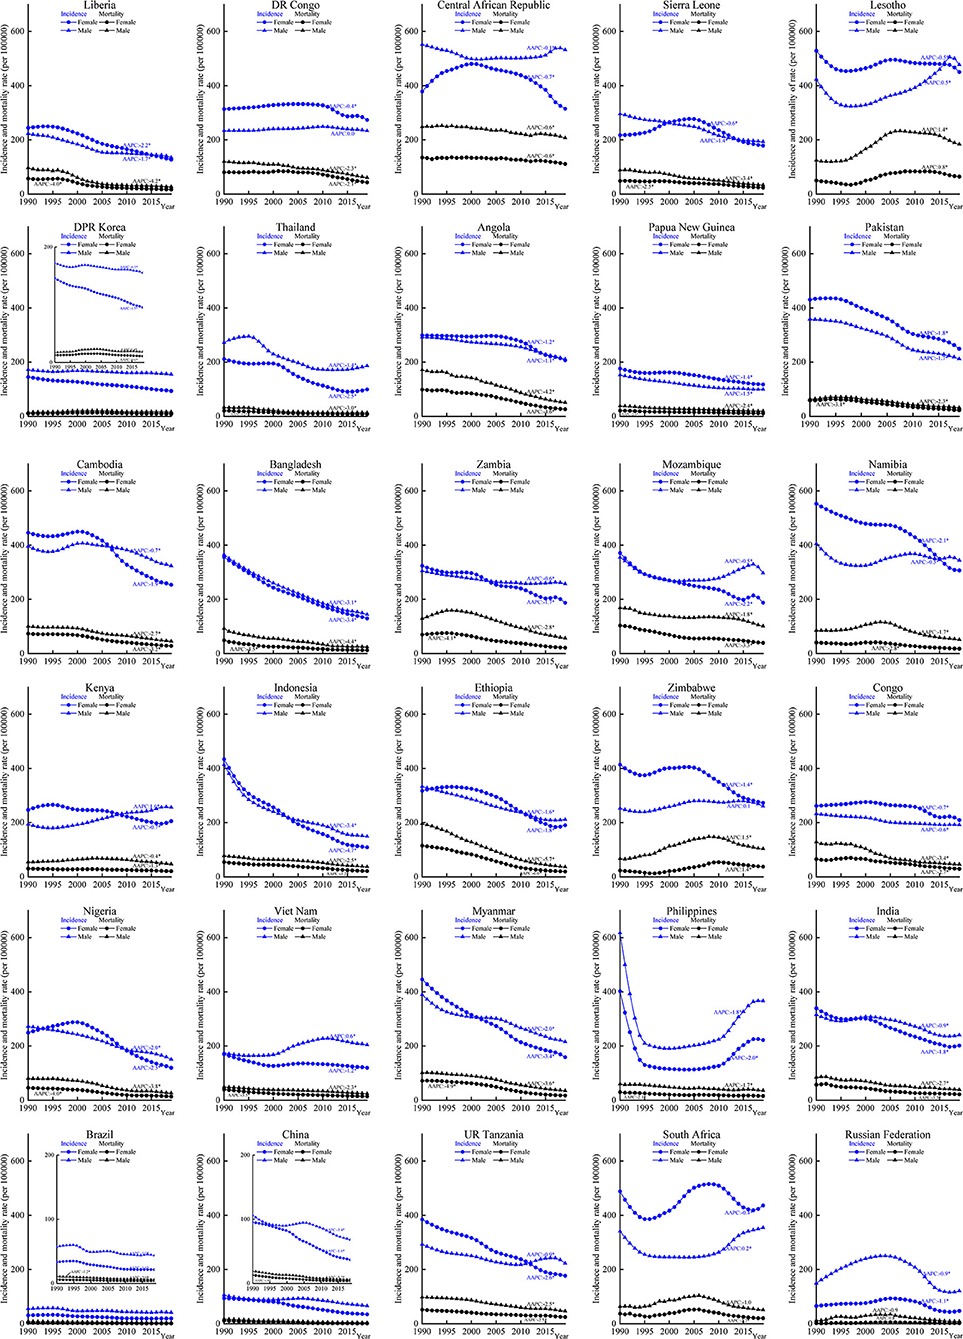
Figure 2. Incidence and mortality of tuberculosis (TB) by different sexes in the 30 HBCs, 1990–2019. HBC, high burden country; AAPC, average annual percent change; *, significant at 0.05 level.
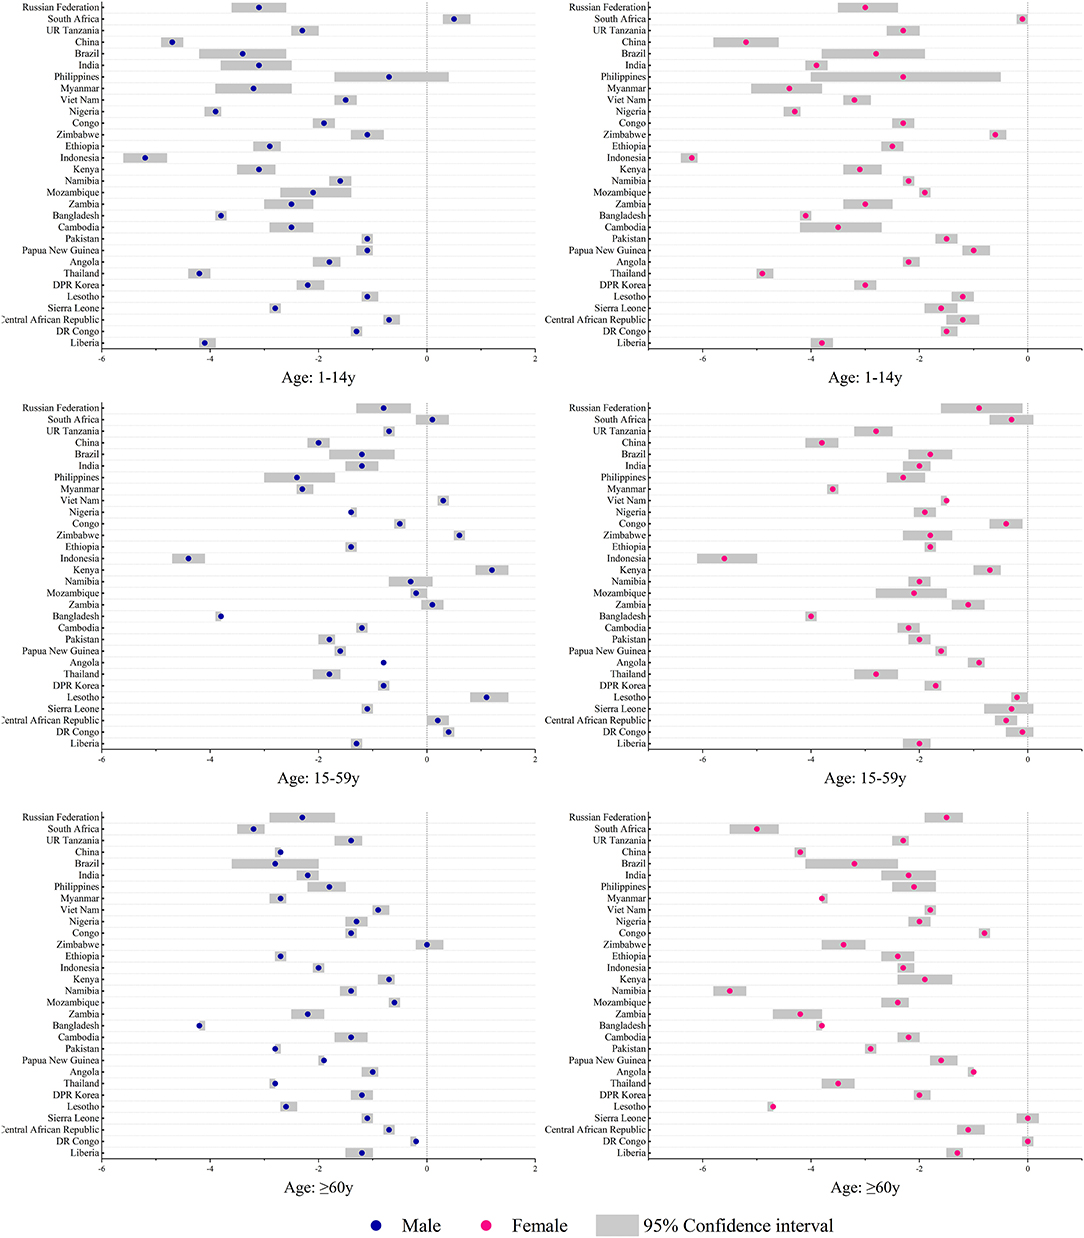
Figure 3. Average annual percent changes of incidence by different age and sex groups in the 30 HBCs, 1990–2019. HBC, high burden country.
The HBCs could be classified as 6 discrete groups by the indicator of incidence (Figure 4A). Group 2, 3, and 6 accounted for 21 (70%) countries. Group 1 (Brazil and China) had the lowest incidence rates while group 5 (Central African Republic, Lesotho, Cambodia, Namibia, and South Africa) had the highest rates. Group 6 had a higher slope value of −4.54 (p < 0.0001) while group 1 had the lowest (slope: −0.82, p = 0.1293). For mortality, there were 6 groups and one-third of the countries were in group 2 (Figure 4B). Group 1 (DPR Korea, Thailand, Papua New Guinea, Brazil, China, and Russian Federation) had the lowest mortality rates and group 6 (Central African Republic) had the highest rate. Five of the six groups showed decreasing trends of mortality except for group 4 (Lesotho, slope: 2.75, p < 0.0001). For MI ratio, group 2 (Lesotho, Indonesia, and Zimbabwe) showed an increasing trend (slope: 0.005, p < 0.0001), while other groups showed decreasing trends with slopes ranging from −0.009 to −0.001 (all p < 0.0002) (Figure 4C, Supplementary Table 1). Among those HBCs, Brazil and China had relatively lower values of incidence, mortality, and MI ratio. Lower mortality rates contributed to lower MI ratios, which were observed in DPR Korea, Thailand, and Russian Federation.
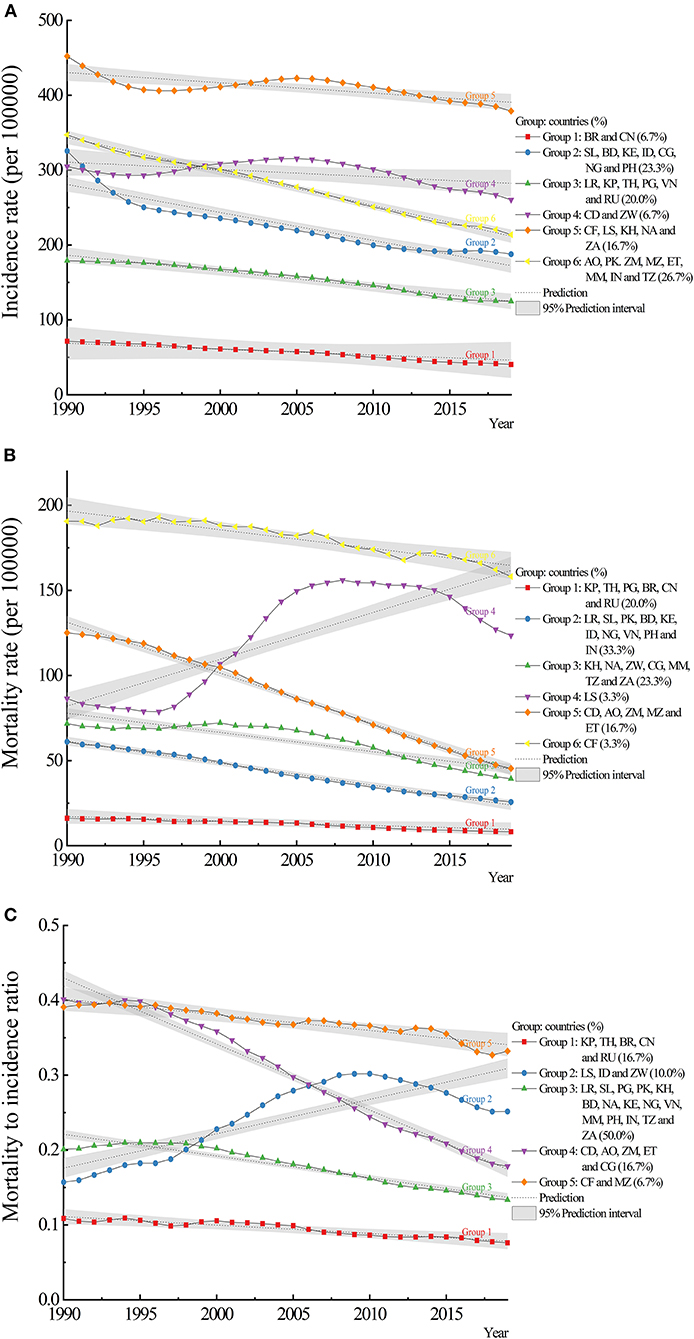
Figure 4. Trajectory analysis of incidence, mortality, and mortality to incidence (MI) ratio of tuberculosis in the 30 HBCs: (A) incidence, (B) mortality, (C) MI ratio. HBC, high burden country; AO, Angola; BD, Bangladesh; BR, Brazil; KH, Cambodia; CF, Central African Republic; CN, China; CG, Congo; KP, Democratic People's Republic of Korea; CD, Democratic Republic of the Congo; ET, Ethiopia; IN, India; ID, Indonesia; KE, Kenya; LS, Lesotho; LR, Liberia; MZ, Mozambique; MM, Myanmar; NA, Namibia; NG, Nigeria; PK, Pakistan; PG, Papua New Guinea; PH, Philippines; RU, Russian Federation; SL, Sierra Leone; ZA, South Africa; TH, Thailand; TZ, United Republic of Tanzania; VN, Vietnam; ZM, Zambia; ZW, Zimbabwe.
Predictions on the Epidemics of TB
Predictions based on the AAPCs, compared with the level in 2015, showed that the change rates of incidence varied from −26.47 to 4.02% in 2025, from −40.02 to 4.54% in 2030, and from −51.09 to 5.06% in 2035. The change rates of mortality varied from −43.30 to −3.36% in 2025, from −57.94 to 4.62% in 2030, and from −68.81 to 13.27% in 2035. The above results revealed that only Brazil and China could reach the milestones set for 2025 with incidence rates below 50 per 100,000 (Table 2).
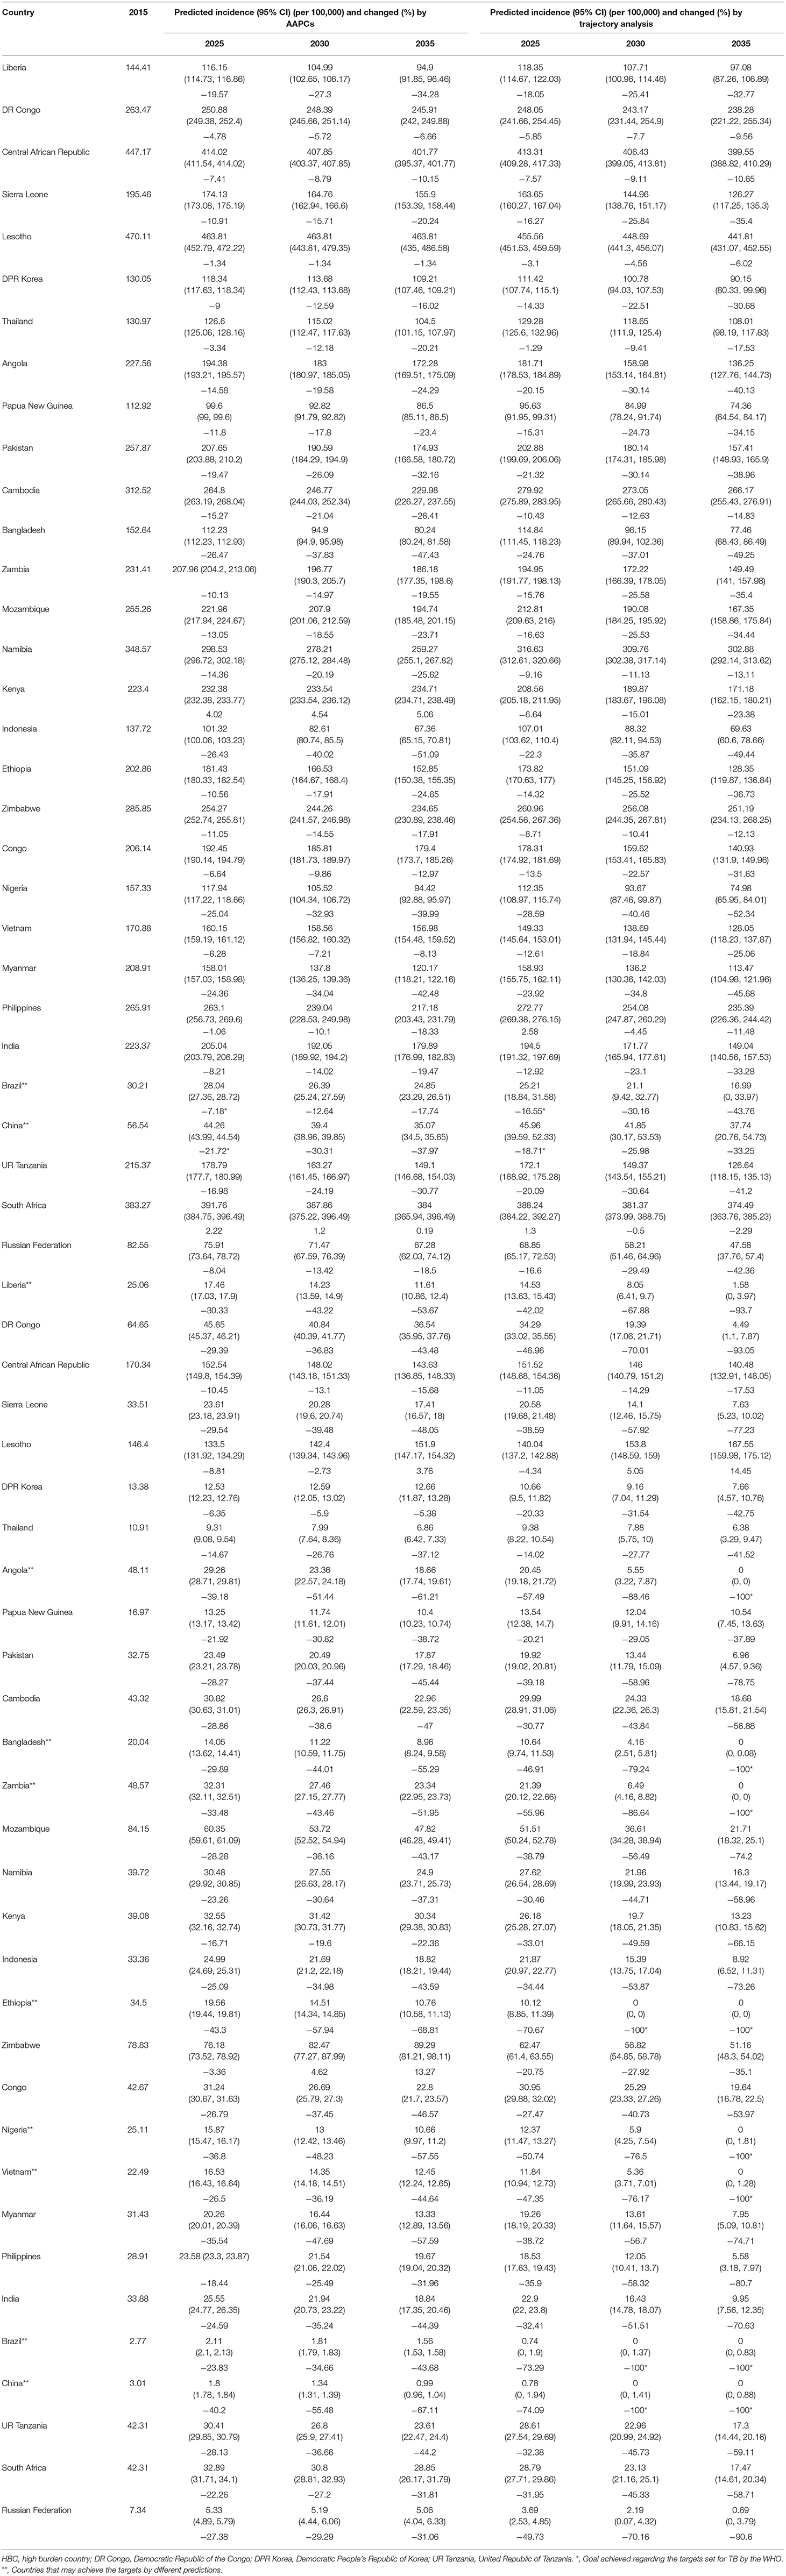
Table 2. Predicted incidence and mortality of TB in 2025, 2030, and 2035 in 30 HBCs.
Predictions based on trajectory analysis showed that the change rates of incidence varied from −28.59 to 2.58% in 2025, from −40.46 to −0.50% in 2030, and from −52.34 to −2.29% in 2035. The change rates of mortality varied from −74.09 to −4.34% in 2025, from −100 to 5.05% in 2030, and from −100 to 14.45% in 2035. Reduction targets set for deaths could be achieved by Brazil, China, and Ethiopia in 2030, and Angola, Bangladesh, Brazil, China, Ethiopia, Nigeria, Vietnam, and Zambia in 2035 (Table 2).
Discussion
This study provided alternative evidence on the TB epidemic in the 30 HBCs besides the WHO. From 1990 to 2019, the disease burden of TB decreased in most HBCs (AAPCs of incidence ranged from −4.0 to −0.2%, AAPCs of mortality ranged from −5.8 to −0.6%, AAPCs of MI ratios ranged from −4.2 to −0.3%). The trajectory models also indicated these. In addition, the WHO estimated that the average decline rate of global incidence was 1.7% per year (2000–2019), and 45% of mortality. Compared with this study, specifically, the WHO reported that the incidence trend (2000–2019) in Liberia increased, while it decreased in Kenya, and was stable in Bangladesh, Central African Republic, DPR Korea, DR Congo, Nigeria, Pakistan, and Papua New Guinea. The mortality was decreased in the majority HBCs, except in countries, such as Central African Republic, Lesotho, Namibia, and Zambia (stable) and Congo, Liberia, and Namibia (increasing) (2).
The WHO reported that the highest burden of TB was among adult men (accounting for 56% of all cases in 2019) (2). Results from this study were similar except for countries, such as DR Congo, Angola, Papua New Guinea, Pakistan, Zimbabwe, Congo, and South Africa, among which higher incidence rates were observed among women in the same year. Globally, 53% of the HIV-negative adults who died from TB were men, 31% were women in 2019 (2). Moreover, men had higher mortality rates in this study. Additionally, the higher incidence and mortality rates occurred in adult groups and increase with age (Supplementary Figures 4, 5), which confirms that TB mostly affects adults in their most productive years (19).
To parallel the global targets, incidence and mortality rates at the country level instead of age-standardized ones were chosen in addressing the purpose of this study. Both predictions showed that the reduction targets of incidence and mortality set by the WHO were difficult to be achieved. Consistent with the above results, countries in most of the WHO regions were not on track to reach the 2020 milestones (2), and the global annual decline in the incidence needs to accelerate to 4–5% per year by 2020 and 10% by 2025, and even an average of 17% set for 2030 (2). More importantly, this was estimated at the global level instead of the country level. Remarkably, more than half of the global TB cases and two-thirds of the multidrug-resistant TB (MDR-TB) cases were borne by Brazil, Russian Federation, India, China, and South Africa (20). For those HCBs, there were more challenges and longer ways toward meeting these ambitious targets (21–24).
The WHO has underscored the significance of monitoring the status of the TB epidemic and progress in financing and implementation of the response at global, regional, and country levels (19). The up-to-date information is essential to track the progress of control efforts (4). The programmatic management of latent tuberculosis infection (LTBI) is one of the crucial interventions to decrease the incidence (25). In addition, addressing the MDR-TB epidemic is crucial to reducing morbidity, mortality, and healthcare related costs (26, 27). The long-term socio-economic effects will further drive risk factors associated with TB, such as poverty, malnutrition, and poor living conditions (24). Unexpected factors would affect the elimination of TB. For example, the pandemic of COVID-19 has resulted in a crisis in public health and challenged healthcare systems worldwide (28–30), which threatens to reverse the gains made over recent years (2). Upon these challenging targets, intensified national and global efforts, such as technical assistance and cooperation, promotion of integrated, patient-centered care and prevention, continued scale-up of early diagnosis, and proper treatment for all forms of TB, bold policies and supportive systems, and global surveillance are the appropriate and responsible way forward (9, 20, 21, 31).
From trajectory analysis, the characteristics of subgroups could be summarized and analyzed, and comparisons could be made between subgroups. For example, treating the active TB or LTBI cases, protecting the susceptible population, and reducing the transmission of the disease are the principle in the subgroup of Central African Republic, Lesotho, Cambodia, Namibia, and South Africa with relatively higher incidence rates. The Central African Republic and Lesotho with a high burden of mortality should pay more attention to reducing deaths, which illustrates large inequities in access to diagnosis and treatment (21). Developed countries achieved remarkable reductions by pursuing universal access to healthcare and social protection while rapidly improving the nutrition and economic conditions in addition to delivering adequate services (9). Although reductions seem also possible with current interventions among HBCs, additional interventions, adapted to country-specific epidemiology, and health systems, are needed (23).
High-level leadership is listed as a key element of a national-level mechanism regarding a multi-sectoral accountability framework for TB (2). Brazil created the Brazilian TB Research Network in 2001 (32) and proposed the Research Agenda in 2015 (33), both of which represented a novel form of collaboration among academia, the government, civil society, and the national industrial sector to the community (34). Additionally, in 2017, the National Plan for Eliminating Tuberculosis for Brazil was launched (35). In China, the incidence rate decreased annually from 109 per 100,000 in 2000 to 64 per 100,000 in 2016 (36). The newest National Action Plan for TB Control for 2019–2022 was proposed (incidence decreases to under 55 per 100,000 and mortality decreases to under 3 per 100,000) (37), as defined in the Healthy China Action Plan (2019–2030) (38).
Thailand has established a universal health coverage scheme and a strong primary healthcare system since 2002 (39). Thailand stands out as having a relatively high service coverage index of 80 among HBCs and a low level of catastrophic health expenditures (2% of households) (2). Brazil, China, Russian Federation, and Thailand had high levels of treatment coverage (>80%) in 2019, while it was 50% or less in the Central African Republic and Nigeria (2). The observed results were questionable in DPR Korea, in which the highest TB burden outside of sub-Saharan Africa was reported (2). Since the famines of the 1990s, the TB burden in DPR Korea had risen dramatically (40, 41). The WHO reported an incidence rate of 513 per 100,000 in 2019, which was only 124.18 per 100,000 in this study. The incidence trend (2000–2019) showed a horizontal line and the morality trend was unavailable in the WHO report (2), which was different from this study. The differences illustrated the importance of data sources and model estimations.
The following major categories were used by the WHO to estimate incidences and mortalities: prevalence surveys, notifications adjusted by a standard factor, inventory/capture-recapture studies and case notification data combined with expert opinions, vital registration systems or mortality surveys, and deriving from multiplying estimates of incidence by estimates of the case fatality rate (42). The GBD study used the data available from annual case notifications, prevalence surveys, population based tuberculin surveys, vital registration data, verbal autopsies, and estimated cause-specific mortality rates among individuals (4, 43). It was found that even the 20 countries with the highest number of incident TB cases in 2016 were different between the two estimations (4). In the newest global tuberculosis report, countries, such as Cambodia, Russian Federation, and Zimbabwe have been replaced by Gabon, Mongolia, and Uganda in the HCBs list for the period of 2021–2025 (3). The disparities were mainly due to the different methodological approaches used and interpretations of data (44). Additionally, the discrepancy calls attention to the modeling approaches and more importantly the high-quality data. It is possible that different independent estimates would contribute to the reliability of the collected data.
This study has several limitations. First, although data from the GBD study are considered widely accepted, the accuracy of data collected, extracted, and reported is still improving. Further cross-sectional and longitudinal studies in those HBCs along with other countries are needed to follow the epidemic trend of TB. Second, predictions in this study have certain assumptions, such as the trends, population size, influencing factors, and interventions were kept the same. Potential factors (e.g., LTBI, MDR-TB, and HIV co-infection) associated with the epidemics were not involved (45). Third, no subdivisions, such as LTBI, MDR-TB, or extensively drug-resistant TB were analyzed.
Conclusions
Although significant progress has been made on reducing the TB burden in those HBCs during the past three decades, the findings suggest that, if current trends continue, achieving the global targets of end TB at the country level among those HBCs is challenging. Progress needs to be accelerated to achieve the global targets.
Data Availability Statement
Publicly available datasets were analyzed in this study. This data can be found here: http://ghdx.healthdata.org/gbd-results-tool.
Author Contributions
CD and KX conceived and designed the study. MH, YS, WG, SW, and XF collected data. CD, MH, YS, WG, SW, XF, and ZZ cleaned, analyzed the data, and interpreted the results. CD and YZ wrote the first draft. CD, YZ, and KX contributed to figures and manuscript preparation. All the authors critically revised the manuscript and accessed the final approval for publication.
Funding
This study was supported by the National Key Research and Development Program of China (2021YFC2301800); the Medical and Health Science and Technology Project of Zhejiang Province (2022KY743); the National Science and Technology Major Project (2017ZX10105001 and 2018ZX10715014); and the Lishui Science and Technology Bureau (2018ZDHZ10). The GBD was partially funded by the Bill & Melinda Gates Foundation.
Conflict of Interest
The authors declare that the research was conducted in the absence of any commercial or financial relationships that could be construed as a potential conflict of interest.
Publisher's Note
All claims expressed in this article are solely those of the authors and do not necessarily represent those of their affiliated organizations, or those of the publisher, the editors and the reviewers. Any product that may be evaluated in this article, or claim that may be made by its manufacturer, is not guaranteed or endorsed by the publisher.
Acknowledgments
This study was conducted as part of the Global Burden of Diseases, Injuries, and Risk Factors Study (GBD), coordinated by the Institute for Health Metrics and Evaluation.
Supplementary Material
The Supplementary Material for this article can be found online at: https://www.frontiersin.org/articles/10.3389/fmed.2022.798465/full#supplementary-material
References
1. Hershkovitz I, Donoghue HD, Minnikin DE, May H, Lee OY, Feldman M, et al. Tuberculosis origin: the neolithic scenario. Tuberculosis. (2015) 95:S122–6. doi: 10.1016/j.tube.2015.02.021
2. World Health Organization. Global Tuberculosis Report 2020. Geneva: WHO Press (2020). Available online at: https://www.who.int/teams/global-tuberculosis-programme/tb-reports/global-tuberculosis-report-2020 (accessed March 9, 2021).
3. World Health Organization. Global Tuberculosis Report 2021. Geneva: WHO Press (2021). Available online at: https://www.who.int/teams/global-tuberculosis-programme/tb-reports/global-tuberculosis-report-2021 (accessed October 15, 2021).
4. GBD Tuberculosis Collaborators. Global, regional, and national burden of tuberculosis, 1990-2016: results from the global burden of diseases, injuries, and Risk Factors 2016 Study. Lancet Infect Dis. (2018) 18:1329–49. doi: 10.1016/S1473-3099(18)30625-X
5. GBD 2017 Disease and Injury Incidence and Prevalence Collaborators. Global, regional, and national incidence, prevalence, and years lived with disability for 354 diseases and injuries for 195 countries and territories, 1990-2017: a systematic analysis for the Global Burden of Disease Study 2017. Lancet. (2018) 392:1789–858. doi: 10.1016/S0140-6736(18)32279-7
6. United Nations. We Can End Poverty. Millennium Development Goals Beyond 2015. Goal 6: Combat HIV/AIDS, Malaria, Other Diseases. (2000). Available online at: https://www.un.org/millenniumgoals/aids.shtml (accessed May 25, 2021).
7. United Nations,. Sustainable Development Knowledge Platform. Sustainable Development Goals. (2015). Available online at: https://sustainabledevelopment.un.org/topics/sustainabledevelopmentgoals (accessed June 29, 2021).
8. World Health Organization. The End TB Strategy-Global Strategy And Targets For Tuberculosis Prevention, Care And Control After 2015. Geneva: WHO Press (2018). Available online at: https://www.who.int/tb/strategy/End_TB_Strategy.pdf (accessed September 17, 2019).
9. Uplekar M, Weil D, Lonnroth K, Jaramillo E, Lienhardt C, Dias HM, et al. WHO's new end TB strategy. Lancet. (2015) 385:1799–801. doi: 10.1016/S0140-6736(15)60570-0
10. Global Burden of Disease Collaborative Network. Global Burden of Disease Study 2019 (GBD 2019) Results. Seattle, United States: Institute for Health Metrics and Evaluation (IHME). (2020). Available online at: http://ghdx.healthdata.org/gbd-results-tool.
11. Institute for Health Metrics Evaluation. About GBD-The Global Burden of Disease: A Critical Resource For Informed Policymaking. (2020). Available online at: http://www.healthdata.org/gbd/about (accessed June 29, 2021).
12. Institute for Health Metrics Evaluation. Protocol for the Global Burden of Disease, Injuries, and Risk Factors study (GBD). (2020). Available online at: http://www.healthdata.org/gbd/about/protocol (accessed May 18, 2021).
13. Murray CJ, Ezzati M, Flaxman AD, Lim S, Lozano R, Michaud C, et al. GBD 2010: design, definitions, and metrics. Lancet. (2012) 380:2063–6. doi: 10.1016/S0140-6736(12)61899-6
14. Murray CJ, Lopez AD. Measuring the global burden of disease. N Engl J Med. (2013) 369:448–57. doi: 10.1056/NEJMra1201534
15. Surveillance Epidemiology End Results (SEER) Program. World (WHO 2000-2025) Standard. (2013) Available online at: https://seer.cancer.gov/stdpopulations/world.who.html (accessed April 19, 2021).
16. Institute for Health Metrics Evaluation (IHME). Global Burden of Disease Study 2019 (GBD 2019) Socio-Demographic Index (SDI) 1950 - 2019. (2021). Available online at: http://ghdx.healthdata.org/record/ihme-data/gbd-2019-socio-demographic-index-sdi-1950-2019 (accessed June 1, 2021).
17. Jones BL, Nagin DS, Roeder K. A SAS procedure based on mixture models for estimating developmental trajectories. Sociol Method Res. (2001) 29:374–93. doi: 10.1177/0049124101029003005
18. Jones BL. Traj: Group-Based Modeling Of Longitudinal Data. (2021). Available online at: http://www.andrew.cmu.edu/user/bjones/ (accessed May 26, 2021).
19. World Health Organization. Tuberculosis. Geneva: WHO Press (2020). Available online at: https://www.who.int/news-room/fact-sheets/detail/tuberculosis (accessed March 9, 2021).
20. Raviglione M, Uplekar M, Vincent C, Pablos-Méndez A. Rebalancing the global battle against tuberculosis. Lancet Glob Health. (2014) 2:e71–2. doi: 10.1016/S2214-109X(13)70166-9
21. Floyd K, Glaziou P, Zumla A, Raviglione M. The global tuberculosis epidemic and progress in care, prevention, and research: an overview in year 3 of the End TB era. Lancet Respir Med. (2018) 6:299–314. doi: 10.1016/S2213-2600(18)30057-2
22. MacNeil A, Glaziou P, Sismanidis C, Date A, Maloney S, Floyd K. Global epidemiology of tuberculosis and progress toward meeting global targets - worldwide, 2018. MMWR Morb Mortal Wkly Rep. (2020) 69:281–5. doi: 10.15585/mmwr.mm6911a2
23. Houben R, Menzies NA, Sumner T, Huynh GH, Arinaminpathy N, Goldhaber-Fiebert JD, et al. Feasibility of achieving the 2025 WHO global tuberculosis targets in South Africa, China, and India: a combined analysis of 11 mathematical models. Lancet Glob Health. (2016) 4:e806–e15. doi: 10.1016/S2214-109X(16)30199-1
24. Chakaya J, Khan M, Ntoumi F, Aklillu E, Fatima R, Mwaba P, et al. Global Tuberculosis Report 2020 - Reflections on the Global TB burden, treatment and prevention efforts. Int J Infect Dis. (2021) 113:S7–12. doi: 10.1016/j.ijid.2021.02.107
25. Sotgiu G, Goletti D, Matteelli A. Global tuberculosis prevention: should we start from the beginning? Eur Respir J. (2019) 54:1901394. doi: 10.1183/13993003.01394-2019
26. Dheda K, Gumbo T, Maartens G, Dooley KE, Murray M, Furin J, et al. The lancet respiratory medicine commission: 2019 update: epidemiology, pathogenesis, transmission, diagnosis, and management of multidrug-resistant and incurable tuberculosis. Lancet Respir Med. (2019) 7:820–6. doi: 10.1016/S2213-2600(19)30263-2
27. Ou ZJ, Yu DF, Liang YH, He WQ, Li YZ, Meng YX, et al. Trends in burden of multidrug-resistant tuberculosis in countries, regions, and worldwide from 1990 to 2017: results from the global burden of disease study. Infect Dis Poverty. (2021) 10:24. doi: 10.1186/s40249-021-00803-w
28. Blumenthal D, Fowler EJ, Abrams M, Collins SR. COVID-19 - implications for the health care system. N Engl J Med. (2020) 383:1483–8. doi: 10.1056/NEJMsb2021088
29. Mehta S, Machado F, Kwizera A, Papazian L, Moss M, Azoulay É, et al. COVID-19: a heavy toll on health-care workers. Lancet Respir Med. (2021) 9:226–8. doi: 10.1016/S2213-2600(21)00068-0
30. Miller IF, Becker AD, Grenfell BT, Metcalf CJE. Disease and healthcare burden of COVID-19 in the United States. Nat Med. (2020) 26:1212–7. doi: 10.1038/s41591-020-0952-y
31. Lönnroth K, Castro KG, Chakaya JM, Chauhan LS, Floyd K, Glaziou P, et al. Tuberculosis control and elimination 2010-50: cure, care, and social development. Lancet. (2010) 375:1814–29. doi: 10.1016/S0140-6736(10)60483-7
32. World Health Organization. On The Road To Ending TB-Highlights from the 30 highest TB burden countries. Geneva: WHO Press (2016). Available online at: https://apps.who.int/iris/bitstream/handle/10665/204662/WHO_HTM_TB_2016.06_eng.pdf;jsessionid=0FDA6C4187A04F69E54EECAE4DE570B2?sequence=1 (accessed March 9, 2021).
33. Kritski A, Barreira D, Junqueira-Kipnis AP, Moraes MO, Campos MM, Degrave WM, et al. Brazilian response to global end tb strategy: the national tuberculosis research agenda. Rev Soc Bras Med Trop. (2016) 49:135–45. doi: 10.1590/0037-8682-0330-2015
34. Kritski A, Andrade KB, Galliez RM, Maciel ELN, Cordeiro-Santos M, Miranda SS, et al. Tuberculosis: renewed challenge in Brazil. Rev Soc Bras Med Trop. (2018) 51:2–6. doi: 10.1590/0037-8682-0349-2017
35. Kritski A, Dalcolmo MP, Mello FCQ, Carvalho ACC, Silva DR, Oliveira MM, et al. The role of the Brazilian tuberculosis research network in national and international efforts to eliminate tuberculosis. J Bras Pneumol. (2018) 44:77–81. doi: 10.1590/s1806-37562017000000435
36. Zhao F, Du X, Li T, Wang LX, Zhang H, Liu JJ. Epidemic trend and prediction analysis of tuberculosis based on WHO public database in China. Clin Med J. (2018) 16:1–3. doi: 10.3969/j.issn.1672-3384.2018.04.001
37. National Health Commission. Action Plan To Suppress Tuberculosis. (2019). Available online at: http://www.nhc.gov.cn/jkj/s3589/201906/b30ae2842c5e4c9ea2f9d5557ad4b95f.shtml (accessed June 21, 2021).
38. State Council of the People's Republic of China. Healthy China Action Plan (2019–2030). (2019). Available online at: http://www.gov.cn/xinwen/2019-07/15/content_5409694.htm?utm_source=UfqiNews (accessed June 21, 2021).
39. Tangcharoensathien V, Witthayapipopsakul W, Panichkriangkrai W, Patcharanarumol W, Mills A. Health systems development in Thailand: a solid platform for successful implementation of universal health coverage. Lancet. (2018) 391:1205–23. doi: 10.1016/S0140-6736(18)30198-3
40. McCurry J. No end in sight for North Korea's malnutrition crisis. Lancet. (2012) 379:602. doi: 10.1016/S0140-6736(12)60252-9
41. Perry S, Linton H, Schoolnik G. Tuberculosis in North Korea. Science. (2011) 331:263. doi: 10.1126/science.1201892
42. Glaziou P, Dodd PJ, Dean A, Floyd K. Methods Used by WHO to Estimate The Global Burden of TB Disease. (2020). Available online at: https://cdn.who.int/media/docs/default-source/hq-tuberculosis/global-tuberculosis-report-2020/tb2020_technical_appendix_20201014.pdf?sfvrsn=5d3c7309_7&Status=Master (accessed June 15, 2021).
43. GBD Tuberculosis Collaborators. The Global Burden Of Tuberculosis: Results From The Global Burden Of Disease Study 2015. Lancet Infect Dis. (2018) 18:261–84. doi: 10.1016/S1473-3099(17)30703-X
44. García-Basteiro AL, Brew J, Williams B, Borgdorff M, Cobelens F. What is the true tuberculosis mortality burden? differences in estimates by the world health organization and the global burden of disease study. Int J Epidemiol. (2018) 47:1549–60. doi: 10.1093/ije/dyy144
Keywords: tuberculosis, Burden of Disease, epidemics, forecasting, public health surveillance
Citation: Ding C, Hu M, Shangguan Y, Guo W, Wang S, Feng X, Zhang Z, Zhang Y and Xu K (2022) Epidemic Trends in High Tuberculosis Burden Countries During the Last Three Decades and Feasibility of Achieving the Global Targets at the Country Level. Front. Med. 9:798465. doi: 10.3389/fmed.2022.798465
Received: 20 October 2021; Accepted: 27 January 2022;
Published: 03 March 2022.
Edited by:
Nasir Salam, Central University of Punjab, IndiaReviewed by:
Faris Lami, University of Baghdad, IraqShirin Djalalinia, Ministry of Health and Medical Education, Iran
Bingdong Zhu, Lanzhou University, China
Copyright © 2022 Ding, Hu, Shangguan, Guo, Wang, Feng, Zhang, Zhang and Xu. This is an open-access article distributed under the terms of the Creative Commons Attribution License (CC BY). The use, distribution or reproduction in other forums is permitted, provided the original author(s) and the copyright owner(s) are credited and that the original publication in this journal is cited, in accordance with accepted academic practice. No use, distribution or reproduction is permitted which does not comply with these terms.
*Correspondence: Kaijin Xu, emR5eHl4a2pAemp1LmVkdS5jbg==; Ying Zhang, eXpoYW5nMjA3QHpqdS5lZHUuY24=