 Jingjing Lang
 Xin Xin2,3
 Zhen Ning
95% of researchers rate our articles as excellent or good
Learn more about the work of our research integrity team to safeguard the quality of each article we publish.
Find out more
ORIGINAL RESEARCH article
Front. Med. , 17 January 2023
Sec. Infectious Diseases: Pathogenesis and Therapy
Volume 9 - 2022 | https://doi.org/10.3389/fmed.2022.1071431
Objectives: This study sought to identify potential change patterns and predictors of fasting plasma glucose (FPG) and lipid levels after initiating highly active antiretroviral therapy (HAART).
Methods: A retrospective cohort study was conducted on 1,572 patients tested positive for HIV who initiated HAART between January 2010 and October 2020 in Shanghai, China. The growth mixture models (GMM) were used for capturing subgroups of FPG trajectories as well as triglyceride (TG) and total cholesterol (TC) dual-trajectories. Multinomial logistic regression models identified correlates of given trajectories.
Results: The median follow-up time was 2.0 years (IQR 1.0–4.7). Three FPG trajectory subgroups were identified as FPG low-stable (62.3%), medium-stable (30.5%), and high-increasing (7.2%). Furthermore, three subgroups of TG and TC dual-trajectories were identified as TG and TC high-slight increasing (13.7%), low-rapid increasing (27.6%), and a subgroup of medium-stable TC and slight-decreasing TG (58.7%). Older age, high TG, FPG, BMI, CD4 count of <200 at baseline, and initial use of zidovudine (AZT) and protease inhibitors (PIs) helped to identify the class with increasing glucose or lipid metabolism trajectories.
Conclusion: The change patterns of plasma glucose and lipid in patients tested positive for HIV were heterogeneous and tailored interventions should be considered in specific subgroups.
Since the introduction of antiretroviral therapy (ART), survival rates for patients tested positive for HIV have improved, and life expectancy has increased significantly. AIDS-related mortality rates have fallen, whereas deaths due to non-AIDS-defining diseases such as cardiovascular diseases (CVDs) have risen (1). ART and later highly active antiretroviral therapy (HAART) have some adverse effects on glucose and lipid metabolism (2), resulting in an increased risk of CVD (3).
Currently, there is no consensus on the association among HIV infection, ART, and the development of diabetes mellitus (DM) (2). In several studies (4, 5), the association of HIV infection and ART with an increased risk of DM has been suggested with potential mechanisms including chronic inflammation and ART-induced mitochondrial dysfunction (6, 7). In contrast, others reached different conclusions (8). A meta-analysis showed that in studies with a mean duration of ART of ≥18 months, ART was associated with a significant increase in fasting plasma glucose (FPG) levels but not in studies with a mean duration of ART of <18 months (9), suggesting that the impact of antiretroviral medications on blood glucose might take time to manifest. In addition, the effects of specific ART classes and antiretrovirals on DM development have not been thoroughly understood (2, 10).
Similarly, although the association between ART and hyperlipidemia has been well-evidenced, there was no coherent conclusion on the long-term changing patterns of blood lipids after initiating HAART. It is generally accepted that the lipid phenotype is characterized by decreasing the levels of high-density lipoprotein cholesterol (HDL) and increasing the levels of triglycerides (TG) and low-density lipoprotein cholesterol (LDL). However, no consistent results have been obtained for the changing pattern of total cholesterol (TC), shown to be elevated in some studies but decreased in others (11, 12). Furthermore, though newer drugs of ART were suggested to have more favorable effects on lipid metabolism than older ones, such as efavirenz (EFV) and protease inhibitors (PIs) (13, 14), recent studies have reported that using newer drugs, such as tenofovir alafenamide (TAF) and integrase strand transfer inhibitors (INSTIs), might lead to more significant increases in TG, TC, and HDL (15, 16).
Focusing on potential patterns of longitudinal blood glucose and lipid changes might help provide a more nuanced picture of metabolic changes. Studies in the general population have proved that latent change patterns, such as inverse U-shaped trajectory and high growth rate of plasma glucose and lipid levels, played an essential role in the development of CVD (17–19). However, to our knowledge, there is a lack of research characterizing the potential trajectories of plasma glucose and lipid levels in patients tested positive for HIV on HAART, which would help to further uncover the association between HAART regimens and changes in glucose and lipid metabolism. Several statistical methods have been developed for identifying unobserved subpopulations of trajectories of quantitative variables over time (20). One of them is the growth mixture model (GMM), which is a method for capturing heterogeneity in individual trajectories and identifying multiple unobserved subgroups of participants with similar trajectories (21). This study aimed to identify latent subgroups of plasma glucose and lipid levels trajectories using GMM and evaluate their associations with both traditional risk factors and HIV-specific factors, especially HAART regimens.
Data in this retrospective cohort study were drawn from two national web-based databases in China, namely, the HIV/AIDS Comprehensive Response Information Management System (CRIMS) and the HIV/AIDS case reporting system (CIS), as documented elsewhere (22). Demographic characteristics of patients (e.g., age, gender, height, weight, and HIV transmission route) and disease-related data (e.g., TC, TG, and FPG measurements, CD4 cell count, HIV viral load, and ART regimens) were collected for this study.
Fasting blood samples were extracted and analyzed. FPG and lipids were measured by a fully automatic biochemistry analyzer (Roche, Basel, Switzerland) using an enzymatic method. Absolute CD4+T lymphocytes were counted by a FACS Calibur flow cytometer (Becton-Dickinson, USA) within 24 h after blood sample processing. Plasma HIV-RNA viral load was measured using an automated Abbott real-time HIV-1 assay (Abbott, USA).
Data were collected from January 2010 to August 2021. The eligibility criteria were patients with HIV newly diagnosed between January 2010 and October 2020, age older than 18 years, ART-naive, non-pregnant, and newly initiated on a HAART regimen consisting of a pair of nucleoside reverse transcriptase inhibitors (NRTIs) as backbone drugs together with non-nucleoside reverse transcriptase inhibitors (NNRTIs), PIs, and INSTIs as core drugs. We excluded patients with missing height, weight, TC, TG, FPG, and CD4 count at the baseline and those with less than two follow-up visits in different years.
Body mass index (BMI, kg/m2) was categorized as underweight (<18.5), normal (18.5 to <24), and overweight or obese (≥24). High FPG, TC, and TG were defined as FPG of ≥6.1 mmol/l, TC of ≥5.2 mmol/l, and TG of ≥1.7 mmol/l, respectively, according to the NCEP ATP III criteria.
For statistical descriptions, continuous variables were expressed as means and standard deviations if normally distributed, or medians and interquartile ranges (IQR) if not. Categorical variables were expressed as numbers and proportions.
FPG, TG, and TC measurements at visits occurring between 1 month and 7 years after HAART initiation were used to calculate subsequent observations. Multiple measurements available for a single year were averaged, and then log-transformed because of their skewed distribution. Using Mplus 8.3 (23), FPG trajectories over time were modeled by the GMM method, and distinct subgroups that followed similar patterns were identified. To capture the interaction of TG and TC development, parallel process GMMs were conducted to determine the shared developmental trajectories of both lipid levels.
The analytical procedure was planned following frameworks suggested in previous studies (24, 25). First, different growth curve models (GCMs) (i.e., linear, quadratic, and latent basis models) were fitted to select the best-fit model for the following steps (26). Then increasingly free models were conducted following the path of going from the most constrained group-based trajectory models (GBTM) without random effects to more flexible latent class growth analysis (LCGA) models with different residual variance error structures and GMM with varying covariance structures of the random effects by gradually reducing the model restrictions (25). We used a class-specific unstructured covariance matrix to avoid any assumptions about the covariance structure (27). Moreover, a greater range of start values was specified to avoid local solutions in the estimation of GMMs (28).
Model fit criteria curve behaviors were identified to determine whether to fit more complex models, a plateauing behavior of the fit statistics indicating possible covariance misspecification (29). Seminal studies in this field proposed several criteria that were used to select the best latent class number K (25). Adjusted Lo-Mendell–Rubin likelihood ratio tests (aLMR) and Vuong-Lo-Mendell-Rubin tests (VLMR) were taken for comparison between class K models and class K-1 models. A significant p-value (p < 0.05) represented the superiority of the class K model over the class K-1 model. Bayesian information criterion (BIC) was also evaluated when comparing different models: a small number of BIC indicated a better-fitting model. Then, the average posterior probability of assignment (APPA) close to 1 (ideally >0.7), a sufficient sample size (>5% of the sample) for each trajectory group, and a large value of entropy was indicative of good model parsimony and adequacy. Finally, trajectory groups were marked by the relative baseline level (low, medium, and high) and change tendency (increasing, decreasing, and stable).
Baseline information was compared between subgroups using either the chi-square test or Fisher's exact test for categorical variables. Significantly different variables (p < 0.1) were further analyzed in the multinomial logistic regression of the latent classes.
Statistical analyses were conducted by IBM SPSS 23.0 (IBM Svenska AB, 16,492 Stockholm) and SAS 9.4 (SAS Institute, Cary, NC). A P < 0.05 was considered statistically significant.
To evaluate the robustness of our findings, sensitivity analyses were conducted by selecting participants with at least four follow-up visits in different years and participants who did not change their ART regimens during follow-up, respectively.
In total, 1,572 patients tested positive for HIV were eligible for inclusion and were included in these analyses. Supplementary Figure 1 shows flow chart details. The cohort was predominately male (95.5%), infected by homosexual transmission (75.8%), and with a median age of 31 years (IQR 26–42) (Table 1). At the baseline, NNRTI regimens were used by 92.6%, PI regimens by 3.6%, and INSTI regimens by 3.9%. The two backbone drugs were mainly lamivudine (3TC) plus tenofovir (TDF) (83.8%) or 3TC plus AZT (12.8%). The median follow-up time for patients from the initiation of ART to the last available visit was 2.0 years (IQR 1.0–4.7). In total, 60% of participants had at least four measurements in different years. During follow-up, 1,926 (82.4%) patients maintained their initial treatment regimens, and 276 (17.6%) patients changed their regimens, with 110 (7.0%) patients having their core drug substituted from NNRTI to INSTI, 91 (5.8%) patients having their core drug substituted from NNRTI to PI, and 75 (4.8%) having other ART shifts.

Table 1. Characteristics of the study population (n = 1,572).
First, by comparing model fit indices, the quadratic GCM was selected as the base model, which showed the best-fit indices (Supplementary Table 1). Then, the 2-classes GBTM to 9-classes GBTM were analyzed (Supplementary Table 2). Based on the VLMR and aLMR results, the 8-classes GBTM model was selected. Since the information criteria (IC) of GBTM models were gradually improved as the number of groups increased, the 8-classes LCGA models with different residual variance structures were allowed to be fitted, i.e., same over class but different across time (LCGA1), same over time but different over class (LCGA2), and different across time and over class (LCGA3) (29). Still, the 3-classes LCGA2 model was selected based on the VLMR and aLMR results and BIC values (Supplementary Table 3).
According to the IC behaviors of LCGA models, we then expanded the LCGA2 into GMMs by adding class-variant random effect variances stepwise, respectively. Finally, the GMM2 with class-variant random intercept and linear slope variance had lower BICs than others (Supplementary Table 3). The VLMR and aLMR results showed that the 3-classes model could be retained. After further eliminating the non-significant higher-order polynomial terms, the GMM4 model was settled on as the final selected model, with the lowest BIC value of −13,623.117 and with APPAs of 0.89, 0.76, and 0.80 for each class, respectively. Furthermore, the GMM4 model had a reasonable distribution of class memberships across the categories (7.2, 30.5, and 62.3%).
In the GMM model for FPG, the best fit of the 3-classes model involved one quadratic and two intercept trajectories (Figure 1). Most participants (62.3%, n = 979) categorized into class 1 observed a low-stable FPG trajectory, which began around 5.34 mmol/l. In addition, class 2 containing 30.5% of participants (n = 479) showed a medium-stable FPG trajectory that began around 5.69 mmol/l. The rest of the participants (7.2%, n = 114) in class 3 observed a high-increasing FPG trajectory with the highest baseline mean FPG value of 6.66 mmol/l and a quadratic increase with a slope of 0.005 (SE = 0.002, p < 0.05).
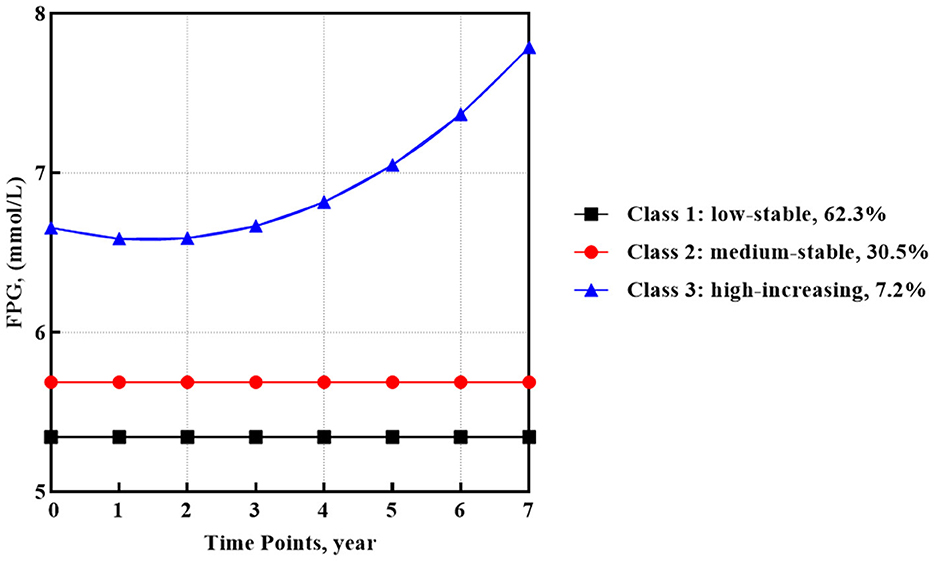
Figure 1. FPG trajectories after HAART initiation identified by GMM (n = 1,572).
The fitting of dual-trajectories for TG and TC followed the same modeling strategy as for FPG. Based on the selected quadratic GCM model, the 3-classes GMM1 model with a relaxed time-varying and class-varying residual and random intercept variance structures was ultimately settled on as the optimal model, with the lowest BIC value of −8,426.30 and APPAs of 0.85, 0.78, and 0.79 for each class, respectively (Supplementary Tables 4–6). Furthermore, the class membership for the GMM model was 13.7, 27.6, and 58.7% for each category.
For TG and TC (Figure 2), three shared latent groups were identified: (1) high-slight increasing TG and TC (class 1, 13.7%); (2) low-rapid increasing TG and TC (class 2, 27.6%); and (3) medium-stable TC and slight-decreasing TG (class 3, 58.7%). Supplementary Table 7 provides parameter estimates for latent growth factors based on the best solution, i.e., the 3-classes GMM1.
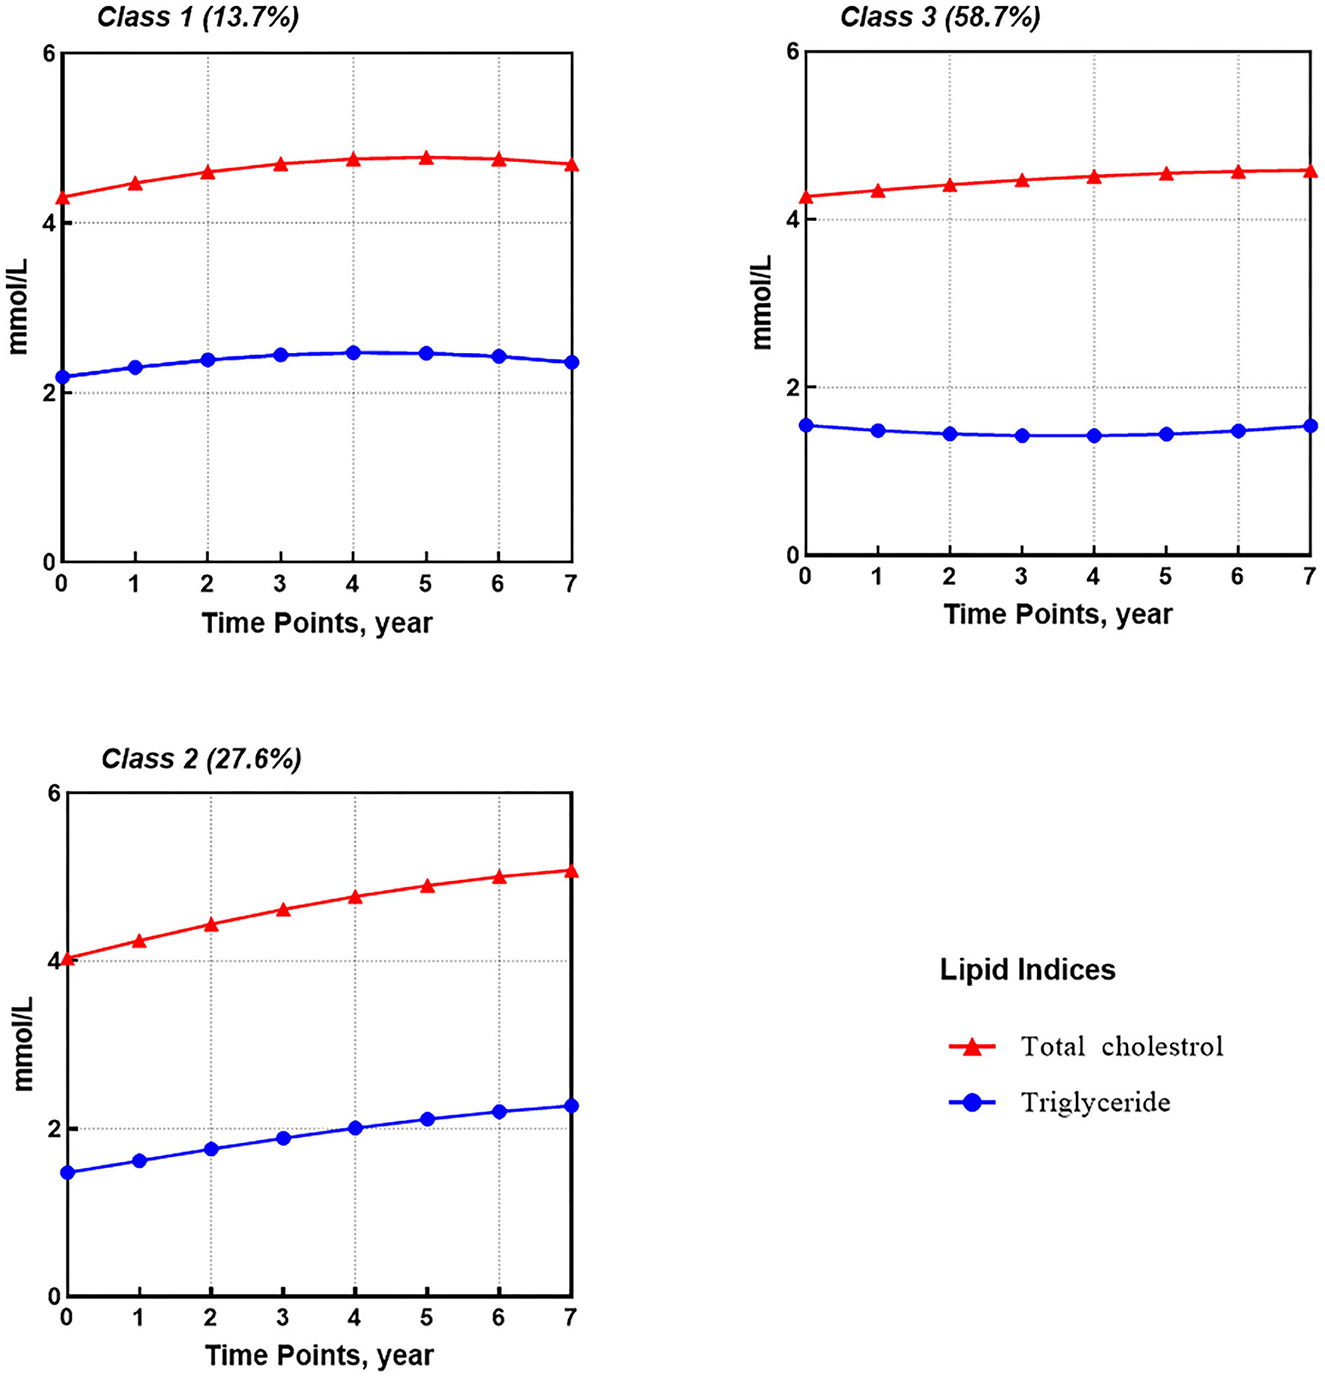
Figure 2. Dual-trajectories of TG and TC after HAART initiation identified by GMM (n = 1,572).
Table 2 shows the baseline characteristics of participants in different FPG trajectory subgroups. Compared to class 1, participants in classes 2 and 3 were featured by older age, higher TG and FPG at baseline, and use of non-TDF backbone drugs, while only participants in class 3 were characterized by baseline CD4 counts of <200 cells/μl and BMI of ≥18.5 kg/m2. No significant differences were found between classes 2 and 3 except for age and FPG levels at the baseline. In the multivariable model, age older than 30 years and high FPG were independently associated with classes 2 and 3 when compared with class 1. The initial use of AZT was independently associated with class 2 but marginally associated with class 3.
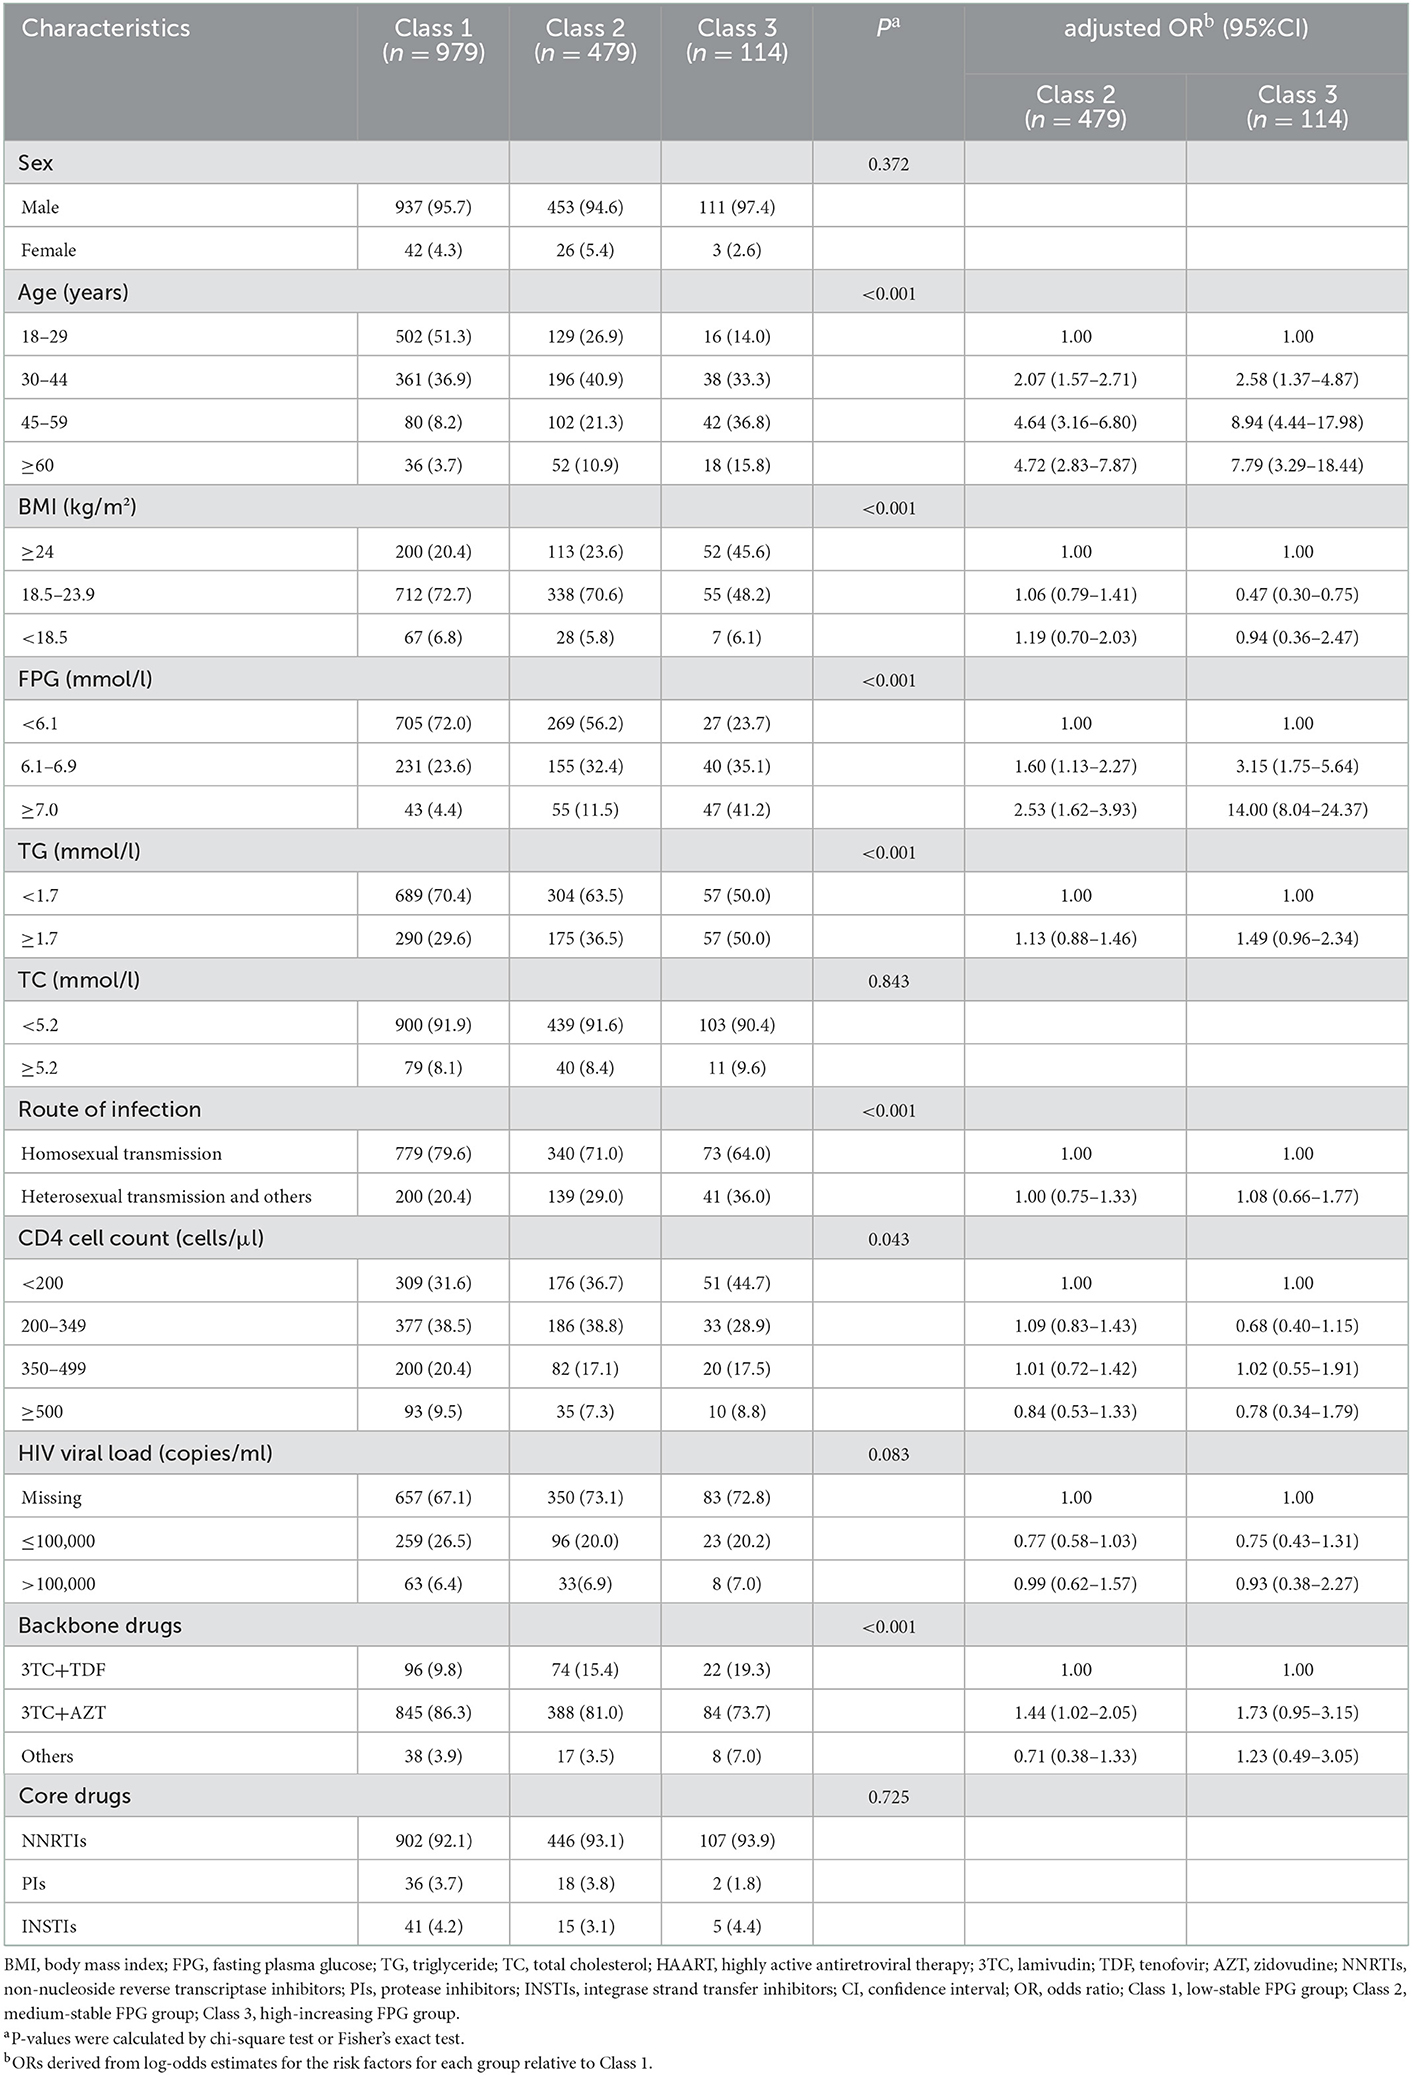
Table 2. Baseline characteristics of participants among three FPG trajectory subgroups.
Table 3 shows the baseline characteristics of participants in different TG and TC dual-trajectory subgroups. In comparison with class 3, which showed medium-stable TC and slight-decreasing TG trajectories, participants in class 1 with high-slight increasing TG and TC were older, overweight, or obese, with baseline CD4 counts of <200 cells/μl, high TG, and initial use of AZT and PIs.
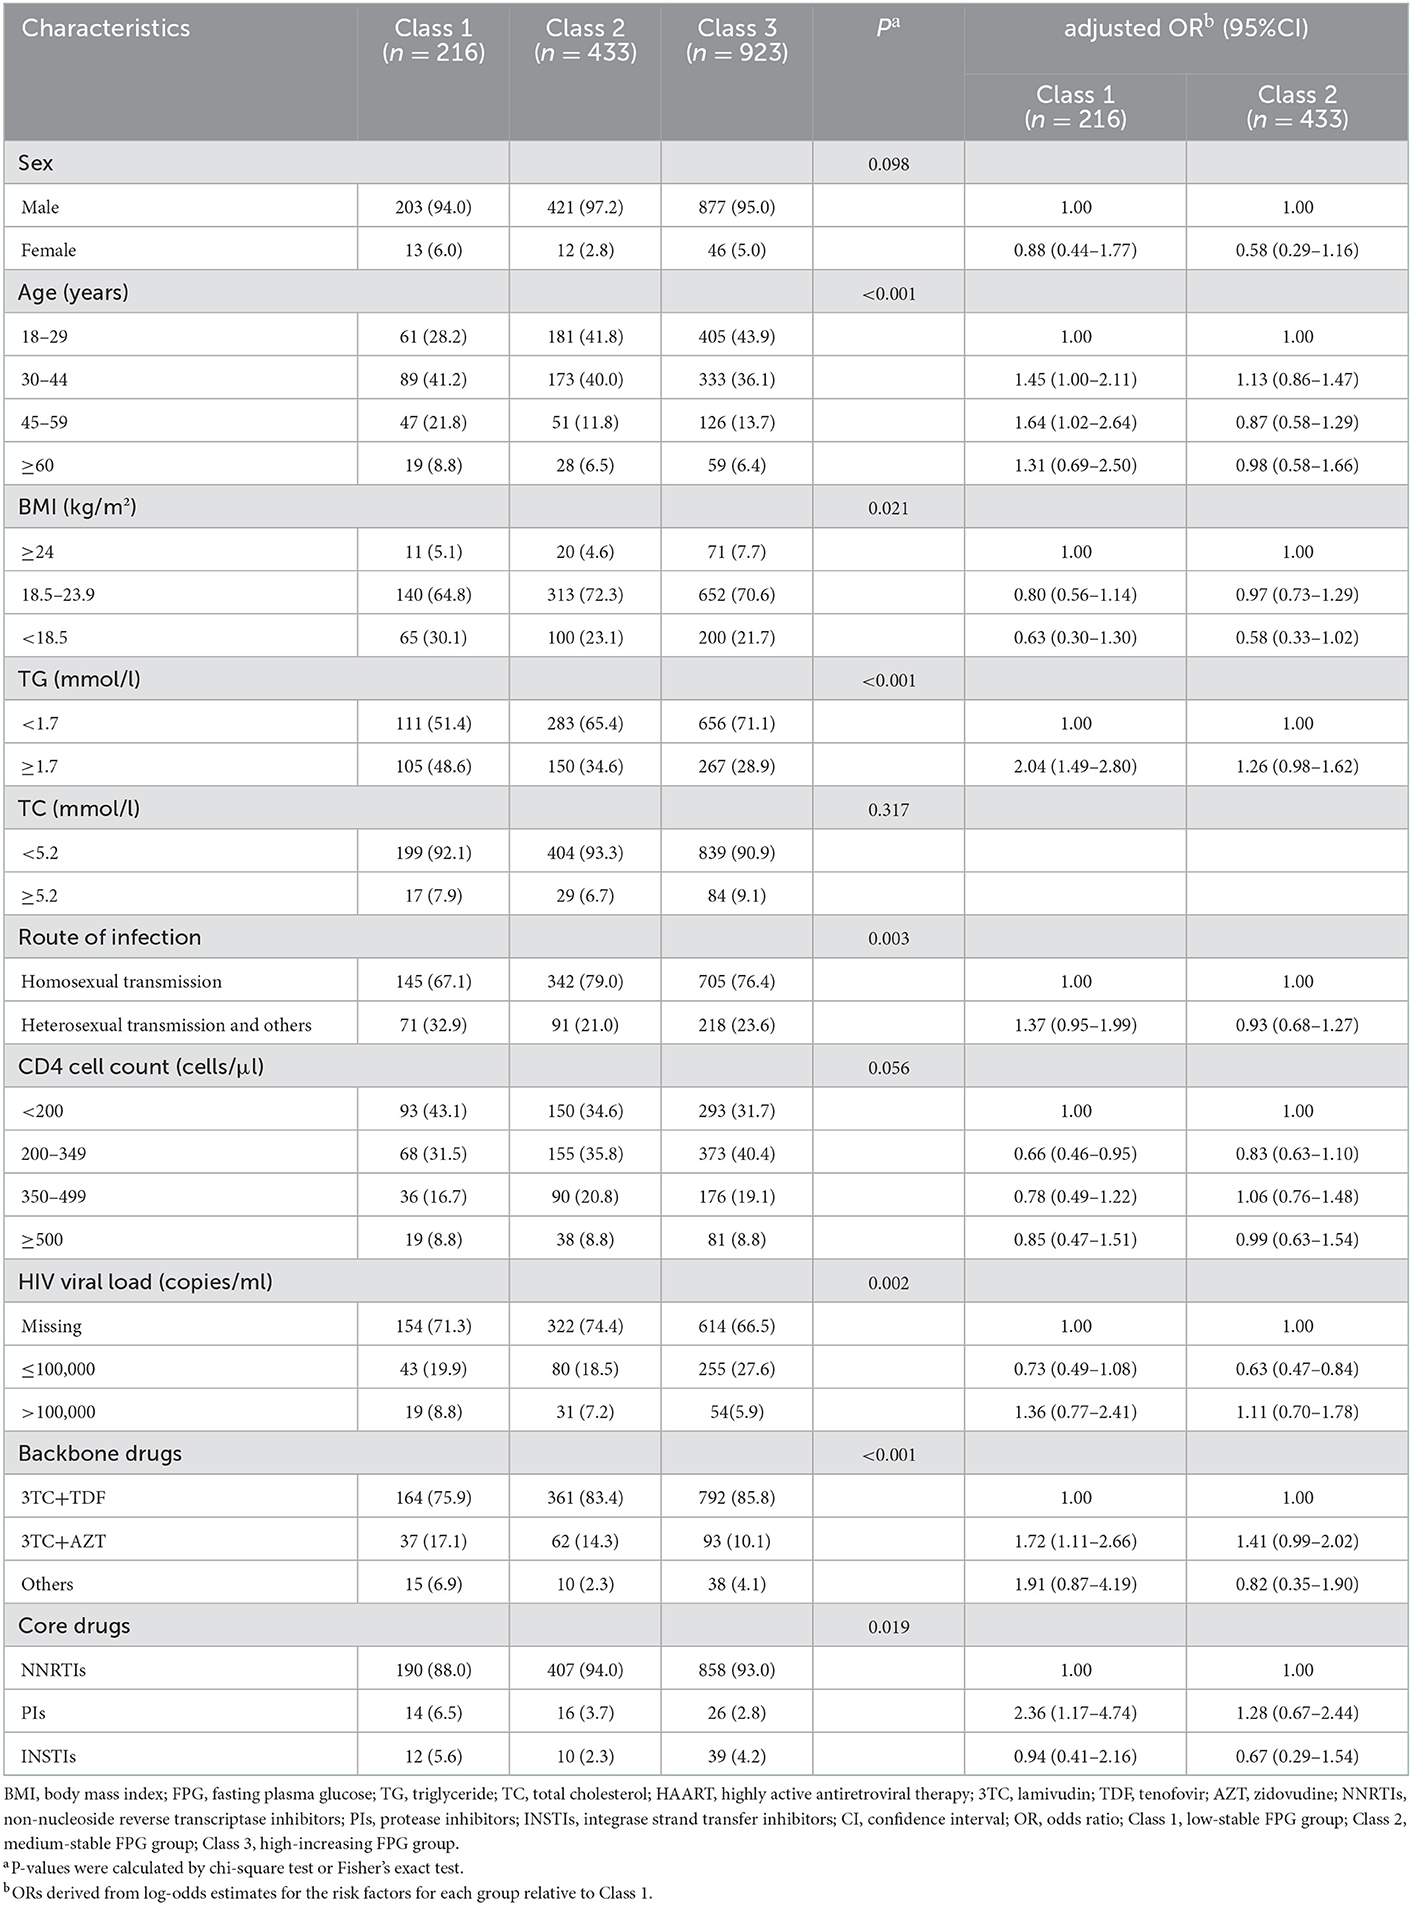
Table 3. Baseline characteristics of participants among three TG and TC dual-trajectory subgroups.
In the multivariable model (Table 3), age between 30 and 60 years, with high TG, the initial use of AZT and PIs were independently positively associated with class 1 when compared with class 3, whereas CD4 counts between 200 and 350 cells/μl had a negative association with class 1. HIV load of ≤ 100,000 copies/ml was independently negatively associated with class 2, whereas high TG and initial use of AZT had a marginally significant association with class 2.
No substantially different results were observed when limiting to participants with at least four measurements in different years or patients who maintained their initial ART regimens during follow-up in the outcomes of the GMM models, and the interpretation of the trajectory curves remained similar (Supplementary Figures 2–5).
Our study illustrates how GMM can be used to identify subgroups of longitudinal trajectories of plasma glucose and lipid levels in patients infected with HIV receiving HAART without any preconceived assumptions about the number and type of longitudinal profiles. Three FPG trajectory subgroups and three TG and TC dual-trajectory subgroups were identified, demonstrating heterogeneity in longitudinal changes in plasma glucose and lipid levels.
Although the overall FPG measurements showed an increasing tendency, most patients tested positive for HIV maintained stable FPG during follow-up. Few of the patients observed a strong non-linear increase in FPG, with a rising growth rate in the last few years of follow-up after a slight decrease in the first year. A recent study also showed that FPG declined and insulin increased during 12 months of ART, indicating that there might be an improvement in insulin secretion and health (30). In addition, some studies have shown that the longer the duration of HAART, the higher the risk of diabetes (31, 32), reflecting the possible cumulative effects of HIV infection or ART on diabetes.
It has been suggested that older age and high FPG levels were risk factors for diabetes and pre-diabetes (10). Similarly, in this study, age ≥30 years and high FPG were independent risk factors for medium-stable and high-increasing FPG trajectories. In addition, the D:A:D study demonstrated that diabetes risk among patients tested positive for HIV on ART increased linearly with increasing BMI (33). However, our research manifested that patients with overweight or obese had a higher risk of a high-increasing FPG trajectory than those with normal weight but had no statistically significant difference when compared with those underweight, presumably related to reverse causalities, such as a negative association between current smoking and BMI (34), which is an important contributor to the risk of diabetes (35). The association between baseline CD4 levels and different trajectories of FPG disappeared in the multivariable model. Some studies also did not reveal an association between CD4 levels and diabetes (36). In contrast, other studies demonstrated a negative association (37, 38), speculating that the improvement of immune system functionality might enhance glycemic control by easing the inflammatory response and oxidative stress to viral infection.
Initial use of AZT remained an independent risk factor for medium-stable FPG compared to TDF after adjusting for BMI and TG levels, consistent with the results of several studies (39, 40). The D:A:D research revealed that AZT remained an independent risk factor for diabetes after adjustment for lipids and lipodystrophy, suggesting that AZT may directly contribute to insulin resistance through mitochondrial toxicity (39).
In our research, both TG and TC levels increased during follow-up. Some previous evidence revealed that, before the initiation of ART, HIV infection resulted in lower TC, while increases in TC were observed after initiating ART (41), with feasible mechanisms being a reduction of systemic inflammation with virologic suppression (42). Unlike TC, TG levels were often elevated, related to reduced TG clearance, and the enhanced hepatic release of very-low-density lipoprotein (43). Interestingly, our research identified a stable TC and U-shaped slight-decreasing TG trajectory subgroup and a subgroup with the lowest TG and TC levels at the baseline but significantly increased during follow-up, indicating that lipid changing patterns were heterogeneous and might depend on multifactor such as the use of specific antiretroviral medications and lipid-lowering medications, genetic traits, and lifestyle factors.
Compared with individuals in class 3 presenting with optimal levels of these lipids, those in class 1 with initially high-increasing and slight-increasing TG and TC trajectories were characterized as middle-aged, hypertriglyceridemia at the baseline, initial use of AZT and PIs, and poorer health status at HAART initiation (i.e., CD4 counts of <200 cells/μl). A systematic review suggested that CD4 counts could be correlated with a greater chance of lipid changes (42). But no consistent conclusion has been reached on the direction and strength of the correlation between the CD4 counts and the lipid profiles (44, 45).
The class of antiretroviral drugs most frequently associated with dyslipidemia were probably the older generation PIs (11, 46), which can cause significant increases in TG, TC, and LDL-C levels. Similarly, our research found that the use of PI dominated by the older generation (i.e., LPV/r) was associated with the high-slight increasing lipid trajectory. Mechanisms of PIs producing modifications of lipid profile remain to be fully articulated. Putative mechanisms were that the sterol regulatory element–binding protein (SREBP)-1c regulating genes required for fatty acid metabolism, de novo cholesterol synthesis, and clearance of TG-rich and cholesterol-rich lipoproteins were inhibited by older generation PIs (46).
In addition, our results were comparable with previous research reporting that the AZT-containing regimen remained a risk factor for deteriorating TG and TC trajectories compared to the TDF-containing regimen (42, 46). TDF has been evidenced to have a lipid-lowering effect (47, 48) and was recommended as a backbone drug of first-line treatment (49). In contrast, AZT has been proven to be associated with lipid abnormalities (50). High ROS concentrations, associated with severe mitochondrial dysfunction produced by NRTIs, especially d4T and AZT, inhibited the expression of the adipogenic factor mitochondrial DNA (mtDNA) polymerase-⋎ and induced cell apoptosis, which could result in lipoatrophy and increase in free fatty acids (51).
The present study has the following strengths. First, the GMM approach, we used, had unique advantages over traditional analysis in describing the developmental process and classifying participants into diverse, mutually exclusive groups. Second, the dual-trajectory analysis used improved the accuracy of individual-specific probabilities of given group membership by integrating the interrelationship between both lipids. Despite these advantages, this study has limitations. First, some data, including diet, physical activity, and lipid-lowering medicine, were not collected, which could have been critical to the topic. Therefore, caution should be exercised in interpreting the present results. Second, this study was based on data from large public sector government HIV clinics in China, where most participants were patients with NNRTI-based regimens, male, and Asiatic. Thus, sample representativeness might be limited. Finally, given that we hope but did not have an opportunity to estimate the effect of FPG, TG, and TC trajectories on the hazard of CVD, more studies with large populations are needed to explore the association between the longitudinal trajectories of metabolic indicators and CVD incidence risk.
This study provides new information on the longitudinal development of FPG in patients tested positive for HIV on HAART with distinct trajectories of low-stable, medium-stable, and high-increasing classes. At the same time, three TG and TC joint development patterns were found, namely, high-slight increasing, low-rapid increasing TG and TC trajectories, and medium-stable TC and slight-decreasing TG trajectories. In brief, older age, poorer metabolic and immune status at the baseline, and initial use of some specific antiretrovirals (i.e., AZT and PIs) helped to identify the class with increasing glucose and lipid metabolism trajectories. Further research into the biological mechanisms explaining these underlying patterns of change is needed to discover and guide the future management of abnormal glucose and lipid metabolism in patients tested positive for HIV.
The original contributions presented in the study are included in the article/Supplementary material, further inquiries can be directed to the corresponding author.
The studies involving human participants were reviewed and approved by the Ethics Committee of Pudong New District Center for Disease Control and Prevention. Written informed consent for participation was not required for this study in accordance with the national legislation and the institutional requirements.
JL: methodology, data analysis, and writing–original draft. XX: data analysis and writing–review. PC: methodology and writing–review. ZN: conceptualization and writing–review. SX: resources, writing–review, and supervision. All authors contributed to the article and approved the submitted version.
This work was funded by the Key Specialty Construction Project in Pudong New Area Health System (grant number PWZzk2017-13).
The authors declare that the research was conducted in the absence of any commercial or financial relationships that could be construed as a potential conflict of interest.
All claims expressed in this article are solely those of the authors and do not necessarily represent those of their affiliated organizations, or those of the publisher, the editors and the reviewers. Any product that may be evaluated in this article, or claim that may be made by its manufacturer, is not guaranteed or endorsed by the publisher.
The Supplementary Material for this article can be found online at: https://www.frontiersin.org/articles/10.3389/fmed.2022.1071431/full#supplementary-material
1. Farahani M, Mulinder H, Farahani A, Marlink R. Prevalence and distribution of non-AIDS causes of death among HIV-infected individuals receiving antiretroviral therapy: a systematic review and meta-analysis. Int J STD AIDS. (2017) 28:636–50. doi: 10.1177/0956462416632428
2. Sapuła M, Suchacz M, Załeski A, Wiercińska-Drapało A. Impact of combined antiretroviral therapy on metabolic syndrome components in adult people living with HIV: a literature review. Viruses. (2022) 14:122. doi: 10.3390/v14010122
3. Pinto DSM, da Silva M. Cardiovascular disease in the setting of human immunodeficiency virus infection. Curr Cardiol Rev. (2018) 14:25–41. doi: 10.2174/1573403X13666171129170046
4. Gooden TE, Gardner M, Wang J, Jolly K, Lane DA, Benjamin LA, et al. Incidence of cardiometabolic diseases in people living with and without HIV in the UK: a population-based matched cohort study. J Infect Dis. (2021) 225:1348–56. doi: 10.1093/infdis/jiab420
5. Brown TT, Cole SR, Li X, Kingsley LA, Palella FJ, Riddler SA, et al. Antiretroviral therapy and the prevalence and incidence of diabetes mellitus in the multicenter AIDS cohort study. Arch Intern Med. (2005) 165:1179–84. doi: 10.1001/archinte.165.10.1179
6. Brown TT, Tassiopoulos K, Bosch RJ, Shikuma C, McComsey GA. Association between systemic inflammation and incident diabetes in HIV-infected patients after initiation of antiretroviral therapy. Diabetes Care. (2010) 33:2244–9. doi: 10.2337/dc10-0633
7. Shikuma CM, Day LJ, Gerschenson M. Insulin resistance in the HIV-infected population: the potential role of mitochondrial dysfunction. Curr Drug Targets Infect Disord. (2005) 5:255–62. doi: 10.2174/1568005054880163
8. Dimala CA, Blencowe H, Choukem SP. The association between antiretroviral therapy and selected cardiovascular disease risk factors in sub-Saharan Africa: a systematic review and meta-analysis. PLoS ONE. (2018) 13:e0201404. doi: 10.1371/journal.pone.0201404
9. Nduka CU, Stranges S, Kimani PK, Sarki AM, Uthman OA. Is there sufficient evidence for a causal association between antiretroviral therapy and diabetes in HIV-infected patients? A meta-analysis. Diabetes Metab Res Rev. (2017) 33:e2902. doi: 10.1002/dmrr.2902
10. Nansseu JR, Bigna JJ, Kaze AD, Noubiap JJ. Incidence and risk factors for prediabetes and diabetes mellitus among HIV-infected adults on antiretroviral therapy: a systematic review and meta-analysis. Epidemiology. (2018) 29:431–41. doi: 10.1097/EDE.0000000000000815
11. Lee D. HIV: how to manage dyslipidaemia in HIV. Drugs Context. (2022) 11:1–9. doi: 10.7573/dic.2021-8-7
12. Husain NE, Noor SK, Elmadhoun WM, Almobarak AO, Awadalla H, Woodward CL, et al. Diabetes, metabolic syndrome and dyslipidemia in people living with HIV in Africa: re-emerging challenges not to be forgotten. HIV AIDS. (2017) 9:193–202. doi: 10.2147/HIV.S137974
13. Russell E, Albert A, Côté H, Hsieh A, Nesbitt A, Campbell AR, et al. Rate of dyslipidemia higher among women living with HIV: a comparison of metabolic and cardiovascular health in a cohort to study aging in HIV. HIV Med. (2020) 21:418–28. doi: 10.1111/hiv.12843
14. Souza SJ, Luzia LA, Santos SS, Rondó PH. Lipid profile of HIV-infected patients in relation to antiretroviral therapy: a review. Rev Assoc Med Bras. (2013) 59:186–98. doi: 10.1016/j.ramb.2012.11.003
15. Verburgh ML, Wit F, Boyd A, Verboeket SO, Reiss P, van der Valk M. One in 10 virally suppressed persons with HIV in The Netherlands experiences ≥10% weight gain after switching to Tenofovir Alafenamide and/or integrase strand transfer inhibitor. Open Forum Infect Dis. (2022) 9:ofac291. doi: 10.1093/ofid/ofac291
16. Plum PE, Maes N, Sauvage AS, Frippiat F, Meuris C, Uurlings F, et al. Impact of switch from tenofovir disoproxil fumarate-based regimens to tenofovir alafenamide-based regimens on lipid profile, weight gain and cardiovascular risk score in people living with HIV. BMC Infect Dis. (2021) 21:910. doi: 10.1186/s12879-021-06479-9
17. Dayimu A, Wang C, Li J, Fan B, Ji X, Zhang T, et al. Trajectories of lipids profile and incident cardiovascular disease risk: a longitudinal cohort study. J Am Heart Assoc. (2019) 8:e013479. doi: 10.1161/JAHA.119.013479
18. Koohi F, Khalili D, Mansournia MA, Hadaegh F, Soori H. Multi-trajectories of lipid indices with incident cardiovascular disease, heart failure, and all-cause mortality: 23 years follow-up of two US cohort studies. J Transl Med. (2021) 19:286. doi: 10.1186/s12967-021-02966-4
19. Duncan MS, Vasan RS, Xanthakis V. Trajectories of blood lipid concentrations over the adult life course and risk of cardiovascular disease and all-cause mortality: observations from the Framingham study over 35 years. J Am Heart Assoc. (2019) 8:e011433. doi: 10.1161/JAHA.118.011433
20. Nguena Nguefack HL, Pagé MG, Katz J, Choinière M, Vanasse A, Dorais M, et al. Trajectory modelling techniques useful to epidemiological research: a comparative narrative review of approaches. Clin Epidemiol. (2020) 12:1205–22. doi: 10.2147/CLEP.S265287
21. Ram N, Grimm KJ. Growth mixture modeling: a method for identifying differences in longitudinal change among unobserved groups. Int J Behav Dev. (2009) 33:565–76. doi: 10.1177/0165025409343765
22. Mao Y, Wu Z, Poundstone K, Wang C, Qin Q, Ma Y, et al. Development of a unified web-based national HIV/AIDS information system in China. Int J Epidemiol. (2010) 39(Suppl. 2):ii79–89. doi: 10.1093/ije/dyq213
24. Lennon H, Kelly S, Sperrin M, Buchan I, Cross AJ, Leitzmann M, et al. Framework to construct and interpret latent class trajectory modelling. BMJ Open. (2018) 8:e020683. doi: 10.1136/bmjopen-2017-020683
25. van der Nest G, Passos VL, Candel MJJM, van Breukelen GJP. An overview of mixture modelling for latent evolutions in longitudinal data: modelling approaches, fit statistics and software. Adv Life Course Res. (2020) 43:100323. doi: 10.1016/j.alcr.2019.100323
26. Ram N, Grimm K. Using simple and complex growth models change: matching theory to articulate developmental to method. Int J Behav Dev. (2007) 31:303–16. doi: 10.1177/0165025407077751
27. Sijbrandij JJ, Hoekstra T, Almansa J, Peeters M, Bültmann U, Reijneveld SA. Variance constraints strongly influenced model performance in growth mixture modeling: a simulation and empirical study. BMC Med Res Methodol. (2020) 20:276. doi: 10.1186/s12874-020-01154-0
28. Hipp JR, Bauer DJ. Local solutions in the estimation of growth mixture models. Psychol Methods. (2006) 11:36–53. doi: 10.1037/1082-989X.11.1.36
29. van der Nest G, Passos VL, Candel M, van Breukelen GJP. Model fit criteria curve behaviour in class enumeration - a diagnostic tool for model (mis)specification in longitudinal mixture modelling. J Stat Comput Simul. (2022) 92:1640–72. doi: 10.1080/00949655.2021.2004141
30. Amare H, Olsen MF, Friis H, Andersen Å B, Abdissa A, Yilma D, et al. Predictors of glucose metabolism and blood pressure among Ethiopian individuals with HIV/AIDS after one-year of antiretroviral therapy. Trop Med Int Health. (2021) 26:428–34. doi: 10.1111/tmi.13544
31. Duguma F, Gebisa W, Mamo A, Tamiru D, Woyesa S. Diabetes mellitus and associated factors among adult HIV patients on highly active anti-retroviral treatment. HIV AIDS. (2020) 12:657–65. doi: 10.2147/HIV.S279732
32. Zanuzzi MG, Cattaneo MJ, López SM, Pérez Maure M, Romero CA. [Hypertension and metabolic syndrome in HIV infected patients]. Medicina. (2020) 80:453–61.
33. Achhra AC, Sabin C, Ryom L, Hatleberg C, Antonella d'Aminio M, de Wit S, et al. Body mass index and the risk of serious non-AIDS events and all-cause mortality in treated HIV-positive individuals: D: A: D cohort analysis. J Acquir Immune Defic Syndr. (2018) 78:579–88. doi: 10.1097/QAI.0000000000001722
34. Pan D, Wang S, Su M, Wei J, Wang K, Luo P, et al. Roles of drinking and diet in the U-shaped relationship between smoking and BMI in middle-aged and elderly Chinese rural adults. Sci Rep. (2020) 10:17118. doi: 10.1038/s41598-020-74414-0
35. Bellou V, Belbasis L, Tzoulaki I, Evangelou E. Risk factors for type 2 diabetes mellitus: an exposure-wide umbrella review of meta-analyses. PLoS ONE. (2018) 13:e0194127. doi: 10.1371/journal.pone.0194127
36. Chimbetete C, Mugglin C, Shamu T, Kalesan B, Bertisch B, Egger M, et al. New-onset type 2 diabetes mellitus among patients receiving HIV care at Newlands Clinic, Harare, Zimbabwe: retrospective cohort analysis. Trop Med Int Health. (2017) 22:839–45. doi: 10.1111/tmi.12896
37. Khoza SP, Crowther NJ, Bhana S. The effect of HIV infection on glycaemia and renal function in type 2 diabetic patients. PLoS ONE. (2018) 13:e0199946. doi: 10.1371/journal.pone.0199946
38. Duro M, Rebelo I, Barreira S, Sarmento-Castro R, Medeiros R, Almeida C. Glycaemic profile changes by highly active antiretroviral therapy in human immunodeficiency virus-infected patients. Int J STD AIDS. (2015) 26:796–802. doi: 10.1177/0956462414554814
39. De Wit S, Sabin CA, Weber R, Worm SW, Reiss P, Cazanave C, et al. Incidence and risk factors for new-onset diabetes in HIV-infected patients: the data collection on adverse events of anti-HIV drugs (D:A:D) study. Diabetes Care. (2008) 31:1224–9. doi: 10.2337/dc07-2013
40. Karamchand S, Leisegang R, Schomaker M, Maartens G, Walters L, Hislop M, et al. Risk factors for incident diabetes in a cohort taking first-line nonnucleoside reverse transcriptase inhibitor-based antiretroviral therapy. Medicine. (2016) 95:e2844. doi: 10.1097/MD.0000000000002844
41. Riddler SA, Smit E, Cole SR, Li R, Chmiel JS, Dobs A, et al. Impact of HIV infection and HAART on serum lipids in men. Jama. (2003) 289:2978–82. doi: 10.1001/jama.289.22.2978
42. Oliveira DPR, Macêdo APA, Dos Santos Gonçalves M, Couto RD. Dyslipidemia secondary to the use of HAART in adults: systematic review. Curr Drug Res Rev. (2022) 14:239–46. doi: 10.2174/2589977514666220519165549
43. Grunfeld C, Pang M, Doerrler W, Shigenaga JK, Jensen P, Feingold KR. Lipids, lipoproteins, triglyceride clearance, and cytokines in human immunodeficiency virus infection and the acquired immunodeficiency syndrome. J Clin Endocrinol Metab. (1992) 74:1045–52. doi: 10.1210/jcem.74.5.1373735
44. Samuel M, Jose S, Winston A, Nelson M, Johnson M, Chadwick D, et al. The effects of age on associations between markers of HIV progression and markers of metabolic function including albumin, haemoglobin and lipid concentrations. HIV Med. (2014) 15:311–6. doi: 10.1111/hiv.12103
45. Kamara DA, Smith C, Ryom L, Reiss P, Rickenbach M, Phillips A, et al. Longitudinal analysis of the associations between antiretroviral therapy, viraemia and immunosuppression with lipid levels: the D:A:D study. Antivir Ther. (2016) 21:495–506. doi: 10.3851/IMP3051
46. Non LR, Escota GV, Powderly WG. HIV and its relationship to insulin resistance and lipid abnormalities. Transl Res. (2017) 183:41–56. doi: 10.1016/j.trsl.2016.12.007
47. Hemkens LG, Ewald H, Santini-Oliveira M, Bühler JE, Vuichard D, Schandelmaier S, et al. Comparative effectiveness of tenofovir in treatment-naïve HIV-infected patients: systematic review and meta-analysis. HIV Clin Trials. (2015) 16:178–89. doi: 10.1179/1945577115Y.0000000004
48. Santos JR, Saumoy M, Curran A, Bravo I, Llibre JM, Navarro J, et al. The lipid-lowering effect of tenofovir/emtricitabine: a randomized, crossover, double-blind, placebo-controlled trial. Clin Infect Dis. (2015) 61:403–8. doi: 10.1093/cid/civ296
49. Ryom L, De Miguel R, Cotter AG, Podlekareva D, Beguelin C, Waalewijn H, et al. Major revision version 11.0 of the European AIDS clinical society guidelines 2021. HIV Med. (2022) 23:849–58. doi: 10.1111/hiv.13268
50. Curran A, Ribera E. From old to new nucleoside reverse transcriptase inhibitors: changes in body fat composition, metabolic parameters and mitochondrial toxicity after the switch from thymidine analogs to tenofovir or abacavir. Expert Opin Drug Saf. (2011) 10:389–406. doi: 10.1517/14740338.2011.542145
Keywords: HIV, HAART, growth mixture model, fasting plasma glucose, lipid
Citation: Lang J, Xin X, Chen P, Ning Z and Xiao S (2023) Distinct patterns of fasting plasma glucose and lipid profile levels over time in adults tested positive for HIV on HAART in Shanghai, China, revealed using growth mixture models. Front. Med. 9:1071431. doi: 10.3389/fmed.2022.1071431
Received: 16 October 2022; Accepted: 28 December 2022;
Published: 17 January 2023.
Edited by:
Roland Eghoghosoa Akhigbe, Ladoke Akintola University of Technology, NigeriaReviewed by:
Pachamuthu Balakrishnan, Saveetha Institute of Medical and Technical Sciences (SIMATS), IndiaCopyright © 2023 Lang, Xin, Chen, Ning and Xiao. This is an open-access article distributed under the terms of the Creative Commons Attribution License (CC BY). The use, distribution or reproduction in other forums is permitted, provided the original author(s) and the copyright owner(s) are credited and that the original publication in this journal is cited, in accordance with accepted academic practice. No use, distribution or reproduction is permitted which does not comply with these terms.
*Correspondence: Shaotan Xiao, MjI5MDQ3MzUyOEBxcS5jb20=
Disclaimer: All claims expressed in this article are solely those of the authors and do not necessarily represent those of their affiliated organizations, or those of the publisher, the editors and the reviewers. Any product that may be evaluated in this article or claim that may be made by its manufacturer is not guaranteed or endorsed by the publisher.
Research integrity at Frontiers
Learn more about the work of our research integrity team to safeguard the quality of each article we publish.