 Yinghao Li
 Yiwei Du
 Yanlong Zhang1†
- 1Department of Urology, Beijing Shijitan Hospital, Capital Medical University, Beijing, China
- 2Department of Nephrology, Tangdu Hospital, Air Force Military Medical University (Fourth Military Medical University), Xi’an, China
- 3Department of Urology, Beijing Chao-Yang Hospital, Capital Medical University, Beijing, China
- 4Institute of Urology, Capital Medical University, Beijing, China
- 5Department of Research Ward, Beijing Chao-Yang Hospital, Capital Medical University, Beijing, China
Background: Acute kidney injury is a common renal disease with high incidence and mortality. Early identification of high-risk acute renal injury patients following renal transplant could improve their prognosis, however, no biomarker exists for early detection.
Methods: The GSE139061 dataset was used to identify hub genes in 86 DEGs between acute kidney injury and control samples using three machine learning algorithms (LASSO, random forest, and support vector machine-recursive feature elimination). We used GSEA to identify the related signal pathways of six hub genes. Finally, we validated these potential biomarkers in an in vitro hypoxia/reoxygenation injury cell model using RT-qPCR.
Results: Six hub genes (MDFI, EHBP1L1, FBXW4, MDM4, RALYL, and ESM1) were identified as potentially predictive of an acute kidney injury. The expression of ESM1 and RALYL were markedly increased in control samples, while EHBP1L1, FBXW4, MDFI, and MDM4 were markedly increased in acute kidney injury samples.
Conclusion: We screened six hub genes related to acute kidney injury using three machine learning algorithms and identified genes with potential diagnostic utility. The hub genes identified in this study might play a significant role in the pathophysiology and progression of AKI. As such, they might be useful for the early diagnosis of AKI and provide the possibility of improving the prognosis of AKI patients.
Introduction
Acute kidney injury (AKI) is a common renal disease associated with high mortality and morbidity rates. At present, AKI accounts for 10–15% of complications in hospitalized patients, with an associated mortality of approximately 23.9% (1). AKI is often secondary to ischemia-reperfusion (I/R) injury following kidney transplant, major surgery, nephrotoxic drugs, and general infection (2). Simultaneously, AKI of the donor’s kidney directly impairs the recovery of renal function and organ survival following transplantation (3). AKI might develop immediately post-transplantation after initial recovery of kidney function or might occur later in recovery. In both settings, AKI can originate from unrecognized severe clinical conditions that require prompt intervention to prevent graft loss. Such prompt responses can improve the prognosis of patients with AKI, which relies on early diagnosis (4). At present, the main diagnostic criteria for AKI include the “risk, injury, failure” (RIFLE) standard developed by the acute dialysis quality initiative group (5), the improved RIFLE standard from the AKI network (6), and the kidney disease: Improving Global Outcomes (KDIGO) standard (7). Although all three are widely used clinically, there remain controversies in predicting delayed graft function or post-transplant outcomes.
Research studies have gradually deepened our understanding of the pathophysiology and molecular biological mechanisms underlying AKI (8, 9). Multiple mechanisms have been proposed to be involved in AKI pathophysiology, such as ischemia-reperfusion injury, inflammation, autophagy, and oxidative stress, but their relationships have not been thoroughly investigated (10). The pathogenesis of AKI involves injury to renal tubular cells, glomerular cells, and renal interstitial cells and can be classified as prerenal, renal, or postrenal. The mechanisms of injury include apoptosis, proptosis, autophagy, oxidative stress, etc. However, these cellular events occur following the initiation of AKI; once these molecular mechanisms are initiated, cells are beyond rescue. As such, it is critical to identify the molecular features involved in initiating AKI to facilitate the development of effective therapeutic strategies for halting AKI.
Many studies have attempted to identifies early AKI diagnostic biomarkers. Parikh CR et al. identified kidney injury molecule-1 (KIM-1) as a biomarker of acute kidney injury (11); compared with creatinine, the urine concentration of KIM-1 rises within 24h of AKI onset. It has been demonstrated that TIMP-2 and IGFBP7 are useful in predicting acute kidney injury following cardiac surgery (12), and compared with other biomarkers, TIMP-2 and IGFBP7 might be useful to predict the onset of severe AKI. In addition, other biomarkers have been tested in preclinical settings. Compared with patients without AKI after kidney transplantation, there is an increase of secretory leucocyte peptidase inhibitor (SLPI) in AKI patient plasma and urine; SLPI has a unique significance in transplantation-related AKI (13), and in the perfusion solution. It may help to identify graft quality after kidney transplantation (14). In the mouse model of ischemic AKI, ischemia can upregulate the expression of macrophage migration inhibitor 2, thereby promoting the release of SLPI and imparting renal protection. In addition, SLPI mRNA is shown to be significantly up-regulated in renal biopsies of AKI patients during the early stage after renal transplantation, compared with patients not affected by post-transplant AKI (15). However, the availability of sensitive and specific biomarkers related to the etiology of AKI is limited. With the development of high-throughput sequencing and bioinformatics, we can analyze the molecular features of AKI and quickly select relevant disease markers from the genome. Compared with traditional research approaches, we can further investigate the molecular characteristics of AKI by applying these techniques (16, 17). The detection of AKI-related biomarkers might be more able to reflect the pathophysiological processes underlying AKI and is expected to become a means of diagnosis and evaluation of AKI in the future.
In this study, mRNA microarray data was used to explore the molecular features of AKI. We further identified the AKI signature using machine learning. Finally, we validated these potential biomarkers via an in vitro hypoxia/reoxygenation injury model.
Materials and methods
Collection and processing of acute kidney injury datasets
A study flowchart was shown in Supplementary Figure 1. The mRNA sequencing and its clinical data associated with AKI samples and control samples (Supplementary Table 1) were obtained from the Gene Expression Omnibus (GEO) database (GSE139061)1 (18), and there was no significant difference in age (p = 0.27) and gender (p = 0.33) between the AKI samples and control samples in this study. It included high throughput RNA sequencing data from 39 AKI and 9 control samples; the platform of this data set was GPL20301 [Illumina HiSeq 4000 (Homo sapiens)]. The count values were normalized by log2(n+1) (Supplementary Figure 2).
Differentially expressed genes and gene enrichment analysis
The limma package (version 3.52.0) was used to identify differentially expressed genes (DEGs) between AKI and control samples (19); the Wilcox test was used to calculate the p-values with significant DEGs defined by the absolute values of log fold change ≥ 1 (| logFC | ≥ 1, it means the log fold change of genes from AKI samples and control samples) and adjusted p-values < 0.05. Then the associated pathway and process enrichment analysis of DEGs were carried out using Metascape2 (20, 21).
Hub genes selection based on machine learning algorithms
Three machine learning algorithms were used to select the gene signatures associated with AKI, including SVM Recursive Feature Elimination (SVM-RFE) (22), LASSO Model (23), and Random Forest Model (24).
SVM-RFE algorithm was applied using “rfe” in the R package “caret” (version 6.0-92); SVM-RFE is widely used to rank features and select gene signatures. To validate the SVM-RFE model, we used tenfold cross-validation to select the AKI-related gene signatures. The LASSO model is a dimensionality reduction method for evaluating high-dimensional data. A LASSO model was fitted using the “cv.glmnet” function in the R package “glmnet” (version 4.1-4). R package “randomForest” (version 4.7-1.1) was used to build the random forest model, which is a supervised nonparametric classification method. Finally, the AKI-related hub genes were obtained by the intersecting genes of the above three machine learning models. Finally, the receiver operating characteristic (ROC) curves and the area under the curve (AUC) were used to evaluate the diagnostic efficacy; the 95% confidence intervals (1,000 iterations) of the AUC were estimated by the bootstrap algorithm (25).
Construction of the nomogram model
We created a nomogram model to predict AKI using the R package “rms” (version: 6.3-0). The expression of each gene has a corresponding point. The “Total Points” reflected the sum of all the above elements.
Gene set enrichment analysis
Using the function “gseKEGG” of the R package “ClusterProfiler” (version 4.4.4), GSEA was performed to investigate the potential functions of the hub genes with the following parameters (nPerm = 10,000, minGSSize = 10, maxGSSize = 200, pvalueCutoff = 0.05, pAdjustMethod = “none”) (26).
Cell culture and treatment
The human renal proximal tubular cell line HK-2 was obtained from the China Center for Type Culture Collection (GDC0152, Wuhan, China) and cultivated in DMEM/F-12 supplemented with 10% FBS, 100 U/ml penicillin, and 100 μg/ml streptomycin in a humidified atmosphere of 5% CO2 at 37°C. The cells were plated in six-well plates and were treated at 80–90% confluence. The cells in the hypoxia and reoxygenation (H/R) groups were cultured with glucose-free and serum-free medium for 6h under hypoxic conditions (1% O2, 94% N2, and 5% CO2) with following regular culture treatment with oxygen for 3, 6, and 12h in a general incubator (5% CO2 and 95% air), respectively (27, 28). Subsequently, cells were collected at the indicated time points mentioned above for further verification.
Real-time quantitative PCR analysis
Total RNA extracted from cells following treatment using an M5 Universal RNA Mini Kit (MF-033-01, Mei5 Biotechnology, Beijing, China); 500 ng of RNA was reverse transcribed for cDNA synthesis. The primer sequences used in this study are summarized in Supplementary Table 2. Real-time quantitative PCR (RT-qPCR) was used to assess the relative expression level of genes compared to actin. Relative gene expression expression was calculated using 2–ΔΔCt.
Statistical analysis
Unpaired Student’s t-test was used to compare two groups with normally distributed variables, while Mann–Whitney U-test was used to compare two groups with non-normally distributed variables. For comparisons of three groups, one-way analysis of variance and Kruskal–Wallis tests of variance were used as parametric and nonparametric methods, respectively. The Chi-square or Fisher’s exact tests were used to analyze variables in the contingency table. Statistical significance was defined as a two-tailed p < 0.05. R software was used to conduct all statistical analyses (version 4.1.0; RStudio, Boston, MA, USA).
Results
Identification and gene enrichment analyses of differentially expressed genes
Differential expression analysis was conducted for 16,092 genes. By using our identification criteria, we identified 86 DEGs between the 39 AKI and 9 control samples. Among them, there were 10 down-regulated genes and 76 up-regulated genes (Supplementary Table 1). A heatmap (Figure 1A) and a volcano plot (Figure 1B) were used to visualize down-regulated genes and up-regulated genes in this study. Metascape was used to conduct enrichment analysis of these DEGs to gain a deeper understanding of their biological functions and characteristics [(Figures 2A,B) see text footnote 2]. The results of this were summarized in Supplementary Table 3 (21, 29). We found 40 terms with p < 0.05, including the PID MYC ACTIV PATHWAY (M66), positive regulation of endothelial cell proliferation (GO:0001938), maintenance of location (GO:0051235), and SUMO E3 ligases SUMOylate target proteins (R-HSA-3108232). It appeared that these DEGs are closely related to the composition and function of cells. The enrichment ontology cluster graph and its relationship were shown in Figure 2B.
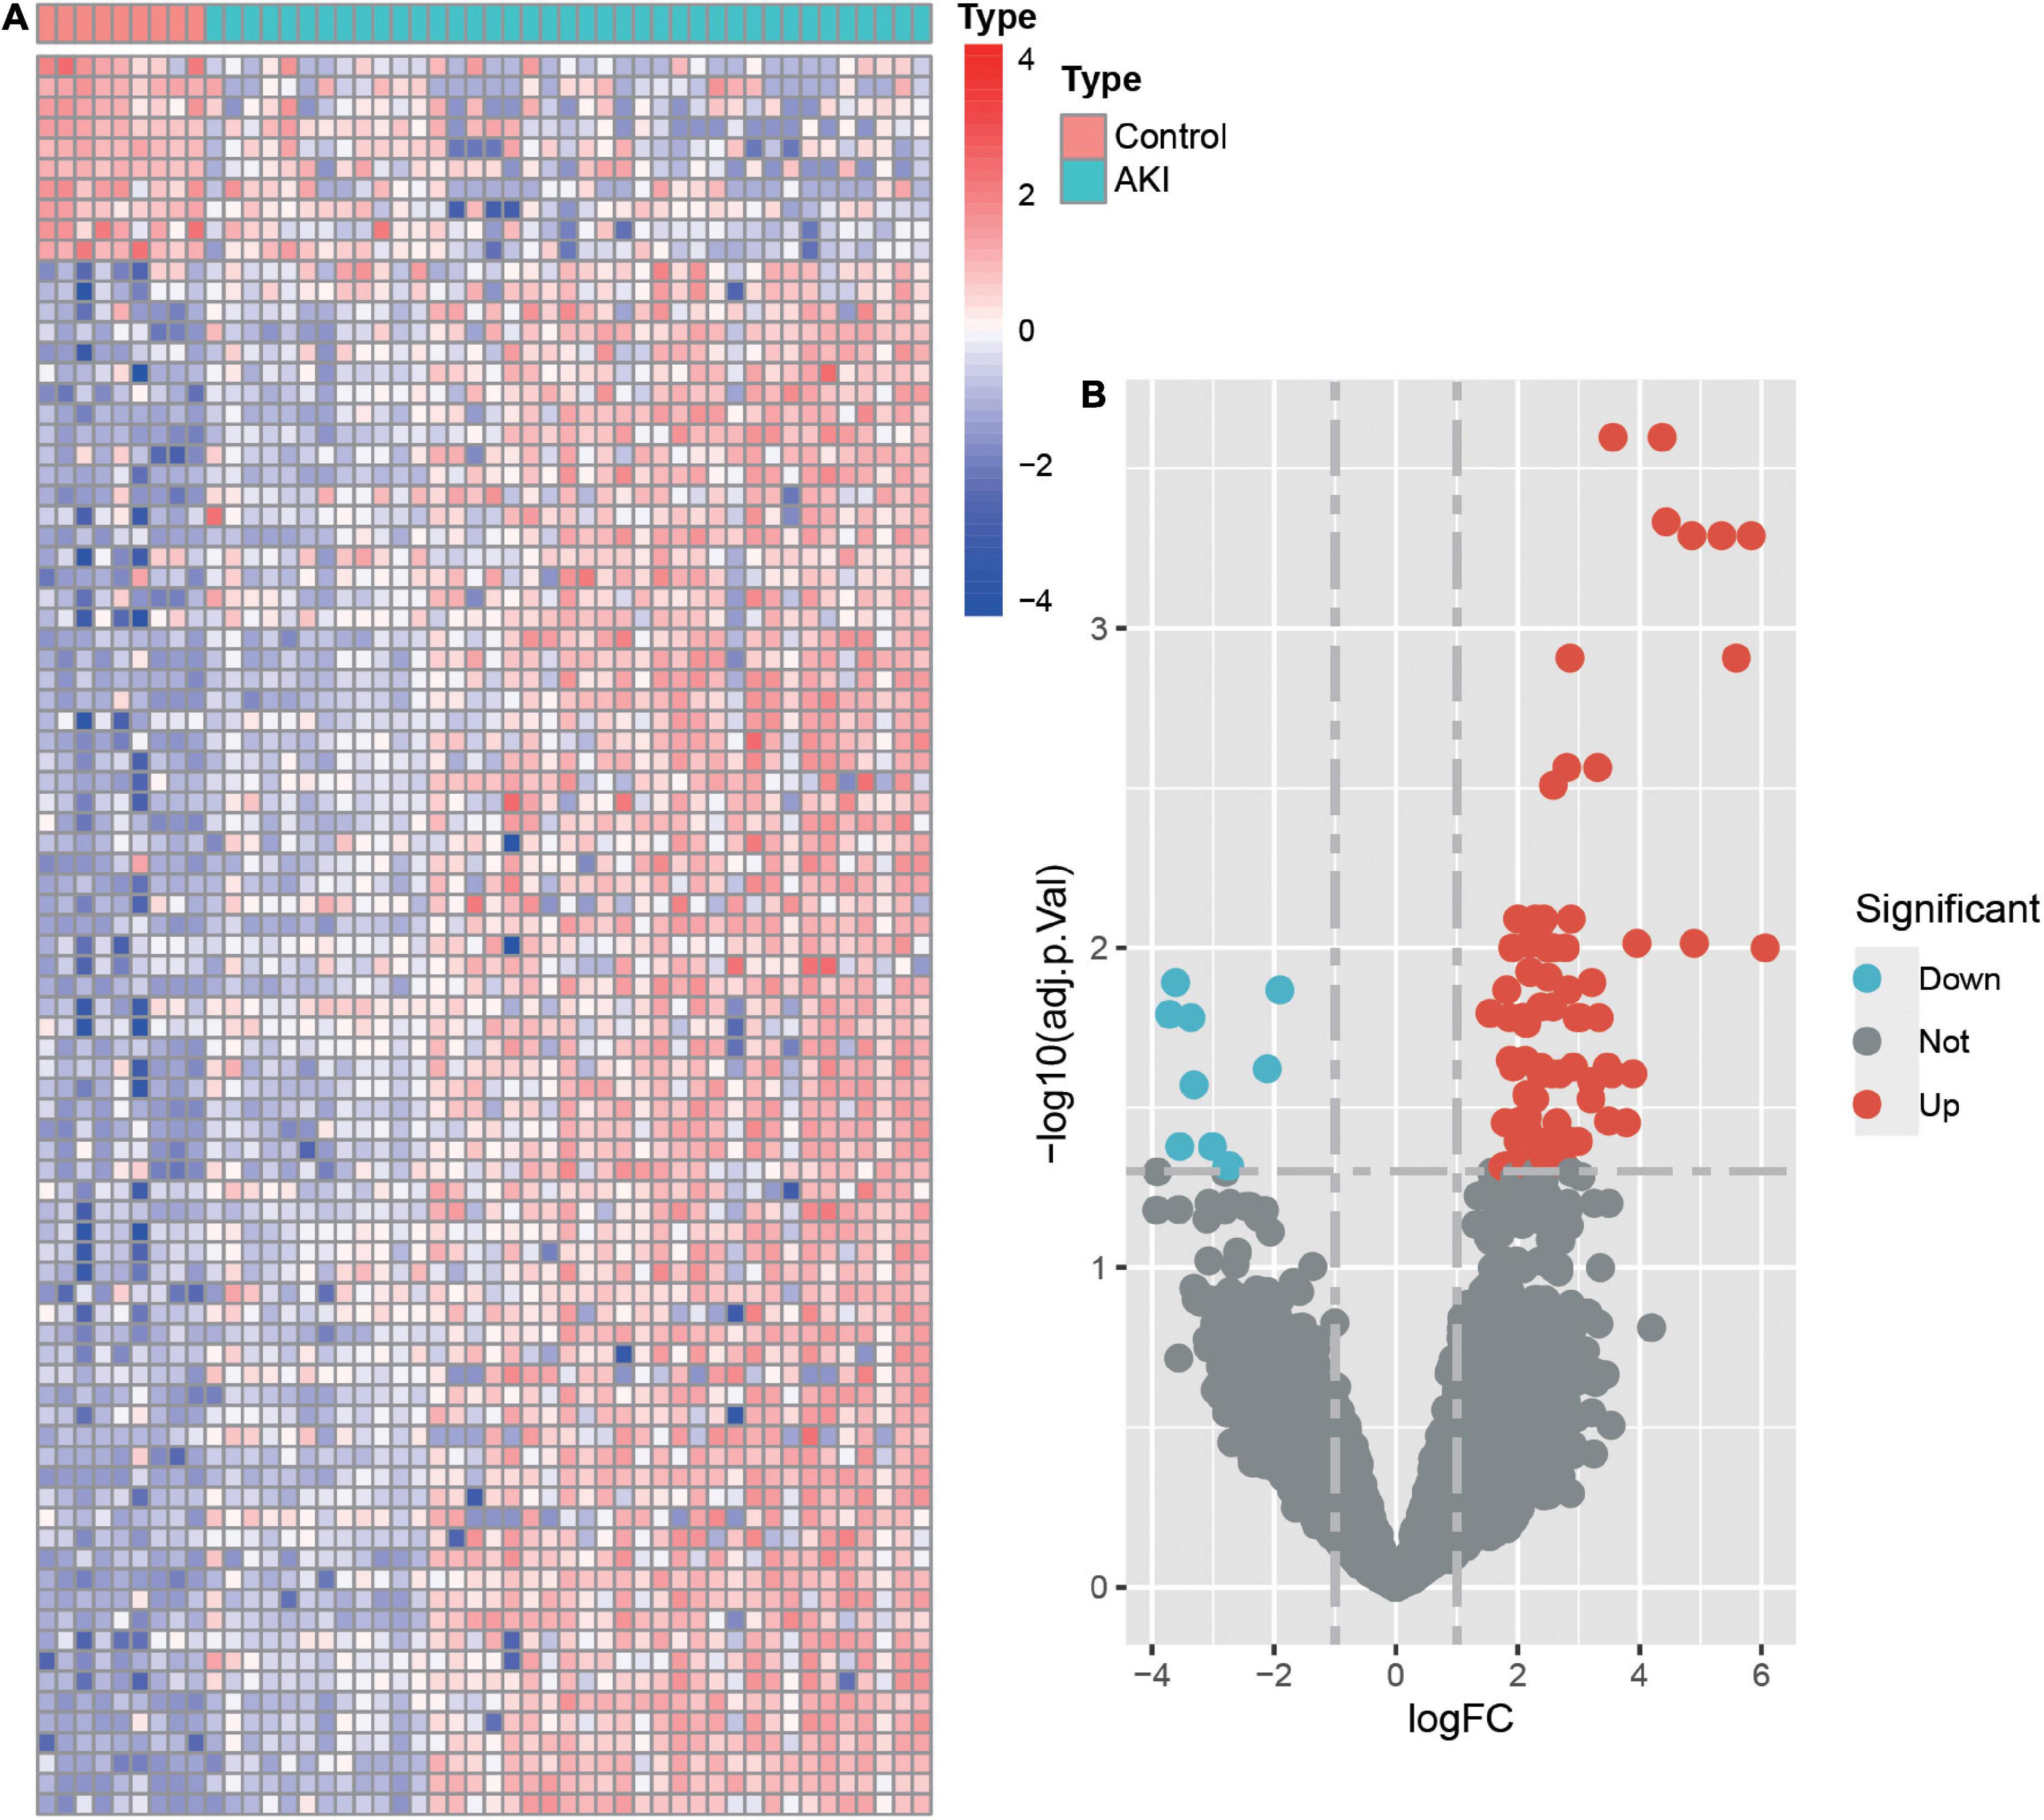
Figure 1. The heatmap and volcano plot of differentially expressed genes (DEGs). (A) Heatmap of DEGs. The vertical axis represents the samples, and the horizontal axis represents differentially expressed genes. Red indicates upregulated genes, and blue represents downregulated genes. (B) Volcano plot of DEGs. The x-axis represents the log FC, and the y-axis represents the -log10 (adjusted p-value). The blue dots represent downregulated genes, and the red dots represent upregulated genes.
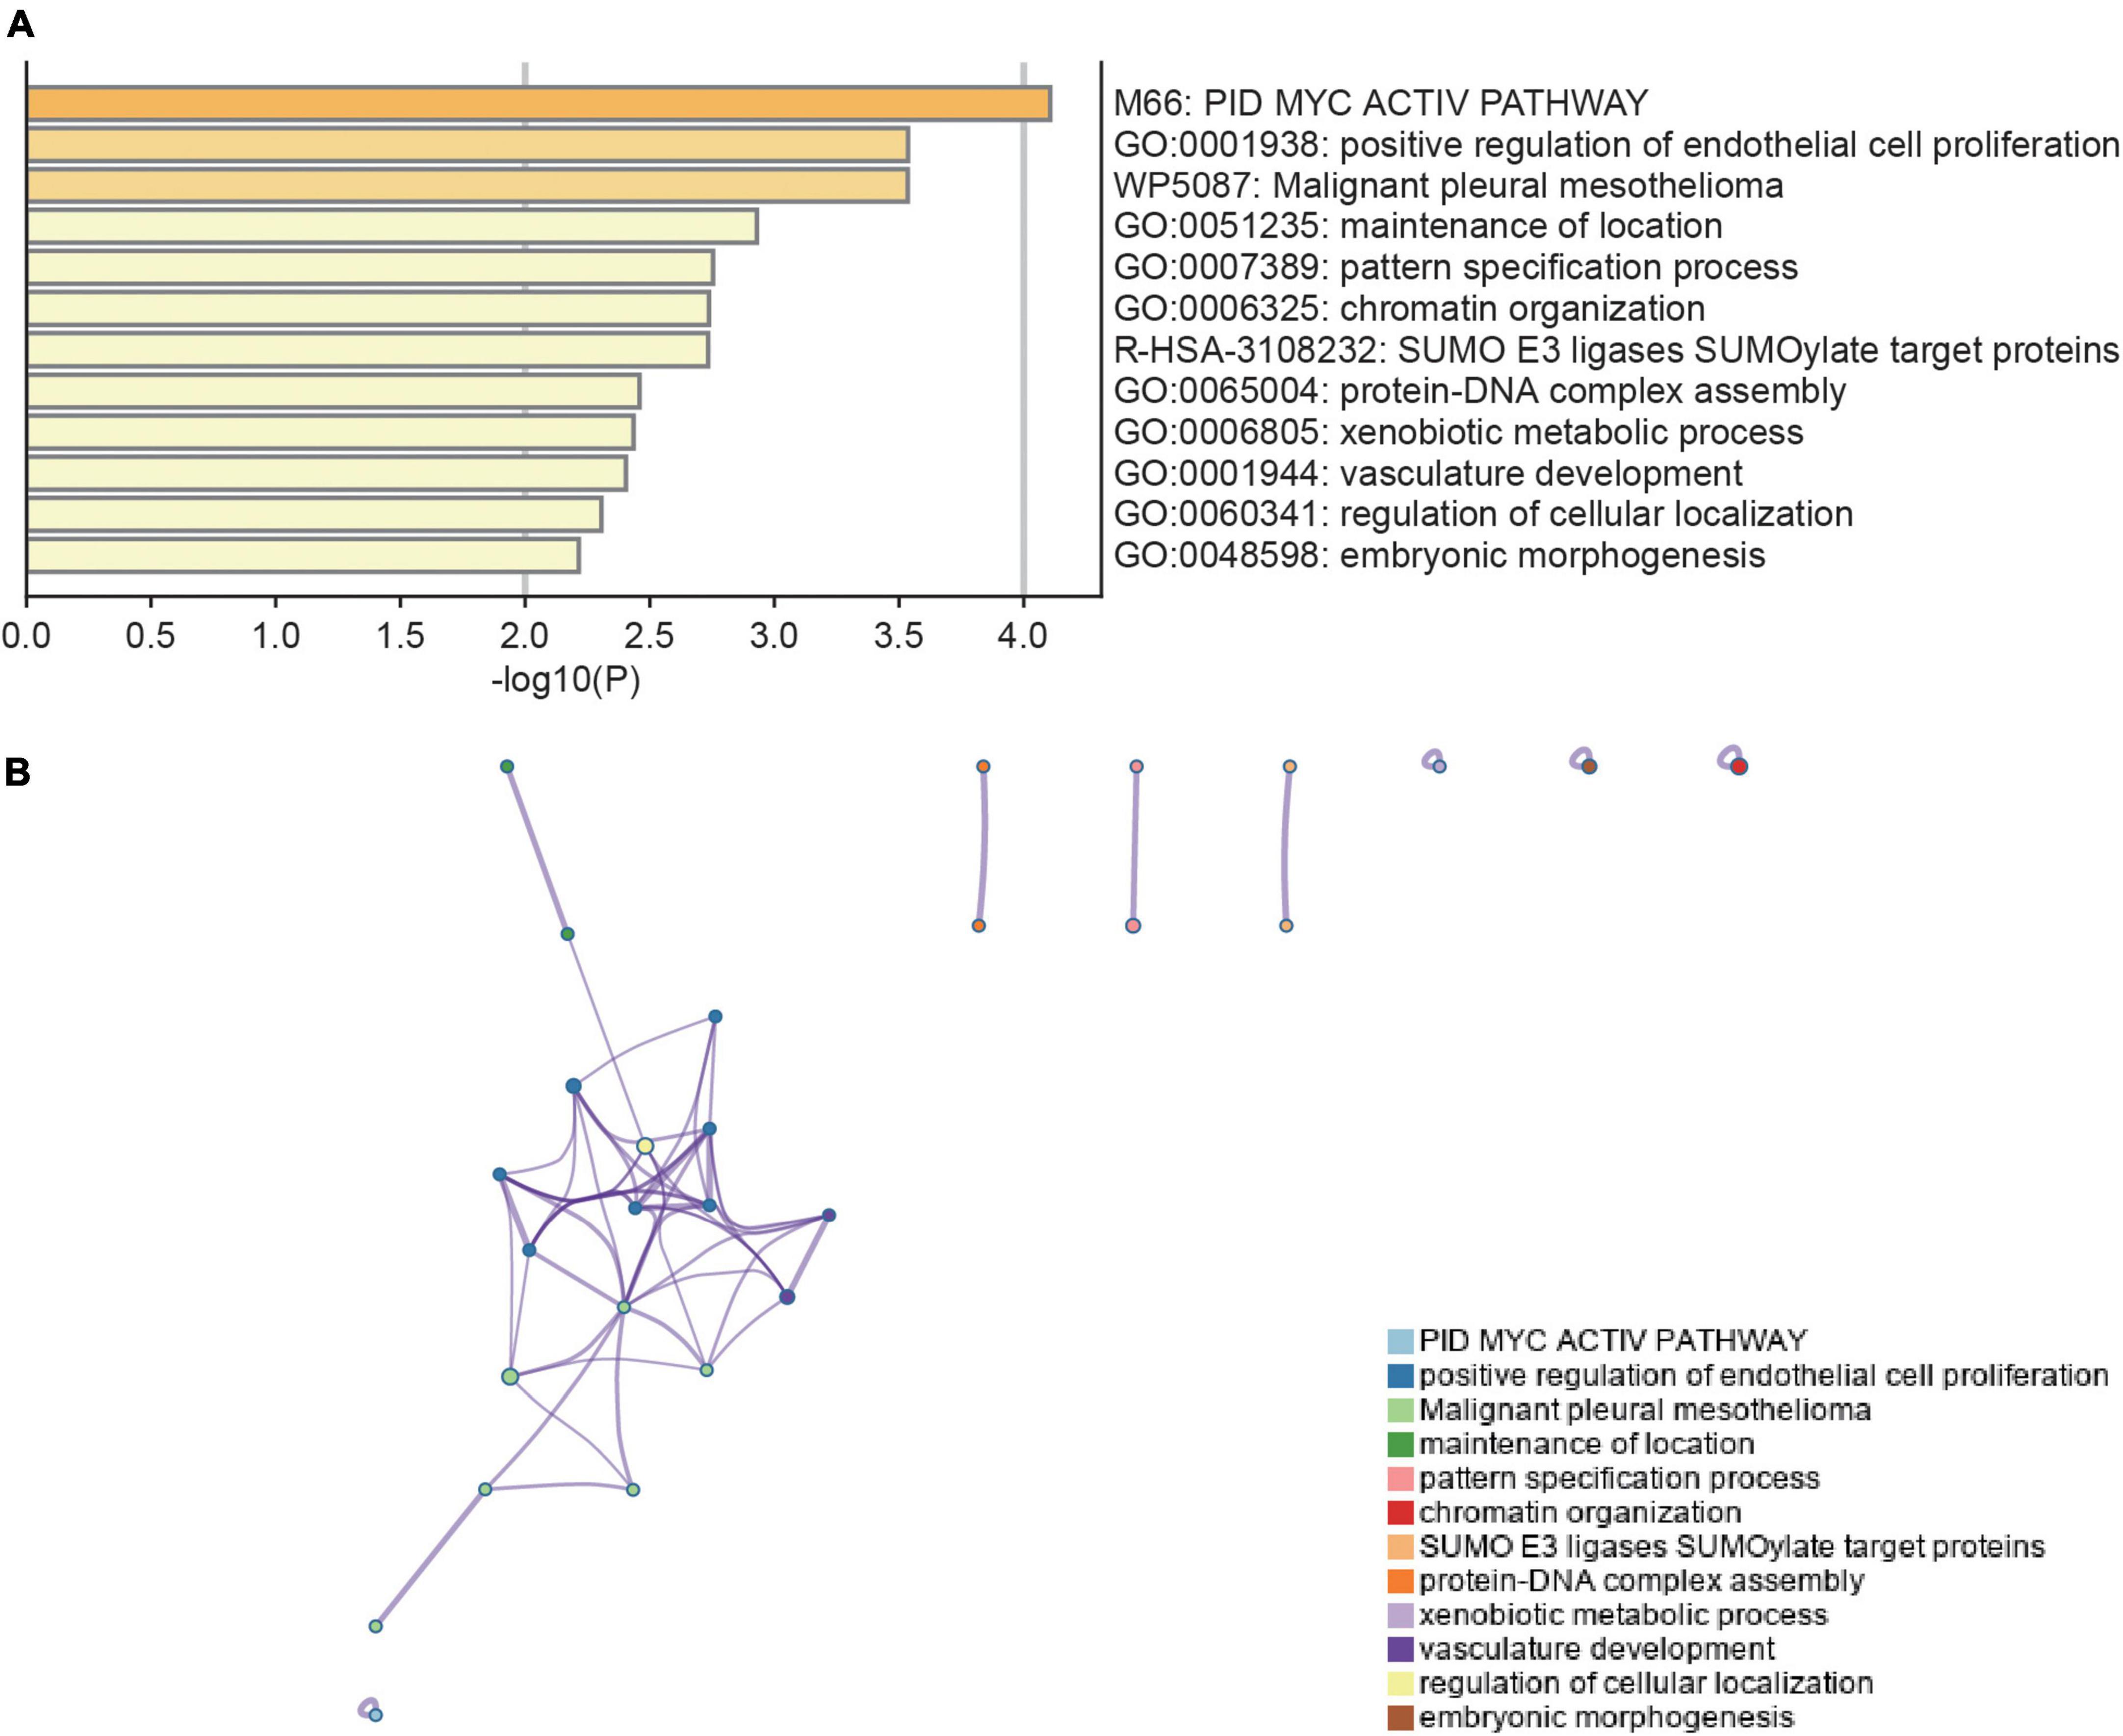
Figure 2. Functional enrichment analysis of DEGs. (A) Bar chart of functional enrichment terms colored by p-values (the darker the color, the smaller the p-value). (B) The functional enrichment ontology clustering graph represents each term as a circle, and each cluster has a unique color, which means that circles of the same color are associated with the same cluster. The edges connect terms that have a similarity score of >0.3 which influences the density of the edge line. Metascape (http://metascape.org) was utilized for visualization.
Hub genes selection based on support vector machine recursive feature elimination, LASSO, and random forest
Three machine learning algorithms were used to select hub genes in 86 DEGs between AKI and control samples. In the SVM-RFE model, we found that when the number of features is 28, the maximum accuracy of the classifier was 1 (Figure 3A), and the minimum error of the classifier was 0 (Figure 3B), which include AGTR1, RALYL, GPC2, UPF2, EHBP1L1, EGFL7, ESM1, TRIM65, MDM4, FBXW4, PODXL, ADORA2A, AEBP2, ARL6IP6, KCNK6, PSMG1, TMEM255B, HOXC8, ANP32B, TEAD4, PTCH2, EGF, BTBD19, MDFI, TEN1-CDK3, CHTF8, ATAD2, and TNK2. In the LASSO model, after ten-fold cross-validation, there were 11 characteristic genes (Figures 3C,D), including MDFI, PTMS, EHBP1L1, FBXW4, MDM4, AGTR1, UBAP1L, NAP1L1, PODXL, RALYL, and ESM1. In the random forest model, 20 characteristic genes were determined with importance > 0.25 (Figure 3E), including EHBP1L1, PTMS, HOXA6, FBXW4, ANP32B, C16orf72, MDM4, UBAP1L, MDFI, PTCH2, ANK3, RALYL, AEBP2, RRP9, PLEKHN1, GSTA1, UPF2, CA11, ESM1, and OGFR. Finally, we selected the intersection of the results of the above three algorithms which delivered the hub genes MDFI, EHBP1L1, FBXW4, MDM4, RALYL, and ESM1. We visualized the hub genes with a veen diagram (Figure 3F).
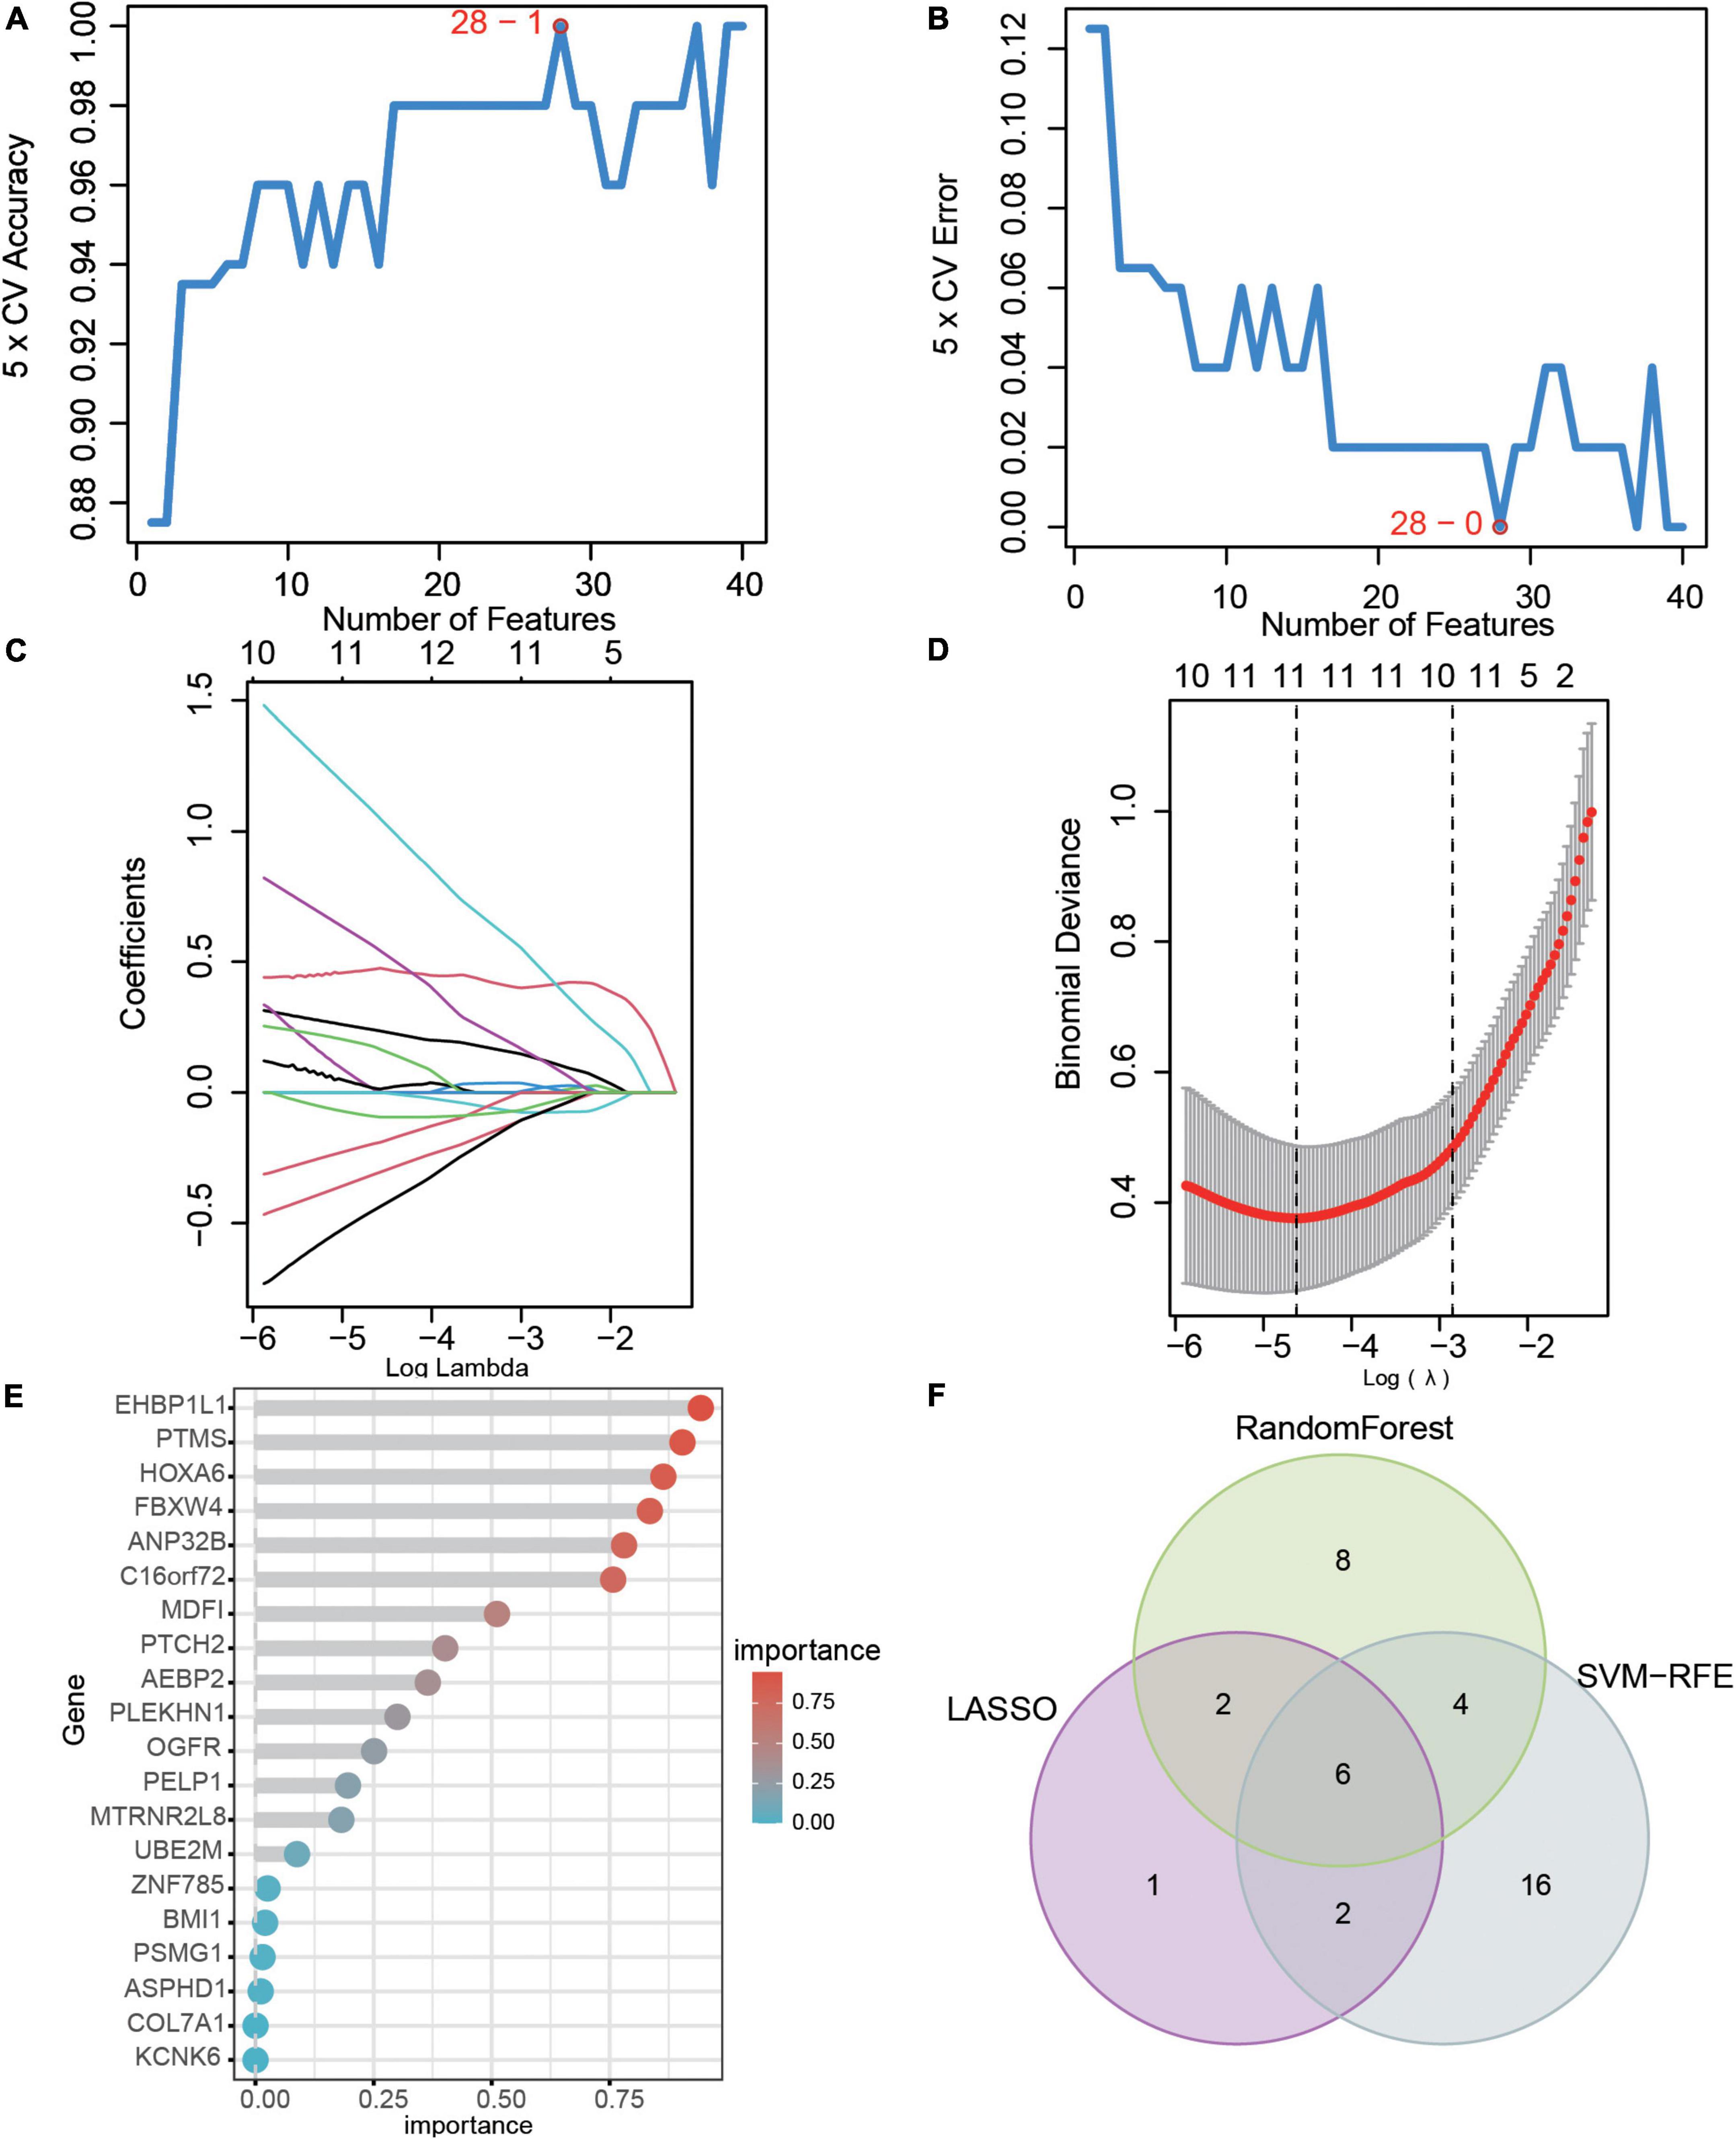
Figure 3. Hub genes selection based on machine learning algorithms. (A) The accuracy and (B) the error of the feature selection for the SVM-RFE algorithm. (C) 10-flod cross-validation for tuning parameter selection in the LASSO model. Each curve corresponds to a single gene. (D) LASSO coefficient profiles of DEGs. The solid vertical lines represent the partial likelihood of deviance SE. The dotted vertical line is drawn at the optimal Lambda. (E) The rank of genes by their relative importance in the random forest algorithm. (F) Venn diagram showing the characteristic genes shared by LASSO, random forest, and SVM-RFE algorithms.
Modeling of an acute kidney injury diagnostic nomogram
We built an AKI diagnostic nomogram (Supplementary Figure 3A) for the hub genes (MDFI, EHBP1L1, FBXW4, MDM4, RALYL, and ESM1). Then, the diagnostic efficiency of the nomogram was evaluated by using ROC and AUC, we found that the AUC = 1 of the nomogram (Supplementary Figure 3B). The coefficients of this nomogram were in the Supplementary Table 4, and the total points could be calculated as follows:
The diagnostic efficacy of hub genes in predicting acute kidney injury
Receiver operating characteristic and AUC were used to evaluate the diagnostic efficacy of the six identified hub genes in predicting AKI. These showed a potential efficacy in predicting AKI: the AUC were 0.872 (95% CI 0.732–0.974) for ESM1 (Figure 4A), 0.917 (95%CI: 0.778–1.000) for EHBP1L1(Figure 4B), 0.949 (95%CI: 0.826–1.000) for FBXW4 (Figure 4C), 0.970 (95%CI: 0.912–1.000) for MDFI (Figure 4D), 0.974 (95%CI: 0.923–1.000) for MDM4 (Figure 4E), and 0.886 (95%CI: 0.786–0.974) for RALYL (Figure 4F). Then, cutoff values for hub genes were calculated by ROC analysis and were shown in Supplementary Table 4. Some calculations were made according to the cutoff values including calculation of the sensitivity values, specificity values, positive predictive values, and negative predictive values, MDFI (cutoff value = 5.04, sensitivity value = 0.93, specificity value = 1.00, positive predictive value = 1.000, negative predictive value = 0.75), EHBP1L1 (cutoff value = 9.32, sensitivity value = 0.97, specificity value = 0.89, positive predictive value = 0.97, negative predictive value = 0.89), FBXW4 (cutoff value = 8.91, sensitivity value = 0.97, specificity value = 0.89, positive predictive value = 0.97, negative predictive value = 0.89), MDM4 (cutoff value = 10.14, sensitivity value = 0.95, specificity value = 1.00, positive predictive value = 1.000, negative predictive value = 0.82), RALYL (cutoff value = 6.45, sensitivity value = 0.87, specificity value = 1.00, positive predictive value = 1.000, negative predictive value = 0.65), and ESM1 (cutoff value = 4.97, sensitivity value = 0.85, specificity value = 0.78, positive predictive value = 0.94, negative predictive value = 0.54).
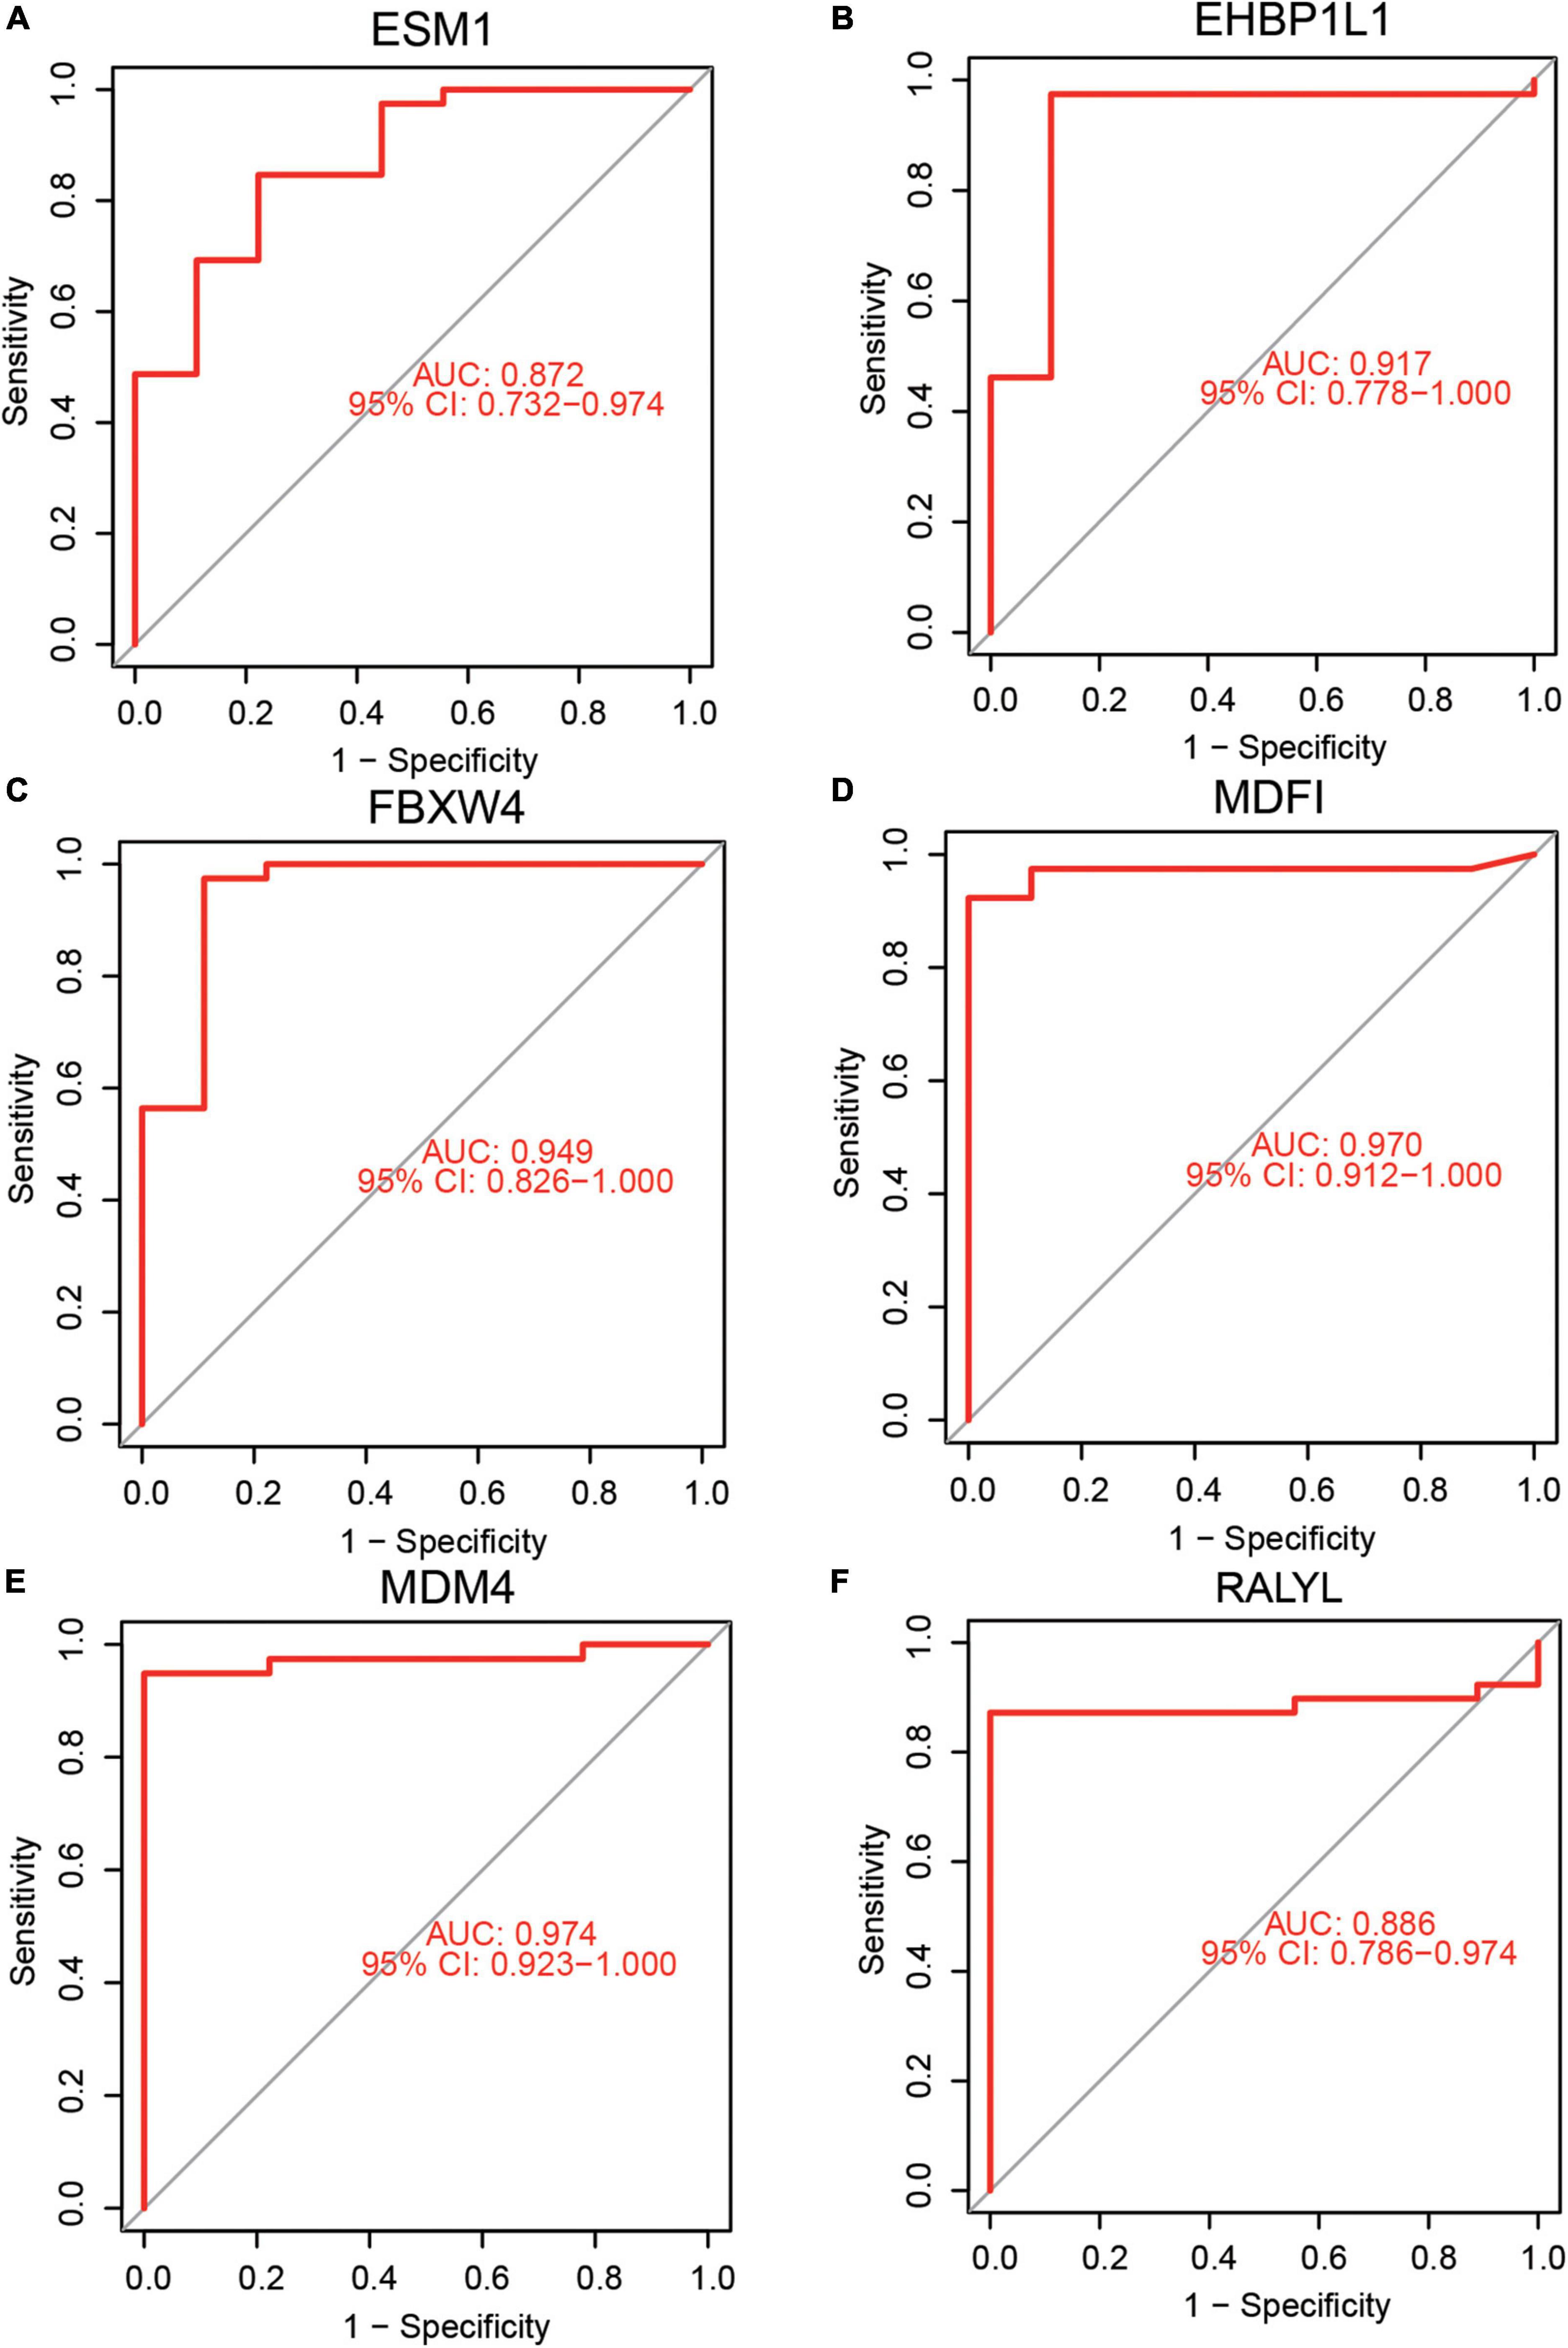
Figure 4. Diagnostic efficacy of hub genes in the prediction of AKI. (A) ESM1 AUC = 0.872 (95%CI: 0.732–0.974), (B) EHBP1L1 AUC = 0.917 (95%CI: 0.778–1.000), (C) FBXW4 AUC = 0.949 (95%CI: 0.826–1.000), (D) MDFI AUC = 0.970 (95%CI: 0.912–1.000), (E) MDM4 AUC = 0.974 (95%CI: 0.923–1.000), (F) RALYL AUC = 0.886 (95%CI: 0.786–0.974).
Signaling pathways related to the hub genes
Gene set enrichment analysis was used to identify the relevant signaling pathways of the six hub genes. EHBP1L1 (Figure 5A) was positively linked to allograft rejection, asthma, autoimmune thyroid disease, graft–versus–host disease, and type I diabetes mellitus. ESM1 (Figure 5B) was positively linked to ascorbate and aldarate metabolism, collecting duct acid secretion, DNA replication, fatty acid elongation, and pentose and glucuronate interconversions. FBXW4 (Figure 5C) was positively linked to alpha–linolenic acid metabolism, circadian entrainment, maturity onset diabetes of the young, nicotine addiction, and taste transduction. MDFI (Figure 5D) was positively linked to alpha–linolenic acid metabolism, linoleic acid metabolism, maturity onset diabetes of the young, nicotine addiction, and primary immunodeficiency. MDM4 (Figure 5E) was positively linked to alpha–linolenic acid metabolism, linoleic acid metabolism, maturity onset diabetes of the young, nicotine addiction, and phototransduction. RALYL (Figure 5F) was positively linked to 2–oxocarboxylic acid metabolism, citrate cycle (TCA cycle), fatty acid degradation, glycosaminoglycan degradation, and valine, leucine and isoleucine degradation.
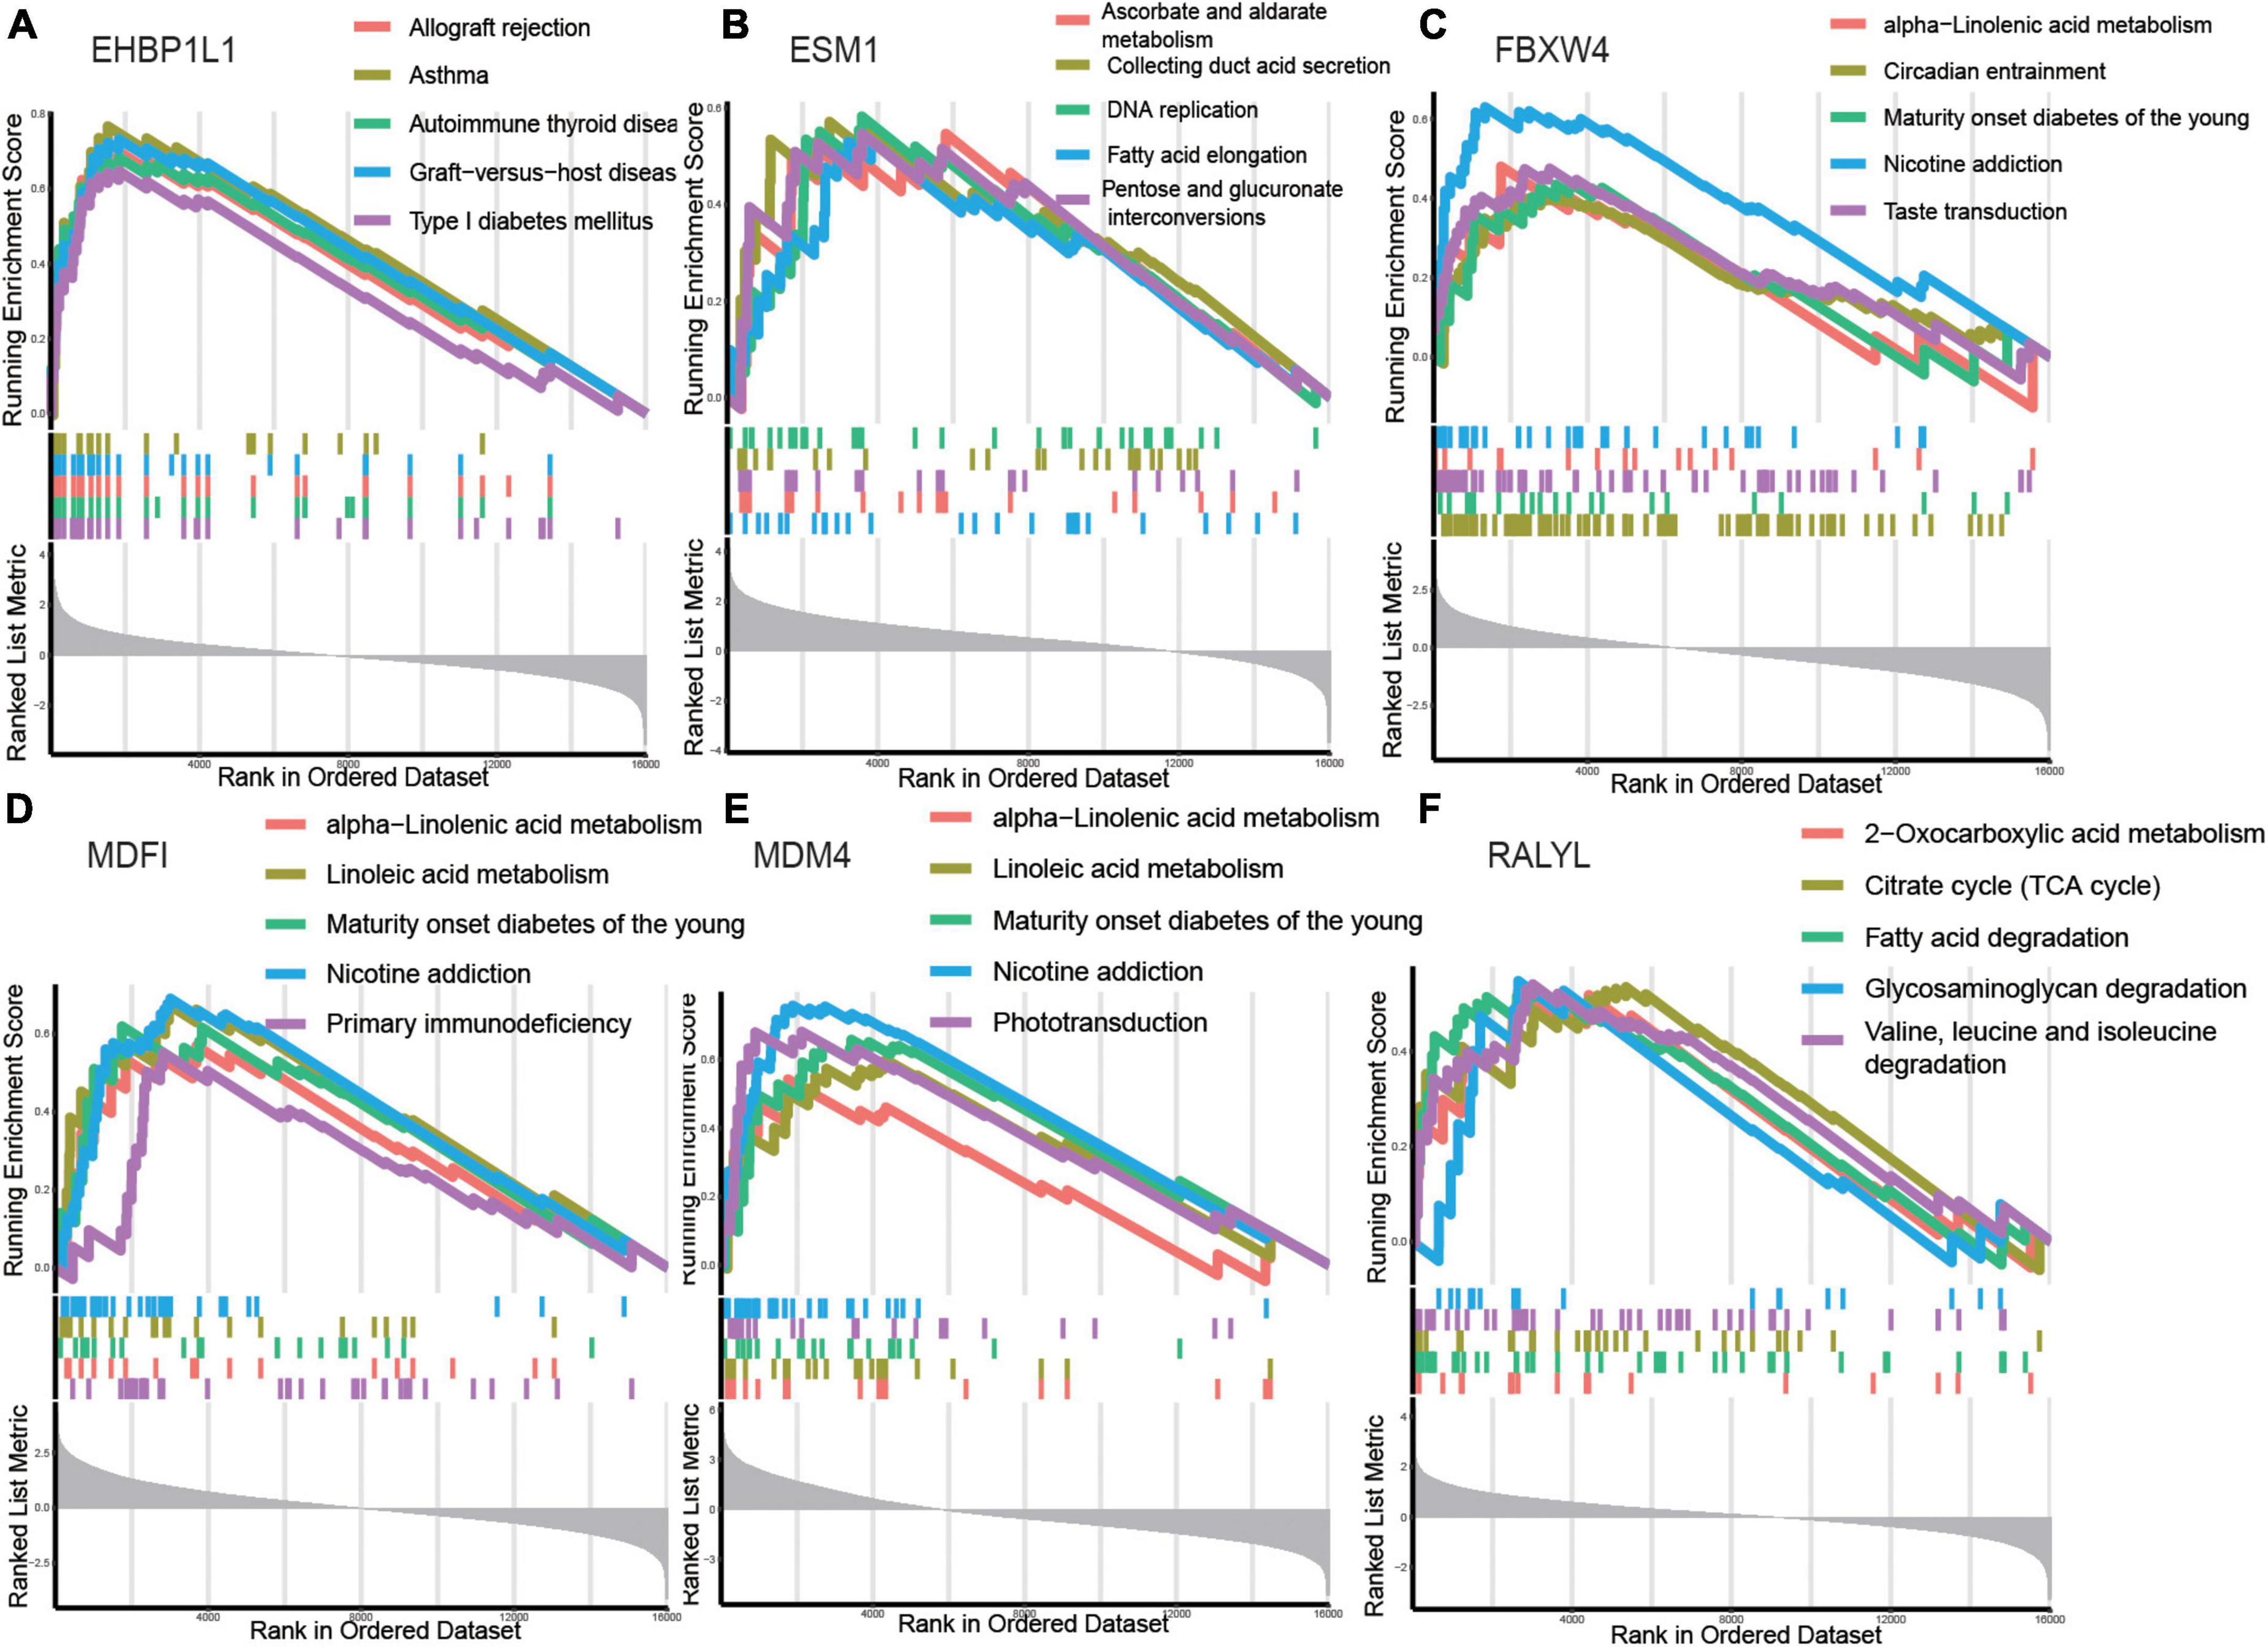
Figure 5. Gene set enrichment analysis (GSEA) identifies signaling pathways involved in the hub genes. (A–F) The main signaling pathways that are significantly enriched in high expressions of hub genes. (A) EHBP1L1, (B) ESM1, (C) FBXW4, (D) MDFI, (E) MDM4, (F) RALYL.
The results showed that the hub genes were related to metabolism (ascorbate and aldarate metabolism, alpha–linolenic acid metabolism, linoleic acid metabolism, 2–oxocarboxylic acid metabolism, citrate cycle (TCA cycle), and fatty acid degradation), which might play an important role in the pathogenesis and progression of AKI.
Hub genes expression and RT-qPCR validation
Six hub genes were analyzed for their expression levels (Figures 6A–F). Expression of ESM1 (Figure 6A, Mann–Whitney U-test, p = 0.001) and RALYL (Figure 6F, Mann–Whitney U-test, p < 0.001) was markedly increased in control samples. The expressions of EHBP1L1 (Figure 6B, Mann–Whitney U-test, p < 0.001), FBXW4 (Figure 6C, Mann–Whitney U-test, p < 0.001), MDFI (Figure 6D, Mann–Whitney U-test, p < 0.001), and MDM4 (Figure 6E, Mann–Whitney U-test, p < 0.001), were markedly increased in AKI samples. The difference in these hub genes may be involved in AKI disease onset and progression.
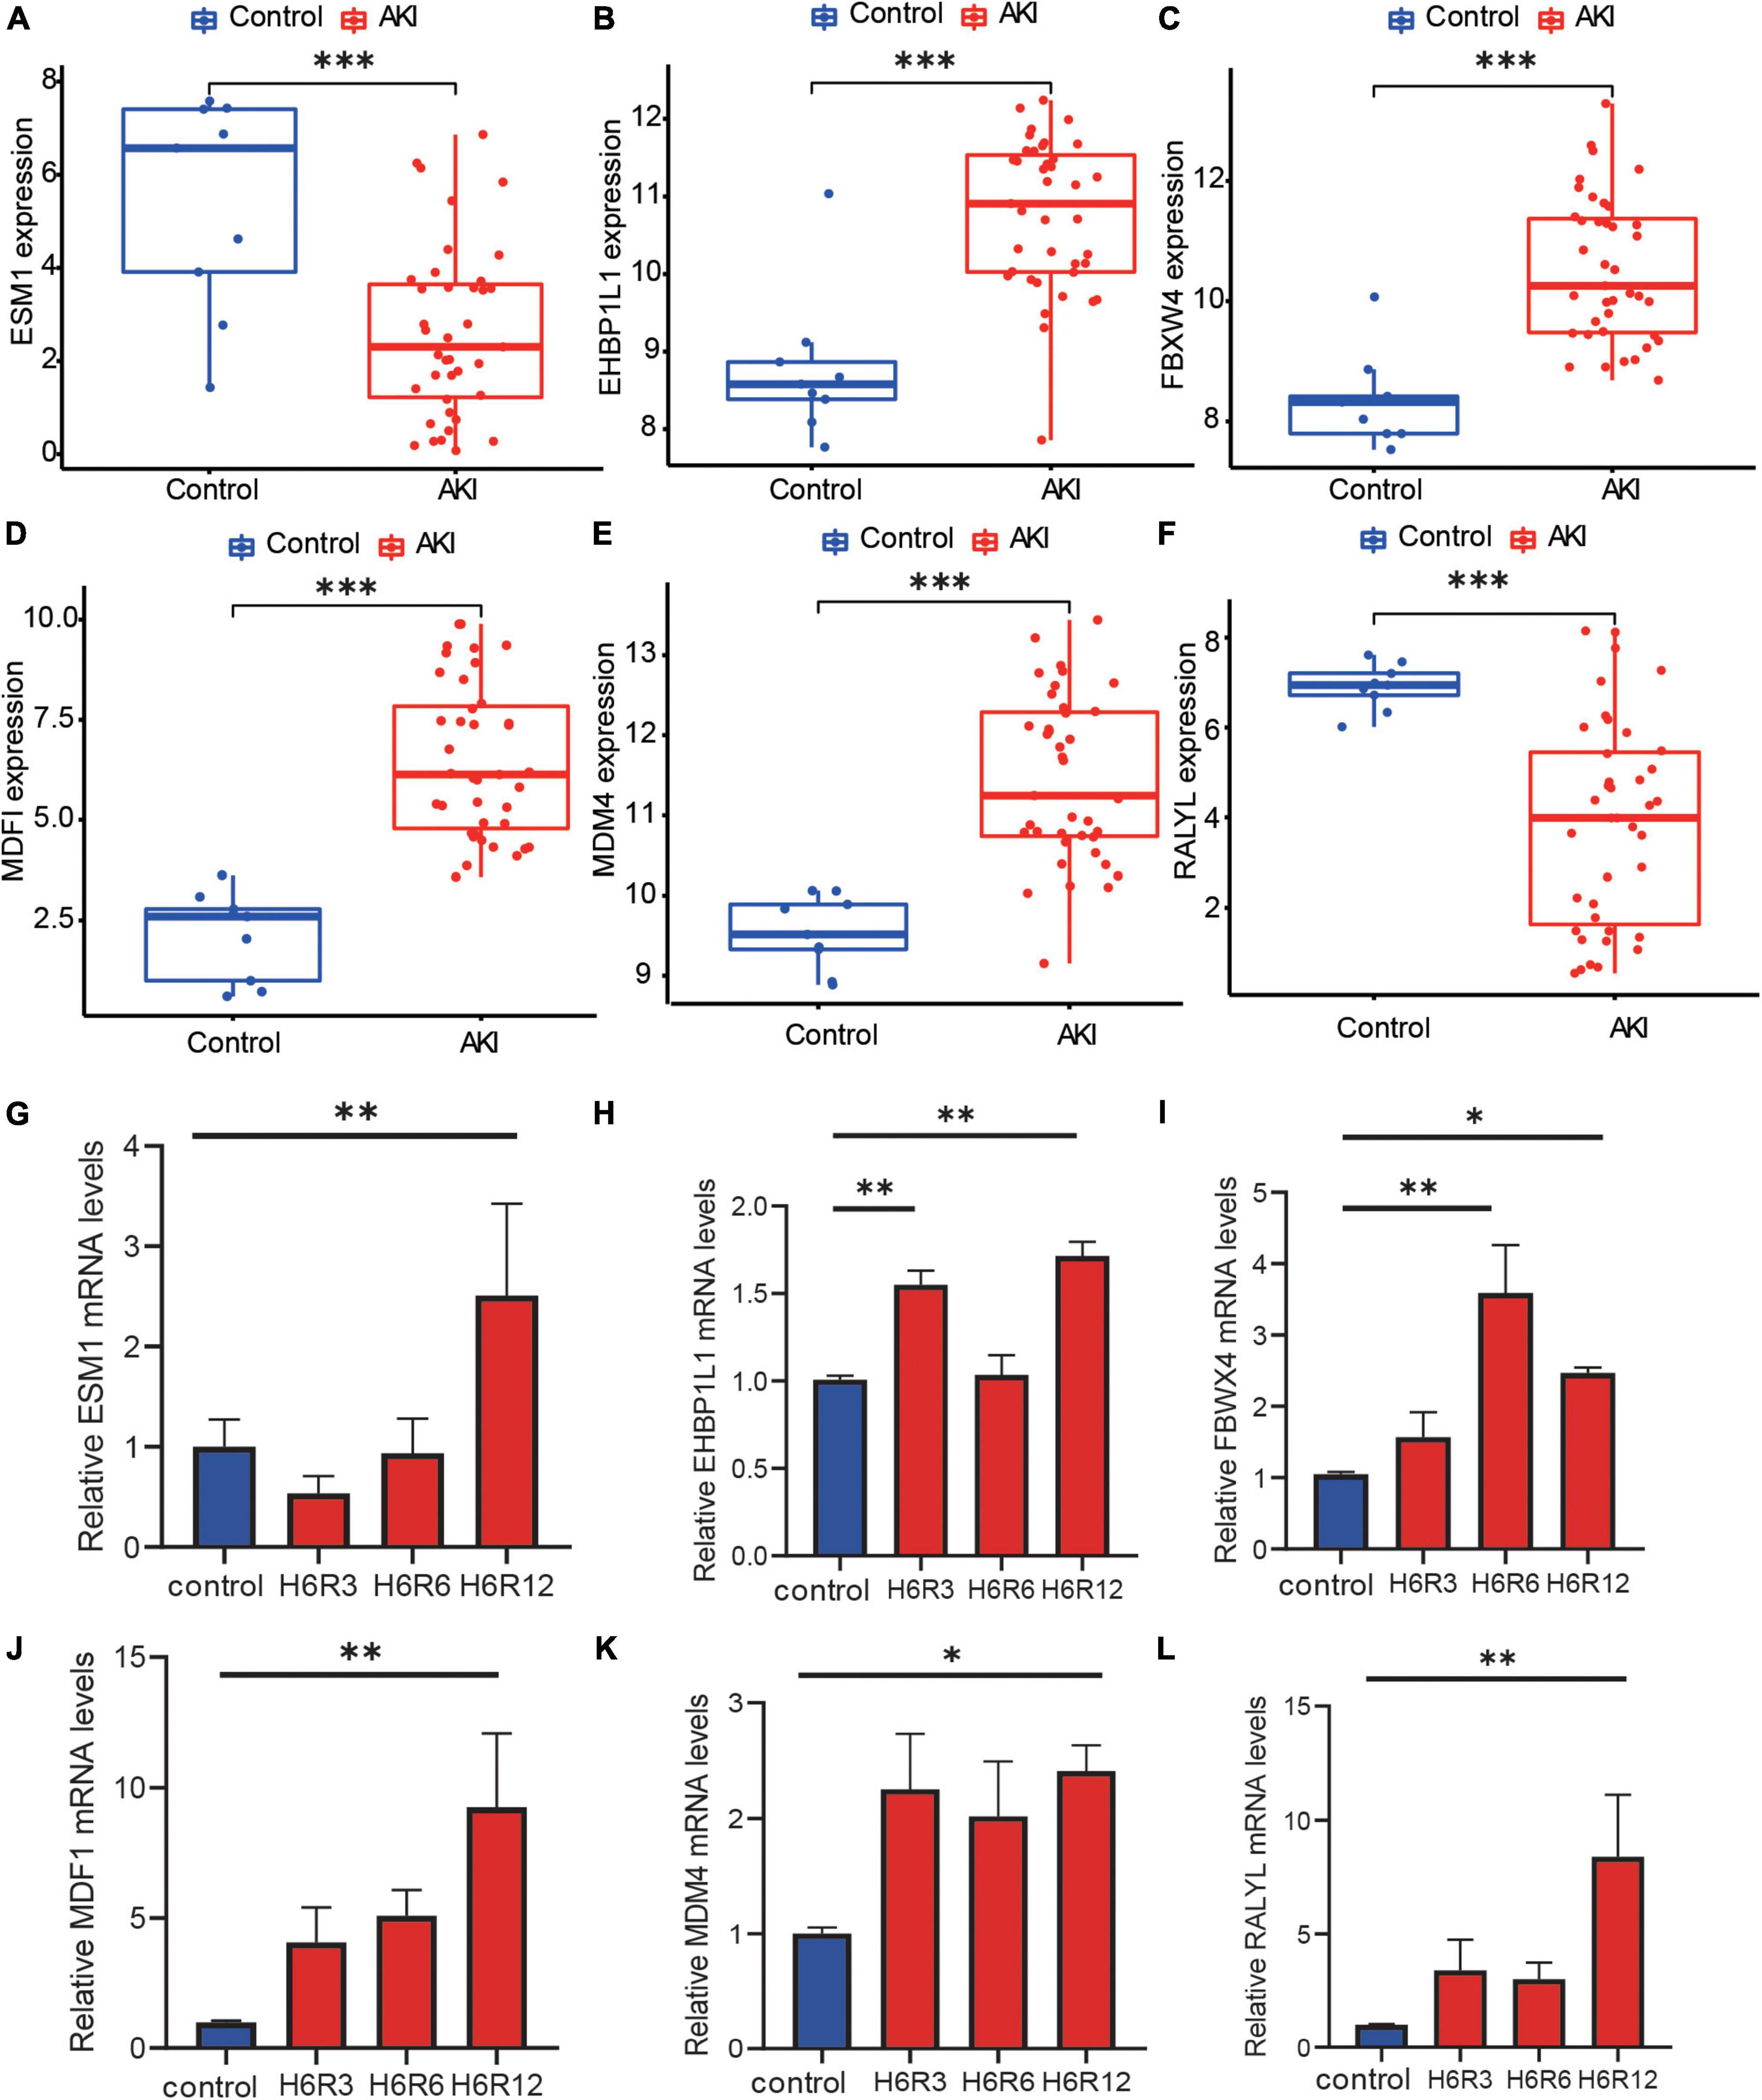
Figure 6. The expression level of hub genes and RT-qPCR validation. (A–F) Box plots showed the mRNA expression level of hub genes between AKI samples and control samples, and the p-value was marked below the horizontal line in the figure. (A) ESM1 (p = 0.001), (B) EHBP1L1 (p < 0.001), (C) FBXW4 (p < 0.001), (D) MDFI (p < 0.001), (E) MDM4 (p < 0.001), (F) RALYL (p < 0.001). (G–L) Box plots for Real-time PCR validation among hub genes, Kruskal–Wallis test, *p < 0.05, **p < 0.01, and ***p < 0.001.
We then used RT-qPCR to verify these findings. After reoxygenation, ESM1 expression trended lower than in the control group (Figure 6G) but the difference was not significant. However, after 12h of reoxygenation, ESM1 expression was increased. After reoxygenation, the expression of EHBP1L1 (Figure 6H), FBWX4 (Figure 6I), MDFI (Figure 6J), and MDM4 (Figure 6K) was significantly higher (Kruskal–Wallis test, *p < 0.05, **p < 0.01). These results support the reliability of our findings and underpin their future utility. After reoxygenation, RALYL expression was higher than in the control group (Figure 6L), which is contrary to our prediction. Further investigation is required to explain this finding.
Discussion
AKI was a clinical syndrome caused by acute decline or loss of renal filtration function stemming from multiple causes (10) and was associated with high morbidity and mortality (30). AKI was also a serious complication of other severe conditions (31). Most AKI develops gradually and manifests with a variety of pathophysiological symptoms and signs across a spectrum spanning mild decline of renal filtration function to the need for renal replacement therapy. Ischemia and hypoxia were the main triggers of AKI (32). As AKI progresses, ischemia and hypoxia further damage the morphology and functional anabolism of renal tubular epithelial cells and renal fibroblasts, resulting in delayed recovery and the loss of renal tubule reabsorption and secretion function. In addition, renal microvascular endothelial growth factor levels decrease, further reducing the number of capillaries, aggravating hypoxia, and eventually resulting in chronic kidney disease (CKD) (4). Renal transplantation was the most effective treatment of end-stage renal disease (ESRD), but ischemia-reperfusion injury may occur during the process of kidney organ donation and transplantation, resulting in AKI (33). As such, the prevention of postoperative AKI relied on being able to reliably quantify its risk following renal transplantation.
In this study, we used three machine learning algorithms to select hub genes in 86 DEGs between AKI and control samples by using the GSE139061 dataset. Then, we selected common genes from the three algorithms which were the hub genes MDFI, EHBP1L1, FBXW4, MDM4, RALYL, and ESM1. The AUC of these genes ranged from 0.872 to 0.974, indicating a high level of predictive power for AKI, and the AUC of the nomogram was 1, we also used the bootstrap algorithm to estimate the 95% AUC confidence intervals. We quantified the traditional AKI diagnostic markers such as KIM-1, Cystatin C, NGAL, IL-18 and their associated protein-coding genes (HAVCR1, LCN2, IL18, CYCS, and CST3) and assessed the diagnostic performance of these genes using ROC and AUC. The AUCs were 0.638 (95% CI 0.453–0.806) for HAVCR1 (Supplementary Figure 4A), 0.613 (95%CI: 0.430–0.781) for LCN2 (Supplementary Figure 4B), 0.749 (95%CI: 0.550–0.917) for IL18 (Supplementary Figure 4C), 0.554 (95%CI: 0.276–0.798) for CYCS (Supplementary Figure 4D), and 0.581 (95%CI: 0.305–0.832) for CST3 (Supplementary Figure 4E). We found that while these genes may contribute to the diagnosis of AKI, their diagnostic efficacy was slightly lower than the hub genes identified in this study. Thus, we believed that the diagnostic model developed in this study showed a marked potential for clinical application in the early identification of AKI. We used GSEA to identify the relevant signaling pathways of the six hub genes. As a result, we found that the hub genes were associated with metabolism, including ascorbate metabolism, alpha–linolenic acid metabolism, and fatty acid degradation, which may contribute to the pathogenesis and progression of AKI. This showed that the metabolic state of AKI renal cells was different from controls; this may be related to the ischemic and hypoxic state of renal cells in AKI (32).
Previous studies had linked some of these hub genes with kidney disease. EHBP1L1 regulates the CpG methylation of renal cells and was associated with the prognosis of renal clear cell carcinomas (34). The exact mechanisms of EHBP1L1 were not elucidated and further research was needed to verify our findings. MDM4 mRNA expression was increased in clear cell renal cell carcinomas (ccRCC); as such, it was a prognostic marker and its silencing inhibits the migration and invasiveness of RCC cells (35–38). Similarly, RALYL was related to the prognosis of RCC (39); its expression was significantly reduced in RCC, and this was associated with poor prognosis. However, there our findings into RALYL expression were conflicted between RNA-sequencing and qPCR. It had been indicated that around 15% of genes showed inconsistent results between RNA sequencing and RT-qPCR data (40). As such, further investigations were required to explain these findings. The expression of ESM1, also known as Endocan, was associated with adverse clinical outcomes in renal insufficiency, including AKI. As a marker of endothelial dysfunction, it was important in glomerular/vascular disease, which may lead to AKI (41). Some studies had shown the value of ESM1 in diagnosing acute rejection after renal transplantation. ESM1 was observed in circulating endothelial cells in the peripheral blood and in renal allografts after renal transplantation; the expression of ESM1 mRNA and protein was found to be significantly higher in patients with acute rejection (42). Although there was no evidence that the MDFI and FBXW4 genes are associated with kidney disease, MDFI can regulate the WNT signaling pathway, which is essential for the development of the mammalian kidney (43), and it was a cysteine rich glycoprotein in the extracellular matrix and played a key role in embryonic development and adult tissue homeostasis (44), Wnt/ β- Catenin signal was involved in the regulation of glomerulosclerosis and podocyte dysfunction, it was related to renal fibrosis. WNT was relatively silent in the normal adult kidney but played an important role in renal protection or pathogenesis when it comes to AKI (45). The role of FBXW4 in AKI needs further research to confirm.
Although we screened the hub genes related to AKI using bioinformatics approaches and verified their diagnostic value, some limitations should be noted. Firstly, our samples were of a one-off cross-sectional nature. Because we did not perform longitudinal analyses, we were not able to test the predictive value of these hub genes on patient prognosis. Secondly, this study lacked our own clinical samples. Therefore, we need to conduct research with a larger clinical sample size and additional experiments to further verify our findings.
Conclusion
In this study, we identified six hub genes related to AKI based on three machine learning algorithms; their AUCs showed potential diagnostic utility in predicting AKI. The hub genes identified in this study might play a significant role in the pathophysiology of AKI. They might be exploited for the early diagnosis of AKI and help improve AKI prognosis.
Data availability statement
Publicly available datasets were analyzed in this study. This data can be found here: https://www.ncbi.nlm.nih.gov/geo/.
Ethics statement
Ethical review and approval was not required for the study on human participants in accordance with the local legislation and institutional requirements. Written informed consent for participation was not required for this study in accordance with the national legislation and the institutional requirements.
Author contributions
YL, YD, and YZ designed and conducted the study and drafted the manuscript. YY, XZ, and MZ revised the manuscript. YL, YD, YZ, CC, and JZ performed the data analysis. All authors have read and approved the final manuscript.
Funding
This work was supported by the National Natural Science Foundation of China (82070261), Subject Platform, Technology Innovation Development Foundation of Tangdu Hospital (2019QYTS003, 2020XKPT014, and 2021QYJC-001) and the Natural Science basic Research Program (2022JQ-881).
Acknowledgments
We would like to thank all the investigators for participating in the present study and we would like to express our gratitude to EditSprings (https://www.editsprings.cn) for the expert linguistic services provided.
Conflict of interest
The authors declare that the research was conducted in the absence of any commercial or financial relationships that could be construed as a potential conflict of interest.
Publisher’s note
All claims expressed in this article are solely those of the authors and do not necessarily represent those of their affiliated organizations, or those of the publisher, the editors and the reviewers. Any product that may be evaluated in this article, or claim that may be made by its manufacturer, is not guaranteed or endorsed by the publisher.
Supplementary material
The Supplementary Material for this article can be found online at: https://www.frontiersin.org/articles/10.3389/fmed.2022.1016459/full#supplementary-material
Abbreviations
AKI, acute kidney injury; AUC, area under the curve; CKD, chronic kidney disease; DEGs, differentially expressed genes; ESRD, end-stage renal disease; GEO, gene expression omnibus; PCR, polymerase chain reaction; RT-qPCR, real time quantitative PCR; RCC, renal cell carcinoma; ROC, receiver operating characteristic; SVM-RFE, support vector machine recursive feature elimination.
Footnotes
References
1. Lameire NH, Bagga A, Cruz D, De Maeseneer J, Endre Z, Kellum JA, et al. Acute kidney injury: an increasing global concern. Lancet. (2013) 382:170–9.
2. Billings FTT. Acute kidney injury following cardiac surgery: a clinical model. Nephron. (2019) 143:202–6.
3. Cooper JE, Wiseman AC. Acute kidney injury in kidney transplantation. Curr Opin Nephrol Hypertens. (2013) 22:698–703.
4. Zarbock A, Kellum JA, Schmidt C, Van Aken H, Wempe C, Pavenstädt H, et al. Effect of early vs delayed initiation of renal replacement therapy on mortality in critically Ill patients with acute kidney injury. JAMA. (2016) 315:2190.
5. Bellomo R, Ronco C, Kellum JA, Mehta RL, Palevsky P. Acute renal failure – definition, outcome measures, animal models, fluid therapy and information technology needs: the second international consensus conference of the acute dialysis quality initiative (ADQI) group. Crit Care. (2004) 8:R204–12. doi: 10.1186/cc2872
6. Mehta RL, Kellum JA, Shah SV, Molitoris BA, Ronco C, Warnock DG, et al. Acute kidney injury network: report of an initiative to improve outcomes in acute kidney injury. Crit Care. (2007) 11:R31.
7. Yang S, Chiou TT, Shiao C, Lin HY, Chan M, Wu C, et al. Nomenclature and diagnostic criteria for acute kidney injury – 2020 consensus of the Taiwan AKI-task force. J Formos Med Assoc. (2022) 121:749–65. doi: 10.1016/j.jfma.2021.08.005
8. Mami I, Tavernier Q, Bouvier N, Aboukamis R, Desbuissons G, Rabant M, et al. A novel extrinsic pathway for the unfolded protein response in the kidney. J Am Soc Nephrol. (2016) 27:2670–83. doi: 10.1681/ASN.2015060703
9. Rabb H, Griffin MD, Mckay DB, Swaminathan S, Pickkers P, Rosner MH, et al. Inflammation in AKI: current understanding, key questions, and knowledge gaps. J Am Soc Nephrol. (2016) 27:371–9. doi: 10.1681/ASN.2015030261
10. Bonventre JV, Yang L. Cellular pathophysiology of ischemic acute kidney injury. J Clin Investig. (2011) 121:4210–21.
11. Parikh CR, Thiessen-Philbrook H, Garg AX, Kadiyala D, Shlipak MG, Koyner JL, et al. Performance of kidney injury molecule-1 and liver fatty acid-binding protein and combined biomarkers of AKI after cardiac surgery. Clin J Am Soc Nephrol. (2013) 8:1079–88.
12. Meersch M, Schmidt C, Hoffmeier A, Van Aken H, Wempe C, Gerss J, et al. Prevention of cardiac surgery-associated AKI by implementing the KDIGO guidelines in high risk patients identified by biomarkers: the PrevAKI randomized controlled trial. Intens Care Med. (2017) 43:1551–61.
13. Wilflingseder J, Sunzenauer J, Toronyi E, Heinzel A, Kainz A, Mayer B, et al. Molecular pathogenesis of post-transplant acute kidney injury: assessment of whole-genome mRNA and miRNA profiles. PLoS One. (2014) 9:e104164. doi: 10.1371/journal.pone.0104164
14. Ambrosi NG, Caro FY, Osella F, Alvarez LD, Sanchez F, Toniolo F, et al. SLPI in the perfusion solution helps to identify graft quality in kidney transplants. Biomark Med. (2019) 13:895–906. doi: 10.2217/bmm-2018-0428
15. Averdunk L, Fitzner C, Levkovich T, Leaf DE, Sobotta M, Vieten J, et al. Secretory leukocyte protease inhibitor (SLPI)-a novel predictive biomarker of acute kidney injury after cardiac surgery: a prospective observational study. J Clin Med. (2019) 8:1931. doi: 10.3390/jcm8111931
16. Cai Q, Sun Z, Bao M, Guo S, Wu H, Yu X. POS-063 disulfiram ameliorates ischemia/reperfusion-induced acute kidney injury by suppressing the caspase-11-GSDMD pathway. Kidney Int Rep. (2022) 7:S26–7. doi: 10.1080/0886022X.2022.2098764
17. Zhai X, Lou H, Hu J. Five-gene signature predicts acute kidney injury in early kidney transplant patients. Aging. (2022) 14:2628–44. doi: 10.18632/aging.203962
18. Janosevic D, Myslinski J, Mccarthy TW, Zollman A, Syed F, Xuei X, et al. The orchestrated cellular and molecular responses of the kidney to endotoxin define a precise sepsis timeline. Elife. (2021) 10:e62270. doi: 10.7554/eLife.62270
19. Ritchie ME, Phipson B, Wu D, Hu Y, Law CW, Shi W, et al. limma powers differential expression analyses for RNA-sequencing and microarray studies. Nucleic Acids Res. (2015) 43:e47. doi: 10.1093/nar/gkv007
20. Subramanian A, Tamayo P, Mootha VK, Mukherjee S, Ebert BL, Gillette MA, et al. Gene set enrichment analysis: a knowledge-based approach for interpreting genome-wide expression profiles. Proc Natl Acad Sci U.S.A. (2005) 102:15545–50.
21. Zhou Y, Zhou B, Pache L, Chang M, Khodabakhshi AH, Tanaseichuk O, et al. Metascape provides a biologist-oriented resource for the analysis of systems-level datasets. Nat Commun. (2019) 10:1523. doi: 10.1038/s41467-019-09234-6
22. Krishnapuram B, Hartemink AJ, Carin L, Figueiredo MAT. A Bayesian approach to joint feature selection and classifier design. IEEE Trans Pattern Anal Mach Intell. (2004) 26:1105–11.
23. Friedman J, Hastie T, Tibshirani R. Regularization paths for generalized linear models via coordinate descent. J Stat Softw. (2010) 33:1–22.
24. Patil KR, Nielsen J. Uncovering transcriptional regulation of metabolism by using metabolic network topology. Proc Natl Acad Sci U.S.A. (2005) 102:2685–9.
25. Carpenter J, Bithell J. Bootstrap confidence intervals: when, which, what? A practical guide for medical statisticians. Stat Med. (2000) 19:1141–64. doi: 10.1002/(sici)1097-0258(20000515)19:9<1141::aid-sim479>3.0.co;2-f
26. Yu G, Wang L, Han Y, He Q. clusterProfiler: an R package for comparing biological themes among gene clusters. Omics. (2012) 16:284–7. doi: 10.1089/omi.2011.0118
27. Shen B, Mei M, Pu Y, Zhang H, Liu H, Tang M, et al. Necrostatin-1 attenuates renal ischemia and reperfusion injury via meditation of HIF-1α/mir-26a/TRPC6/PARP1 signaling. Mol Ther Nucleic Acids. (2019) 17:701–13. doi: 10.1016/j.omtn.2019.06.025
28. Liu H, Wang L, Weng X, Chen H, Du Y, Diao C, et al. Inhibition of Brd4 alleviates renal ischemia/reperfusion injury-induced apoptosis and endoplasmic reticulum stress by blocking FoxO4-mediated oxidative stress. Redox Biol. (2019) 24:101195. doi: 10.1016/j.redox.2019.101195
29. Szklarczyk D, Gable AL, Lyon D, Junge A, Wyder S, Huerta-Cepas J, et al. STRING v11: protein-protein association networks with increased coverage, supporting functional discovery in genome-wide experimental datasets. Nucleic Acids Res. (2019) 47:D607–13. doi: 10.1093/nar/gky1131
30. Mehta RL, Cerdá J, Burdmann EA, Tonelli M, García-García G, Jha V, et al. International society of nephrology’s 0by25 initiative for acute kidney injury (zero preventable deaths by 2025): a human rights case for nephrology. Lancet. (2015) 385:2616–43. doi: 10.1016/S0140-6736(15)60126-X
31. Zeng X, Mcmahon GM, Brunelli SM, Bates DW, Waikar SS. Incidence, Outcomes, and Comparisons across Definitions of AKI in Hospitalized Individuals. Clin J Am Soc Nephrol. (2014) 9:12–20.
32. Nangaku M, Hirakawa Y, Mimura I, Inagi R, Tanaka T. Epigenetic changes in the acute kidney injury-to-chronic kidney disease transition. Nephron. (2017) 137:256–9.
33. Wragg NM, Burke L, Wilson SL. A critical review of current progress in 3D kidney biomanufacturing: advances, challenges, and recommendations. Renal Replace Ther. (2019) 5:1–16.
34. Wei J, Haddad A, Wu K, Zhao H, Kapur P, Zhang Z, et al. A CpG-methylation-based assay to predict survival in clear cell renal cell carcinoma. Nat Commun. (2015) 6:8699. doi: 10.1038/ncomms9699
35. El-Dahr S, Hilliard S, Saifudeen Z. Regulation of kidney development by the Mdm2/Mdm4-p53 axis. J Mol Cell Biol. (2017) 9:26–33. doi: 10.1093/jmcb/mjx005
36. Jiang K, Sun F, Zhu J, Luo G, Ban Y, Zhang P. miR-33a inhibits cell growth in renal cancer by downregulation of MDM4. Mol Genet Genom Med. (2019) 7:e833. doi: 10.1002/mgg3.833
37. Li F, Aljahdali IAM, Zhang R, Nastiuk KL, Krolewski JJ, Ling X. Kidney cancer biomarkers and targets for therapeutics: survivin (BIRC5), XIAP. J Exp Clin Cancer Res. (2021) 40:254. doi: 10.1186/s13046-021-02026-1
38. Hilliard SA, Li Y, Dixon A, El-Dahr SS. Mdm4 controls ureteric bud branching via regulation of p53 activity. Mech Dev. (2020) 163:103616. doi: 10.1016/j.mod.2020.103616
39. Cui Z, Xia Y, Ye Y, Jiang Z, Wang Y, Wu J, et al. RALY RNA binding protein-like reduced expression is associated with poor prognosis in clear cell renal cell carcinoma. Asian Pac J Cancer Prev. (2012) 13:3403–8. doi: 10.7314/apjcp.2012.13.7.3403
40. Everaert C, Luypaert M, Maag JLV, Cheng QX, Dinger ME, Hellemans J, et al. Benchmarking of RNA-sequencing analysis workflows using whole-transcriptome RT-qPCR expression data. Sci Rep. (2017) 7:1559. doi: 10.1038/s41598-017-01617-3
41. Nalewajska M, Gurazda K, Marchelek-Myśliwiec M, Pawlik A, Dziedziejko V. The role of endocan in selected kidney diseases. Int J Mol Sci. (2020) 21:6119. doi: 10.3390/ijms21176119
42. Li S, Wang L, Wang C, Wang Q, Yang H, Liang P, et al. Detection on dynamic changes of endothelial cell specific molecule-1 in acute rejection after renal transplantation. Urology. (2012) 80:738.e1–8. doi: 10.1016/j.urology.2012.03.019
43. Pulkkinen K, Murugan S, Vainio S. Wnt signaling in kidney development and disease. Organogenesis. (2008) 4:55–9.
44. Sebio A, Kahn M, Lenz HJ. The potential of targeting Wnt/beta-catenin in colon cancer. Expert Opin Ther Targets. (2014) 18:611–5.
Keywords: acute kidney injury, kidney transplantation, ischemia-reperfusion injury, machine learning algorithms, RNA-seq, disease biomarker
Citation: Li Y, Du Y, Zhang Y, Chen C, Zhang J, Zhang X, Zhang M and Yan Y (2022) Machine learning algorithm-based identification and verification of characteristic genes in acute kidney injury. Front. Med. 9:1016459. doi: 10.3389/fmed.2022.1016459
Received: 11 August 2022; Accepted: 09 September 2022;
Published: 13 October 2022.
Edited by:
Xiao-ming Ding, The First Affiliated Hospital of Xi’an Jiaotong University, ChinaReviewed by:
Jingqi Wang, Second Hospital of Shanxi Medical University, ChinaShiming He, First Hospital, Peking University, China
Copyright © 2022 Li, Du, Zhang, Chen, Zhang, Zhang, Zhang and Yan. This is an open-access article distributed under the terms of the Creative Commons Attribution License (CC BY). The use, distribution or reproduction in other forums is permitted, provided the original author(s) and the copyright owner(s) are credited and that the original publication in this journal is cited, in accordance with accepted academic practice. No use, distribution or reproduction is permitted which does not comply with these terms.
*Correspondence: Yong Yan, eWFueW9uZ2NxQDE2My5jb20=; Min Zhang, emhhbmdtMDYwMUAxNjMuY29t; Xin Zhang, emhhbmd4aW5kb2N0b3JAZ21haWwuY29t
†These authors have contributed equally to this work and share first authorship
‡These authors have contributed equally to this work and share last authorship