
94% of researchers rate our articles as excellent or good
Learn more about the work of our research integrity team to safeguard the quality of each article we publish.
Find out more
ORIGINAL RESEARCH article
Front. Med., 02 December 2021
Sec. Nephrology
Volume 8 - 2021 | https://doi.org/10.3389/fmed.2021.779627
 Yi Cheng1†
 You Zhang2†
 Boxiang Tu1†
 Yingyi Qin1†Xin Cheng3Ran Qi4Wei Guo1Dongdong Li1Shengyong Wu1Ronghui Zhu1Yanfang Zhao1
 Yuanjun Tang5*
 Cheng Wu1*
Objective: This study aimed to explore the association between base excess (BE) and the risk of 30-day mortality among patients with acute kidney injury (AKI) in the intensive care unit (ICU).
Methods: This retrospective study included patients with AKI from the Medical Information Mart for Intensive Care (MIMIC)-IV database. We used a multivariate Cox proportional-hazards model to obtain the hazard ratio (HR) for the risk of 30-day mortality among patients with AKI. Furthermore, we utilized a Cox proportional-hazard model with restricted cubic splines (RCS) to explore the potential non-linear associations.
Results: Among the 14,238 ICU patients with AKI, BE showed a U-shaped relationship with risk of 30-day mortality for patients with AKI, and higher or lower BE values could increase the risk. Compared with normal base excess (−3~3 mEq/L), patients in different groups (BE ≤ −9 mEq/L, −9 mEq/L < BE ≤ −3 mEq/L, 3 mEq/L < BE ≤ 9 mEq/L, and BE > 9 mEq/L) had different HRs for mortality: 1.57 (1.40, 1.76), 1.26 (1.14, 1.39), 0.97 (0.83, 1.12), 1.53 (1.17, 2.02), respectively. The RCS analyses also showed a U-shaped curve between BE and the 30-day mortality risk.
Conclusion: Our results suggest that higher and lower BE in patients with AKI would increase the risk of 30-day mortality. BE measured at administration could be a critical prognostic indicator for ICU patients with AKI and provide guidance for clinicians.
Acute kidney injury (AKI) is a severe complication in the intensive care unit (ICU), as it is associated with higher morbidity, mortality, and poorer outcomes. The incidence of AKI ranges from 2% in community settings to 20% among hospitalized patients and up to 60% in ICUs (1).
Patients with AKI show an increased risk of mortality, chronic kidney disease (CKD) progression and cardiovascular complications (2). And the mortality in hospitalized AKI patients is 10.8%. In addition, as diuretics, vasopressors, and renal replacement therapy (RRT) can be administered to these patients, these factors can lead to acid–base disturbances.
Base excess (BE) is defined as the amount of acid or alkali needed to adjust the value to the normal range (3), which is considered a pure indicator of metabolic acid–based balance (4). Base excess has been widely used as a predictor for the diagnosis of neonatal sepsis in pre-term newborns (5), complications in cytoreductive surgery (6), or the prognosis of neonatal acute respiratory distress syndrome (7). The indicator also shows significant representativeness in heart failure (3, 4). However, the association between BE and mortality among patients with AKI remains unclear.
Smith (8) demonstrated that BE could be a prognostic indicator for patients admitted to the ICU. Those patients with BE on admissions < −4 mmol/L had higher mortality than those with BE ≥ −4 mmol/L (57.7 vs. 17.6%, P < 0.0001). However, in this study, other confounders, such as age, sequential organ failure assessment (SOFA) score on admission, inotropes, and mechanical ventilation were significantly different between the two groups and were not adjusted.
Consequently, the aim of this study was to explore the effect of baseline BE on mortality among patients with AKI.
The data of this study were extracted from a large critical care database named Medical Information Mart for Intensive Care (MIMIC)-IV (9, 10), which is a publicly and freely available database. The MIMIC-IV database, an update to MIMIC-III, contained data for patients who were admitted to the Beth Israel Deaconess Medical Center (BIDMC) from 2008–2019. After completing the National Institutes of Health (NIH) web-based training course and the Protecting Human Research Participants examination, we extracted data from MIMIC-IV. An author who has completed the Collaborative Institutional Training Initiative examination (Certification Number 39090498 for author YY Qin) can access the database.
This study included adult patients (≥18 years) with AKI defined according to the Kidney Disease Improving Global Outcomes (KDIGO) criteria (Table 1). The KDIGO criteria were described as follows (11): (1) Serum creatinine (SCr) increased by 0.3 mg/dL (or ≥26.5 μmol/L) within 48 h; or (2) increased by ≥1.5-fold from baseline within the prior 7 days; and/or (3) a decrease in urine output (UO) < 0.5 ml/kg/h for 6–12 h. AKI was diagnosed after ICU admission. Patients without BE values when admitted to the ICU and those who died or were discharged within 48 h after ICU admission were excluded. If a patient had multiple admission records or ICU stay records, we only took the first admission record and the first ICU stay record.
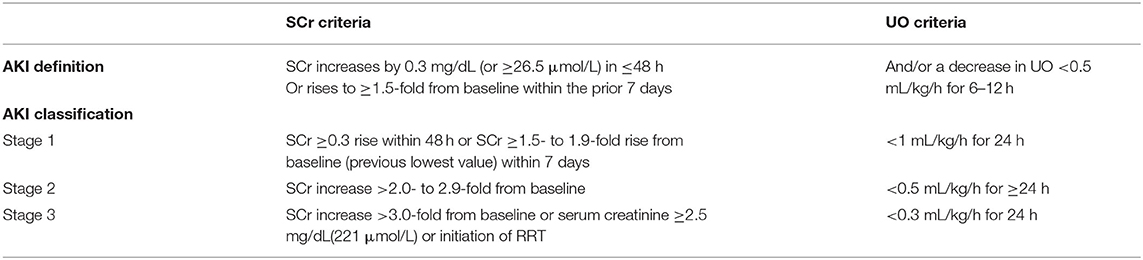
Table 1. AKI definition and classification according to the kidney disease improving global outcomes (KDIGO) criteria.
The variable of interest is baseline BE. Thus, we extracted the first measurement of BE at ICU admission as the baseline BE value. This was the main exposure factor in our study.
Other variables were extracted from the MIMIC-IV database according to the first day of ICU admission as potential confounding factors, including age at the time of hospital admission, admission type, sex, ethnicity, lactate, measure of acidity or alkalinity (pH), partial pressure of oxygen (PO2), and partial pressure of carbon dioxide (PCO2). AKI stages were defined by both SCr and the volume of Urine Output (UO) within the first 48 h after ICU admission according to KDIGO criteria (Table 1), comorbidities, simplified Acute Physiology Score II (SAPAII), SOFA score, SCr level, UO, use of vasopressors, renal replacement therapy (RRT), and mechanical ventilation. All variables were extracted from MIMIC-IV using postgreSQL.
The primary endpoint was 30-day ICU mortality, which was defined by patient survival status at the time of hospital discharge. ICU mortality, in-hospital mortality, ICU length of stay (LOS), and hospital LOS were regarded as secondary endpoints.
In the present study, all variables had missing values of <20%. We used multiple imputation (12) to impute missing values in variables, including lactate, urine output, and creatinine.
Descriptive statistics were used to present the differences between characteristics across the five groups of baseline BE values (BE ≤ −9 mEq/L, −9 mEq/L < BE ≤ −3 mEq/L, −3 mEq/L < BE ≤ 3 mEq/L, 3 mEq/L < BE ≤ 9 mEq/L, and BE > 9 mEq/L). Continuous variables were presented as mean ± standard deviation or median (IQR), and the differences between groups were identified using analysis of variance (ANOVA) or Kruskal–Wallis test. Categorical variables were presented as percentages, and comparisons between groups were made using the chi-square test or Fisher's exact-test.
The Cox proportional hazards model was used to estimate the association between predefined groups according to baseline BE values and outcomes among critically ill patients with AKI. The model was adjusted by multiple covariates with a P-value < 0.05, in univariate analysis. To assess the robustness of the results, which could be affected by potential unmeasured confounders, we calculated the E-value. The E-value was defined as the minimum strength of association that an unmeasured confounder would have between the explaining variable and the outcome (13) and the equation of E-value was: E-value = HR+sqr{HR× (HR−1)}.
In view of the hypothesis that the relationship between BE and risk of 30-day hospital mortality was non-linear, we further examined Cox models with restricted cubic splines (RCS) (14–16), with five knots (10th, 25th, 50th, 75th, and 90th percentiles) for BE, adjusting for all covariates above to flexibly model the association of baseline BE values with mortality. In addition, we used a likelihood ratio test to examine the non-linearity by comparing the model with only the linear term and with linear and cubic spline terms.
All statistical analyses were performed using the R software (version 4.0.0). All reported P-values were two-sided, and statistical significance was set at P < 0.05.
A total of 18,855 patients fulfilled the definition of AKI. Of these 14,238 patients whose ICU time was more than 2 days had a BE value within 24 h after ICU admission. The study flow diagram is shown in Figure 1.
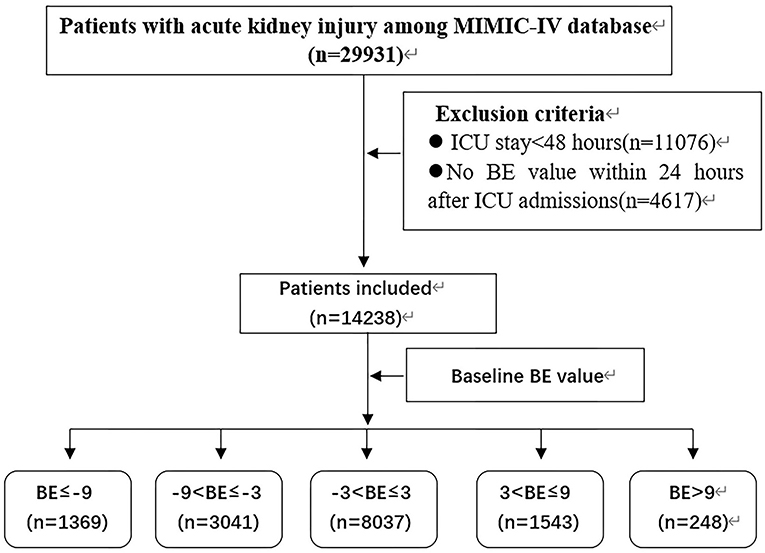
Figure 1. Flow chart of patient selection.
Baseline characteristics of the five BE groups are depicted in Table 2. Compared with the normal group (−3 mEq/L < BE ≤ 3 mEq/L), those with lower BE values tended to be female, younger, and the values of lactate, creatinine, SOFA score, and SAPSII were higher, while the pH, PO2, PCO2, and UO were lower. The proportion of patients using vasopressors and RRT was also higher. Patients with higher BE values tended to be female, older, and had lower lactate and PO2 values. These patients had higher values of pH, PCO2, SOFA, and SAPSII, tended to use fewer vasopressors and ventilation, and were more likely to have comorbidities such as congestive heart failure and chronic pulmonary disease.
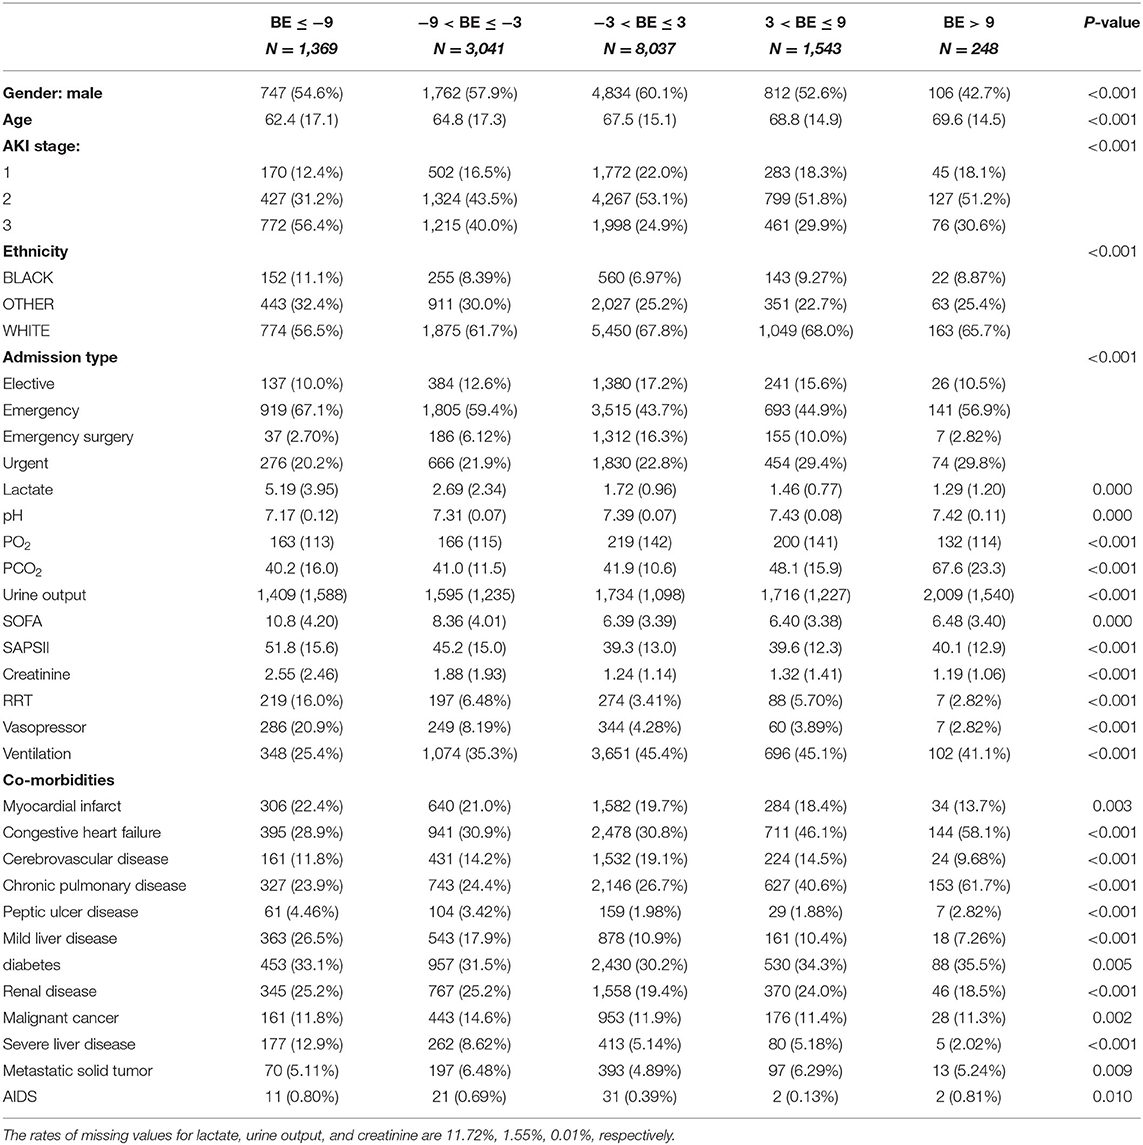
Table 2. Baseline characteristics between BE groups.
Table 3 shows the association between BE and all-cause mortality in patients with AKI. In the unadjusted model (Model 1), compared with the normal group, the hazard ratios [95% confidence interval (CI)] of the first, second, fourth, and fifth baseline BE groups were 1.57 (1.40, 1.76), 1.26 (1.14, 1.39), 0.97 (0.83, 1.12), 1.53 (1.17, 2.02), respectively. In the multivariable adjusted model (Model 3), the baseline BE showed a U-shaped association with 30-day all-cause mortality in the ICU. In model 3, the third group (−3 mEq/L < BE ≤ 3 mEq/L) had the lowest HR, and the fifth group had the highest HR (1.54, 95% CI: 1.16, 2.05). The HR (95% CI) of the first, second, and fourth group were 1.29 (1.13, 1.47), 1.12 (1.01, 1.24), 1.00 (0.86, 1.17), respectively. The result of model 3 was showed in the Supplementary Table S1.
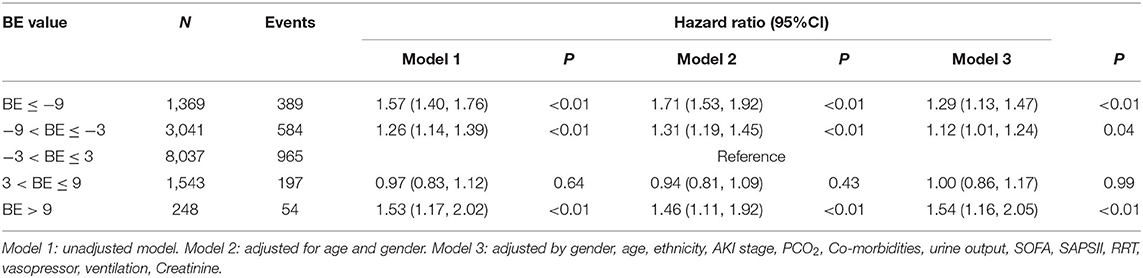
Table 3. HR of 30-day hospital mortality according to BE in patients with AKI.
According to the equation, E-value was obtained as follows:
In our study, the E-value was relatively large; thus, we can consider the results to be robust to some extent.
Furthermore, we used RCS to flexibly model and visualize the relationship between baseline BE values and 30-day all-cause mortality in the ICU. In the restricted quadratic spline regression model, baseline BE was taken as a continuous variable. In Figure 2A, the univariate analysis showed that the HR of 30-day all-cause mortality in the ICU decreased to 1 and became steeper when the baseline BE value exceeded −5 mEq/L. We observed the lowest HR when the baseline BE value was 3 mEq/L and the risk started to increase afterwards (P for non-linearity < 0.01). We can also conclude that the baseline BE value in the range of 0–5 mEq/L was a protective factor (HR <1). When the BE value was outside this range, it was a risk factor (HR > 1). The results of the multivariate analysis (Figure 2B) were similar. The risk of mortality decreased and reached the lowest HR when the BE was 3 mEq/L, and then started to increase afterwards (P for non-linearity < 0.01).
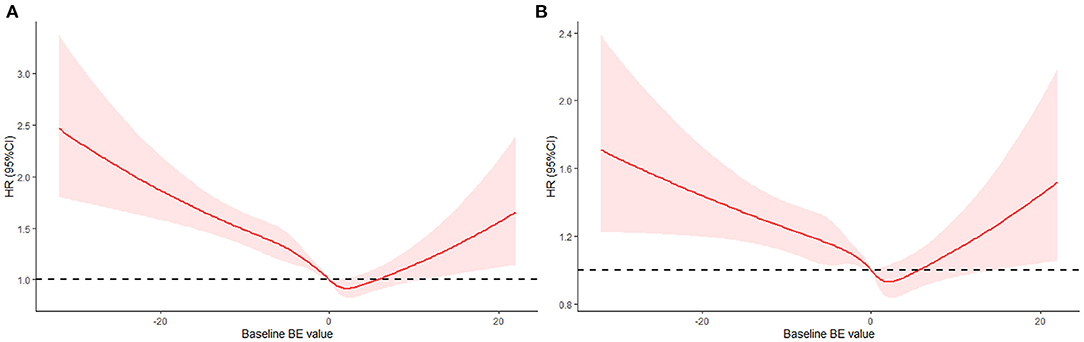
Figure 2. Hazard ratio of all-cause mortality as a function of baseline BE value. (A) Baseline BE was modeled as a continuous variable and fitted in an unadjusted model using restricted quadratic spline regression. (B) Baseline BE was modeled as a continuous variable and adjusted by gender, age, ethnicity, AKI stage, PCO2, Co-morbidities, urine output, SOFA, SAPSII, RRT, vasopressor, ventilation, Creatinine.
The results of the secondary endpoints are presented in Tables 4, 5. The risk of ICU mortality and the risk of in-hospital mortality also showed U-shaped relationships. The median ICU LOS and hospital LOS were significantly different between the groups. Patients in the normal group (−3 mEq/L < BE ≤ 3 mEq/L) showed the shortest ICU LOS and hospital LOS (4.07 and 8.36 days, respectively). Both lower and higher BEs would increase the ICU LOS or hospital LOS. Multiple linear regression results showed that (Table 5), compared with the normal group, the first, second, and fourth groups increased the ICU LOS by 0.65, 0.48, and 0.41 days, respectively. As for hospital LOS, the first group would increase by 0.75 days. The other groups showed no significant differences.
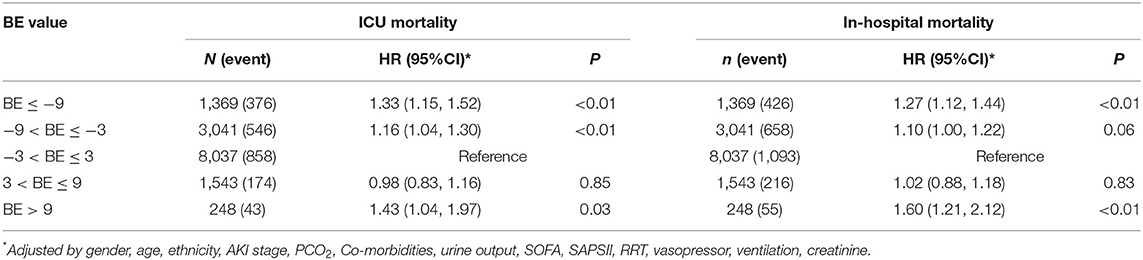
Table 4. Multiple cox regression* result for secondary outcomes according to BE groups in patients with AKI.
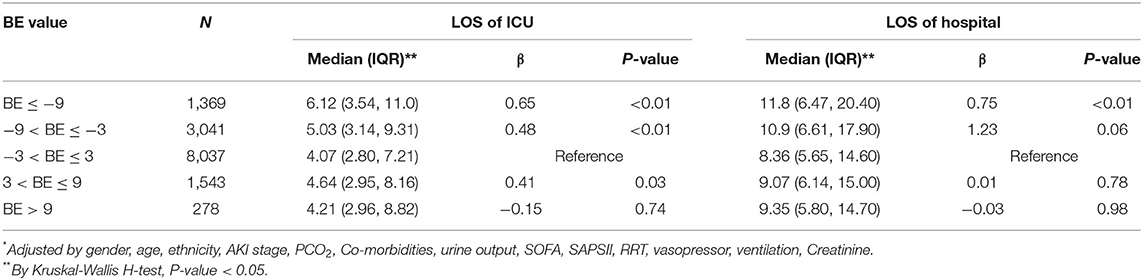
Table 5. Multiple linear regression* results examining the effect of BE in patients with AKI.
Subgroup analysis was based on the following strata: sex (female vs. male), AKI stage (stage 3 vs. stages 1, 2), SOFA score (SOFA ≥ 10, 7 ≤ SOFA <10, 4 ≤ SOFA <7, SOFA <4), and SAPS II score. We divided the patients into four subgroups according to SOFA score quartiles. We also divided the patients into two groups according to the median SAPS II score (median = 40). In almost all subgroups, when BE was in the range of −3~9 mEq/L, the patients had the lowest risk for mortality, and the patients in the fifth BE group (BE > 9 mEq/L) had the highest risk (Table 6). Similar trends of non-linear association between BE and all-cause mortality are presented in Figure 3. After using the multiple Cox model with RCS, BE showed a U-shaped relationship with all-cause mortality in most subgroups (except the SOFA ≥ 10 subgroup). The results of the subgroup analysis for secondary endpoints are shown in Supplementary Tables S2–S5.
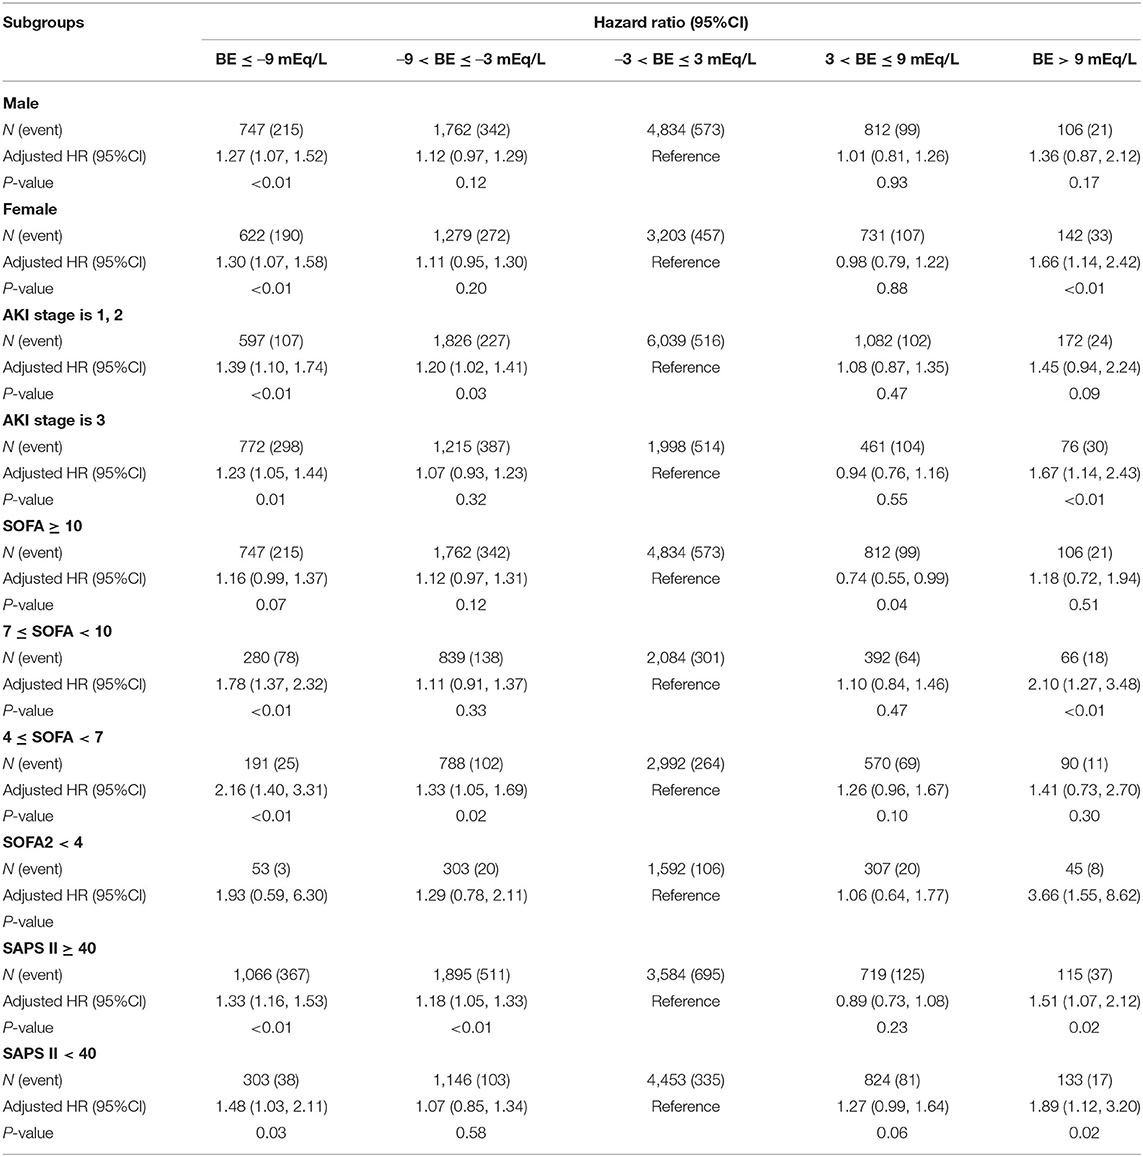
Table 6. HR of 30-day ICU mortality according to BE among subgroups.
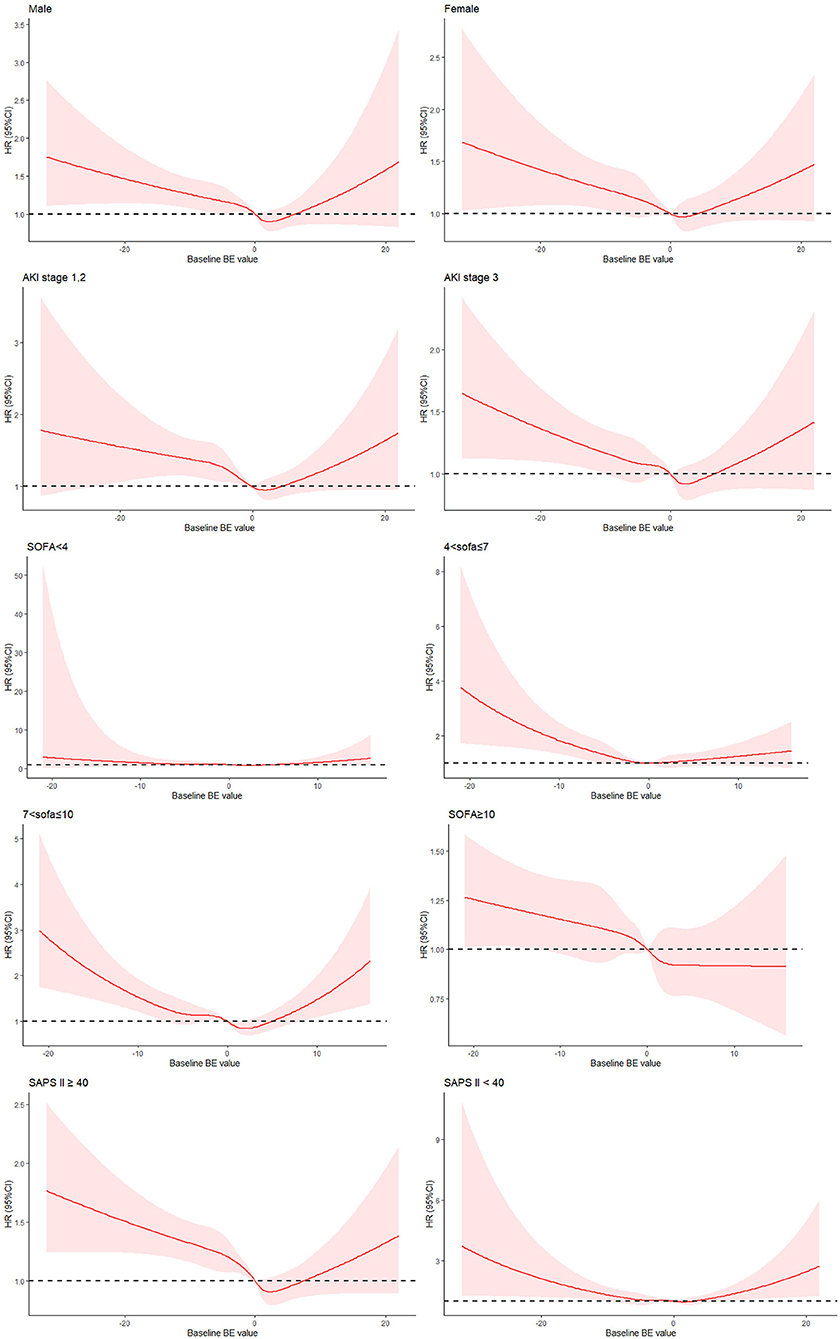
Figure 3. Risk of all-cause mortality according to BE among four subgroups.
Base excess was considered to be one of the most widely used markers in ICU, both to diagnose metabolic acidosis and to guide resuscitation or clinical intervention (17). In this study, we explored the U-shaped relationship between BE and all-cause mortality in ICU patients with AKI. Patients with AKI in the ICU had lower risk for mortality when BE was in the range of −3~9 mEq/L. Both higher and lower BEs would increase the risk.
BE is convenient and intuitive for reflecting acid–base status in the ICU setting. Many studies have focused on base excess as one of the most essential indicators in ICU settings. For patients with trauma, the use of BE appeared to be better than vital signs or shock index for mortality prediction or rapid physiological assessment (18). A systematic review involving 34 studies on trauma patients consistently showed that BE was associated with increased mortality, significant injuries, and major complications (19).
The use of BE has also been extensively studied in burns. A prospective study including 42 major burn patients suggested that base deficit (BD, which is equal to -BE), as well as serum albumin level and hemoglobin concentration, were independent predictors of mortality among patients with burns (20). Binary logistic regression analysis revealed that the odds ratio of BD was 2.23 (95% CI: 1.66–16.75). Furthermore, BE has also been used in newborns and children, for example, in the prediction of early diagnosis of neonatal sepsis.
The vital role of BE in prognosis and prediction has been demonstrated in many diseases. To determine the prognostic value of BE on admission among patients with acute heart failure (AHF), Hiroki Nakano et al. (4) concluded that high BE was an independent determinant of all-cause death in patients with AHF. Similarly, the unadjusted spline curve revealed a U-shaped relationship between BE and the risk of all-cause death. In the multivariable RCS model, a positive linear relationship was observed. Another study also showed a U-shaped association between BE and survival outcomes among patients with congestive heart failure (3).
As for AKI, the relationship between BE and all-cause mortality was more complex. The kidney plays a vital role in maintaining electrolyte homeostasis and acid–base balance. Acid–base disorder is not only a consequence, but also a contributor to the progression of kidney dysfunction.
The U-shaped curve showed that lower BE (≤ -3 mEq/L), which indicated metabolic acidosis, would increase the risk of all-cause mortality in patients with AKI. This result was consistent with another study (21) which suggested that metabolic acidosis was an independent risk factor for the progression of AKI and hospital mortality. This may be because acidosis can reduce renal blood flow and increase inflammatory mediator release (22). Another study (23) demonstrated that hyperchloremic acidosis was associated with post-operative AKI after abdominal surgery. Patients with AKI with severe metabolic alkalosis (BE > 9 mEq/L) had a higher risk of all-cause death, as shown in the U-shaped curve. Significant metabolic alkalosis is rare in AKI and is related to diuretic use, red blood cells and fresh frozen plasma administration (24).
The results of subgroup analysis according to SOFA or SAPSII showed that the risk of mortality monotonically decreased when SOFA > 10, and the risk of mortality was also U-shaped when 4 < SOFA <7, 7 < SOFA <10, SAPS II ≥ 40, and SAPS <40. When the SOFA score was <4, there was no significant U-shaped relationship (Figure 3). Some studies have recommended that organ dysfunction can be identified as an acute change in the total SOFA score ≥ 2 points (25, 26). Several studies also showed that patients with SAPS II > 80 had a higher survival rate (27, 28). However, if we divided patients into subgroups by SOFA (≥2 or <2) and SAPS II (>80 or ≤ 80), there would be fewer members in one group, leading to inaccurate results. Therefore, we divided the subgroups according to the median or quartiles. AKI stage was also a crucial factor for mortality among patients with AKI. In view of the differences in mortality among patients with different AKI stages in univariate analysis, we did subgroup analysis according to AKI stages. And U-shape relationship between BE and mortality among patients with AKI was also existed.
This study had several limitations. First, BE remains a convenient and sensitive indicator for metabolic acid–base status, but it is not consistent with other markers such as lactate, bicarbonate, or anion gap (29). Thus, clinicians should be careful and consider these markers.
In addition, BE can be severely influenced by previous or concomitant administration of bicarbonate or lactate during resuscitation and in-hospital stay before ICU admission. The proportion of bicarbonate and lactate was shown in Supplementary Table S6. We included the two variables into multivariable adjusted model and as part of the sensitivity analysis, we examined multiple Cox models with RCS. The results were showed in Supplementary Table S7 and Supplementary Figure S1, respectively. After including the variables of bicarbonate and lactate, the results changed slightly, but the statistical significance and overall conclusions remain the same. We considered that the low before ICU administration rate of bicarbonate and lactate might not affect the primary results substantially.
Furthermore, AKI can influence the acid–base imbalance; in turn, acid–base status can also be the result of therapies for deteriorating renal function, such as fluid resuscitation, use of diuretics, and RRT. Thus, for prerenal AKI, BE was appropriate for measuring the acid–base status. In contrast, BE had minimal utility for intrarenal or post-postrenal AKI. For example, when patients are on RRT in the ICU setting, BE only reflects the concentration of bicarbonate buffer and the duration of treatment. We considered that the low before ICU administration rate of bicarbonate and lactate might not affect the primary results substantially.
Finally, we considered the first measurement of BE at administration, regardless of the influence of dynamic variation in BE. In the follow-up study, we built a joint model for longitudinal and time-to-event data (30, 31) to control measurement error and explore the effect of BE variation on the risk of all-cause death in patients with AKI.
BE could be an independent risk factor for all-cause death in patients with AKI in the ICU setting. Abnormal BE may be a risk factor for these patients. We also found a U-shaped association between baseline BE and all-cause mortality in patients with AKI. Regardless of whether BE is lower (BE ≤ −3 mEq/L) or higher (BE ≥ 9 mEq/L), it can increase the risk of 30-day ICU mortality in patients with AKI. Thus, BE measured at administration could be a good indicator of the severity of illness and provide guidance for clinicians.
The raw data supporting the conclusions of this article will be made available by the authors, without undue reservation.
YC, YQ, YoZ, and CW designed the study and wrote the manuscript. YT, BT, WG, and XC performed the statistical analysis. RQ, DL, YaZ, SW, and RZ collected the study data. All authors participated in writing and revising the manuscript and read and approved the final manuscript.
This work was supported by Three-Year Action Plan for Strengthening Public Health System in Shanghai (2020-2022) Subject Chief Scientist (No.GWV-10.2-XD05); Military logistics scientific research project (No. AWS14R013-1); Military Key Disciplines Construction Project-03; Natural Science Foundation of Shanghai (No.19ZR1469800); The National Natural Science Foundation of China (No. 82003558).
The authors declare that the research was conducted in the absence of any commercial or financial relationships that could be construed as a potential conflict of interest.
All claims expressed in this article are solely those of the authors and do not necessarily represent those of their affiliated organizations, or those of the publisher, the editors and the reviewers. Any product that may be evaluated in this article, or claim that may be made by its manufacturer, is not guaranteed or endorsed by the publisher.
The Supplementary Material for this article can be found online at: https://www.frontiersin.org/articles/10.3389/fmed.2021.779627/full#supplementary-material
AKI, acute kidney injury; ANOVA, Analysis of variance; BE, base excess; CKD, chronic kidney disease; ICU, intensive care unit; KDIGO, the Kidney Disease Improving Global Outcomes; pH, measure of acidity or alkalinity; PCO2, partial pressure of carbon dioxide; PO2, partial pressure of oxygen; RCS, restrict cubic splines; RRT, renal replacement therapy; SAPSII, simplified Acute Physiology Score II; SOFA, sequential organ failure assessment; LOS, length of stay; UO, urine output.
1. Gameiro J, Carreiro C, Fonseca JA, Pereira M, Jorge S, Gouveia J, et al. Acute kidney disease and long-term outcomes in critically ill acute kidney injury patients with sepsis: a cohort analysis. Clin Kidney J. (2021) 14:1379–87. doi: 10.1093/ckj/sfaa130
2. Horne KL, Packington R, Monaghan J, Reilly T, Selby NM. Three-year outcomes after acute kidney injury: results of a prospective parallel group cohort study. BMJ Open. (2017) 7:e015316. doi: 10.1136/bmjopen-2016-015316
3. Guo W, Peng C, Liu Q, Zhao L, Guo W, Chen X, et al. Association between base excess and mortality in patients with congestive heart failure. ESC Heart Fail. (2021) 8:250–8. doi: 10.1002/ehf2.12939
4. Nakano H, Nagai T, Honda Y, Iwakami N, Matsumoto C, Asaumi Y, et al. Prognostic value of base excess as indicator of acid-base balance in acute heart failure. Eur Heart J Acute Cardiovasc Care. (2020) 9:399–405. doi: 10.1177/2048872619898781
5. Arayici S, Simsek GK, Canpolat FE, Oncel MY, Uras N, Oguz SS. Can base excess be used for prediction to early diagnosis of neonatal sepsis in preterm newborns? Mediterr J Hematol Infect Dis. (2019) 11:e2019014. doi: 10.4084/mjhid.2019.014
6. Eng OS, Dumitra S, O'Leary M, Wakabayashi M, Dellinger TH, Han ES, et al. Base excess as a predictor of complications in cytoreductive surgery with hyperthermic intraperitoneal chemotherapy. Ann Surg Oncol. (2017) 24:2707–11. doi: 10.1245/s10434-017-5869-4
7. Wu H, Hong X, Qu Y, Liu Z, Zhao Z, Liu C, et al. The value of oxygen index and base excess in predicting the outcome of neonatal acute respiratory distress syndrome. J Pediatr (Rio J). (2020) 97:409–13. doi: 10.1016/j.jped.2020.07.005
8. Smith I, Kumar P, Molloy S, Rhodes A, Newman PJ, Grounds RM, et al. Base excess and lactate as prognostic indicators for patients admitted to intensive care. Intensive Care Med. (2001) 27:74–83. doi: 10.1007/s001340051352
9. Novak V, Hu K, Desrochers L, Novak P, Caplan L, Lipsitz L, et al. Cerebral flow velocities during daily activities depend on blood pressure in patients with chronic ischemic infarctions. Stroke. (2010) 41:61–6. doi: 10.1161/STROKEAHA.109.565556
10. Goldberger AL, Amaral L, Glass J, Hausdorff JM, Ivanov PC, Mark RG, et al. PhysioBank, PhysioToolkit, and PhysioNet: components of a new research resource for complex physiologic signals. Circulation. (2000) 101:e215–20. doi: 10.1161/01.CIR.101.23.e215
11. Ricci Z, Romagnoli S. Acute kidney injury: diagnosis and classification in adults and children. Contrib Nephrol. (2018) 193:1–12. doi: 10.1159/000484956
12. Zhang Z. Missing data imputation: focusing on single imputation. Ann Transl Med. (2016) 4:9. doi: 10.3978/j.issn.2305-5839.2015.12.38
13. VanderWeele TJ, Ding P. Sensitivity analysis in observational research: introducing the E-value. Ann Intern Med. (2017) 167:268–74. doi: 10.7326/M16-2607
14. Qin Y, Wei X, Han H, Gu K, Ruan Y, Lucas CH, et al. Association between age and readmission after percutaneous coronary intervention for acute myocardial infarction. Heart. (2020) 106:1595–603. doi: 10.1136/heartjnl-2019-316103
15. Lee DH, Keum N, Hu FB, Orav EJ, Rimm EB, Willett WC, et al. Predicted lean body mass, fat mass, and all cause and cause specific mortality in men: prospective US cohort study. BMJ. (2018) 362:k2575. doi: 10.1136/bmj.k2575
16. Bhaskaran K, dos-Santos-Silva I, Leon DA, Douglas IJ, Smeeth L. Association of BMI with overall cause-specific mortality: a population-based cohort study of 3·6 million adults in the UK. Lancet Diab Endocrinol. (2018) 6:944–53. doi: 10.1016/S2213-8587(18)30288-2
17. Berend K. Diagnostic use of base excess in acid-base disorders. N Engl J Med. (2018) 378:1419–28. doi: 10.1056/NEJMra1711860
18. Dunham MP, Sartorius B, Laing GL, Bruce JL, Clarke DL. A comparison of base deficit and vital signs in the early assessment of patients with penetrating trauma in a high burden setting. Injury. (2017) 48:1972–7. doi: 10.1016/j.injury.2017.06.011
19. Ibrahim I, Chor WP, Chue KM, Tan CS, Tan HL, Siddiqui FJ, et al. Is arterial base deficit still a useful prognostic marker in trauma? A systematic review. Am J Emerg Med. (2016) 34:626–35. doi: 10.1016/j.ajem.2015.12.012
20. Megahed MA, El-Helbawy RH, Gad SS, Mansour MM, Elkandary KA. Base deficit, serum albumin level and blood haemoglobin concentration can be used as predictor factors for mortality in major burn patients. Ann Burns Fire Disasters. (2020) 33:209–45.
21. Hu J, Wang Y, Geng X, Chen R, Xu X, Zhang X, et al. Metabolic acidosis as a risk factor for the development of acute kidney injury and hospital mortality. Exp Ther Med. (2017) 13:2362–74 doi: 10.3892/etm.2017.4292
22. Chowdhury AH, Cox EF, Francis ST, Lobo DN. A randomized, controlled, double-blind crossover study on the effects of 2-L infusions of 0.9% saline and plasma-lyte(R) 148 on renal blood flow velocity and renal cortical tissue perfusion in healthy volunteers. Ann Surg. (2012) 256:18–24. doi: 10.1097/SLA.0b013e318256be72
23. Toyonaga Y, Kikura M. Hyperchloremic acidosis is associated with acute kidney injury after abdominal surgery. Nephrology (Carlton). (2017) 22:720–7. doi: 10.1111/nep.12840
24. Claure-Del Granado R, Bouchard J. Acid-base and electrolyte abnormalities during renal support for acute kidney injury: recognition and management. Blood Purif . (2012) 34:186–93. doi: 10.1159/000341723
25. Singer M, Deutschman CS, Seymour CW, Shankar-Hari M, Annane D, Bauer M, et al. The third international consensus definitions for sepsis and septic shock (sepsis-3). JAMA. (2016) 315:287. doi: 10.1001/jama.2016.0287
26. Jones AE, Trzeciak SA, Kline JA. The sequential organ failure assessment score for predicting outcome in patients with severe sepsis and evidence of hypoperfusion at the time of emergency department presentation. Crit Care Med. (2009) 37:1649–54. doi: 10.1097/CCM.0b013e31819def97
27. Choi MJ, Ha SO, Kim HS, Park S, Han SJ, Lee SH. The simplified acute physiology score II as a predictor of mortality in patients who underwent extracorporeal membrane oxygenation for septic shock. Ann Thoracic Surg. (2017) 103:1246–53. doi: 10.1016/j.athoracsur.2016.07.069
28. Kim KI, Lee HS, Kim HS, Ha SO, Lee WY, Park SJ, et al. The pre-ECMO simplified acute physiology score II as a predictor for mortality in patients with initiation ECMO support at the emergency department for acute circulatory and/or respiratory failure: a retrospective study. Scand J Trauma Resusc Emerg Med. (2015) 23:59. doi: 10.1186/s13049-015-0135-x
29. Juern J, Khatri V, Weigelt J. Base excess: a review. J Trauma Acute Care Surg. (2012) 73:27–32. doi: 10.1097/TA.0b013e318256999d
30. Rizopoulos D. Joint Models for Longitudinal and Time-to-Event Data. Boca Raton, FL: Chapman Hall/CRC Biostatistics Series (2012).
Keywords: base excess, acute kidney injury, 30-day mortality, restrict cubic splines, MIMIC-IV
Citation: Cheng Y, Zhang Y, Tu B, Qin Y, Cheng X, Qi R, Guo W, Li D, Wu S, Zhu R, Zhao Y, Tang Y and Wu C (2021) Association Between Base Excess and Mortality Among Patients in ICU With Acute Kidney Injury. Front. Med. 8:779627. doi: 10.3389/fmed.2021.779627
Received: 19 September 2021; Accepted: 09 November 2021;
Published: 02 December 2021.
Edited by:
Kostas G. Stylianou, University Hospital of Heraklion, GreeceReviewed by:
Marios Papasotiriou, University of Patras, GreeceCopyright © 2021 Cheng, Zhang, Tu, Qin, Cheng, Qi, Guo, Li, Wu, Zhu, Zhao, Tang and Wu. This is an open-access article distributed under the terms of the Creative Commons Attribution License (CC BY). The use, distribution or reproduction in other forums is permitted, provided the original author(s) and the copyright owner(s) are credited and that the original publication in this journal is cited, in accordance with accepted academic practice. No use, distribution or reproduction is permitted which does not comply with these terms.
*Correspondence: Cheng Wu, d3VjaGVuZ193dUAxMjYuY29t; Yuanjun Tang, d2gudHlqLjIwMDdAMTYzLmNvbQ==
†These authors have contributed equally to this work
Disclaimer: All claims expressed in this article are solely those of the authors and do not necessarily represent those of their affiliated organizations, or those of the publisher, the editors and the reviewers. Any product that may be evaluated in this article or claim that may be made by its manufacturer is not guaranteed or endorsed by the publisher.
Research integrity at Frontiers
Learn more about the work of our research integrity team to safeguard the quality of each article we publish.