 Wanju Yang1
 Yanzhu Luo1,2,3Shangcao Wu1Xiaoxia Niu4Yanshuang Yan5Chen Qiao1,3Wei Ming1,3Ying Zhang1Haoyu Wang1,3Dan Chen1,3Mengying Qi1,3Lan Ke1,3Ying Wang1,3Liping Li1,3Shaowei Li6Qingyan Zeng1,2,3,6,7*
- 1Aier Eye Hospital of Wuhan University, Wuhan, China
- 2Aier School of Ophthalmology, Central South University, Changsha, China
- 3Department of Cornea and Ocular Surface Diseases, Wuhan Aier Hankou Eye Hospital, Wuhan, China
- 4Department of Cornea and Ocular Surface Diseases, Harbin Aier Eye Hospital, Harbin, China
- 5Department of Cornea and Ocular Surface Diseases, Guangzhou Aier Eye Hospital, Guangzhou, China
- 6Aier Cornea Institute, Beijing, China
- 7Aier School of Ophthalmology and Optometry, Hubei University of Science and Technology, Xianning, China
Purpose: To conduct a multi-center analysis and assess the economic burden due to dry eye disease (DED) in China.
Design: A retrospective and cross-sectional study.
Methods: Patients (n = 598) with diagnosed DED were recruited from 3 eye centers (in central, southeast, and northeast China) from 1 January 2018 to 31 December 2018. Data were collected regarding the examination, pharmacological therapy, and non-pharmacological therapy fees. Sub-group analyses were stratified by eye center, DED severity, types of DED, number of visits to physicians, and residential area. A logistic regression analysis was conducted to investigate the variables influencing total costs.
Results: The per capita costs devoted to DED at the 3 centers were 422.6, 391.3, and 265.4 USD, respectively. The costs of non-pharmacological therapy accounted the largest part in three centers (75.6, 76.4, 76.5%, respectively). Patients with severe DED sustained the largest economic burden. Patients with mixed type of DED spent the most comparing to patients with either evaporative or aqueous-deficient types of DED. Patients spent more during the first visit compared with subsequent visits. Patients living in urban areas spent significantly more than did those living in rural areas (P = 0.001). The logistics regression analysis showed that total costs were significantly influenced by DED severity, number of visits to physicians, and area of residence (beta = 2.83, 0.83, 1.48; P < 0.0001).
Conclusions: DED is a chronic ocular disease that timely non-cost counseling, early diagnosis, and efficacious treatment can reduce its economic burden on patients and the society.
Introduction
Dry eye disease (DED) is a chronic and progressive multifactorial disorder of the ocular surface characterized by unstable tear film; or imbalanced microenvironment caused by abnormal tear quality, quantity, and dynamics. It can be accompanied by inflammatory reactions of the ocular surface, tissue damage, and neurological abnormalities, which result in a variety of symptoms of ocular discomfort, visual dysfunction, or both (1). Among people seeking eye care in the United States, DED has become the fifth most prevalent ocular condition in women and ninth most prevalent in men (2).
The prevalence of DED ranges from 5.28 to 33.7% worldwide (3–5). The Dry Eye Workshop (DEWS) committee reported that the prevalence of DED in Southeast Asia is as high as 20.0 to 52.4% (6). In New Zealand, signs of clinical dry eye were present in almost half of a cohort of 45-year-olds (7). In China, a meta-analysis revealed that DED diagnosed by symptoms alone affected 31.40%, or corresponding to 394.13 million affected individuals in the country (4).
DED can be caused by a variety of reasons, including aging, female population (6, 8), environmental factors (e.g., extreme temperature and reduced humidity) (9), and daily-life behaviors [smoking (10), digital screen exposure (11, 12), reduced caffeine consumption, and contact lenses (13)]. Surgical and para-surgical causes such as refractive (14, 15) and cataract surgeries (16, 17) can promote DED, as well as certain medications (18, 19) such as beta-blockers, antihistamines, oral contraceptives, and anti-glaucoma eye drops. A history of thyroid disease, and poorer self-rated health (16), have also been associated with DED.
Many therapies have been demonstrated to improve the signs and symptoms of DED (20). However, global studies suggest that long-term treatment of DED imposes a substantial economic burden on patients and society. In the United States in 2008, the overall burden of DED for the healthcare system was 3.84 billion United States dollars (USD), the cost of managing DED per patient was 11,302 USD, and the overall societal cost was 55.4 billion USD. The costs categories included ocular lubricant treatment, cyclosporine, punctal plugs, physician visits, and nutritional supplements (21). A retrospective study conducted in Germany showed that total costs were ~117 million euro for a DED cohort of 35,026 patients. The costs were analyzed based on the healthcare resource used by the DED patients, including visits to the general practitioner or ophthalmologist, pharmacological treatment, and ocular procedures (uncommon) (22). A systemic literature review evaluated and compared the burden of DED across France, Germany, Italy, Spain, United Kingdom, United States, and Japan (23). Clegg et al. (24) reported that the direct economic burden of managing DED in European countries in 2003 ranged from 270 USD to 1,100 USD per patient and the costs mainly included diagnostic test, specialists visits, prescribed drugs, and surgery. While DED costs vary among countries, the economic burden of DED across regions is comparable. Yet, there is limited data regarding the annual economic burden of DED in Asia, especially China. Besides, seldom research reported the costs of non-pharmacological therapies.
This study aims to conduct a multi-center comprehensive estimation of the costs associated with DED for the year 2018 in China and provides insight into the burden of DED on patients and society.
Materials and Methods
Data Source
The study was approved by the ethics committees of 3 eye centers, Wuhan Aier Hankou Eye Hospital (Center-1, central China), Guangzhou Aier Eye Hospital (Center-2, southeast China), and Ha'erbin Eye Hospital (Center-3, northeast China), respectively. The study was conducted in accordance with the tenets of the Declaration of Helsinki, and the enrolled patients provided signed informed consent.
The participants were recruited from outpatients visiting the above 3 eye centers, from 1 January 2018 to 31 December 2018. The inclusion criteria were: (1) subjects aged ≥18 years, (2) had received a diagnosis of DED without other ocular diseases (such as cataract or glaucoma), and (3) were managed and followed-up in the study centers without any interventions from other hospitals or pharmacies. Individuals with any of the following were excluded: (1) eye surgeries in the past 6 months, (2) infectious corneal diseases during follow-up visits, or (3) ended follow-up during the study year.
DED diagnosis and severity criteria were that of the dry eye consensus of the Chinese Medical Association in 2013, and defined as mild, moderate, or severe (Table 1). Classification of DED was consistent with the TFOS (Tear Film and Ocular Surface Society) DEWS II Definition and Classification Report.
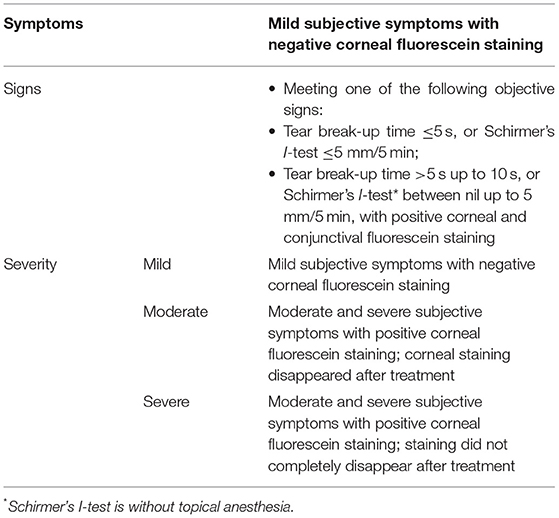
Table 1. Diagnosis and severity criteria of DED.
Data Collection
The outpatient medical record systems of the 3 hospitals were searched for the cost information of the enrolled patients during the 1-year follow-up. The costs included 3 categories of fees: examinations, pharmacological therapy, and non-pharmacological therapy.
The examination fees included the costs of the general ophthalmological examinations (i.e., intraocular pressure and slit lamp inspection with fluorescein staining) and examinations related to DED (i.e., quantitative and qualitative evaluations of the tear film, and the morphology and function of the meibomian glands). The pharmacological therapy fees consisted of the cost of eye drops to treat DED during the year. Non-pharmacological therapy costs included costs of ophthalmic physiotherapy (i.e., meibomian gland massage, palpebral margin cleaning, eyelid nebulization therapy, and intense pulsed light) and costs of purchased products for treatment (i.e., lacrimal punctual plugs, moisture chamber glasses, corneal bandage lenses, and warm compress eye masks).
Statistical Analysis
All the data were analyzed using SPSS 22.0 (SPSS IBM, New York, NY, USA) software. A P < 0.05 was considered statistically significant. Demographic comparisons among the 3 centers (from the central, southeast, and northeast districts) were performed via chi-squared test for dichotomous variables, analysis of variance (ANOVA) for continuous variables, and non-parametric tests for non-normally distributed data.
The subjects were categorized, both overall (the 3 centers) and for each center individually, to determine the respective median values of the total costs.
Comparisons were made of the per capita cost related to DED with the gross domestic product (GDP), and with the income of the city where the medical center is located. Economic burden is shown as USD ($), according to the 2018 currency exchange rate (6.61 Chinese Yuan/USD; National Bureau of Statistics of China, https://data.stats.gov.cn/easyquery.htm?cn=C01&zb=A060J&sj=2018).
In the univariate analyses, cost comparisons between subgroups stratified by different variables were conducted by Mann-Whitney Test (2 categories) or Kruskal-Wallis H-Test (multiple categories). The variables included the following: DED severity (mild, moderate, severe); types of DED (evaporative, aqueous-deficient, and mixed DED); number of visits to physicians (first visit, subsequent visit); residential area (urban, rural).
Logistic regression models were used to estimate cost differences between the groups that were lower or higher than the median value. Variables related to DED severity, number of visits to physicians, and residential area were included in the models.
Results
Demographics
The study population comprised 598 patients overall, with 199, 199, and 200 patients in Center-1, Center-2, and Center-3, respectively (Table 2). The 3 centers differed significantly by age, gender ratio, and number of visits to physicians (P ≤ 0.0001, 0.018, <0.0001). There were 132 mild, 53 moderate, and 14 severe cases of DED in Center-1; 148 mild, 51 moderate, and no severe cases in Center-2; and 142 mild, 40 moderate, and 18 severe cases in Center-3. Regarding to the type of DED, there were 49 evaporative dry eye, 9 aqueous-deficient dry eye, and 141 mixed dry eye subjects in Center-1; 199 mixed dry eye subjects in Center-2; and 37 evaporative dry eye, 96 aqueous-deficient dry eye, and 67 mixed dry eye subjects in Center-3. The number of visits were 1 to 5, 1 to 4, and 4 at Center-1, Center-2, and Center-3.
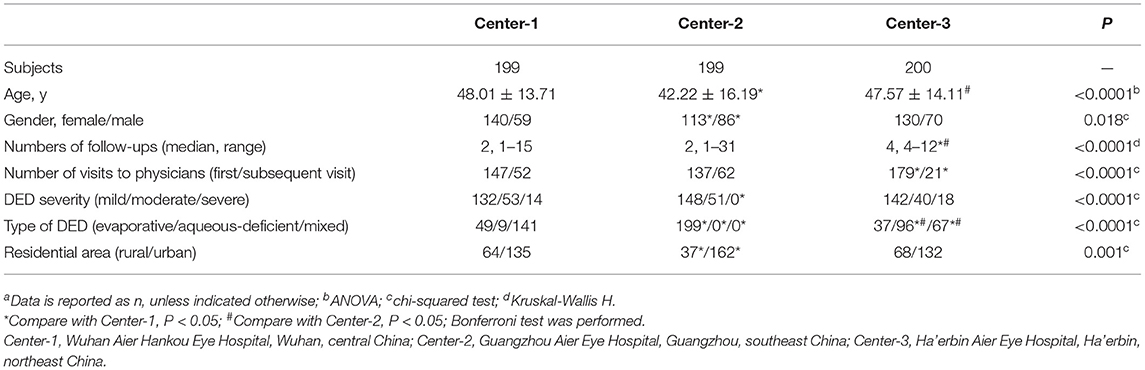
Table 2. Demographic characteristics of patients at 3 eye centersa.
Per Capita Annual Costs Analysis
The per capita total costs related to DED at Center-1, Center-2, and Center-3 were $422.6, $391.3, and $265.4 (P = 0.043), respectively (Table 3). The percentages in per capita residual income were 3.16, 2.31, 2.44%; and GDP (year 2018) were 1.66, 1.05, and 2.65%.
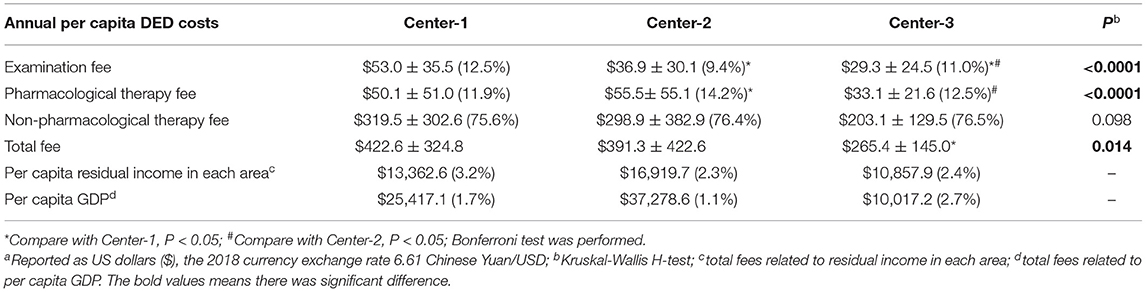
Table 3. Percentages of annual per capita DED costs in residual income and GDP (year 2018)a.
The examination fees differed significantly among the centers (P < 0.0001), as well as the pharmacological therapy fees (P < 0.0001), but the non-pharmacological fees were comparable (P = 0.098). The costs of non-pharmacological therapy accounted the largest part in three centers (75.6, 76.4, 76.5, respectively).
Sub-Group Analysis
The annual (2018) per capita costs related to DED among the subgroups was reported (Table 4). Compared with patients with mild or moderate DED, those with severe DED incurred the highest examination, pharmacological therapy, and non-pharmacological therapy fees. Compared with patients with evaporative or aqueous-deficient DED, those with mixed DED incurred the highest examination, non-pharmacological therapy, and total fees. There was no significant difference on the pharmacological therapy fee among three types of DED. Patients spent significantly more at the first visit on the examination fee, pharmacological therapy fee, non-pharmacological therapy fee, and the total fee (P =0.010, 0.049, <0.0001, <0.0001). Patients living in urban areas spent more than those living in rural areas on the examination fee, pharmacological therapy fee, non-pharmacological therapy fee, and the total fee (P <0.0001, <0.0001, <0.0001, <0.0001).
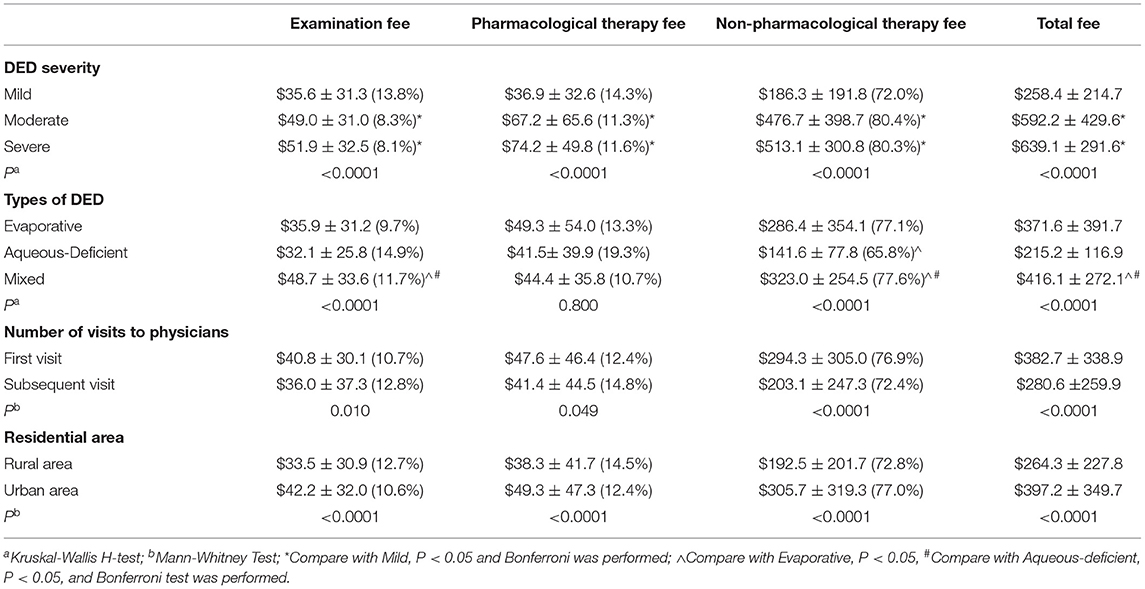
Table 4. Summary of the annual (2018) per capita costs related to DED among the subgroups (USD).
Logistics Regression Analysis
The logistics regression analysis showed that, for the centers overall, DED severity, number of visits to physicians, and residential area had a significant influence on total costs (beta = 2.83, 0.83, 1.48, respectively, P < 0.0001). The significant variable that influenced total costs at Center-1 was disease severity only (beta = 1.37, P < 0.0001); at Center-2, the influential variables were disease severity (beta = 2.84, P < 0.0001) and number of visits to physicians (beta = 1.51, P = 0.003); at Center-3, disease severity (beta = 2.84, P < 0.0001) and residential area (beta = 1.65, P = 0.004) were of greatest importance.
Discussion
To the best of our knowledge, this is the first multi-center analysis of the annual economic burden imposed by DED in China. The global economic burden due to DED, to the patient and society, is not trivial. In the last decade, various methods have been used to analyze the economic burden on patients with DED worldwide (Table 5) (21, 22, 25, 27–30), but little is known about the situation in China (31).
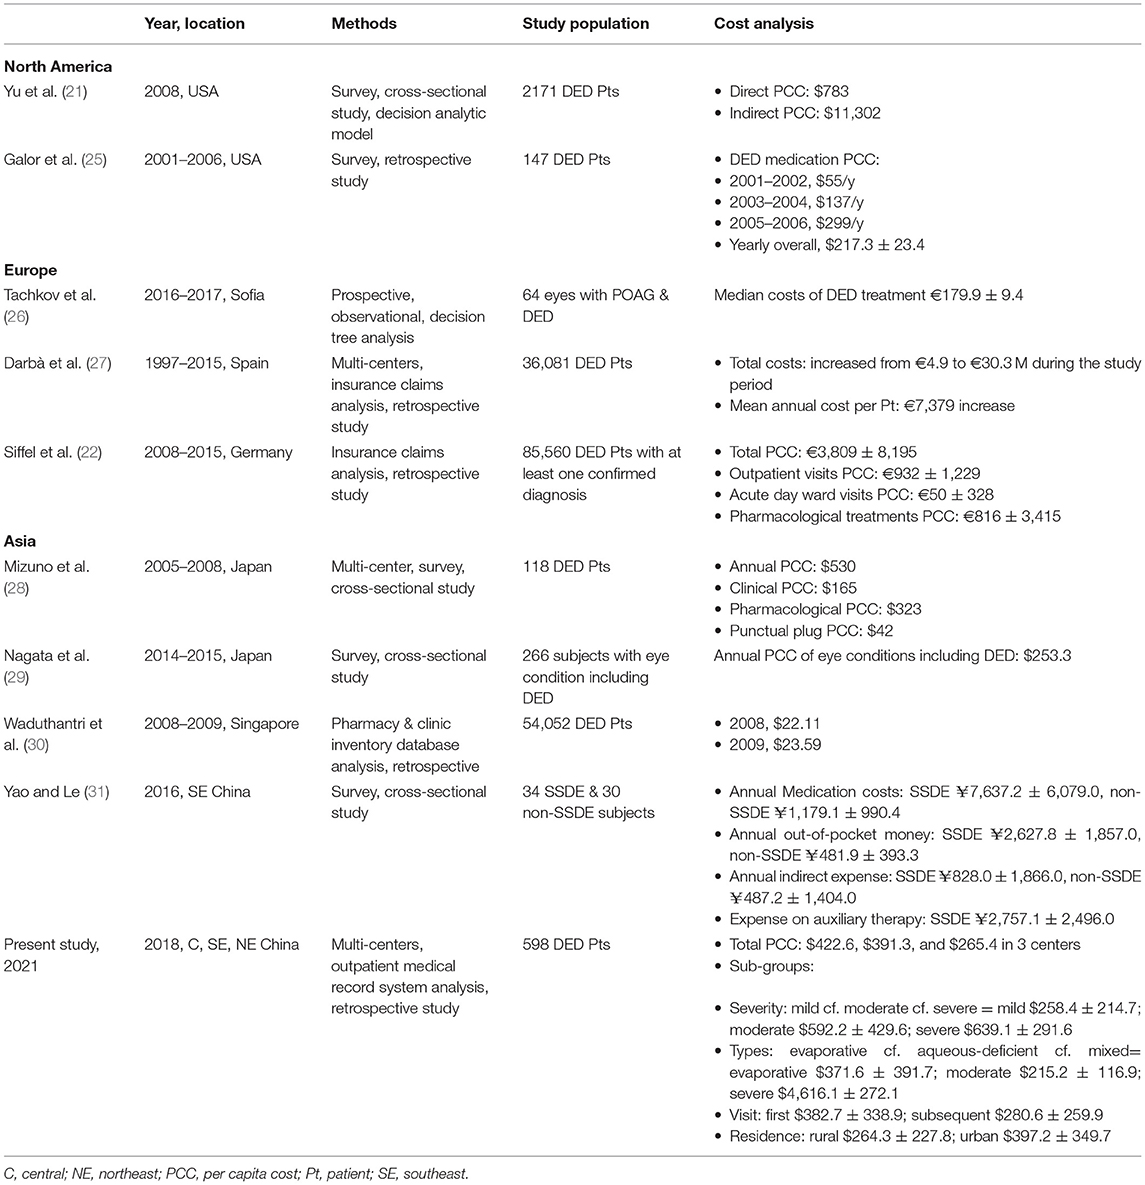
Table 5. Studies on the economic burden of DED published between 2010 and 2020.
In the current study, data were collected from 3 eye centers, in central, southeast, and northeast China, respectively. The annual total costs (per capita) associated with DED ranged from $264.5 to $422.6, which appeared lower than the studies discussed above. However, the economic and medical status in different regions is an important factor that affects economic burden. We found that the per capita costs of DED accounted for 2.31–3.16% of per capita residual income, and 1.05–2.65% of per capita GDP, in the different districts. When taking into account the prevalence of DED in China (affecting 394.13 million individuals) (4), the overall burden of DED for the healthcare system translates to $104.2 billion to $166.6 billion per year, which was much higher than the estimated annual economic burden in the US society overall [$55.4 billion (21)]. Therefore, the economic burden of DED on the Chinese people is such that more reasonable policymaking is needed regarding state-set medication prices and medical care reimbursement.
There were significant differences in the annual per capital DED costs, examination fee, and pharmacological therapy fee among three centers. The non-pharmacological therapy fee was still higher in Center-1 than other two centers, although the difference was not significant. One of the reasons is that the DED specialized outpatient clinic was set in Center-1 in 2014 and patients in Wuhan city were more willing to accept complicated examinations and non-pharmacological therapies. Costs in Center-3 located in Ha'erbin were all much lower than Center-1 and Center-2 as the city was less developed and the overall outpatient costs were much lower.
As far as we know, this study is the first multi-center analysis to report non-pharmacological costs, that is, those associated with ophthalmic physiotherapy conducted in clinics and those treatment products purchased. The non-pharmacological costs accounted for the largest share of the total costs in all three centers to ($319.5, $298.9, $203.1, 75.6, 76.4, 76.5%, respectively). Examples of ophthalmic physiotherapy conducted in clinics are meibomian gland expression (MGX), palpebral margin cleaning, eyelid nebulization therapy, and intense pulsed light (IPL) treatment. Treatment products purchased by patients include lacrimal punctual plugs, moisture chamber glasses, corneal bandage lens, and warm compress eye masks. Among them, MGX and IPL were most widely used according to our preliminary single center analysis (32). As meibomian gland disease related DED becomes more common, technologies for efficacious management are important (33) and IPL was found safe for DED therapy (34). However, they are currently quite costly, and more advances in methods and strategies for DED management that may reduce costs are warranted.
From the logistic regression analysis of the current study, it was found that the total costs of the patient were significantly influenced by DED severity. Compared with patients with mild or moderate DED, those with severe DED incurred the highest medical expense. Although DED is not curable, timely and efficient treatment can relieve the symptoms. However, one study found that patients tended to discontinue follow-ups as DED prolonged after diagnosis (35). Thus, timely and comprehensive education on patient is essential to prevent their discouragement on following treatment. Besides, early intervention is important to prevent DED progression, which can potentially improve quality of life and work productivity, reducing the indirect costs of DED in more severe stages.
Patients with mixed type of DED spent the most and then followed patients with evaporative and aqueous-deficient DED. The possible reason was that the symptoms of patients with aqueous-deficient DED could be alleviated by pharmacological therapies which were much inexpensive. While patients with mixed or evaporative DED were more likely to be treated with non-pharmacological therapies or combining multiple kinds of therapied which could result in more costs.
In addition to DED severity and type, we also found that number of visits to physicians influenced the costs. Although much less subjects had follow-up visits, the costs of subsequent visits were comparable to the costs of subjects' first visit, especially the examinations and pharmacological therapy fee. As DED is not curable and in need of long-term treatment to alleviate symptoms, further research is essential to investigate on cheaper examination technologies and more efficient therapies so that patients could spend less on follow-up visits during their lifetime. Besides, in China, some costs on DED non-pharmacological therapy were not covered by patients' insurance. Thus, the support from the government and insurance companies is also important to reduce the burden on patients.
Compared with patients living in rural areas, those living in urban areas spent more on DED examinations and treatment. It is reasonable that patients with these later characteristics may be more annoyed by DED and more willing to seek medical treatment. In addition, such patients are more likely to experience longer exposures to electronic devices, which is a risk factor of DED onset and deterioration. Therefore, for these subjects, more detailed non-cost counseling is necessary to prevent disease progression.
Our study has several strengths. It gains credibility by being multicenter, with 3 eye centers in central, southeast, and northeast China. This aspect makes it more representative and comprehensive. Another strength is that the cost data was collected not from self-questionnaires, but from the outpatient medical record systems of the hospitals, which is more objective. Finally, subgroup and logistic regression analyses were conducted to investigate the significance of the variables that influence the costs associated with DED. However, there are also some limitations. One limitation is that only the direct medical costs related to DED were collected or calculated. The effect of indirect costs, such as low employment, absence from work, and impaired productivity, will be investigated in the future. Another factor of note is that the actual economic burden of DED could have been underestimated, as we only collected data for 1 year. Future study using decision tree or Markov model is needed. Besides, the sample size was relatively small and we only included centers in China which may influence the generalizability of our study outside China.
Conclusions
Patients due to DED sustain a heavy economic burden for the healthcare system in China, which translates to $104.2–$166.6 billion per year when taking into account the prevalence of DED in China (affecting 394.13 million individuals). DED is a chronic ocular disease that costs more on patients in more severe disease stage. Thus, timely non-cost counseling, early diagnosis, and efficacious treatment are essential to retard the disease progression and potentially reduce the economic burden.
Data Availability Statement
The raw data supporting the conclusions of this article will be made available by the authors, without undue reservation.
Ethics Statement
The studies involving human participants were reviewed and approved by Ethics Committees of Wuhan Aier Hankou Eye Hospital (Center-1), Guangzhou Aier Eye Hospital (Center-2), and Ha'erbin Eye Hospital (Center-3). The patients/participants provided their written informed consent to participate in this study.
Author Contributions
WY, YL, SL, and QZ conceived and designed research. YL, XN, YY, CQ, WM, YZ, HW, DC, MQ, LK, YW, and LL collected data and conducted research. WY and SW analyzed and interpreted data. WY and QZ wrote the initial paper. SL and QZ revised the paper. QZ had primary responsibility for final content. All authors read and approved the final manuscript.
Funding
This work was supported by the Aier Eye Hospital Group (Grant No. AR1904D2), Youth Project of the Medical Scientific Research Foundation of Wuhan Municipal Health Commission (Grant No. WX21Q33), the Science and Technology Innovation Program of Hunan Province (Grant No. 2020SK50104), and Scientific Research Fund project of Aier Eye Hospital Group (Grant No. AF2004D10). The authors declare that the funding body was not involved in study design, data collection, analysis, interpretation, and writing of the study.
Conflict of Interest
The authors declare that the research was conducted in the absence of any commercial or financial relationships that could be construed as a potential conflict of interest.
Publisher's Note
All claims expressed in this article are solely those of the authors and do not necessarily represent those of their affiliated organizations, or those of the publisher, the editors and the reviewers. Any product that may be evaluated in this article, or claim that may be made by its manufacturer, is not guaranteed or endorsed by the publisher.
Abbreviations
ANOVA, analysis of variance; DED, dry eye disease; DEWS, The Dry Eye Workshop; GDP, gross domestic product; SSDE, Sjögren's syndrome dry eye; TFOS, Tear Film and Ocular Surface Society; USD, United States dollars.
References
1. Craig JP, Nichols KK, Akpek EK, Caffery B, Dua HS, Joo CK, et al. TFOS DEWS II definition and classification report. Ocul Surf. (2017) 15:276–83. doi: 10.1016/j.jtos.2017.05.008
2. Bradley JL, Özer Stillman I, Pivneva I, Guerin A, Evans AM, Dana R. Dry eye disease ranking among common reasons for seeking eye care in a large US claims database. Clin Ophthalmol. (2019) 13:225–32. doi: 10.2147/OPTH.S188314
3. Uchino M, Schaumberg DA, Dogru M, Uchino Y, Fukagawa K, Shimmura S, et al. Prevalence of dry eye disease among Japanese visual display terminal users. Ophthalmology. (2008) 115:1982–8. doi: 10.1016/j.ophtha.2008.06.022
4. Song P, Xia W, Wang M, Chang X, Wang J, Jin S, et al. Variations of dry eye disease prevalence by age, sex and geographic characteristics in China: a systematic review and meta-analysis. J Glob Health. (2018) 8:020503. doi: 10.7189/jogh.08.020503
5. Dana R, Bradley JL, Guerin A, Pivneva I, Stillman I, Evans AM, et al. Estimated prevalence and incidence of dry eye disease based on coding analysis of a large, all-age united states health care system. Am J Ophthalmol. (2019) 202:47–54. doi: 10.1016/j.ajo.2019.01.026
6. Stapleton F, Alves M, Bunya VY, Jalbert I, Lekhanont K, Malet F, et al. TFOS DEWS II epidemiology report. Ocul Surf. (2017) 15:334–65. doi: 10.1016/j.jtos.2017.05.003
7. Craig JP, Wang MTM, Ambler A, Cheyne K, Wilson GA. Characterising the ocular surface and tear film in a population-based birth cohort of 45-year old New Zealand men and women. Ocul Surf. (2020) 18:808–13. doi: 10.1016/j.jtos.2020.08.005
8. Malet F, Le Goff M, Colin J, Schweitzer C, Delyfer MN, Korobelnik JF, et al. Dry eye disease in French elderly subjects: the alienor study. Acta Ophthalmol. (2014) 92:e429–36. doi: 10.1111/aos.12174
9. Berg EJ, Ying GS, Maguire MG, Sheffield PE, Szczotka-Flynn LB, Asbell PA, et al. Climatic and environmental correlates of dry eye disease severity: a report from the dry eye assessment and management (DREAM) study. Transl Vis Sci Technol. (2020) 9:25. doi: 10.1167/tvst.9.5.25
10. Sayin N, Kara N, Pekel G, Altinkaynak H. Effects of chronic smoking on central corneal thickness, endothelial cell, and dry eye parameters. Cutan Ocul Toxicol. (2014) 33:201–5. doi: 10.3109/15569527.2013.832688
11. Porcar E, Pons AM, Lorente A. Visual and ocular effects from the use of flat-panel displays. Int J Ophthalmol. (2016) 9:881–5. doi: 10.18240/ijo.2016.06.16
12. Wang MTM, Muntz A, Mamidi B, Wolffsohn JS, Craig JP. Modifiable lifestyle risk factors for dry eye disease. Cont Lens Anterior Eye. (2021) 101409. doi: 10.1016/j.clae.2021.01.004 [Epub ahead of print].
13. Kastelan S, Lukenda A, Salopek-Rabatić J, Pavan J, Gotovac M. Dry eye symptoms and signs in long-term contact lens wearers. Coll Antropol. (2013) 37 (Suppl. 1):199–203.
14. Azuma M, Yabuta C, Fraunfelder FW, Shearer TR. Dry eye in LASIK patients. BMC Res Notes. (2014) 7:420. doi: 10.1186/1756-0500-7-420
15. Roszkowska AM, Biondi S, Chisari G, Messina A, Ferreri FM, Meduri A. Visual outcome after excimer laser refractive surgery in adult patients with amblyopia. Eur J Ophthalmol. (2006) 16:214–8. doi: 10.1177/112067210601600204
16. Man REK, Veerappan AR, Tan SP, Fenwick EK, Sabanayagam C, Chua J, et al. Incidence and risk factors of symptomatic dry eye disease in Asian Malays from the Singapore Malay eye study. Ocul Surf. (2017) 15:742–8. doi: 10.1016/j.jtos.2017.04.004
17. Meduri A, Urso M, Signorino GA, Rechichi M, Mazzotta C, Kaufman S. Cataract surgery on post radial keratotomy patients. Int J Ophthalmol. (2017) 10:1168–70. doi: 10.18240/ijo.2017.07.23
18. Fraunfelder FT, Sciubba JJ, Mathers WD. The role of medications in causing dry eye. J Ophthalmol. (2012) 2012:285851. doi: 10.1155/2012/285851
19. Roberti G, Tanga L, Manni G, Riva I, Verticchio AC, Berardo F, et al. Tear film, conjunctival and corneal modifications induced by glaucoma treatment. Curr Med Chem. (2019) 26:4253–61. doi: 10.2174/0929867326666190517111823
20. Simşek C, Dogru M, Kojima T, Tsubota K. Current management and treatment of dry eye disease. Turk J Ophthalmol. (2018) 48:309–13. doi: 10.4274/tjo.69320
21. Yu J, Asche CV, Fairchild CJ. The economic burden of dry eye disease in the United States: a decision tree analysis. Cornea. (2011) 30:379–87. doi: 10.1097/ICO.0b013e3181f7f363
22. Siffel C, Hennies N, Joseph C, Lascano V, Horvat P, Scheider M, et al. Burden of dry eye disease in Germany: a retrospective observational study using German claims data. Acta Ophthalmol. (2020) 98:e504–12. doi: 10.1111/aos.14300
23. McDonald M, Patel DA, Keith MS, Snedecor SJ. Economic and humanistic burden of dry eye disease in europe, north america, and asia: a systematic literature review. Ocul Surf. (2016) 14:144–67. doi: 10.1016/j.jtos.2015.11.002
24. Clegg JP, Guest JF, Lehman A, Smith AF. The annual cost of dry eye syndrome in France, Germany, Italy, Spain, Sweden and the United Kingdom among patients managed by ophthalmologists. Ophthalmic Epidemiol. (2006) 13:263–74. doi: 10.1080/09286580600801044
25. Galor A, Zheng DD, Arheart KL, Lam BL, Perez VL, McCollister KE, et al. Dry eye medication use and expenditures: data from the medical expenditure panel survey 2001 to 2006. Cornea. (2012) 31:1403–7. doi: 10.1097/ICO.0b013e31823cc0b7
26. Tachkov K, Vassilev A, Kostova S. Modeling the pharmacotherapy cost and outcomes of primary open-angle glaucoma with dry eye. Front Public Health. (2019) 7:363. doi: 10.3389/fpubh.2019.00363
27. Darbà J, Ascanio M. Economic impact of dry eye disease in Spain: a multicentre retrospective insurance claims database analysis. Eur J Ophthalmol. (2020) 31:328–33. doi: 10.1177/1120672120907315
28. Mizuno Y, Yamada M, Shigeyasu C. Annual direct cost of dry eye in Japan. Clin Ophthalmol. (2012) 6:755–60. doi: 10.2147/OPTH.S30625
29. Nagata T, Mori K, Ohtani M, Nagata M, Kajiki S, Fujino Y, et al. Total health-related costs due to absenteeism, presenteeism, and medical and pharmaceutical expenses in japanese employers. J Occup Environ Med. (2018) 60:e273–80. doi: 10.1097/JOM.0000000000001291
30. Waduthantri S, Yong SS, Tan CH, Shen L, Lee MX, Nagarajan S, et al. Cost of dry eye treatment in an Asian clinic setting. PLoS ONE. (2012) 7:e37711. doi: 10.1371/journal.pone.0037711
31. Yao W, Le Q. Social-economic analysis of patients with sjogren's syndrome dry eye in East China: a cross-sectional study. BMC Ophthalmol. (2018) 18:23. doi: 10.1186/s12886-018-0694-5
32. Luo Y, Yang W, Qi M, Wang Y, Li S, Wang M, et al. Annual direct economic burden and influencing factors of dry eye disease in Central China. Ophthalmic Epidemiol. (2021) 1–8. doi: 10.1080/09286586.2021.1959618
33. Nassiri N, Zhou XY, Torres YR, Meyer Z, Beyer MA, Mehregan CA, et al. Current and emerging therapy of dry eye disease. Part B: non-pharmacological modalities. Expert Rev Ophthalmo. (2017) 12:299–312. doi: 10.1080/17469899.2017.1344552
34. Gupta PK, Vora GK, Matossian C, Kim M, Stinnett S. Outcomes of intense pulsed light therapy for treatment of evaporative dry eye disease. Can J Ophthalmol. (2016) 51:249–53. doi: 10.1016/j.jcjo.2016.01.005
Keywords: dry eye disease, burden of disease, costs, multi-center analysis, China
Citation: Yang W, Luo Y, Wu S, Niu X, Yan Y, Qiao C, Ming W, Zhang Y, Wang H, Chen D, Qi M, Ke L, Wang Y, Li L, Li S and Zeng Q (2021) Estimated Annual Economic Burden of Dry Eye Disease Based on a Multi-Center Analysis in China: A Retrospective Study. Front. Med. 8:771352. doi: 10.3389/fmed.2021.771352
Received: 06 September 2021; Accepted: 31 October 2021;
Published: 01 December 2021.
Edited by:
Xiuming Jin, Zhejiang University, ChinaReviewed by:
Lan Gong, Eye, Ear, Nose, and Throat Hospital of Fudan University, ChinaAlessandro Meduri, University of Messina, Italy
Copyright © 2021 Yang, Luo, Wu, Niu, Yan, Qiao, Ming, Zhang, Wang, Chen, Qi, Ke, Wang, Li, Li and Zeng. This is an open-access article distributed under the terms of the Creative Commons Attribution License (CC BY). The use, distribution or reproduction in other forums is permitted, provided the original author(s) and the copyright owner(s) are credited and that the original publication in this journal is cited, in accordance with accepted academic practice. No use, distribution or reproduction is permitted which does not comply with these terms.
*Correspondence: Qingyan Zeng, emVuZ3Fpbmd5YW4xOTcyQDE2My5jb20=