
95% of researchers rate our articles as excellent or good
Learn more about the work of our research integrity team to safeguard the quality of each article we publish.
Find out more
ORIGINAL RESEARCH article
Front. Med. , 14 October 2021
Sec. Pulmonary Medicine
Volume 8 - 2021 | https://doi.org/10.3389/fmed.2021.761804
This article is part of the Research Topic Managing Chronic Obstruction Pulmonary Disease: From Translational Research to Public Health Practice View all 15 articles
 Xianxian Cao1,2†
 Xiaoyan Gao1,3†Nan Yu4Meijuan Shi5
 Xia Wei6Xiaoqi Huang7Shudi Xu6Jiantao Pu8
 Chenwang Jin1*
 Youmin Guo1
Objective: To investigate the associations between intrapulmonary vascular volume (IPVV) depicted on inspiratory and expiratory CT scans and disease severity in COPD patients, and to determine which CT parameters can be used to predict IPVV.
Methods: We retrospectively collected 89 CT examinations acquired on COPD patients from an available database. All subjects underwent both inspiratory and expiratory CT scans. We quantified the IPVV, airway wall thickness (WT), the percentage of the airway wall area (WA%), and the extent of emphysema (LAA%−950) using an available pulmonary image analysis tool. The underlying relationship between IPVV and COPD severity, which was defined as mild COPD (GOLD stage I and II) and severe COPD (GOLD stage III and IV), was analyzed using the Student's t-test (or Mann-Whitney U-test). The correlations of IPVV with pulmonary function tests (PFTs), LAA%−950, and airway parameters for the third to sixth generation bronchus were analyzed using the Pearson or Spearman's rank correlation coefficients and multiple stepwise regression.
Results: In the subgroup with only inspiratory examinations, the correlation coefficients between IPVV and PFT measures were −0.215 ~ −0.292 (p < 0.05), the correlation coefficients between IPVV and WT3−6 were 0.233 ~ 0.557 (p < 0.05), and the correlation coefficient between IPVV and LAA%−950 were 0.238 ~ 0.409 (p < 0.05). In the subgroup with only expiratory scan, the correlation coefficients between IPVV and PFT measures were −0.238 ~ −0.360 (p < 0.05), the correlation coefficients between IPVV and WT3−6 were 0.260 ~ 0.566 (p < 0.05), and the correlation coefficient between IPVV and LAA%−950 were 0.241 ~ 0.362 (p < 0.05). The multiple stepwise regression analyses demonstrated that WT were independently associated with IPVV (P < 0.05).
Conclusion: The expiratory CT scans can provide a more accurate assessment of COPD than the inspiratory CT scans, and the airway wall thickness maybe an independent predictor of pulmonary vascular alteration in patients with COPD.
Chronic obstructive pulmonary disease (COPD) is very prevalent worldwide and carries high mortality and morbidity rates (1, 2). Among COPD patients, 30–70% have clinically significant pulmonary vascular disease (3–5). The major vascular alterations are vascular remodeling and vasoconstriction caused by emphysema and/or hypoxemia, and often cause pulmonary hypertension (6, 7). There are investigations showing that pulmonary vascular alterations were found in patients with mild COPD, even in non-smokers with normal lung function (8, 9). All these suggest that pulmonary vascular alterations may persist throughout the entire progress of COPD, and it is important to develop methods to quantitatively assess the pulmonary vascular alterations in COPD.
The high-resolution characteristic of computed tomography (CT) makes it possible to visualize very detailed lung structures and quantify a variety of lung abnormalities, such as emphysema, airway remodeling, and pulmonary vascular alterations in COPD (10, 11). There have been investigative efforts made to quantitatively assess pulmonary vascular alterations in COPD. Matsuoka et al. (12) proposed the total cross-sectional area (CSA) of small pulmonary vessels as an index of pulmonary vascular alterations. They reported that %CSA <5 mm2 had a significant correlation with forced expiratory volume in 1 s (FEV1) and FEV1/forced vital capacity (FVC) as well as %LAA−950 in severe COPD. Previous studies (13–15) have demonstrated that there were quantitative pulmonary vascular features, such as the percentage of total vessel area and the number of small vessels, closely associated with survival and PFT measures in COPD patients. It is notable that most of the available investigations about pulmonary vascular alternation were limited to the inspiratory CT scans. Although there are studies (16–18) demonstrating the unique value of expiratory CT examinations in assessing COPD, it is unclear whether the expiratory CT scans have any advantage over inspiratory CT scans in assessing pulmonary vascular alternation.
In this study, we proposed to quantify the intrapulmonary vascular volume (IPVV) depicted on CT images in COPD patients. The objective is to study whether pulmonary vascular alternations in COPD subjects are associated with emphysema extent, pulmonary functions, and airway abnormalities, and to determine which parameter can be used as predictor of IPVV in COPD patients. In particular, we performed the analyses on both inspiratory and expiratory CT scans, aiming to clarify the potential of expiratory CT examinations in assessing pulmonary vascular alternations in COPD. For this purpose, we established a dataset consisting of 89 paired inspiration-expiration CT scans. A detailed description of our dataset, methods, and experimental results follows.
We retrospectively identified 92 patients from the “Digital Lung” Respiratory Disease Evaluation System and Diagnostic Criteria (201402013). These subjects were diagnosed with COPD and underwent both inspiratory and expiratory CT examinations. COPD was diagnosed on the basis of past history, physical examination, and spirometry data by following the Global Initiative for Chronic Obstructive Lung Disease (GOLD) (1) diagnostic criteria (FEV1/FVC <70% bronchodilators inhaled). Among the collected subjects, three were excluded, because of the involved issues: (1) concomitant lung diseases such as interstitial lung disease, lung cancer, infectious pneumonia, and pulmonary tuberculosis; (2) previous lung surgery; (3) insufficient CT quality of analysis; and (4) unable to complete the pulmonary function test. As a result, we have 89 subjects involved in this study and the demographics information was summarized in Table 1. All subjects were divided into subjects with mild COPD (GOLD I and II, n = 43) and subjects with severe COPD (GOLD III and IV, n=46) for comparison of IPVV. This retrospective study was approved by the Chinese Clinical Research Registry (Grant No.: ChiCTR-OCH-14004904), and written informed consent was obtained from all subjects.
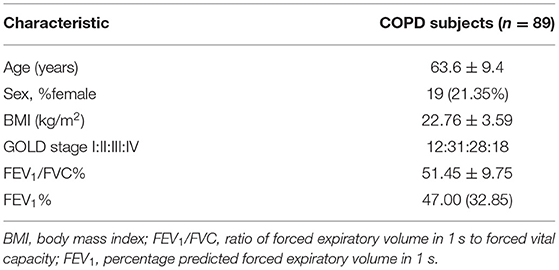
Table 1. Patient Characteristics and PFT results in the COPD subjects.
All subjects underwent spirometry according to American Thoracic Society/European Thoracic Society guidelines (19). PFT measurements included forced expiratory volume during the first second of exhalation (FEV1) percent to the predicted value (FEV1%predicted) post inhalation of 200 μg salbutamol, FEV1/forced vital capacity ratio (FEV1/FVC), the ratio of residual volume to total lung capacity(RV%TLC) and the diffusing capacity for carbon monoxide (DLCO). Referring to previous studies (20, 21), we only used the FEV1% predicted and FEV1/FVC in the subsequent analysis in this study.
The CT examinations were performed at full inspiration and expiration states for the involved subjects in the supine position using 64-slice multi-detector CT scanners (SOMATOM Definition AS; Siemens, Erlangen, Germany). All subjects were given breathing training prior to examination. The scan parameters were as follows: tube voltage: 100 or 120 KV tube current, autoexposure control, exposure time: 0.5 s, and the matrix size: 512 × 512 pixels. Images were reconstructed with a 1 mm slice thickness (with 0.625 mm overlap) using a standard kernel algorithm.
We analyzed the CT scans using the FACT-Digital Lung Workstation (Dexin, Xi'an, China), which have both US FDA 510 K and CFDA cleared. This software system enables automated segmentation of a variety of lung structures, including right/left lungs, lung vessels, airway trees, inner/outer airway walls. On the basis of the segmentations, an automatically 3D approach was used to reconstruct the pulmonary vasculature and calculate the entire volume of the intrapulmonary vascular volume (IPVV) in the whole lung or each individual lobe. In inspiratory and expiratory CT, the measures of IPVV all includes the vascular wall and lumen of both arteries and veins, which is specified in milliliter (ml). We also measured the airway wall thickness (WT), and the percentage of the airway wall area (WA%) of the 3–6th generations and the extent of emphysema in each individual lobe of both inspiratory and expiratory CT examinations. The extent of emphysema, which is defined as the percentage of lung area with CT attenuation values < -950 HU at inspiration (LAA%−950), was also automatically computed at a threshold of −950 Hounsfield Unit (HU). The difference in the values between inspiratory and expiratory scans was defined as difference value, the ratio of inspiratory scans to expiratory was defined as relative value. Detailed descriptions of these computerized schemes have been reported elsewhere (22–24), and the segmentation results were shown in Figure 1.
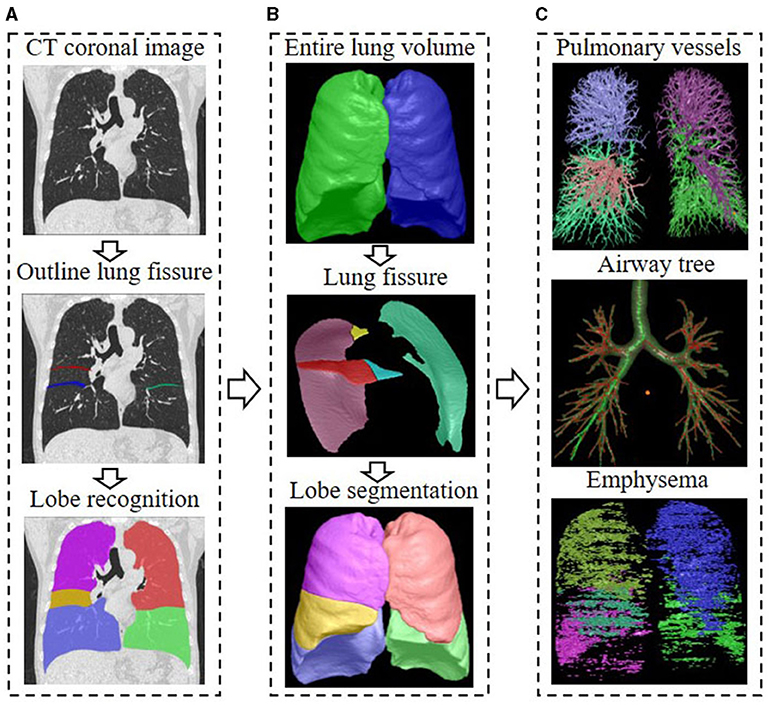
Figure 1. Flow chart of CT quantitative parameter measurement. (A) The delineation of lung fissures and the identification of lung lobes on CT images; (B) The total lung volume identified by the 3D adaptive border marching algorithm, the lung fissure segmented by the computational geometry approach, and the five lung lobes segmented by implicit surface functions; (C) The principal curvatures and the principal directions were used to distinguish pulmonary vessels from lung tissue, and the vascular tree was automatically extracted and segmented to calculate IPVV in the whole lung and each individual lobe; The differential geometric approach to segment the airway tree, and the average values of the measurements for the 3–6th bronchial generation were automatically calculated; The extent of emphysema under the threshold of −950 HU was automatically computed, the area shown in color.
We assessed the correlations of IPVV with PFT measures, WT3−6, and LAA%−950 using Pearson or Spearman's rank correlation analysis and multiple linear regression analysis with step-wise selection method for inspiratory and expiratory CT. Continuous data were tested for normality using the Shapiro-Wilk or Kolmogorov-Smirnov test according to the number of subjects. Data meeting the normal distribution were expressed as mean ± SD. Non-normally distributed data were expressed as median (interquartile range). The comparison of IPVV between mild COPD (GOLD stage I and II) and severe COPD (GOLD stage III and IV) was analyzed using the Student's t-test or Mann-Whitney U-test. Statistical analysis was performed using SPSS 20.0. A p-value < 0.05 was considered statistically significant.
The comparison of IPVV between mild and severe COPD in inspiratory and expiratory CT were summarized in Table 2 and Figures 2, 3. In the subgroup with only expiratory CT examinations, there were significant differences of IPVV between mild and severe COPD groups, except for the right upper lobe (RUL, p = 0.286) and left upper lobe (LUL, p = 0.106). In contrast, in the subgroup with only inspiratory CT examinations, only the IPVV value in the left lower lobe (LLL, p = 0.006) showed a difference regardless COPD severity. The IPVV values of the lower lobes were consistently higher than those of the upper lobes in both inspiratory and expiratory CT scans. For the difference values and relative values, the changes of IPVV in the severe COPD groups were significantly less than the mild.
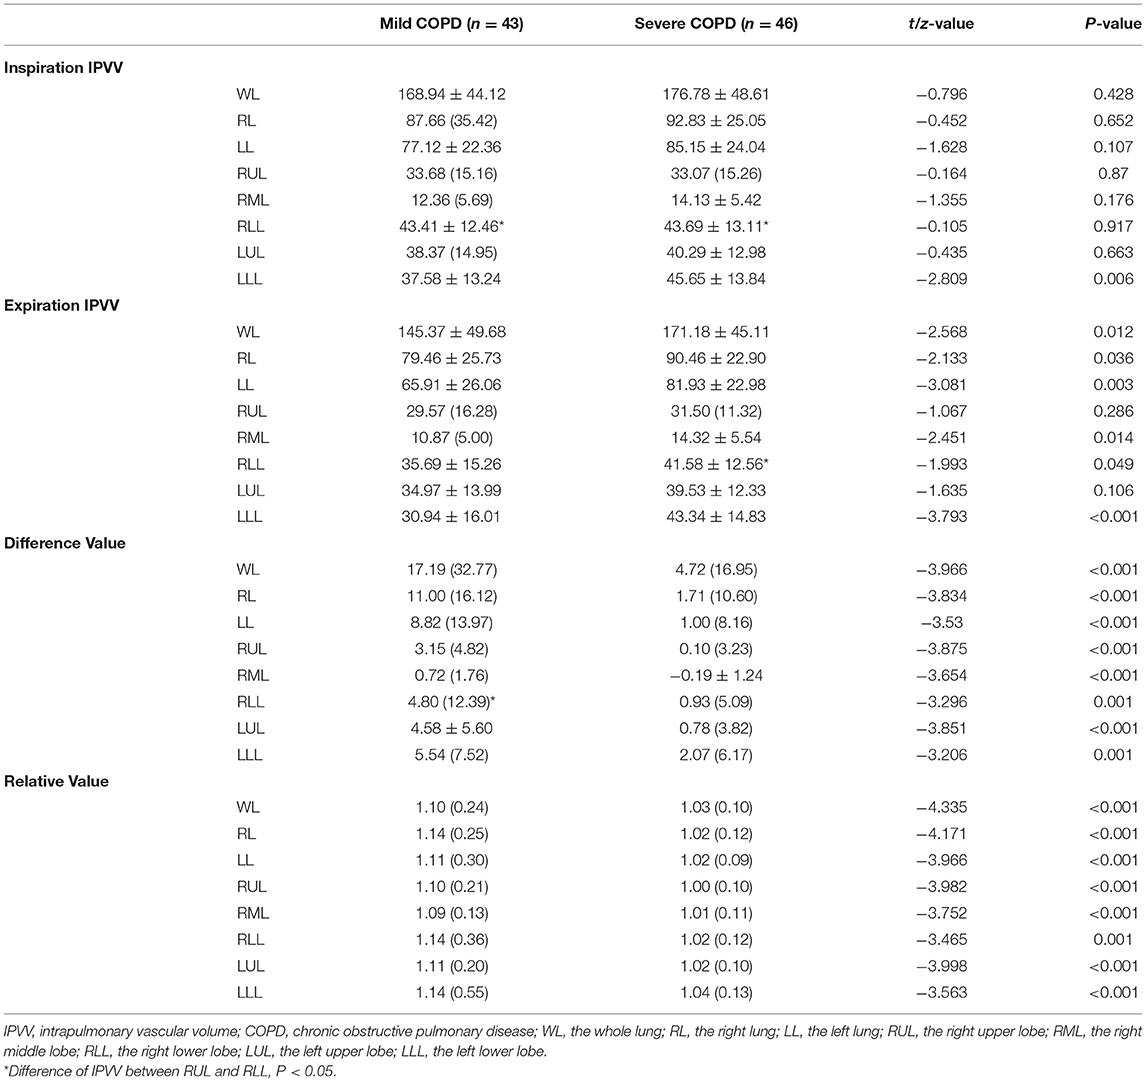
Table 2. Comparisons of IPVV between mild and severe COPD.
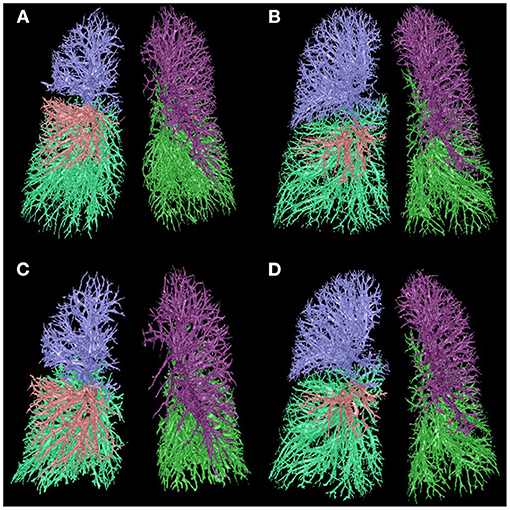
Figure 2. Comparison of IPVV between mild and severe COPD in inspiratory and expiratory CT. (A,C) A male with mild COPD (GOLD II, 68 years): a, the IPVV of the whole lung in inspiratory CT is 209.95 ml; b, the IPVV of the whole lung in expiratory CT is 169.10 ml. (B,D) A male with severe COPD (GOLD III, 64 years): a, the IPVV of the whole lung in inspiratory CT is 208.31 ml; b, the IPVV of the whole lung in expiratory CT is 201.18 ml.
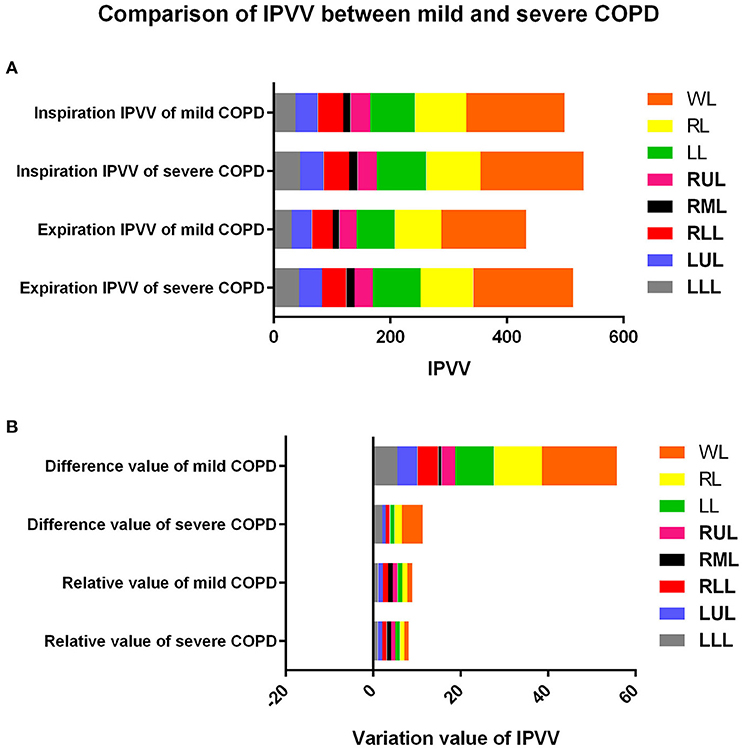
Figure 3. Comparison of IPVV between mild and severe COPD in inspiratory, expiratory CT, difference value and relative value. (A) Comparison in inspiratory and expiratory CT; (B) Comparison in difference value and relative value.
The correlations between IPVV and PFT measures were presented in Table 3. For the inspiratory CT scan, there were mild negative correlations between IPVV and FEV1/FVC in each individual lobes (r = −0.215 to −0.292, all p < 0.05), between IPVV and FEV1% in right middle lobe (RML, r = −0.246, p = 0.020) and LLL(r = −0.230, p = 0.030). LAA%−950 (r = 0.221 to 0.409, all p < 0.05) and WT3−6th (r = 0.233 to 0.557, all p < 0.05) were significantly associated with IPVV in all lobes (see Figures 4, 5 and Table 4). In particular, the strongest correlation was consistently observed for right lower lobe (RLL) and LLL. IPVV had no association WA%, except for WA%4−5th in RML (r = −0.272, −0.236, respectively, p < 0.05) and WA%6th in LUL(r = −0.219, p = 0.045).
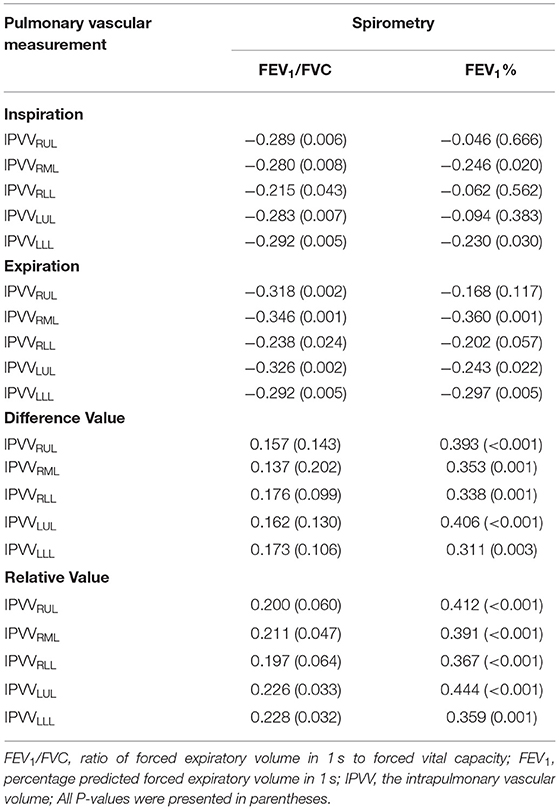
Table 3. Correlation between IPVV and PFT.
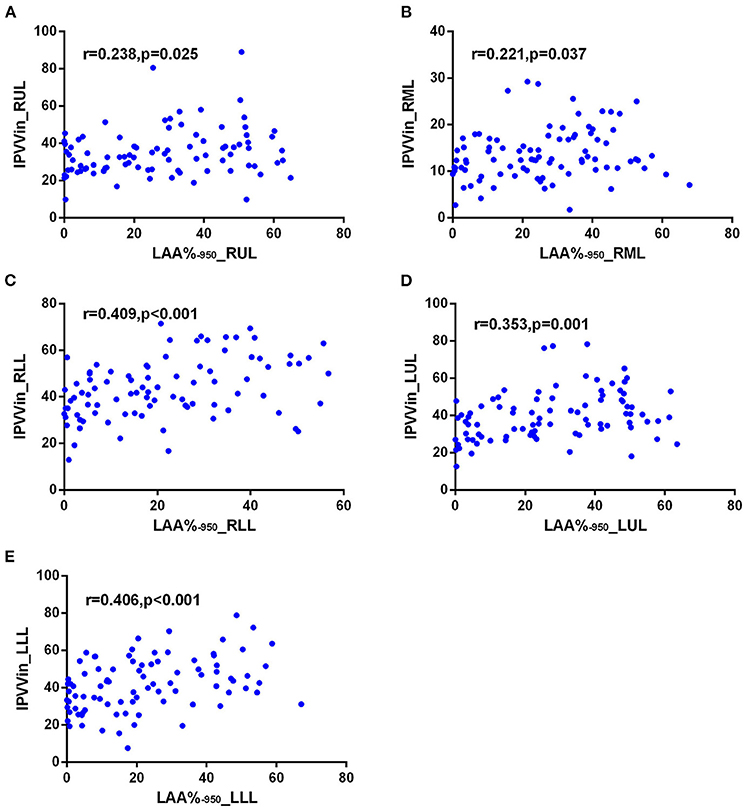
Figure 4. Correlations of IPVV in individual lobes with LAA%−950 in the inspiratory CT scan. (A) RUL; (B) RML; (C) RLL; (D) LUL; (E) LLL.
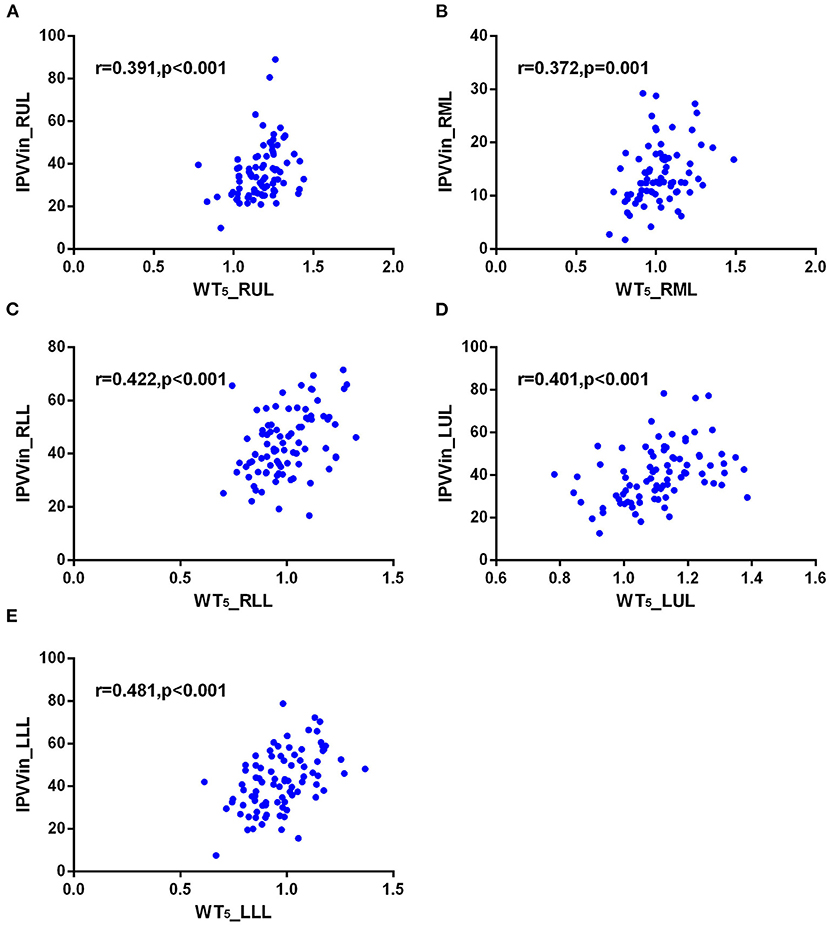
Figure 5. Correlations of IPVV in individual lobes with WT5 in the inspiratory CT scan. (A) RUL; (B) RML; (C) RLL; (D) LUL; (E) LLL.
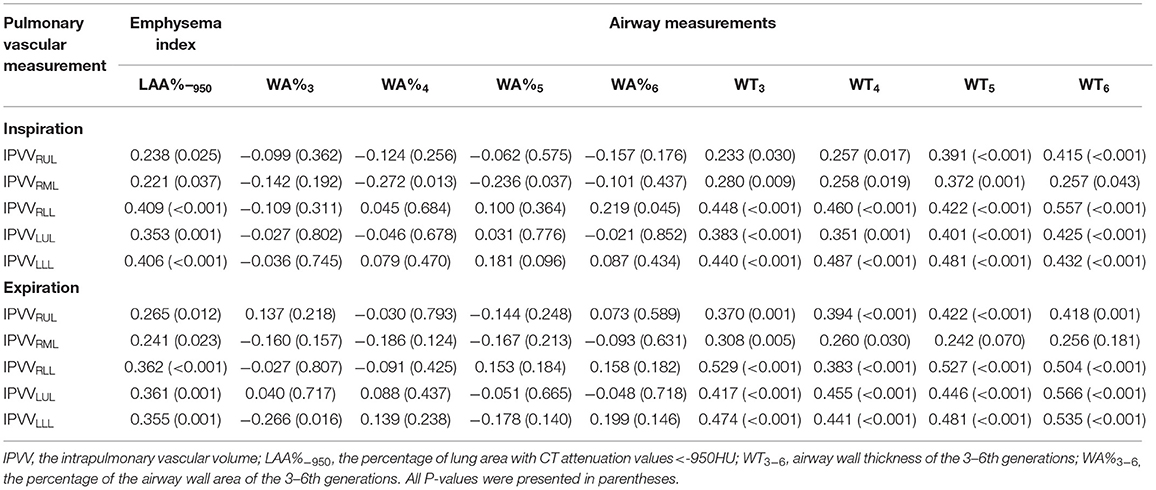
Table 4. Correlations between IPVV and other parameters.
For expiratory CT scans, FEV1/FVC (r = −0.238 to −0.346, p < 0.05) and FEV1% (r = −0.243 to −0.360, all p < 0.05) had a significant, mild-to-moderate negative correlation with IPVV, except for FEV1% in RUL and RLL. LAA%−950 and WT3−6th (except for WT5−6th in RML) positively correlated with IPVV (see Figures 6, 7 and Table 4). Similar to the inspiratory CT, IPVV had no association with WA%, except for WA%3th (r = −0.266, p = 0.016) in LLL. The correlation coefficients of the expiratory CT were slightly higher than that of the inspiratory CT.
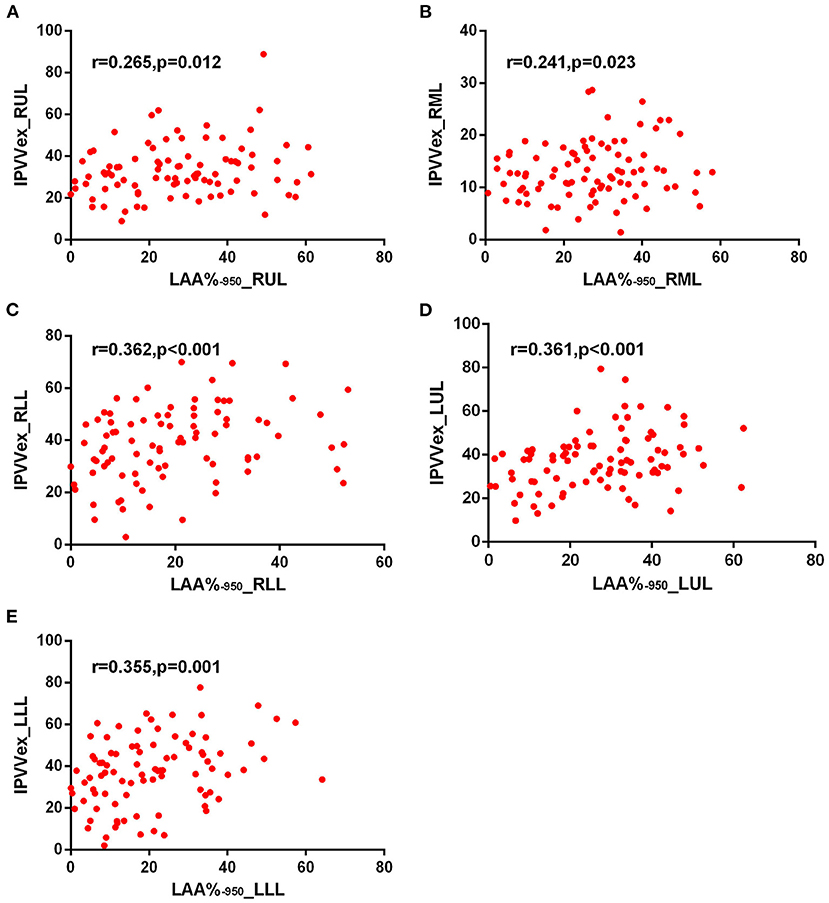
Figure 6. Correlations of IPVV in individual lobes with LAA%−950 in the expiratory CT scan. (A) RUL; (B) RML; (C) RLL; (D) LUL; (E) LLL.
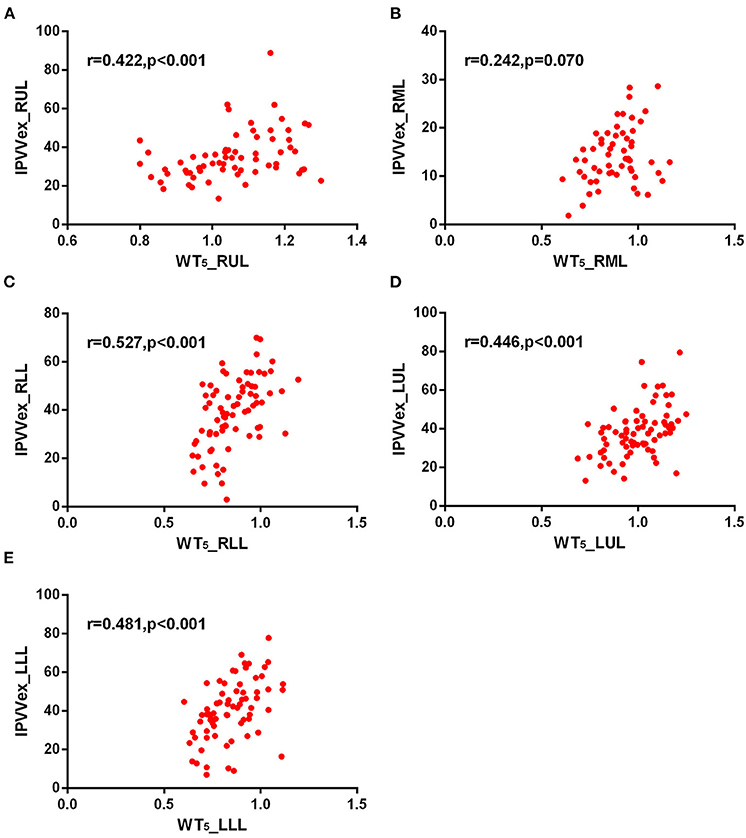
Figure 7. Correlations of IPVV in individual lobes with WT5 in the expiratory CT scan. (A) RUL; (B) RML; (C) RLL; (D) LUL; (E) LLL.
For the respiratory variation, FEV1% showed significant, moderate positive correlations with the difference value and relative value (r = 0.350–0.463, all p < 0.05), and FEV1/FVC showed mild positive correlations with the relative value (except for RUL and RLL, p > 0.05). There was no correlation between FEV1/FVC and the difference value.
Table 5 shows the results of multiple linear regression analysis, where IPVV was the dependent variable, age, BMI and other CT parameters were the independent variables. In inspiratory CT, the R2 values of each pulmonary lobe regression equation were within the range of 0.075–0.426, while the R2 was 0.165–0.559 in the expiratory, except for RML. The R2 value of each lobe in the expiratory was higher than the inspiratory. The largest R2 was observed at LLL in two respiratory phases, while the least is RML. The multiple regression analysis for IPVV revealed that WT was a significant independent predictor of IPVV at the inspiratory and expiratory CT, particularly in difference value and relative value.
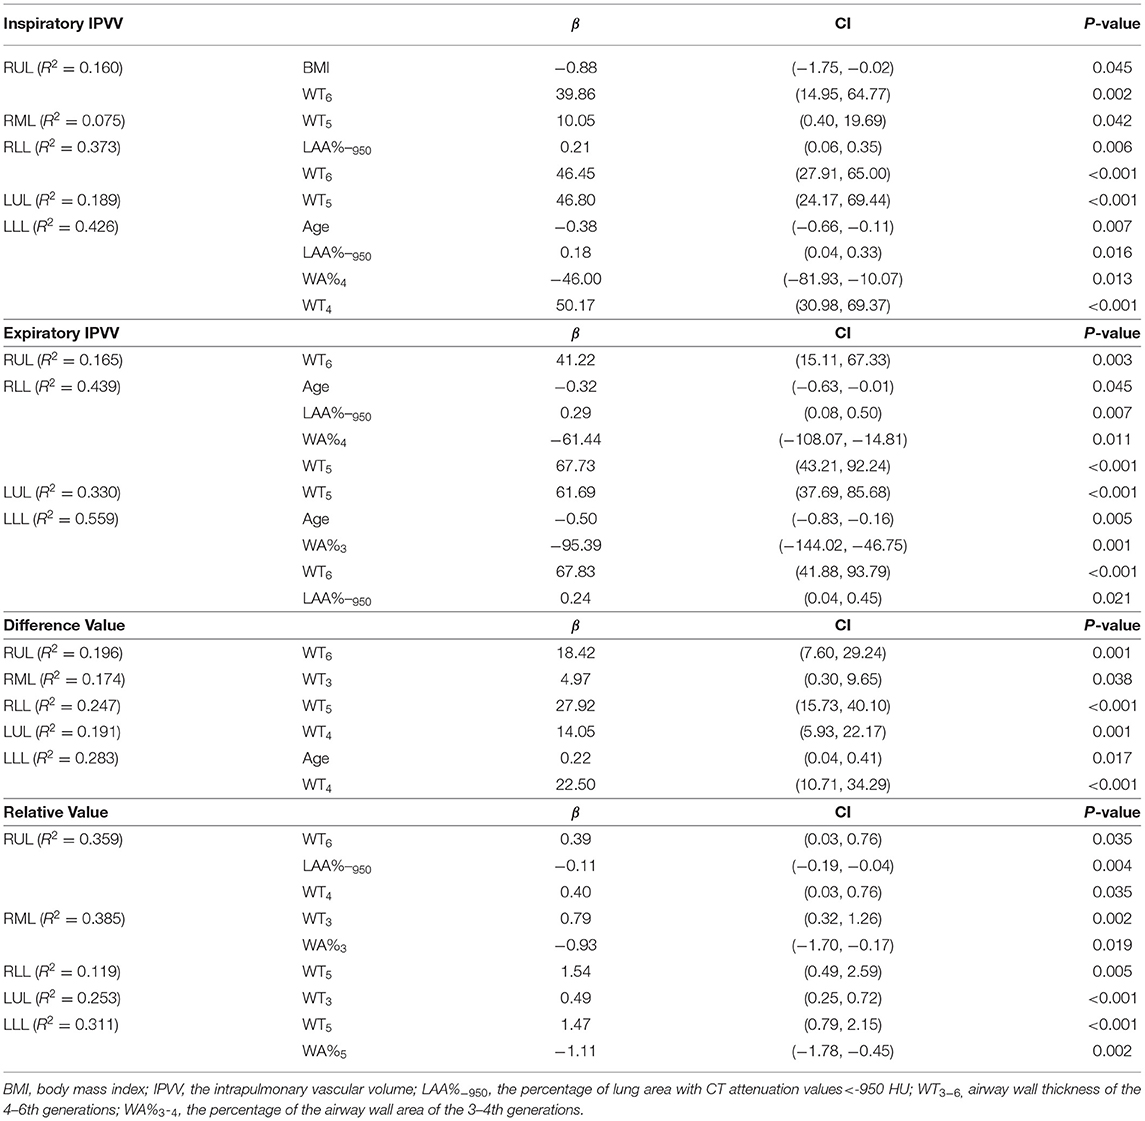
Table 5. Multiple linear regression analysis of IPVV in inspiratory CT, expiratory CT, difference value and relative value.
In this study, we quantified IPVVs depicted on both inspiratory and expiratory CT scans and investigated their associations with pulmonary functions, airway remodeling, and disease severity in COPD patients. The analyses were performed at the levels of the entire lungs and individual lobes. Our experimental results showed that the IPVV could serve as a quantitative index for pulmonary vascular alternations in COPD patients. In particular, the IPVVs quantified using expiratory CT examinations does not only provide a more reliable and accurate assessment of pulmonary vascular alternations and COPD as well as their progression than the inspiratory CT examinations, but also allows the calculation of the difference and relative value to show the dynamic changes of IPVV during respiration. Additionally, the multiple linear regression analyses showed that bronchial wall thickness had significant correlation with IPVV and suggested that WT might be an independent predictor of pulmonary vascular alteration in COPD.
Our findings are in consistent with Estepar et al.'s investigation (25), where there was no association between COPD severity and total blood vessel volume depicted on inspiratory CT scans. In contrast, in the expiratory CT examinations, the IPVV in severe COPD subgroup were significantly higher than those in the mild COPD subgroup at the levels of in the entire lung and individual lobes except for RUL and LUL. The difference value and relative value between inspiratory and expiratory CT revealed that the alteration of severe COPD was less than the mild. The results demonstrated that pulmonary vascular alternations between breaths decreased with the increase of COPD severity.
Stronger correlations were found between IPVV and PFT in the expiratory CT compared with the inspiratory CT. This finding reinforces the viewpoint about the value of expiratory CT in COPD patients proposed by previous studies (17, 26). Matsuoka et al. (27) reported that the correlation coefficients between airway luminal area measured at expiratory CT and PFT were higher than those for inspiratory CT. Gawlitza et al. (17) demonstrated that quantitative CT parameters of emphysema such as mean lung density and low attenuation volume in expiratory phase show stronger correlation with lung function testing than the inspiratory. Nevertheless, there are few studies on the expiratory CT involving pulmonary blood vessels. Our study not only verified higher correlations in expiratory CT but also found significant correlations between FEV1% and the difference, relative values. Compared with the difference value, the relative value may be the better indicator of changes in pulmonary vessels during respiration. From a pathophysiological standpoint, this may be explained by promotion of pulmonary vasoconstriction and remodeling by expiratory state in patients with airflow obstruction (6).
We in particular investigated the association between pulmonary vascular disease and airway disease. Very limited investigations (28) have been conducted in this regard. We found that the airway wall thickness correlated positively with the IPVV on both inspiratory and expiratory CT. Our finding indicated that vascular alteration in COPD was influenced by both emphysema and airway remodeling, and the multiple linear regression analyses of inspiratory, expiratory CT, the difference and relative value showed that the main parameter able to explain pulmonary vascular alteration in patients with COPD was WT, which was similar in part to the result reported by Coste et al. (29). Furthermore, the higher correlations in the expiratory CT demonstrated that the expiratory CT had potential value in quantitative pulmonary vascular disease and evaluating the severity and progress of COPD, compared with the inspiratory CT.
When evaluating the distribution of pulmonary vascular alteration in different lobes, Wrobel et al. (30) quantified the percentage wall thickness to vessel diameter and showed that there was increased pulmonary arterial remodeling in the upper lobes compared with the lower lobes in subjects with COPD. Our results were in consistent with Estepar et al.'s (25) but contradict with Wrobel et al.'s (30) in that the IPVV of the lower lobes was higher than that of the upper lobes. However, this study failed to observe significant difference in IPVV between LUL and LLL. This may be due to the influence of cardiac motion in the left lung, resulting in some errors in IPVV measurement (31) and the limitation of the small datasets. Additional efforts are needed to verify this.
We are aware that the primary limitations with this study is the relatively small dataset for the analyses. There is significant imbalance with the study population in many aspects, such as gender, disease severity, and lung functions. All these along with other potential confounding factors (e.g., image quality and acquisition protocols) could unavoidably lead to some biases in both conclusion and analyses, and this may also be the reason why the correlation coefficient of this study is small. Nevertheless, the findings in this study suggest the unique potential of expiratory CT scans in analyzing pulmonary vascular alternations and the potential association of pulmonary vascular alternations with COPD and other airway diseases.
In conclusion, the quantitative parameter IPVV demonstrated significant associations with PFT, emphysema and airway disease in patients with COPD, the expiratory CT and the relative values showed potential values in quantifying pulmonary vascular alterations and evaluating the severity of COPD. Additionally, the airway wall thickness may be the independent predictor of pulmonary vascular alteration in COPD. Further work is required to clarify and validate the exact value of expiratory CT in quantitative pulmonary vessels in COPD with advanced quantitative technique.
The original contributions presented in the study are included in the article/supplementary material, further inquiries can be directed to the corresponding author/s.
The studies involving human participants were reviewed and approved by the Chinese Clinical Research Registry (Grant No.: ChiCTR-OCH-14004904) and written informed consent was obtained from all subjects. The patients/participants provided their written informed consent to participate in this study.
XC, CJ, and YG conceived of the idea. XC conducted statistical analyses. XG, NY, XW, and XH collected the data. XC and XG wrote the manuscript with inputs from all authors. All authors contributed to the article and approved the submitted version.
This work was supported by the National Institutes of Health from National Health and Family Planning Commission of China (No. 201402013).
The authors declare that the research was conducted in the absence of any commercial or financial relationships that could be construed as a potential conflict of interest.
All claims expressed in this article are solely those of the authors and do not necessarily represent those of their affiliated organizations, or those of the publisher, the editors and the reviewers. Any product that may be evaluated in this article, or claim that may be made by its manufacturer, is not guaranteed or endorsed by the publisher.
1. Vogelmeier CF, Criner GJ, Martinez FJ, Anzueto A, Barnes PJ, Bourbeau J, et al. Global strategy for the diagnosis, management, and prevention of chronic obstructive lung disease 2017 report: GOLD executive summary. Eur Respir J. (2017) 49:1700214. doi: 10.1183/13993003.00214-2017
2. Wang C, Xu J, Yang L, Xu Y, Zhang X, Bai C, et al. Prevalence and risk factors of chronic obstructive pulmonary disease in China (the China Pulmonary Health [CPH] study): a national cross-sectional study. Lancet. (2018) 391:1706–17. doi: 10.1016/S0140-6736(18)30841-9
3. Chatila WM, Thomashow BM, Minai OA, Criner GJ, Make BJ. Comorbidities in chronic obstructive pulmonary disease. Proc Am Thorac Soc. (2008) 5:549–55. doi: 10.1513/pats.200709-148ET
4. Chaouat A, Naeije R, Weitzenblum E. Pulmonary hypertension in COPD. Eur Respir J. (2008) 32:1371–85. doi: 10.1183/09031936.00015608
5. Rahaghi FN, Wells JM, Come CE, De La Bruere IA, Bhatt SP, Ross JC, et al. Arterial and venous pulmonary vascular morphology and their relationship to findings in cardiac magnetic resonance imaging in smokers. J Comput Assist Tomogr. (2016) 40:948–52. doi: 10.1097/RCT.0000000000000465
6. Rahaghi FN, van Beek EJ, Washko GR. Cardiopulmonary coupling in chronic obstructive pulmonary disease: the role of imaging. J Thorac Imaging. (2014) 29:80–91. doi: 10.1097/RTI.0000000000000076
7. Minai OA, Chaouat A, Adnot S. Pulmonary hypertension in COPD: epidemiology, significance, and management: pulmonary vascular disease: the global perspective. Chest. (2010) 137:39S−51S. doi: 10.1378/chest.10-0087
8. Matsuura Y, Kawata N, Yanagawa N, Sugiura T, Sakurai Y, Sato M, et al. Quantitative assessment of cross-sectional area of small pulmonary vessels in patients with COPD using inspiratory and expiratory MDCT. Eur J Radiol. (2013) 82:1804–10. doi: 10.1016/j.ejrad.2013.05.022
9. Uejima I, Matsuoka S, Yamashiro T, Yagihashi K, Kurihara Y, Nakajima Y. Quantitative computed tomographic measurement of a cross-sectional area of a small pulmonary vessel in nonsmokers without airflow limitation. Jpn J Radiol. (2011) 29:251–5. doi: 10.1007/s11604-010-0551-9
10. Washko GR, Coxson HO, O'Donnell DE, Aaron SD. CT imaging of chronic obstructive pulmonary disease: insights, disappointments, and promise. Lancet Respir Med. (2017) 5:903–8. doi: 10.1016/S2213-2600(17)30345-4
11. Schroeder JD, McKenzie AS, Zach JA, Wilson CG, Curran-Everett D, Stinson DS, et al. Relationships between airflow obstruction and quantitative CT measurements of emphysema, air trapping, and airways in subjects with and without chronic obstructive pulmonary disease. Am J Roentgenol. (2013) 201:W460–70. doi: 10.2214/AJR.12.10102
12. Matsuoka S, Washko GR, Dransfield MT, Yamashiro T, San Jose Estepar R, Diaz A, et al. Quantitative CT measurement of cross-sectional area of small pulmonary vessel in COPD: correlations with emphysema and airflow limitation. Acad Radiol. (2010) 17:93–9. doi: 10.1016/j.acra.2009.07.022
13. Cho YH, Lee SM, Seo JB, Kim N, Bae JP, Lee JS, et al. Quantitative assessment of pulmonary vascular alterations in chronic obstructive lung disease: associations with pulmonary function test and survival in the KOLD cohort. Eur J Radiol. (2018) 108:276–82. doi: 10.1016/j.ejrad.2018.09.013
14. Wang Z, Chen X, Liu K, Xie W, Wang H, Wei Y, et al. Small pulmonary vascular alteration and acute exacerbations of COPD: quantitative computed tomography analysis. Int J Chron Obstruct Pulmon Dis. (2016) 11:1965–71. doi: 10.2147/COPD.S112651
15. Yu N, Wei X, Li Y, Deng L, Jin CW, Guo Y. Computed tomography quantification of pulmonary vessels in chronic obstructive pulmonary disease as identified by 3D automated approach. Medicine. (2016) 95:e5095. doi: 10.1097/MD.0000000000005095
16. Akira M, Toyokawa K, Inoue Y, Arai T. Quantitative CT in chronic obstructive pulmonary disease: inspiratory and expiratory assessment. Am J Roentgenol. (2009) 192:267–72. doi: 10.2214/AJR.07.3953
17. Gawlitza J, Trinkmann F, Scheffel H, Fischer A, Nance JW, Henzler C. Time to exhale: additional value of expiratory chest CT in chronic obstructive pulmonary disease. Can Respir J. (2018) 2018:9493504. doi: 10.1155/2018/9493504
18. Gawlitza J, Haubenreisser H, Henzler T, Akin I, Schonberg S, Borggrefe M, et al. Finding the right spot: where to measure airway parameters in patients with COPD. Eur J Radiol. (2018) 104:87–93. doi: 10.1016/j.ejrad.2018.05.003
19. Miller MR, Hankinson J, Brusasco V, Burgos F, Casaburi R, Coates A, et al. Standardisation of spirometry. Eur Respir J. (2005) 26:319–38. doi: 10.1183/09031936.05.00034805
20. Yahaba M, Kawata N, Iesato K, Matsuura Y, Sugiura T, Kasai H, et al. The effects of emphysema on airway disease: correlations between multi-detector CT and pulmonary function tests in smokers. Eur J Radiol. (2014) 83:1022–8. doi: 10.1016/j.ejrad.2014.03.003
21. Onoe R, Yamashiro T, Handa H, Azagami S, Matsuoka S, Inoue T, et al. 3D-measurement of tracheobronchial angles on inspiratory and expiratory chest CT in COPD: respiratory changes and correlation with airflow limitation. Int J Chron Obstruct Pulmon Dis. (2018) 13:2399–407. doi: 10.2147/COPD.S165824
22. Pu J, Roos J, Yi CA, Napel S, Rubin GD, Paik DS. Adaptive border marching algorithm: automatic lung segmentation on chest CT images. Comput Med Imaging Graph. (2008) 32:452–62. doi: 10.1016/j.compmedimag.2008.04.005
23. Pu J, Leader JK, Zheng B, Knollmann F, Fuhrman C, Sciurba FC, et al. A computational geometry approach to automated pulmonary fissure segmentation in CT examinations. IEEE Trans Med Imaging. (2009) 28:710–9. doi: 10.1109/TMI.2008.2010441
24. Pu J, Zheng B, Leader JK, Fuhrman C, Knollmann F, Klym A, et al. Pulmonary lobe segmentation in CT examinations using implicit surface fitting. IEEE Trans Med Imaging. (2009) 28:1986–96. doi: 10.1109/TMI.2009.2027117
25. Estepar RS, Kinney GL, Black-Shinn JL, Bowler RP, Kindlmann GL, Ross JC, et al. Computed tomographic measures of pulmonary vascular morphology in smokers and their clinical implications. Am J Respir Crit Care Med. (2013) 188:231–9. doi: 10.1164/rccm.201301-0162OC
26. Lynch DA, Austin JH, Hogg JC, Grenier PA, Kauczor HU, Bankier AA, et al. CT-definable subtypes of chronic obstructive pulmonary disease: a statement of the Fleischner Society. Radiology. (2015) 277:192–205. doi: 10.1148/radiol.2015141579
27. Matsuoka S, Kurihara Y, Yagihashi K, Hoshino M, Nakajima Y. Airway dimensions at inspiratory and expiratory multisection CT in chronic obstructive pulmonary disease: correlation with airflow limitation. Radiology. (2008) 248:1042–9. doi: 10.1148/radiol.2491071650
28. Dournes G, Laurent F, Coste F, Dromer C, Blanchard E, Picard F, et al. Computed tomographic measurement of airway remodeling and emphysema in advanced chronic obstructive pulmonary disease. Correlation with pulmonary hypertension. Am J Respir Crit Care Med. (2015) 191:63–70. doi: 10.1164/rccm.201408-1423OC
29. Coste F, Dournes G, Dromer C, Blanchard E, Freund-Michel V, Girodet PO, et al. CT evaluation of small pulmonary vessels area in patients with COPD with severe pulmonary hypertension. Thorax. (2016) 71:830–7. doi: 10.1136/thoraxjnl-2015-207696
30. Wrobel JP, McLean CA, Thompson BR, Stuart-Andrews CR, Paul E, Snell GI, et al. Pulmonary arterial remodeling in chronic obstructive pulmonary disease is lobe dependent. Pulm Circ. (2013) 3:665–74. doi: 10.1086/674339
Keywords: chronic obstructive pulmonary disease (COPD), computed tomography, intrapulmonary vessels, inspiratory, expiratory
Citation: Cao X, Gao X, Yu N, Shi M, Wei X, Huang X, Xu S, Pu J, Jin C and Guo Y (2021) Potential Value of Expiratory CT in Quantitative Assessment of Pulmonary Vessels in COPD. Front. Med. 8:761804. doi: 10.3389/fmed.2021.761804
Received: 20 August 2021; Accepted: 16 September 2021;
Published: 14 October 2021.
Edited by:
Hsiao-Chi Chuang, Taipei Medical University, TaiwanReviewed by:
Shin Matsuoka, St. Marianna University School of Medicine, JapanCopyright © 2021 Cao, Gao, Yu, Shi, Wei, Huang, Xu, Pu, Jin and Guo. This is an open-access article distributed under the terms of the Creative Commons Attribution License (CC BY). The use, distribution or reproduction in other forums is permitted, provided the original author(s) and the copyright owner(s) are credited and that the original publication in this journal is cited, in accordance with accepted academic practice. No use, distribution or reproduction is permitted which does not comply with these terms.
*Correspondence: Chenwang Jin, amN3NzZAMTYzLmNvbQ==
†These authors have contributed equally to this work
Disclaimer: All claims expressed in this article are solely those of the authors and do not necessarily represent those of their affiliated organizations, or those of the publisher, the editors and the reviewers. Any product that may be evaluated in this article or claim that may be made by its manufacturer is not guaranteed or endorsed by the publisher.
Research integrity at Frontiers
Learn more about the work of our research integrity team to safeguard the quality of each article we publish.