
94% of researchers rate our articles as excellent or good
Learn more about the work of our research integrity team to safeguard the quality of each article we publish.
Find out more
ORIGINAL RESEARCH article
Front. Med. , 11 November 2021
Sec. Pulmonary Medicine
Volume 8 - 2021 | https://doi.org/10.3389/fmed.2021.755855
This article is part of the Research Topic The Heterogeneity in COPD Phenotypes View all 7 articles
 Di He1,2†Yilan Sun3†
 Musong Gao2†Qiong Wu1,2Zongxue Cheng1,2Jun Li1,2
 Yong Zhou1Kejing Ying1*
 Yimin Zhu1,2*
Background: Preserved ratio impaired spirometry (PRISm), characterized by the decreased forced expiratory volume in 1 s (FEV1) and forced vital capacity (FVC) with a preserved FEV1/FVC ratio, is highly prevalent and heterogeneous. We aimed to identify the subtypes of PRISm and examine their differences in clinical characteristics, long-term mortality risks, and longitudinal transition trajectories.
Methods: A total of 6,616 eligible subjects were included from the English longitudinal study of aging. Two subtypes of the PRISm were identified as mild PRISm (either of FEV1 and FVC <80% predicted value, FEV1/FVC ≥0.7) and severe PRISm (both FEV1 and FVC <80% predicted values, FEV1/FVC ≥0.7). Normal spirometry was defined as both FEV1 and FVC ≥80% predicted values and FEV1/FVC ≥0.7. Hazard ratios (HRs) and 95% CIs were calculated by the multiple Cox regression models. Longitudinal transition trajectories were described with repeated spirometry data.
Results: At baseline, severe PRISm had increased respiratory symptoms, including higher percentages of phlegm, wheezing, dyspnea, chronic bronchitis, and emphysema than mild PRISm. After an average of 7.7 years of follow-up, severe PRISm significantly increased the risks of all-cause mortality (HR=1.91, 95%CI = 1.58–2.31), respiratory mortality (HR = 6.02, 95%CI = 2.83–12.84), and CVD mortality (HR = 2.11, 95%CI = 1.42–3.13) compared with the normal spirometry, but no significantly increased risks were found for mild PRISm. In the two longitudinal transitions, mild PRISm tended to transition toward normal spirometry (40.2 and 54.7%), but severe PRISm tended to maintain the status (42.4 and 30.4%) or transition toward Global Initiative for Chronic Obstructive Lung Disease (GOLD)2–4 (28.3 and 33.9%).
Conclusion: Two subtypes of PRISm were identified. Severe PRISm had increased respiratory symptoms, higher mortality risks, and a higher probability of progressing to GOLD2–4 than mild PRISm. These findings provided new evidence for the stratified management of PRISm.
Preserved ratio impaired spirometry (PRISm) is characterized by the proportional reductions in the forced expiratory volume in 1 s (FEV1) and forced vital capacity (FVC) resulting in a normal FEV1/FVC ratio, alternately referred to as the restrictive spirometry pattern (1, 2), Global Initiative for Chronic Obstructive Lung Disease (GOLD)-unclassified (3), or nonspecific pattern (4). It is estimated that the prevalence rates of PRISm in adults range from 3.0 to 20.0% worldwide (1–10). Accumulating evidence had shown that PRISm was associated with increased respiratory symptoms (11, 12), functional limitations (13), cardiovascular comorbidity (14, 15), and increased risks of mortality (1, 2, 5). Furthermore, longitudinal transition studies suggested that PRISm was a fluctuating state between normal spirometry and chronic obstructive pulmonary disease (COPD) (5, 16). Therefore, PRISm is becoming an important lung function phenotype in clinical and public health practices.
Despite the increasing concern about PRISm, the disease courses and pathological mechanisms of PRISm are not well understood. Previous studies indicated that PRISm was a heterogeneous phenotype and had no uniform definition (5, 6, 16–18). PRISm was defined as FEV1 <80% predicted value with FEV1/FVC ≥0.7 (5, 6) or FVC <80% predicted value with FEV1/FVC ≥0.7 (1, 15). These two definitions only consider the reduction in single lung function indicator (FEV1 or FVC). However, both FEV1 and FVC are associated with the risks of adverse health outcomes (19, 20). Therefore, it is reasonable to use both FEV1 and FVC to define the lung function reduction in PRISm. Furthermore, there are different degrees of reductions in FEV1 and FVC among the PRISm subjects. Some PRISm subjects have a single reduction in FEV1 or FVC, whereas others have both reductions in FEV1 and FVC. The single reduction and both reductions might have different biological effects, and represent different subtypes of PRISm. Based on the above hypothesis, we, therefore, defined two subtypes of PRISm as mild PRISm (single reduction in FEV1 or FVC) and severe PRISm (both reductions in FEV1 and FVC).
Using the data of the English Longitudinal Study of Aging (ELSA) cohort, we aimed to identify the two subtypes of PRISm, and examine their differences in clinical characteristics, long-term mortality risks, and longitudinal transition trajectories.
The English Longitudinal Study of Aging is an ongoing and prospective cohort study conducted in the UK. Detailed study designs, methods, and procedures have been described previously (21, 22). Briefly, a representative sample of the community-dwellers aged ≥50 years was recruited in 2002–2003 (Wave 1). Participants were investigated biennially using the self-completion questionnaires and computer-assisted personal interviews. Additional nurse visits were conducted every 4 years for the assessments of anthropometric and biochemical indicators. The baseline of this study was Wave 2 (2004–2005), which included the first nurse visit data combined with the questionnaire data. The ELSA study was approved by the London Multi-Center Research Ethics Committee and informed consent was obtained from each participant.
Figure 1 describes the selection procedure of the subjects for the present study. Among the 7,666 subjects who completed the first nurse visit, we first excluded 663 subjects who were ineligible for the lung function tests or had invalid measurement values. Then, 387 subjects were further excluded without the exact information on age, sex, height, or ethnicity. Finally, 6,616 subjects were included at baseline for the description of clinical characteristics and survival analysis. In addition, for the analysis of the longitudinal transition from Wave 2 to Wave 4, 2,568 ineligible subjects were excluded, the remaining 4,048 subjects were included in the analysis. Similarly, we excluded 1,245 ineligible subjects, the remaining 2,803 subjects were included for the analysis of the longitudinal transition from Wave 4 to Wave 6.
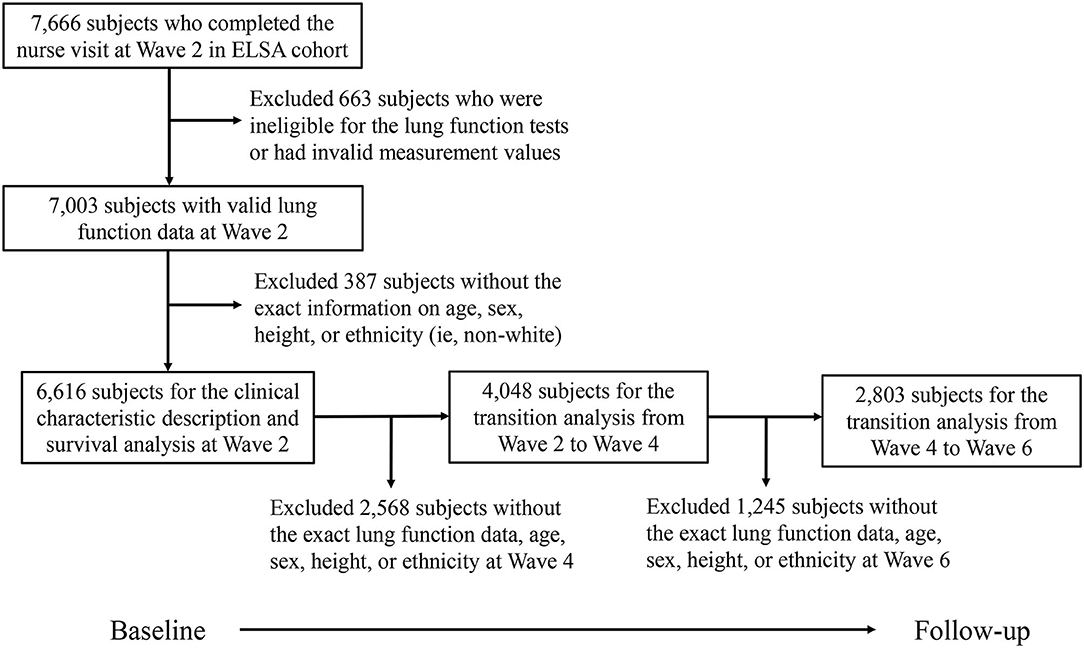
Figure 1. Flowchart of the study population selection procedure. ELSA, English longitudinal study of aging.
Prebronchodilator spirometry was carried out using a spirometer following standard procedures based on the American Thoracic Society guideline (23). The values of FEV1, FVC, and peak flow (PF) were measured. Before the formal test, each subject was asked to take off any tight clothing and was told that they must try to blow the air as hard as possible. Then, the trained nurse demonstrated the correct operation of spirometry, and each subject was instructed to make some practices. In the formal test, three satisfactory measurements were recorded for each subject. The unsatisfactory measurement was defined as follows: an unsatisfactory start with excessive hesitation; coughing or laughing, especially in the first second; leakage of the air around the mouthpiece; obstruction of the mouthpiece by teeth or tongue; and obstruction of the flow head outlet by hands. The most satisfactory values of FEV1, FVC, and PF were used in the final analyses. The most satisfactory values were defined as the maximal FEV1, FVC, and PF from the three measurements, no matter which measurement generated the values. Predicted values of FEV1, FVC, and the lower limit of normal (LLN) were calculated using the Global Lung Function Initiative 2012 equations according to age, sex, height, and ethnicity (24).
Preserved ratio impaired spirometry was divided into two subtypes as mild PRISm and severe PRISm. The other lung function categories included normal spirometry, GOLD1, and GOLD2–4. Normal spirometry was defined as both FEV1 and FVC ≥80% predicted values and FEV1/FVC ≥0.7. Mild PRISm was defined as either of FEV1 and FVC <80% predicted value and FEV1/FVC ≥0.7, while severe PRISm was defined as both FEV1 and FVC <80% predicted values and FEV1/FVC ≥0.7. GOLD1 and GOLD2–4 were defined based on the modified GOLD criteria: GOLD1 (FEV1 ≥80% predicted value and FEV1/FVC <0.7); GOLD2–4 (FEV1 <80% predicted value and FEV1/FVC <0.7) (25). In addition, the five-lung function categories were also defined based on the LLN criteria. In the LLN criteria, normal spirometry was defined as all of FEV1, FVC, and FEV1/FVC ≥LLN; mild PRISm was defined as either of FEV1 and FVC < LLN and FEV1/FVC ≥LLN; severe PRISm was defined as both of FEV1 and FVC < LLN and FEV1/FVC ≥LLN; GOLD1 was defined as FEV1 ≥LLN and FEV1/FVC < LLN; and GOLD2-4 was defined as FEV1 < LLN and FEV1/FVC < LLN.
The covariates in this study included demographic and clinical variables. For demographic variables, education was divided into two levels as less than college and college or above. Marital status was classified as married or partnered and others. Smoking status was divided into three categories, namely, never smokers, former smokers, and current smokers. Former smokers and current smokers were classified as ever smokers. Drinking status was evaluated by the frequency of drinking per week, and was classified as less than one time, one to four times, and greater than or equal to five times. Physical activity level was categorized into three groups, namely, vigorous (vigorous activity greater than one time per week), moderate (moderate activity greater than one time per week), and inactive (the rest). Body mass index (BMI) was defined as the weight (kg) divided by the square of height (m2). For clinical variables, the symptoms of wheezing and phlegm were determined by the questions of “whether had attacks of wheezing or whistling in your chest during the last 12 months” and “whether usually brought up phlegm from your chest in the morning, during the day or at night in winter,” respectively. The modified Medical Research Council (mMRC) dyspnea scale was used to assess the severity of breathlessness and dyspnea was defined as the mMRC Grade ≥2 (26, 27). The presences of chronic bronchitis or emphysema, cardio-cerebrovascular disease (CVD), and cancer were based on the self-reported physician diagnosis. Mortality data were obtained from the end of life interviews, which were available up to Wave 6 (2012, 2013). The end of life interviews was applicable to the 6,616 subjects included at baseline. The main cause of death was classified as cancer, respiratory disease, CVD, or other cause.
Multiple imputations were used to deal with the missing data of the covariates. The method of the imputation was chained equations according to the original nature of the imputed variable (continuous or categorical). In the present study, we created 10 imputed datasets with 6,616 included subjects. All of the statistical analyses were conducted separately in each of the 10 datasets, and the results were pooled using the R package MICE.
Continuous variables with normal distribution were expressed as mean (SD), while continuous variables with skewed distribution were expressed as median [interquartile range (IQR)]. Categorical variables were expressed as numbers (percentages). Comparisons among the five lung function categories were conducted using the one-way ANOVA or Kruskal–Wallis rank sum tests for continuous variables, and chi-square tests for categorical variables.
To investigate the long-term mortality risks of different lung function categories, multiple Cox regression models were used to calculate the hazard ratios (HRs) and 95% CIs using the normal spirometry or severe PRISm as the reference. The proportional hazard assumption was confirmed using the Schoenfeld residual. The adjusted covariates included age, sex, marital status, education level, BMI, baseline CVD and cancer, smoking status, drinking status, and physical activity level. For the analyses of respiratory mortality and CVD mortality, we additionally excluded 195 subjects due to the missing data on the cause of death. Furthermore, we described the longitudinal transition trajectories of different lung function categories from Wave 2 to Wave 4 and Wave 4 to Wave 6. The number (percentage) of subjects and the median (IQR) of annual changes of FEV1 and FVC were calculated for each transition trajectory.
Several sensitivity analyses were performed. We repeated the analyses using the LLN criteria to define the lung function categories. Furthermore, we conducted the survival analyses after excluding subjects with asthma at baseline or stratified by sex and smoking status, respectively.
All the analyses were carried out using R software (Version 4.0.2). All the P-values were two-sided. The statistical significance was defined as the P <0.05. The borderline significance was defined as the P > 0.05, but <0.10 (0.05 ≤ P <0.10).
Among the 6,616 eligible subjects at baseline, the mean age was 65.8 years and 3,609 (54.5%) were women. The prevalence rates of mild PRISm and severe PRISm were 7.5 and 12.9%, respectively. Table 1 presents the baseline characteristics of subjects by the different lung function categories. Subjects with GOLD2–4 were the oldest (68.4 ± 9.2 years), had the lowest education level (26.2% of college or above), the lowest percentage of the married or partnered (63.1%), and the highest percentage of current smoking (27.6%), then followed by those with severe PRISm and mild PRISm. Both mild PRISm and severe PRISm groups had higher means of BMI (29.1 ± 5.1 and 28.9 ± 5.4 kg/m2) than other lung function categories, and the highest percentage of inactive physical activity (31.8%) was observed in the severe PRISm group. In addition, GOLD2–4 and severe PRISm seemed to have more serious clinical characteristics than normal spirometry, mild PRISm, and GOLD1. Subjects with GOLD2–4 had the lowest means of FEV1(1.42 ± 0.61 L), PF (273.4 ± 127.5 L), the highest percentages of phlegm (35.4%), wheezing (33.8%), dyspnea (26.3%), and chronic bronchitis or emphysema (15.0%). Subjects with severe PRISm had the lowest mean of FVC (2.14 ± 0.68 L), the highest median of CRP (3.1, IQR: 1.5–6.1 mg/L), and the highest percentages of CVD (29.2%) and cancer (8.6%).
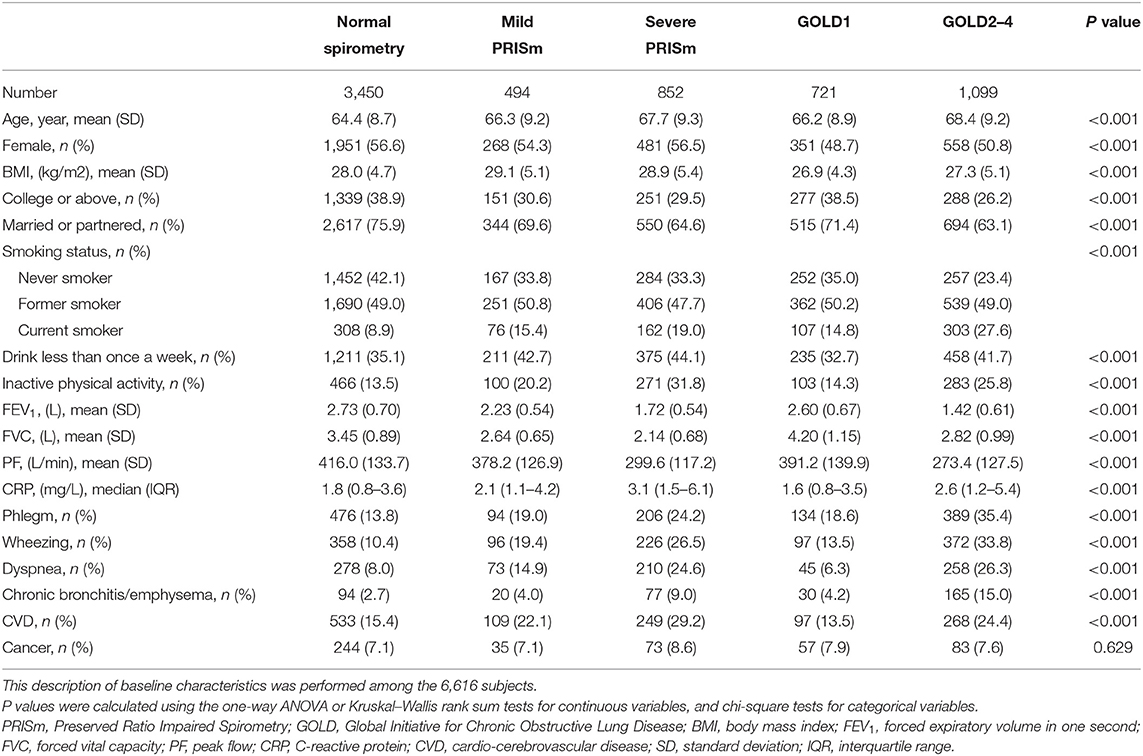
Table 1. Baseline characteristics among subjects by the lung function categories.
After an average of 7.7 years of follow-up among the 6,616 subjects, 874 subjects died including 203 CVD deaths, 83 respiratory deaths, 273 cancer deaths, 120 other causes of deaths, and 195 with missing data on the cause of deaths. Table 2 shows the incidence rates and risks of all-cause mortality, respiratory mortality, and CVD mortality by the different lung function categories. Subjects with GOLD2–4 had the highest incidence rates of 37.78/1,000 person years for all-cause mortality, 6.32/1,000 for respiratory mortality, and 9.78/1,000 for CVD mortality, then followed by those with severe PRISm, and the normal spirometry group had the lowest incidence rates of these outcomes. After adjusting for the confounding factors, compared with the normal spirometry group, subjects with severe PRISm significantly increased the risks of all-cause mortality (HR = 1.91, 95%CI = 1.58–2.31), respiratory mortality (HR = 6.02, 95%CI = 2.83–12.84), and CVD mortality (HR = 2.11, 95%CI = 1.42–3.13), while these increased risks were not significant for mild PRISm. Significantly increased risks of all-cause mortality (HR = 1.85, 95%CI = 1.55–2.20), respiratory mortality (HR = 6.61, 95%CI = 3.25–13.43), and CVD mortality (HR = 2.08, 95%CI = 1.45–3.00) were also observed among subjects with GOLD2–4, whereas subjects with GOLD1 only had significantly increased risk for all-cause mortality (HR = 1.45, 95%CI = 1.15–1.83). When compared with the severe PRISm group, mild PRISm group had significantly decreased risks of all-cause mortality (HR = 0.55, 95%CI=0.41–0.74), respiratory mortality (HR = 0.26, 95%CI = 0.08–0.87), and a borderline significantly decreased risk of CVD mortality (HR = 0.59, 95%CI = 0.33–1.07). However, there was no significant difference between severe PRISm and GOLD2–4 for the risks of all-cause mortality (HR = 0.97, 95%CI = 0.80–1.17), respiratory mortality (HR = 1.10, 95%CI = 0.66–1.83), and CVD mortality (HR = 0.99, 95%CI = 0.68–1.44).
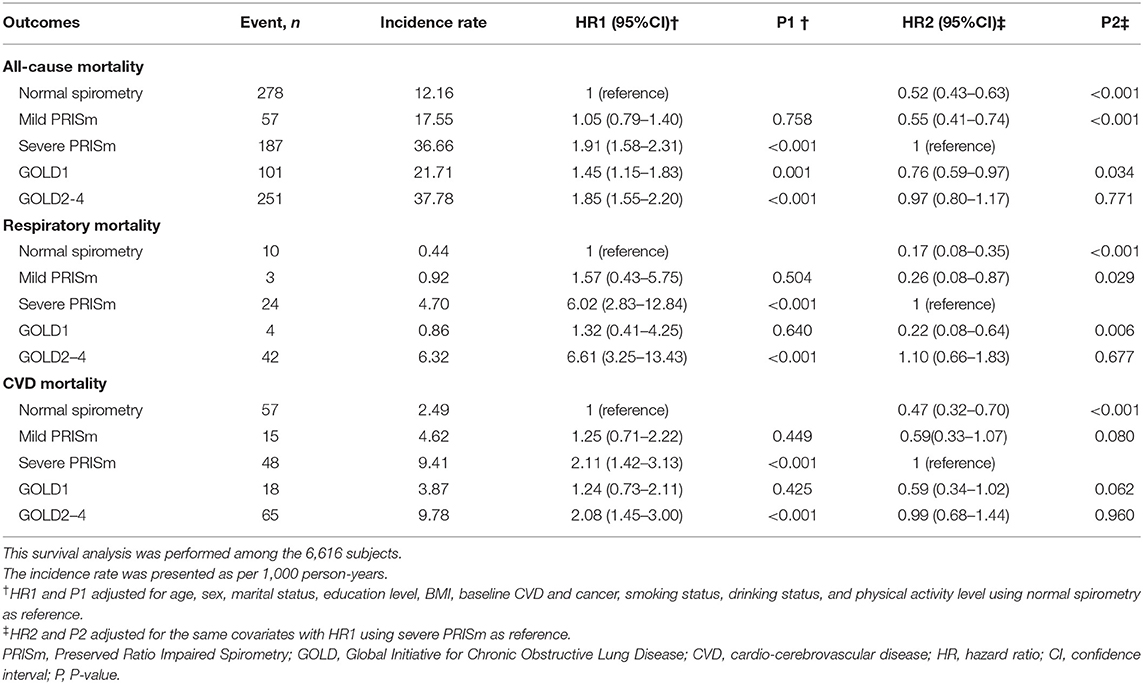
Table 2. Incidence rates and risks of all-cause mortality, respiratory mortality, and CVD mortality among different lung function categories.
After an average 4-year follow-up, 4,048 subjects were included for the longitudinal transition from Wave 2 to Wave 4. Supplementary Table 1 shows the baseline characteristics of included subjects at Wave 4 (N = 4,048) and those who were lost to follow-up at Wave 4 (N = 2,568). From Wave 2 to Wave 4, different transition patterns of mild PRISm and severe PRISm are summarized in Table 3. Among the subjects with mild PRISm at Wave 2, 19.6% maintained their status and 40.2% transitioned toward normal spirometry. In addition, 22.7% of mild PRISm transitioned toward severe PRISm, whereas only a small fraction of mild PRISm subjects changed their status to GOLD1 (7.6%) or GOLD2–4 (10.0%). Mild PRISm subjects who transitioned toward normal spirometry and GOLD1 showed increases in FVC with the medians of 57.5 (IQR: 21.8 to 122.9) and 217.8 (IQR: 150.3 to 330.1) mL/year, respectively. Subjects who changed from mild PRISm to severe PRISm exhibited declines in both FEV1 (median: −87.0, IQR: −114.9 to −60.3, mL/year) and FVC (median: −89.3, IQR: −147.0 to −50.6, mL/year). Mild PRISm subjects who changed to GOLD2–4 exhibited the decline in FEV1 (median: −98.0, IQR: −140.9 to −61.2, ml/year), while the change of FVC was not consistent (median: 15.0, IQR: −45.0 to 67.5, ml/year). In contrast, 42.4% of severe PRISm subjects at Wave 2 maintained their status and 28.3% transitioned toward GOLD2–4. Only a small fraction of severe PRISm transitioned toward normal spirometry (15.2%), mild PRISm (9.0%), and GOLD1 (5.0%). Increases in FEV1 and FVC were observed among the severe PRISm subjects who transitioned toward normal spirometry, mild PRISm, and GOLD1. Those who changed from severe PRISm to GOLD2–4 showed a decline in FEV1 (median: −56.7, IQR: −88.9 to −17.9, mL/year), but an increase in FVC (median: 68.6, IQR: −0.2 to 169.6, mL/year). In addition, 2,803 subjects were included for the longitudinal transition from Wave 4 to Wave 6. The baseline characteristics of included subjects at Wave 6 (N = 2,803) and those who were missed to follow-up at Wave 6 (N = 1,245) are presented in Supplementary Table 2. Similar transition patterns of mild PRISm and severe PRISm were also observed from Wave 4 to Wave 6 (Table 4). Mild PRISm was more likely to transition toward normal spirometry (54.7%), while severe PRISm tended to maintain the status (30.4%) or transition toward GOLD2-4 (33.9%). The detailed transition patterns of other lung function categories are summarized in Supplementary Tables 3, 4.
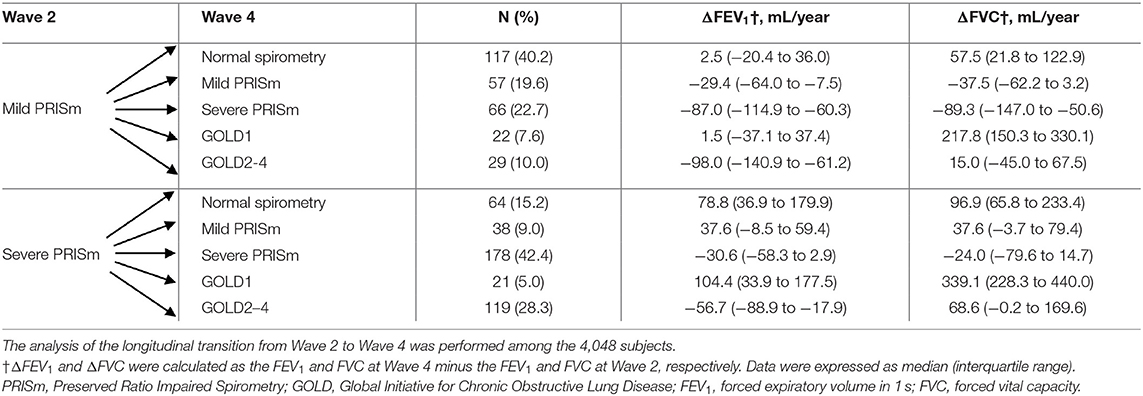
Table 3. Changes of lung function categories, FEV1, and FVC among subjects with mild PRISm and severe PRISm from Wave 2 to Wave 4.
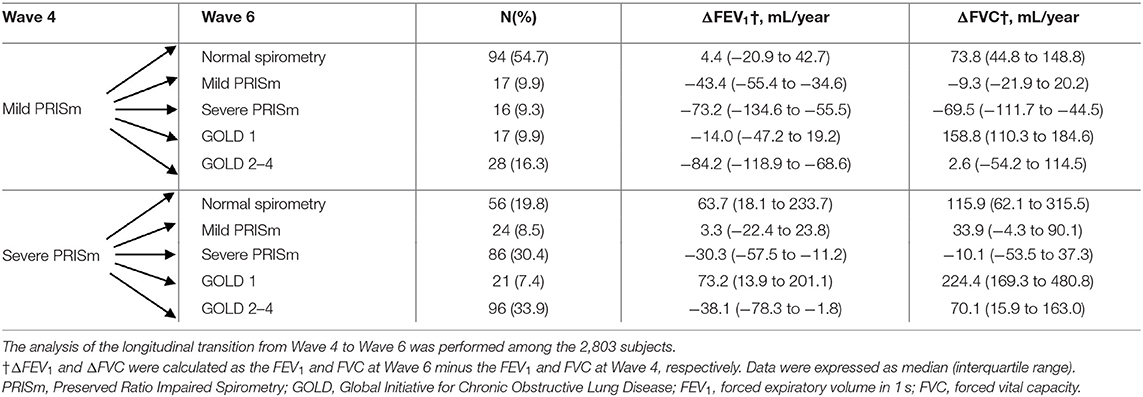
Table 4. Changes of lung function categories, FEV1, and FVC among subjects with mild PRISm and severe PRISm from Wave 4 to Wave 6.
When using LLN criteria to define the lung function categories, consistent results for the baseline characteristics and long-term mortality risks were found with the fixed-threshold criteria (Supplementary Tables 5, 6). Similarly, the differences between mild PRISm and severe PRISm in the longitudinal transition patterns were consistent with the fixed-threshold criteria (Supplementary Tables 7, 8).
In the survival analyses, consistent results were found after excluding subjects with asthma at baseline (Supplementary Table 9). When stratified by sex, no significant difference was found between men and women (Supplementary Table 10). When stratified by the smoking status, severe PRISm increased long-term mortality risks among never smokers and ever smokers, while GOLD2–4 only increased these risks among ever smokers (Supplementary Table 11).
In the present study, two subtypes of PRISm were identified and different clinical characteristics, long-term mortality risks, and longitudinal transition patterns were found. Severe PRISm had increased respiratory symptoms, higher risks of all-cause mortality, respiratory mortality, and CVD mortality than mild PRISm. Furthermore, mild PRISm and severe PRISm showed different transition patterns during follow-up. Mild PRISm tended to transition toward normal spirometry, while severe PRISm tended to maintain the status or transition toward GOLD2–4.
Previous studies had found that PRISm was a heterogeneous phenotype (5, 6, 16). Identifying the subtypes of PRISm would allow us to perform risk stratification and individualized management of PRISm. The COPDgene study had used machine learning analyses to identify the subtypes of PRISm (28). However, this study only included moderate and heavy smokers (≥10 pack-years), and the results of machine learning were not readily interpretable, which might limit the application in clinical practices. In our study, we identified two subtypes of PRISm by the common indicators of FEV1 and FVC in the general population and found significant differences between the two subtypes in respiratory symptoms, the risks of all-cause mortality, respiratory mortality, and CVD mortality. Increased risks of all-cause mortality were consistently found among subjects with PRISm in previous studies (1, 2, 5). These might mainly reflect the adverse effects of severe PRISm. The Rotterdam study showed higher risks of CVD mortality in PRISm subjects with impairments of FVC (5), which was also consistent with the result of severe PRISm. Furthermore, multiple sensitivity analyses indicated that severe PRISm presented increased risks in both men and women, smokers and non-smokers, fixed-threshold and LLN criteria, but not for mild PRISm. These results confirmed the stability of risk differences between the two subtypes of PRISm.
Besides the associations of single spirometry measurement at baseline with long-term outcomes, investigating longitudinal trajectories of PRISm could elucidate the disease course and progression. Previous transition studies found that PRISm was a fluid state with a high frequency of transitioning toward different lung function categories. The Rotterdam study showed that 32.6% of PRISm transitioned toward COPD and 10.4% transitioned toward normal spirometry (5), while those were 25.1 and 22.2% in the COPDgene study, respectively (16). In our study with three repeated spirometry measurements, we found different transition patterns of mild PRISm and severe PRISm. Mild PRISm tended to transition toward normal spirometry, while severe PRISm tended to maintain the status or transition toward GOLD2–4, confirming the heterogeneity of the two subtypes. In addition, we observed the direct transitions from normal spirometry to GOLD1 or to PRISm, whereas the proportion of the transition from GOLD1 to PRISm or from PRISm to GOLD1 was relatively low. This result was consistent with the previous findings that the progression of COPD had two distinct disease courses: (1) the emphysematous-predominant pathway that subjects first developed GOLD1, then progressed to GOLD2-4; (2) the airway-disease predominant pathway that subjects first developed PRISm, then progressed to GOLD2-4 (29, 30). As a supplement for pathway 2, our transition results suggested that mild PRISm might be the early stage of PRISm and severe PRISm was the subsequent progression of mild PRISm.
Our findings have important implications in clinical and public health practices. The epidemiologic data had revealed that the proportion of PRISm was significant in the general population (1–10). However, this phenotype was highly heterogeneous, and precise stratified management of PRISm was not well addressed according to current guidelines. Our results identified two subtypes of PRISm and found severe PRISm exhibited a poor prognosis like GOLD2–4, emphasizing the importance for clinicians to focus on this abnormal lung function pattern. Comprehensive risk factor interventions, such as smoking cessation and stringent clinical treatment, should be conducted for the subjects with severe PRISm as early as possible. In the health examination, lung function tests should also be encouraged to screen for severe PRISm, not only for COPD. On the other hand, despite the similar long-term mortality risks between mild PRISm and normal spirometry, there was a portion of mild PRISm progressing to severe PRISm or GOLD2–4 during follow-up. Therefore, regular screening for lung function and early interventions would be needed to avoid further deterioration. In addition, the definitions of PRISm were inconsistent in previous studies (7, 18). Our results would be suggestive for establishing a uniform definition and severity staging for PRISm, allowing for better descriptions of this phenotype and its interpretation.
Our study had some strengths. To our knowledge, this study was the first to identify the subtypes of PRISm based on the different degrees of reductions in FEV1 and FVC. Furthermore, multiple pieces of evidence including the clinical characteristics, long-term mortality risks, and longitudinal transition patterns enabled a more comprehensive assessment of the differences between mild PRISm and severe PRISm. The diverse sensitivity analyses also ensured the robustness of our findings. There were several limitations in this study. First, the ELSA only performed prebronchodilator spirometry, which might affect the subjects with reversible airflow obstruction, such as asthma patients. The prebronchodilator spirometry would underestimate their actual lung functions. However, our results were consistent after excluding the subjects with asthma (Supplementary Table 9), suggesting the potential bias was small. Second, the ELSA focused on the middle-aged and elderly population without the individuals aged <50 years. This design would limit the generalizability of our findings. Further studies should be conducted on the young population in the future. Third, although we had adjusted for the smoking status, a more accurate description of the smoking exposure, such as pack-year, was not available in the ELSA. Fourth, due to the lack of relevant data, detailed pathophysiological features and mechanisms for the two subtypes of PRISm were unclear. Finally, the subjects with poor health status at baseline were more likely to drop out or die during follow-up. Therefore, there might be a healthy subject bias in the longitudinal transition analyses.
In conclusion, we identified two subtypes of PRISm and found that severe PRISm had increased respiratory symptoms, higher mortality risks, and a higher probability of progressing to GOLD2–4 than mild PRISm. These findings provided new evidence for the stratified management of individuals with PRISm.
Publicly available datasets were analyzed in this study. This data can be found here: www.ukdataservice.ac.uk/.
The studies involving human participants were reviewed and approved by London Multi-Center Research Ethics Committee. The patients/participants provided their written informed consent to participate in this study.
DH, MG, and YZhu designed the analysis plan. DH and MG analyzed the data. YS, QW, ZC, JL, YZho, and KY provided the interpretation of the results. DH, MG, YS, and YZhu wrote the manuscript. DH, MG, YS, KY, and YZhu made the revision of the manuscript. All authors read and approved the final manuscript.
This work was supported by the grant from the National Key Research and Development Program of China (2017YFC0907004) and the grant from the Major Research and Development Project of Zhejiang Province (2020C03062).
The authors declare that the research was conducted in the absence of any commercial or financial relationships that could be construed as a potential conflict of interest.
All claims expressed in this article are solely those of the authors and do not necessarily represent those of their affiliated organizations, or those of the publisher, the editors and the reviewers. Any product that may be evaluated in this article, or claim that may be made by its manufacturer, is not guaranteed or endorsed by the publisher.
The authors thank the UK Data Archive for supplying the ELSA data.
The Supplementary Material for this article can be found online at: https://www.frontiersin.org/articles/10.3389/fmed.2021.755855/full#supplementary-material
BMI, body mass index; CI, confidence interval; COPD, chronic obstructive pulmonary disease; CRP, C-reactive protein; CVD, cardio-cerebrovascular disease; ELSA, English Longitudinal Study of Aging; GOLD, Global Initiative for Chronic Obstructive Lung Disease; FEV1; forced expiratory volume in 1 s; FVC, forced vital capacity; LLN, lower limit of normal; PF, peak flow; PRISm, Preserved Ratio Impaired Spirometry; SD, standard deviation.
1. Guerra S, Sherrill DL, Venker C, Ceccato CM, Halonen M, Martinez FD. Morbidity and mortality associated with the restrictive spirometric pattern: a longitudinal study. Thorax. (2010) 65:499–504. doi: 10.1136/thx.2009.126052
2. Pan J, Adab P, Jiang CQ, Zhang WS, Zhu F, Jin YL, et al. All-cause and cause-specific mortality from restrictive and obstructive spirometric patterns in Chinese adults with and without dyspnea: Guangzhou Biobank Cohort Study. Respir Med. (2019) 151:66–80. doi: 10.1016/j.rmed.2019.04.002
3. Wan ES, Hokanson JE, Murphy JR, Regan EA, Make BJ, Lynch DA, et al. Clinical and radiographic predictors of GOLD-unclassified smokers in the COPDGene study. Am J Respir Crit Care Med. (2011) 184:57–63. doi: 10.1164/rccm.201101-0021OC
4. Hyatt RE, Cowl CT, Bjoraker JA, Scanlon PD. Conditions associated with an abnormal nonspecific pattern of pulmonary function tests. Chest. (2009) 135:419–24. doi: 10.1378/chest.08-1235
5. Wijnant SRA, De Roos E, Kavousi M, Stricker BH, Terzikhan N, Lahousse L, et al. Trajectory and mortality of preserved ratio impaired spirometry: the Rotterdam Study. Eur Respir J. (2020) 55:1901217. doi: 10.1183/13993003.congress-2019.PA4421
6. Wan ES, Castaldi PJ, Cho MH, Hokanson JE, Regan EA, Make BJ, et al. Epidemiology, genetics, and subtyping of preserved ratio impaired spirometry (PRISm) in COPDGene. Respir Res. (2014) 15:89. doi: 10.1186/s12931-014-0089-y
7. Godfrey MS, Jankowich MD. The vital capacity is vital: epidemiology and clinical significance of the restrictive spirometry pattern. Chest. (2016) 149:238–51. doi: 10.1378/chest.15-1045
8. Mannino DM, McBurnie MA, Tan W, Kocabas A, Anto J, Vollmer WM, et al. Restricted spirometry in the Burden of Lung Disease Study. Int J Tuberc Lung Dis. (2012) 16:1405–11. doi: 10.5588/ijtld.12.0054
9. Park HJ, Byun MK, Rhee CK, Kim K, Kim HJ, Yoo KH. Significant predictors of medically diagnosed chronic obstructive pulmonary disease in patients with preserved ratio impaired spirometry: a 3-year cohort study. Respir Res. (2018) 19:185. doi: 10.1186/s12931-018-0896-7
10. Honda Y, Watanabe T, Shibata Y, Otaki Y, Kadowaki S, Narumi T, et al. Impact of restrictive lung disorder on cardiovascular mortality in a general population: The Yamagata (Takahata) study. Int J Cardiol. (2017) 241:395–400. doi: 10.1016/j.ijcard.2017.04.049
11. Nonato NL, Nascimento OA, Padilla RP, de Oca MM, Tálamo C, Valdivia G, et al. Occurrence of respiratory symptoms in persons with restrictive ventilatory impairment compared with persons with chronic obstructive pulmonary disease: The PLATINO study. Chron Respir Dis. (2015) 12:264–73. doi: 10.1177/1479972315588004
12. Kalhan R, Dransfield MT, Colangelo LA, Cuttica MJ, Jacobs DR. Jr., Thyagarajan B, et al. Respiratory symptoms in young adults and future lung disease. The CARDIA Lung Study. Am J Respir Crit Care Med. (2018) 197:1616–24. doi: 10.1164/rccm.201710-2108OC
13. Mannino DM, Ford ES, Redd SC. Obstructive and restrictive lung disease and functional limitation: data from the Third National Health and Nutrition Examination. J Intern Med. (2003) 254:540–7. doi: 10.1111/j.1365-2796.2003.01211.x
14. Jankowich M, Elston B, Liu Q, Abbasi S, Wu WC, Blackshear C, et al. Restrictive spirometry pattern, cardiac structure and function, and incident heart failure in African Americans. The Jackson Heart Study. Ann Am Thorac Soc. (2018) 15:1186–96. doi: 10.1513/AnnalsATS.201803-184OC
15. Johnston AK, Mannino DM, Hagan GW, Davis KJ, Kiri VA. Relationship between lung function impairment and incidence or recurrence of cardiovascular events in a middle-aged cohort. Thorax. (2008) 63:599–605. doi: 10.1136/thx.2007.088112
16. Wan ES, Fortis S, Regan EA, Hokanson J, Han MK, Casaburi R, et al. Longitudinal phenotypes and mortality in preserved ratio impaired spirometry in the COPDGene study. Am J Respir Crit Care Med. (2018) 198:1397–405. doi: 10.1164/rccm.201804-0663OC
17. Leone N, Courbon D, Thomas F, Bean K, Jégo B, Leynaert B, et al. Lung function impairment and metabolic syndrome: the critical role of abdominal obesity. Am J Respir Crit Care Med. (2009) 179:509–16. doi: 10.1164/rccm.200807-1195OC
18. Backman H, Eriksson B, Hedman L, Stridsman C, Jansson SA, Sovijärvi A, et al. Restrictive spirometric pattern in the general adult population: Methods of defining the condition and consequences on prevalence. Respir Med. (2016) 120:116–23. doi: 10.1016/j.rmed.2016.10.005
19. Duong M, Islam S, Rangarajan S, Leong D, Kurmi O, Teo K, et al. Mortality and cardiovascular and respiratory morbidity in individuals with impaired FEV(1) (PURE): an international, community-based cohort study. Lancet Glob Health. (2019) 7:e613–23. doi: 10.1016/S2214-109X(19)30070-1
20. Hole DJ Watt GC Davey-Smith G Hart CL Gillis CR Hawthorne VM: Impaired lung function and mortality risk in men and women: findings from the Renfrew and Paisley prospective population study. BMJ. (1996) 313:711–15. doi: 10.1136/bmj.313.7059.711
21. Steptoe A, Breeze E, Banks J, Nazroo J. Cohort profile: the English longitudinal study of ageing. Int J Epidemiol. (2013) 42:1640–8. doi: 10.1093/ije/dys168
22. Yohannes AM, Tampubolon G. Changes in lung function in older people from the English Longitudinal Study of Ageing. Expert Rev Respir Med. (2014) 8:515–21. doi: 10.1586/17476348.2014.919226
23. Standardization of Spirometry 1994 Update. American thoracic society. Am J Respir Crit. (1995) 152:1107–36. doi: 10.1164/ajrccm.152.3.7663792
24. Quanjer PH, Stanojevic S, Cole TJ, Baur X, Hall GL, Culver BH, et al. Multi-ethnic reference values for spirometry for the 3-95-yr age range: the global lung function 2012 equations. Eur Respir J. (2012) 40:1324–43. doi: 10.1183/09031936.00080312
25. Singh D, Agusti A, Anzueto A, Barnes PJ, Bourbeau J, Celli BR, et al. Global strategy for the diagnosis, management, and prevention of chronic obstructive lung disease: the GOLD science committee report 2019. Eur Respir J. (2019) 53:1900164. doi: 10.1183/13993003.00164-2019
26. Mahler DA, Wells CK. Evaluation of clinical methods for rating dyspnea. Chest. (1988) 93:580–6. doi: 10.1378/chest.93.3.580
27. Foreman MG, Zhang L, Murphy J, Hansel NN, Make B, Hokanson JE, et al. Early-onset chronic obstructive pulmonary disease is associated with female sex, maternal factors, and African American race in the COPDGene Study. Am J Respir Crit Care Med. (2011) 184:414–20. doi: 10.1164/rccm.201011-1928OC
28. Castaldi PJ, Boueiz A, Yun J, Estepar RSJ, Ross JC, Washko G, et al. Machine learning characterization of COPD subtypes: insights from the COPDGene study. Chest. (2020) 157:1147–57. doi: 10.1016/j.chest.2019.11.039
29. Lowe KE, Regan EA, Anzueto A, Austin E, Austin JHM, Beaty TH, et al. COPDGene(®) 2019: redefining the diagnosis of chronic obstructive pulmonary disease. Chronic Obstr Pulm Dis. (2019) 6:384–99. doi: 10.15326/jcopdf.6.5.2019.0149
Keywords: preserved ratio impaired spirometry, lung function, heterogeneity, subtypes, mortality, longitudinal transition
Citation: He D, Sun Y, Gao M, Wu Q, Cheng Z, Li J, Zhou Y, Ying K and Zhu Y (2021) Different Risks of Mortality and Longitudinal Transition Trajectories in New Potential Subtypes of the Preserved Ratio Impaired Spirometry: Evidence From the English Longitudinal Study of Aging. Front. Med. 8:755855. doi: 10.3389/fmed.2021.755855
Received: 09 August 2021; Accepted: 11 October 2021;
Published: 11 November 2021.
Edited by:
Chin Kook Rhee, The Catholic University of Korea, South KoreaReviewed by:
Spyridon Fortis, The University of Iowa, United StatesCopyright © 2021 He, Sun, Gao, Wu, Cheng, Li, Zhou, Ying and Zhu. This is an open-access article distributed under the terms of the Creative Commons Attribution License (CC BY). The use, distribution or reproduction in other forums is permitted, provided the original author(s) and the copyright owner(s) are credited and that the original publication in this journal is cited, in accordance with accepted academic practice. No use, distribution or reproduction is permitted which does not comply with these terms.
*Correspondence: Yimin Zhu, emh1eW1Aemp1LmVkdS5jbg==; Kejing Ying, eWtqQHpqdS5lZHUuY24=
†These authors have contributed equally to this work and share first authorship
Disclaimer: All claims expressed in this article are solely those of the authors and do not necessarily represent those of their affiliated organizations, or those of the publisher, the editors and the reviewers. Any product that may be evaluated in this article or claim that may be made by its manufacturer is not guaranteed or endorsed by the publisher.
Research integrity at Frontiers
Learn more about the work of our research integrity team to safeguard the quality of each article we publish.