 Yang Xia1†
 Limin Cao2†Yashu Liu1Xuena Wang3Shunming Zhang3Ge Meng3,4Qing Zhang5Li Liu5Hongmei Wu3Yeqing Gu3Yawen Wang3Tingjing Zhang3Xing Wang5Shaomei Sun5Ming Zhou5
 Qiyu Jia5Kun Song5
 Kaijun Niu3,5,6,7*‡
 Yuhong Zhao1*‡
- 1Department of Clinical Epidemiology, Shengjing Hospital of China Medical University, Shenyang, China
- 2The Third Central Hospital of Tianjin, Tianjin, China
- 3Nutritional Epidemiology Institute and School of Public Health, Tianjin Medical University, Tianjin, China
- 4Department of Toxicology and Sanitary Chemistry, School of Public Health, Tianjin Medical University, Tianjin, China
- 5Health Management Centre, Tianjin Medical University General Hospital, Tianjin, China
- 6Tianjin Key Laboratory of Environment, Nutrition and Public Health, Tianjin, China
- 7Center for International Collaborative Research on Environment, Nutrition and Public Health, Tianjin, China
Purpose: This study aimed to determine the longitudinal association between hand grip strength (HGS) and the development of non-alcoholic fatty liver disease (NAFLD) in adults.
Design: A cohort study.
Methods: This study was conducted in a general Chinese population (n = 14,154) from 2013–2018. NAFLD was diagnosed by liver ultrasonography during evaluating alcohol consumption. The associations between the HGS and NAFLD were assessed using a multivariable Cox proportional hazards regression model.
Results: During the study period with a mean follow-up duration of 3.20 years, 2,452 participants developed NAFLD. The risk of NAFLD decreased progressively with increasing HGS in both men and women (P for trend <0.0001). The multivariate-adjusted hazard ratios (95% CI) for NAFLD incidence across the quartiles of HGS were 1 (reference), 0.90 (0.79, 1.02), 0.69 (0.60, 0.79), and 0.44 (0.37, 0.52) for men and 1 (reference), 0.82 (0.69, 0.96), 0.54 (0.45, 0.66), and 0.41 (0.33, 0.52) for women, respectively. The interaction terms for body mass index (BMI)-HGS and waist-HGS were significant in men and women (all P < 0.0001). The participants with normal BMIs and waist circumferences had the lowest hazard ratios on the subgroup analyses. The sensitivity analysis that defined NAFLD using the hepatic steatosis and fatty liver indices revealed results that were similar to the main analyses.
Conclusion: The present study indicates that the HGS is inversely associated with the incidence of NAFLD.
Introduction
The non-alcoholic fatty liver disease (NAFLD) represents a spectrum of liver diseases not attributable to alcohol consumption, such as simple fatty infiltration, inflammation, and cirrhosis. Globally, the NAFLD is one of the most important causes of liver disease (1) and the previous studies have demonstrated that it is associated with metabolic syndrome (2), diabetes (3), and hypertension (4). As reported in a meta-analysis conducted in 2016, 25% of the global adult population were afflicted with NAFLD (5). Moreover, in China, the prevalence of NAFLD among adults in the general population is >20% and has paralleled the increase in obesity (6). In addition, the obesity prevalence rose from 3.1% (2.5–3.7) in 2004 to 8.1% (7.6–8.7) in 2018 (7). In parallel with increasing prevalence, the economic burden of NAFLD is enormous, especially at the time of diagnosis (8). Therefore, it is important to identify the modifiable risk factors and develop preventive strategies.
Insulin resistance is shown to be an important factor in NAFLD progression (9). A muscle is a target organ for insulin (10), and the previous studies suggested that the skeletal muscles secrete a variety of metabolically bioactive factors, such as myostatin, interleukin-6, and irisin (11, 12) that are subsequently involved in the regulation of insulin resistance and lipid metabolism. Thus, it is plausible that the muscles play an important role in the development of NAFLD. Indeed, several cross-sectional studies have shown that muscle strength is associated with NAFLD (13–18). For example, a cross-sectional study involving 5,132 adults in China showed that the low muscle strength was positively and independently associated with NAFLD [odds ratio (OR), 1.47; 95% CI, 1.21, 1.80] (13). Another nationwide population-based cross-sectional study demonstrated that the high hand grip strength (HGS) was negatively associated with the hepatic steatosis index (HSI) in 4,764 participants of Koreas (14). Because of the cross-sectional design of these studies, however, a causal relationship could not be identified.
To our knowledge, there has been no cohort study conducted to investigate the associations between muscle strength and the incidence of NAFLD. Thus, we conducted this prospective study to better understand the association between the HGS and NAFLD using data from a large population-based cohort study in adults in China.
Methods
Participants
This prospective study was based on a large prospective dynamic cohort study conducted in Tianjin, China (19). Between 2013 and 2018, a total of 29,551 participants had at least two health examinations with adequate data related to the NAFLD diagnosis, lifestyle (via questionnaire), and physical performance tests. After exclusions (Figure 1), the cohort consisted of 15,773 participants at baseline. As 1,619 participants did not complete the follow-up health examinations, the final study population comprised 14,154 participants (follow-up rate of 89.74%). The mean duration of follow-up was 3.20 years (range, 0.50–5 years). The protocol of this study was approved by the Institutional Review Board of the Tianjin Medical University. The subjects provided the written informed consent to participate in the study. The study protocol conformed to the ethical guidelines of the 1975 Declaration of Helsinki.
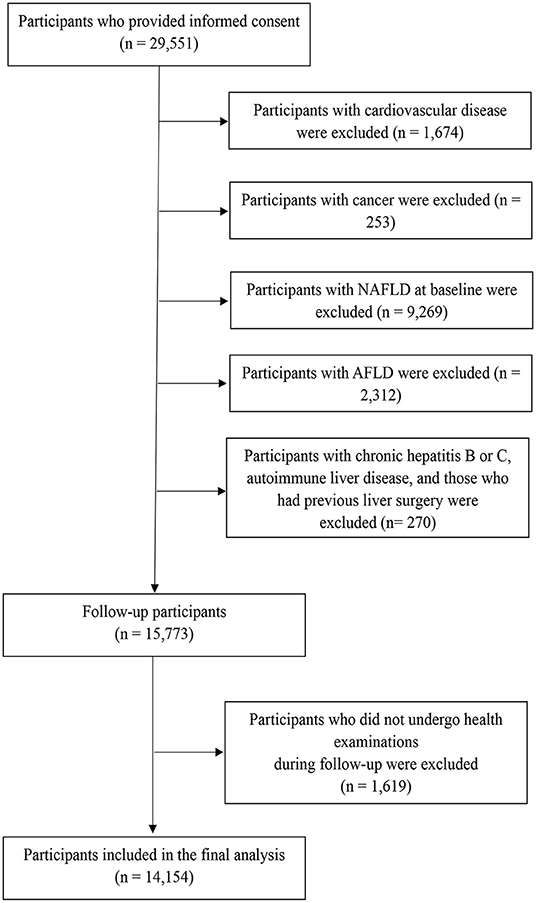
Figure 1. Flowchart of study participant selection for the study. AFLD, alcoholic fatty liver disease; NAFLD, non-alcoholic fatty liver disease.
Assessment of NAFLD
Liver ultrasonography was performed by the trained sonographers using a Toshiba SSA-660A instrument (Toshiba, Tokyo, Japan) with a 2–5 MHz curved array probe. According to the revised 2018 NAFLD definition and treatment guidelines promulgated by the Chinese National Workshop on Fatty Liver and Alcoholic Liver Disease (20), the participants were diagnosed with NAFLD based on the detection of brightness in the liver and a diffusely echogenic change in the liver parenchyma on abdominal ultrasonography despite no history of heavy alcohol consumption (defined as >210 g of alcohol intake per week in men and >140 g per week in women).
In the sensitivity analysis, the participants were diagnosed with NAFLD using the HSI and fatty liver index (FLI), which were developed to identify the presence of suspected NAFLD. The HSI was calculated using the following algorithm: HSI = 8 × the alanine aminotransferase-to-aspartate transaminase ratio + the body mass index [BMI] (+ 2, if type 2 diabetes was present and +2 if female). An HSI value >36.0 predicted the NAFLD with a specificity of 92.4% (95% CI, 91.3–93.4) (21). The FLI was calculated using the following algorithm: FLI = (e0.953*loge (triglycerides) + 0.139*BMI + 0.718*loge (ggt) + 0.053*waistcircumference−15.745)/ (1 + e0.953*loge (triglycerides) + 0.139*BMI + 0.718*loge (ggt) + 0.053*waist circumference −15.745)*100 (22). According to a previous study that explored the validation of the FLI for NAFLD in the Chinese, an FLI value ≥ of 30 was used as the cut-off point for NAFLD with a sensitivity of 79.89% and a specificity of 71.51% (23).
Measurement of Muscle Strength
The muscle strength was assessed using the HGS, which is a feasible and convenient indicator of the overall muscle strength with good test-retest reliability and responsiveness (24). The participants were tested by the trained technicians using a handheld dynamometer (EH101; Camry, Guangdong, China). The participants were asked to stand upright with the dynamometer beside but not against their bodies and to perform two maximum force trials for each hand; the greatest force was used as the final score. Furthermore, HGS was normalized to the bodyweight to account for the proportion of HGS relative to the body weight [HGS (kg)/body weight (kg)] (25).
Assessments and Definitions of Other Variables
The sociodemographic variables, such as sex, age, education, employment, and household income, were assessed via questionnaire, as were cigarette smoking and alcohol consumption. The BMI was calculated as the weight in kilograms divided by the square of the height in meters (kg/m2). The physical activity in the most recent week was assessed using the short form of the International Physical Activity Questionnaire (26). High depressive symptoms were assessed using the Chinese version of the Zung Self-Rating Depression Scale (SDS), a useful and well-validated questionnaire commonly used by the Chinese psychiatrists; (27) the participants were defined as high depressive symptoms when the SDS score was ≥45 (28). Hypertension was defined as an average systolic blood pressure ≥140 mm Hg or average diastolic blood pressure ≥90 mmHg or as the use of antihypertension medication (29). Hyperlipidemia was defined as a total cholesterol level ≥5.20 mmol/L, a triglycerides level ≥1.70 mmol/L, or as a self-reported clinical diagnosis of hyperlipidemia according to the 2016 Chinese guidelines for the management of dyslipidemia in adults (30). Dietary intake was assessed using a modified version of the Food Frequency Questionnaire (FFQ) that included 100 food items with specified serving sizes; detailed information about this FFQ has been described elsewhere (31, 32). The Chinese Food Composition tables were used as the nutrient database to calculate the total energy intake per day (33). The factor analysis was applied to generate the major dietary patterns and food loading for all the 100 food items and beverages in grams. The factors were named descriptively according to the food items showing high loading (absolute value > 0.3) with respect to each dietary pattern as follows: sweet foods pattern, vegetable pattern, and animal foods pattern. The dietary patterns scores were used for further analyses as confounding factors.
Statistical Analysis
The characteristics of participants at the baseline are described according to sex and NAFLD status. The continuous variables are presented as least-square means and 95% CI, in which the categorical variables are presented as percentages. The quartiles were categorized across HGS based on the distribution of the scores and used for further analyses. The Cox proportional hazards regression model was used to estimate the hazard ratios (HRs) and 95% CIs for NAFLD incidence in relation to the HGS. The linear trend across increasing the quartiles of HGS was tested using the median value of each quartile as a continuous variable based on the Cox proportional hazards regression analysis. The crude model was used to calculate the crude HR without any adjustment. Model 1 adjusted for age and BMI. Model 2 additionally adjusted for cigarette smoking status, alcohol consumption status, educational level, employment status, household income, physical activity, energy intake, type 2 diabetes, hypertension, hyperlipidemia, depressive symptoms, and intake of sweet foods pattern, vegetable pattern, and animal foods pattern. The receiver operating characteristics (ROCs) curves were performed to quantify the area under the curve (AUC) and an optimal cut-off value of HGS associated with the incidence of NAFLD.
To study the BMI–HGS and waist–HGS interactions, the analyses according to different subgroups of BMI and waist circumferences were performed. The subgroups of BMI and waist circumferences were defined according to the Working Group on Obesity in China (normal BMI, <24 kg/m2; high BMI, 24–28 kg/m2; and obesity, ≥28 kg/m2 and normal waist, <80 cm for women and <85 cm for men; and high waist, ≥ 80 cm for women and ≥ 85 cm for men) (34). The P-values for the interaction were also calculated by testing the multiplicative term of HGS and BMI or HGS and waist circumference. The sensitivity analyses were performed by defining the NAFLD using the HSI and FLI (21, 22). We then repeated the primary analyses by adjusting Model 2 in men and women. All the analyses were performed using the Statistical Analysis System (version 9.3 for Windows; SAS Institute, Inc., Cary, NC, USA). All the P-values were two-tailed, and the differences with P-values <0.05 were considered statistically significant.
Results
Participant Characteristics
The baseline characteristics of the participants according to sex are presented in Table 1. A total of 14,154 participants were enrolled. During the study period (mean follow-up, 3.20 years; range, 0.50–5 years), 2,452 participants (17.32%) developed NAFLD (incidence = 72.29 per 1,000 person-years). The proportion of men was 41.8%. The mean (SD) ages were 39.6 (11.5), 40.9 (12.5), and 38.7 (10.7) for all the participants, men, and women, respectively.
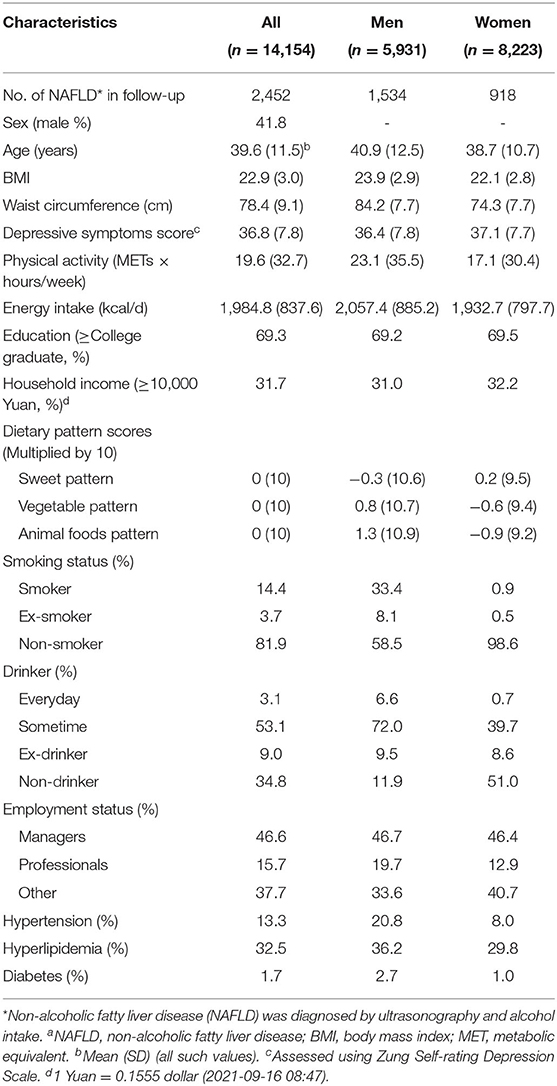
Table 1. The characteristics of participants by sex at baselinea.
HGS and Incidence of NAFLD
As shown in Table 2, the baseline HGS [HGS/weight (kg/kg)] was negatively associated with the incidence of NAFLD in men (P < 0.0001) and women (P < 0.0001) before and after adjusting for the confounding factors. The multivariate-adjusted HRs (CIs) for NAFLD incidence across the quartiles of HGS were 1 (reference), 0.90 (0.79, 1.02), 0.69 (0.60, 0.79), and 0.44 (0.37, 0.52) for men and 1 (reference), 0.82 (0.69, 0.96), 0.54 (0.45, 0.66), and 0.41 (0.33, 0.52) for women. The optimal cut-off values of HGS (HGS/weight [kg/kg]) were 0.61 and 0.43 for men and women, respectively. The AUC (95% CI) values of HGS were 0.65 (0.63, 0.66) and 0.67 (0.66, 0.69) for men and women, respectively.
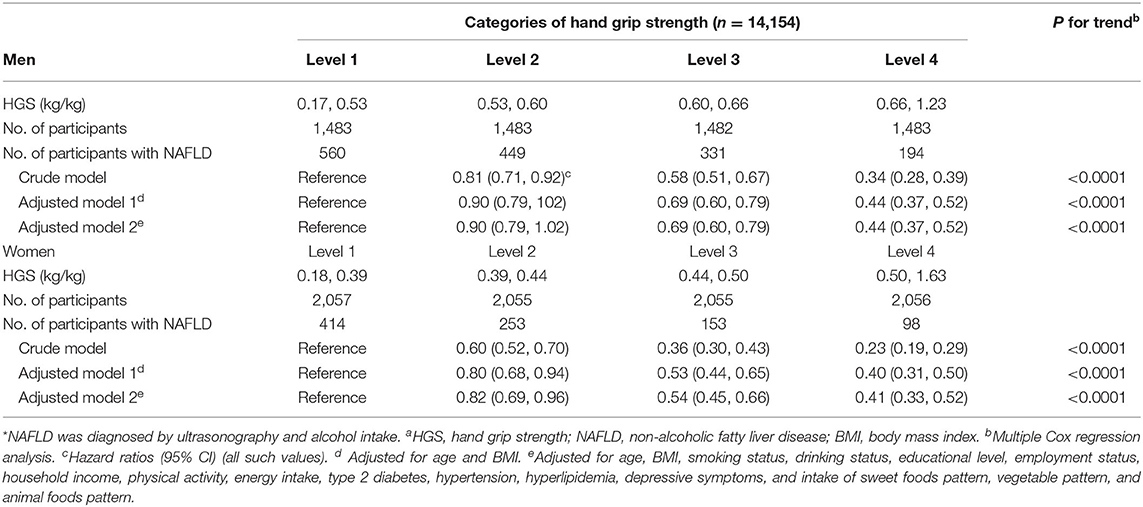
Table 2. Association between hand grip strength (HGS) (HGS/weight, kg/kg) and NAFLD* by sexa.
BMI–HGS and Waist–HGS Interactions as Related to NAFLD Incidence
The interaction terms of BMI–HGS and waist–HGS were significant in both men and women after adjusting for the confounding factors (all P < 0.0001). The associations among the different subgroups according to BMI and waist circumference are presented in Figures 2, 3, respectively. Compared with the participants in the lowest HGS quartiles, the lowest HRs (CIs) were observed among the participants who were in the normal BMI group (<24 kg/m2) in both men (HR: 0.32, 95% CI: 0.24, 0.43) and women (HR: 0.31; 95% CI: 0.23, 0.43), respectively. Similarly, in the subgroup analyses according to waist circumference, the associations between HGS and NAFLD were stronger in the participants who were in the normal waist group than those who were in the high waist group. Compared with the participants in the lowest HGS quartiles, the HRs (CIs) of NAFLD in the highest quartiles were 0.33 (0.25, 0.44) and 0.43 (0.31, 0.59) in men and women who had normal waist circumferences, respectively.
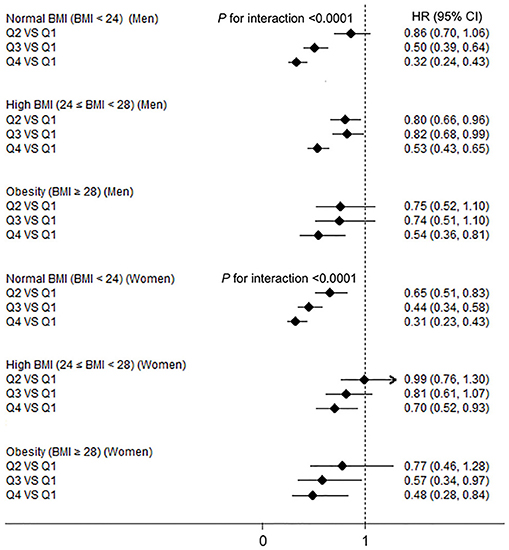
Figure 2. The associations between hand grip strength (HGS) and NAFLD according to body mass index (BMI) in men and women. NAFLD, non-alcoholic fatty liver disease; HGS, hand grip strength; BMI, body mass index; HR, hazard ratio; Q, quartile. Adjusted for age, smoking status, drinking status, educational level, employment status, household income, physical activity, energy intake, type 2 diabetes, hypertension, hyperlipidemia, depressive symptoms, and intake of sweet foods pattern, vegetable pattern, and animal foods pattern.
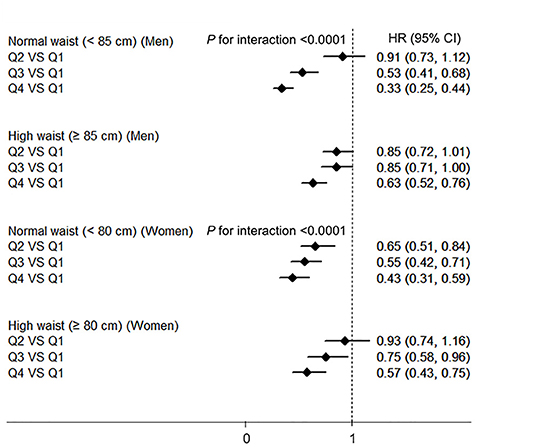
Figure 3. The associations between HGS and NAFLD according to the waist circumference in men and women. NAFLD, non-alcoholic fatty liver disease; HGS, hand grip strength; BMI, body mass index; HR, hazard ratio; Q, quartile. Adjusted for age, BMI, smoking status, drinking status, educational level, employment status, household income, physical activity, energy intake, type 2 diabetes, hypertension, hyperlipidemia, depressive symptoms, and intake of sweet foods pattern, vegetable pattern, and animal foods pattern.
Sensitivity Analysis
Figure 4 shows the association between the HGS and NAFLD incidence defined using the HSI and FLI in men and women. These associations were similar to those derived from the main analyses in which NAFLD was identified using liver ultrasonography and history of drinking. HGS was negatively associated with the incidence of NAFLD in both men and women (all P values <0.0001). Compared with the participants in the lowest quartiles of HGS, the HRs (CIs) of NAFLD which defined using HSI in the highest quartiles were 0.53 (0.36, 0.78) and 0.33 (0.20, 0.53) in men and women, respectively. Compared with the participants in the lowest quartiles of HGS, the HRs (CIs) of NAFLD which defined using FLI in the highest quartiles were 0.40 (0.24, 0.67) and 0.29 (0.15, 0.58) in men and women, respectively.
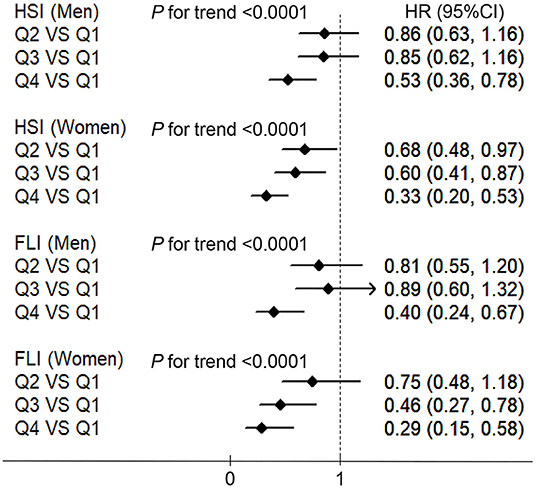
Figure 4. The associations between HGS and NAFLD which defined using the HSI and fatty liver index (FLI) in men and women. HSI, hepatic steatosis index; FLI, fatty liver index; NAFLD, non-alcoholic fatty liver disease; BMI, body mass index; HGS, hand grip strength; HR, hazard ratio; Q, quartile. Adjusted for age, BMI, smoking status, drinking status, educational level, employment status, household income, physical activity, energy intake, type 2 diabetes, hypertension, hyperlipidemia, depressive symptoms, and intake of sweet foods pattern, vegetable pattern, and animal foods pattern.
Discussion
Our large population-based cohort study in which we prospectively determined the association between HGS and NAFLD in the Chinese adults suggested that a higher HGS was associated with a lower risk of NAFLD. These associations were independent of the socio-demographic, behavioral, psychological, dietary, and health status factors. Furthermore, there were significant interaction effects between HGS and both BMI and waist size on the incidence of NAFLD. The results of our sensitivity analysis, which defined NAFLD using the HSI and FLI, were similar to those of the main analysis.
The muscles have been shown to play an important role in the development of NAFLD (35). The previous studies found that sarcopenia, which is a progressive and generalized skeletal muscle disorder that involves the accelerated loss of muscle mass and function (36), was shown to be associated with NAFLD (37, 38). Compared with measuring muscle mass, measuring muscle strength (an indicator of muscle function) is easy to do in both the clinical and community settings (39). Thus, muscle strength could be a valuable predictor of NAFLD. In recent years, several cross-sectional studies have determined the association between HGS and the prevalence of NAFLD (13–17). For example, a cross-sectional study of 20,957 Chinese adults reported that increased HGS was independently associated with a lower prevalence of NAFLD (17). Compared with the participants who had the lowest HGS, the OR (95% CI) for the highest HGS was 0.67 (0.57, 0.79) (17). Another cross-sectional study also suggested that the low muscle strength was positively associated with NAFLD (OR, 1.47; 95% CI, 1.21, 1.80) in 5,132 Chinese adults (13). The Korea National Health and Nutrition Examination Survey also found that the lower BMI-adjusted HGS was associated with NAFLD in the Korean adults (n = 8,001) (16) as well as in elderly participants (n = 4,764) (14). Moreover, another study revealed a linear decrease in the NAFLD index that was commensurate with the incremental HGS level changes among the 538 elderly Korean participants (15). No cohort study has investigated the associations between HGS and NAFLD prospectively; considering the cross-sectional designs of previous studies, it was not possible to draw conclusions with respect to causality.
Consistent with previous cross-sectional studies, the present cohort study suggested that HGS was negatively associated with the incidence of NAFLD after adjusting for the confounding factors. The mechanisms that have been proposed to explain this association are chiefly related to insulin resistance and inflammation. First, the skeletal muscle is a major site of insulin-stimulated whole-body glucose disposal, and muscle metabolism can influence whole-body glucose homeostasis and insulin sensitivity (40). Thus, low muscle mass may lead to insulin resistance and explain the propagation of NAFLD (35). In addition, the muscle secretes irisin, which is a hormone that reduces obesity and insulin resistance (12), and is shown to be inversely associated with hepatic steatosis (41). Second, sarcopenia is associated with inflammatory indicators, such as the C-reactive protein level (38) and the neutrophil-to-lymphocyte ratio (42). Inflammation is also well-documented as a central component of NAFLD pathogenesis (43). Moreover, a previous study suggested that interleukin-6, which is a myokine secreted by muscle, was shown to have a protective effect on the development of NAFLD in an inflammation-prone animal model (44).
The results of the subgroup analyses suggested that the strongest associations between HGS and NAFLD were found in the participants with normal BMI and waist circumference. Two reasons were possible to explain it. First, BMI (45) and waist circumference (46) are positively associated with NAFLD. Thus, the associations between the HGS and NAFLD could be covered by BMI and waist circumference in the participants with high BMI and waist circumference. Second, the small sample sizes of high BMI and waist circumference subgroups could result in wide CIs of the HRs for NAFLD. We further performed the sensitivity analyses by defining NAFLD using the HSI and FLI. The associations revealed using this method were similar to those found when NAFLD was detected using liver ultrasonography and alcohol consumption history, indicating the robustness of the results.
The main strengths of our study were the large sample size and prospective cohort design. The former strength allowed for sufficient statistical power to detect the associations between HGS and NAFLD, while the latter strength helped ensure that the reverse causation would be minimized as much as possible. Moreover, the previous studies did not include dietary confounding factors in the adjustment models, even though the factors are strongly associated with muscle strength (47) and NAFLD (48). In the present study, we adjusted for sociodemographic, behavioral, psychological, dietary, and health status factors as much as possible to ascertain the independence from the association between HGS and NAFLD.
Some limitations are notable in our study. First, owing to its observational study design, the mechanism underlying the associations could not be determined. Second, even though we adjusted for the potential confounding factors, we could not rule out the possibility that other unmeasured factors might contribute to the associations observed. Third, we used hepatic ultrasonography scanning instead of the liver biopsies to detect fatty liver given that liver biopsy was not available during the health examinations of the target population. Even though a previous study found that ultrasonography had a sensitivity of 89% and a specificity of 93% for NAFLD and was widely used in population-based studies because of its non-invasiveness and accessibility (49), ultrasound has limited sensitivity and does not reliably detect steatosis when the amount of fat was low or in individuals with an elevated BMI. Thus, the patients from the NAFLD group (future NAFLD patients) may have NAFLD at the baseline but are diagnosed without NAFLD when using liver ultrasound. Future studies which use more accurate methods, such as liver biopsy and controlled attenuation parameter, are needed to confirm the observed associations in the present study. Fourth, we excluded participants with choric hepatitis B or C, autoimmune liver disease, and those who have previous liver surgery. Nevertheless, the participants with other causes of NAFLD (such as a drug), celiac disease, or thyroid disease were not excluded. Therefore, the observed associations may be affected. Finally, the mechanisms that underline the associations between HGS and NAFLD may be explained by the metabolic factors (e.g., insulin resistance). Otherwise, various factors play important roles in the development of NAFLD. For example, lean NAFLD was developed without obesity (50), and there is also a substantial proportion of patients with normal BMI NAFLD without insulin resistance. Moreover, the susceptible polygenic host background also contributes to the development of NAFLD (51). Therefore, despite metabolic factors, further studies should also focus on the effect of aforenoted factors on the development of NAFLD.
Conclusion
Despite the aforementioned limitations, ours is the first cohort study to demonstrate that HGS is inversely associated with the incidence of NAFLD. The data suggested that a high HGS predicts a lower risk of NAFLD; hence, measuring HGS may serve as a possible strategy for detecting NAFLD at an early stage.
Data Availability Statement
The raw data supporting the conclusions of this article will be made available by the authors, without undue reservation.
Ethics Statement
The studies involving human participants were reviewed and approved the protocol of this study was approved by the Institutional Review Board of the Tianjin Medical University; the subjects provided written informed consent to participate in the study. The study protocol conformed to the Ethical guidelines of the 1975 Declaration of Helsinki. The patients/participants provided their written informed consent to participate in this study.
Author Contributions
YX and KN contributed to the study conception and design. YX, LC, YL, XuW, SZ, GM, QZ, LL, HW, YG, YW, TZ, XiW, SS, MZ, QJ, and KS contributed to data collection, assembly, analysis, and interpretation of the data. YX, YZ, and KN contributed to the revising of the manuscript. YX, LC, and YZ contributed to the manuscript drafting and approval of the final version of the manuscript. All authors contributed to the article and approved the submitted version.
Funding
This study was supported by grants from the National Natural Science Foundation of China (Nos. 81903302, 91746205, and 81673166) and 345 Talent Project of Shengjing Hospital of China Medical University (No. M0294).
Conflict of Interest
The authors declare that the research was conducted in the absence of any commercial or financial relationships that could be construed as a potential conflict of interest.
Publisher's Note
All claims expressed in this article are solely those of the authors and do not necessarily represent those of their affiliated organizations, or those of the publisher, the editors and the reviewers. Any product that may be evaluated in this article, or claim that may be made by its manufacturer, is not guaranteed or endorsed by the publisher.
Acknowledgments
We are grateful to all the participants of the study and the Tianjin Medical University General Hospital Health Management Center for the opportunity to conduct the study.
Abbreviations
AFLD, alcoholic fatty liver disease; AUC, area under the curve; BMI, body mass index; CI, confidence interval; FFQ, food frequency questionnaire; FLI, fatty liver index; HGS, hand grip strength; HIS, hepatic steatosis index; HRs, hazard ratios; MET, metabolic equivalent; NAFLD, non-alcoholic fatty liver disease; OR, odds ratio; Q, quartile; ROC, receiver operating characteristics; SDS, self-rating depression scale.
References
1. Younossi Z, Anstee QM, Marietti M, Hardy T, Henry L, Eslam M, et al. Global burden of NAFLD and NASH: trends, predictions, risk factors and prevention. Nat Rev Gastroenterol Hepatol. (2018) 15:11–20. doi: 10.1038/nrgastro.2017.109
2. Yki-Jarvinen H. Non-alcoholic fatty liver disease as a cause and a consequence of metabolic syndrome. Lancet Diab Endocrinol. (2014) 2:901–10. doi: 10.1016/S2213-8587(14)70032-4
3. Chang Y, Jung HS, Yun KE, Cho J, Cho YK Ryu S. Cohort study of non-alcoholic fatty liver disease, NAFLD fibrosis score, and the risk of incident diabetes in a Korean population. Am J Gastroenterol. (2013) 108:1861–8. doi: 10.1038/ajg.2013.349
4. Ryoo JH, Suh YJ, Shin HC, Cho YK, Choi JM, Park SK. Clinical association between non-alcoholic fatty liver disease and the development of hypertension. J Gastroenterol Hepatol. (2014) 29:1926–31. doi: 10.1111/jgh.12643
5. Younossi ZM, Koenig AB, Abdelatif D, Fazel Y, Henry L, Wymer M. Global epidemiology of nonalcoholic fatty liver disease-Meta-analytic assessment of prevalence, incidence, and outcomes. Hepatology. (2016) 64:73–84. doi: 10.1002/hep.28431
6. Fan JG. Epidemiology of alcoholic and nonalcoholic fatty liver disease in China. J Gastroenterol Hepatol. (2013) 28 Suppl 1:11–7. doi: 10.1111/jgh.12036
7. Wang L, Zhou B, Zhao Z, Yang L, Zhang M, Jiang Y, et al. Body-mass index and obesity in urban and rural China: findings from consecutive nationally representative surveys during 2004-18. Lancet. (2021) 398:53–63. doi: 10.1016/S0140-6736(21)00798-4
8. Allen AM, Van Houten HK, Sangaralingham LR, Talwalkar JA. McCoy RG. Healthcare cost and utilization in nonalcoholic fatty liver disease: real-world data from a large US claims. Datab Hepatol. (2018) 68:2230–8. doi: 10.1002/hep.30094
9. Tilg H, Moschen AR. Insulin resistance, inflammation, and non-alcoholic fatty liver disease. Trends Endocrinol Metab. (2008) 19:371–9. doi: 10.1016/j.tem.2008.08.005
10. Guillet C, Boirie Y. Insulin resistance: a contributing factor to age-related muscle mass loss? Diabetes Metabol. (2005) 31:5S20–5S6. doi: 10.1016/S1262-3636(05)73648-X
11. Mizgier ML, Casas M, Contreras-Ferrat A, Llanos P, Galgani JE. Potential role of skeletal muscle glucose metabolism on the regulation of insulin secretion. Obesity Rev. (2014) 15:587–97. doi: 10.1111/obr.12166
12. Bostrom P, Wu J, Jedrychowski MP, Korde A, Ye L, Lo JC, et al. A PGC1-alpha-dependent myokine that drives brown-fat-like development of white fat and thermogenesis. Nature. (2012) 481:463–8. doi: 10.1038/nature10777
13. Gan D, Wang L, Jia M, Ru Y, Ma Y, Zheng W, et al. Low muscle mass and low muscle strength associate with nonalcoholic fatty liver disease. Clin Nutr. (2019) 39:1124–30. doi: 10.1016/j.clnu.2019.04.023
14. Kim BJ, Ahn SH, Lee SH, Hong S, Hamrick MW, Isales CM, et al. Lower hand grip strength in older adults with non-alcoholic fatty liver disease: a nationwide population-based study. Aging. (2019) 11:4547–60. doi: 10.18632/aging.102068
15. Lee I, Cho J, Park J, Kang H. Association of hand-grip strength and non-alcoholic fatty liver disease index in older adults. J Exercise Nutr Biochem. (2018) 22:62–8. doi: 10.20463/jenb.2018.0031
16. Lee K. Relationship between handgrip strength and nonalcoholic fatty liver disease: nationwide surveys. Metab Syndr Relat Disord. (2018) 16:497–503. doi: 10.1089/met.2018.0077
17. Meng G, Wu H, Fang L, Li C, Yu F, Zhang Q, et al. Relationship between grip strength and newly diagnosed nonalcoholic fatty liver disease in a large-scale adult population. Sci Rep. (2016) 6:33255. doi: 10.1038/srep33255
18. Park SH, Kim DJ, Plank LD. Association of grip strength with non-alcoholic fatty liver disease: investigation of the roles of insulin resistance and inflammation as mediators. Eur J Clin Nutr. (2020). doi: 10.1038/s41430-020-0591-x
19. Sun S, Wu H, Zhang Q, Wang C, Guo Y, Du H, et al. Subnormal peripheral blood leukocyte counts are related to the lowest prevalence and incidence of metabolic syndrome: Tianjin chronic low-grade systemic inflammation and health cohort study. Mediators Inflamm. (2014) 2014:412386. doi: 10.1155/2014/412386
20. National Workshop on Fatty L ALDC Fatty Liver Expert Committee CMDA. Guidelines of prevention and treatment for nonalcoholic fatty liver disease: a 2018 update. Zhonghua Gan Zang Bing Za Zhi. (2018) 26:195–203. doi: 10.3760/cma.j.issn.1007-3418.2018.03.008
21. Lee JH, Kim D, Kim HJ, Lee CH, Yang JI, Kim W, et al. Hepatic steatosis index: a simple screening tool reflecting nonalcoholic fatty liver disease. Digest Liver Dis. (2010) 42:503–8. doi: 10.1016/j.dld.2009.08.002
22. Bedogni G, Bellentani S, Miglioli L, Masutti F, Passalacqua M, Castiglione A, et al. The Fatty Liver Index: a simple and accurate predictor of hepatic steatosis in the general population. BMC Gastroenterol. (2006) 6:33. doi: 10.1186/1471-230X-6-33
23. Huang X, Xu M, Chen Y, Peng K, Huang Y, Wang P, et al. Validation of the fatty liver index for nonalcoholic fatty liver disease in middle-aged and elderly Chinese. Medicine. (2015) 94:e1682. doi: 10.1097/MD.0000000000001682
24. Bohannon RW. Muscle strength: clinical and prognostic value of hand-grip dynamometry. Curr Opin Clin Nutr Metab Care. (2015) 18:465–70. doi: 10.1097/MCO.0000000000000202
25. Wu H, Liu M, Chi VTQ, Wang J, Zhang Q, Liu L, et al. Handgrip strength is inversely associated with metabolic syndrome and its separate components in middle aged and older adults: a large-scale population-based study. Metabolism. (2019) 93:61–7. doi: 10.1016/j.metabol.2019.01.011
26. Craig CL, Marshall AL, Sjostrom M, Bauman AE, Booth ML, Ainsworth BE, et al. International physical activity questionnaire: 12-country reliability and validity. Med Sci Sports Exerc. (2003) 35:1381–95. doi: 10.1249/01.MSS.0000078924.61453.FB
28. Xia Y, Wang N, Yu B, Zhang Q, Liu L, Meng G, et al. Dietary patterns are associated with depressive symptoms among Chinese adults: a case-control study with propensity score matching. Eur J Nutr. (2017) 56:2577–87. doi: 10.1007/s00394-016-1293-y
29. James PA, Oparil S, Carter BL, Cushman WC, Dennison-Himmelfarb C, Handler J, et al. 2014 evidence-based guideline for the management of high blood pressure in adults: report from the panel members appointed to the Eighth Joint National Committee (JNC 8). Jama. (2014) 311:507–20. doi: 10.1001/jama.2013.284427
30. Joint committee for guideline r. 2016 Chinese guidelines for the management of dyslipidemia in adults. Journal of geriatric cardiology: JGC. 2018 15:1–29.
31. Xia Y, Xiang Q, Gu Y, Jia S, Zhang Q, Liu L, et al. A dietary pattern rich in animal organ, seafood and processed meat products is associated with newly diagnosed hyperuricaemia in Chinese adults: a propensity score-matched case-control study. Br J Nutr. (2018) 119:1177–84. doi: 10.1017/S0007114518000867
32. Xia Y, Lu Z, Lu M, Liu M, Liu L, Meng G, et al. Raw orange intake is associated with higher prevalence of non-alcoholic fatty liver disease in an adult population. Nutrition. (2019) 60:252–60. doi: 10.1016/j.nut.2018.09.033
33. Yang YX, Wang GY, Pan XC. China Food Composition. 2nd ed. Beijing: Peking University Medical Press. (2009).
34. Zhou BF Cooperative meta-analysis group of the working group on obesity in C. Predictive values of body mass index and waist circumference for risk factors of certain related diseases in Chinese adults–study on optimal cut-off points of body mass index and waist circumference in Chinese adults. Biomed. Environ. Sci. (2002) 15:83–96.
35. Bhanji RA, Narayanan P, Allen AM, Malhi H, Watt KD. Sarcopenia in hiding: The risk and consequence of underestimating muscle dysfunction in nonalcoholic steatohepatitis. Hepatology. (2017) 66:2055–65. doi: 10.1002/hep.29420
36. Cruz-Jentoft AJ, Sayer AA. Sarcopenia. Lancet. (2019) 393:2636–46. doi: 10.1016/S0140-6736(19)31138-9
37. Hong HC, Hwang SY, Choi HY, Yoo HJ, Seo JA, Kim SG, et al. Relationship between sarcopenia and nonalcoholic fatty liver disease: the Korean sarcopenic obesity study. Hepatology. (2014) 59:1772–8. doi: 10.1002/hep.26716
38. Koo BK, Kim D, Joo SK, Kim JH, Chang MS, Kim BG, et al. Sarcopenia is an independent risk factor for non-alcoholic steatohepatitis and significant fibrosis. J Hepatol. (2017) 66:123–31. doi: 10.1016/j.jhep.2016.08.019
39. Norman K, Stobaus N, Gonzalez MC, Schulzke JD, Pirlich M. Hand grip strength: outcome predictor and marker of nutritional status. Clinical nutrition. (2011) 30:135–42. doi: 10.1016/j.clnu.2010.09.010
40. Wu H, Ballantyne CM. Skeletal muscle inflammation and insulin resistance in obesity. J Clin Invest. (2017) 127:43–54. doi: 10.1172/JCI88880
41. Zhang HJ, Zhang XF, Ma ZM, Pan LL, Chen Z, Han HW, et al. Irisin is inversely associated with intrahepatic triglyceride contents in obese adults. J Hepatol. (2013) 59:557–62. doi: 10.1016/j.jhep.2013.04.030
42. Ozturk ZA, Kul S, Turkbeyler IH, Sayiner ZA, Abiyev A. Is increased neutrophil lymphocyte ratio remarking the inflammation in sarcopenia? Exp Gerontol. (2018) 110:223–9. doi: 10.1016/j.exger.2018.06.013
43. Peverill W, Powell LW, Skoien R. Evolving concepts in the pathogenesis of NASH: beyond steatosis and inflammation. Int J Mol Sci. (2014) 15:8591–638. doi: 10.3390/ijms15058591
44. Miller AM, Wang H, Bertola A, Park O, Horiguchi N, Ki SH, et al. Inflammation-associated interleukin-6/signal transducer and activator of transcription 3 activation ameliorates alcoholic and nonalcoholic fatty liver diseases in interleukin-10-deficient mice. Hepatology. (2011) 54:846–56. doi: 10.1002/hep.24517
45. Loomis AK, Kabadi S, Preiss D, Hyde C, Bonato V, St Louis M, et al. Body Mass Index and Risk of Nonalcoholic Fatty Liver Disease: Two Electronic Health Record Prospective Studies. J Clin Endocrinol Metab. (2016) 101:945–52. doi: 10.1210/jc.2015-3444
46. Motamed N, Sohrabi M, Ajdarkosh H, Hemmasi G, Maadi M, Sayeedian FS, et al. Fatty liver index vs waist circumference for predicting non-alcoholic fatty liver disease. World J Gastroenterol. (2016) 22:3023–30. doi: 10.3748/wjg.v22.i10.3023
47. Tak YJ, Lee JG, Yi YH, Kim YJ, Lee S, Cho BM, et al. Association of handgrip strength with dietary intake in the Korean population: findings based on the seventh korea national health and nutrition examination survey (KNHANES VII-1), 2016. Nutrients. (2018) 10:1180. doi: 10.3390/nu10091180
48. Jia Q, Xia Y, Zhang Q, Wu H, Du H, Liu L, et al. Dietary patterns are associated with prevalence of fatty liver disease in adults. Eur J Clin Nutr. (2015) 69:914–21. doi: 10.1038/ejcn.2014.297
49. Saadeh S, Younossi ZM, Remer EM, Gramlich T, Ong JP, Hurley M, et al. The utility of radiological imaging in nonalcoholic fatty liver disease. Gastroenterology. (2002) 123:745–50. doi: 10.1053/gast.2002.35354
50. Chen F, Esmaili S, Rogers GB, Bugianesi E, Petta S, Marchesini G, et al. Lean NAFLD: a distinct entity shaped by differential metabolic adaptation. Hepatology. (2020) 71:1213–27. doi: 10.1002/hep.30908
Keywords: hand grip strength, non-alcoholic fatty liver disease, cohort, China, general adults
Citation: Xia Y, Cao L, Liu Y, Wang X, Zhang S, Meng G, Zhang Q, Liu L, Wu H, Gu Y, Wang Y, Zhang T, Wang X, Sun S, Zhou M, Jia Q, Song K, Niu K and Zhao Y (2021) Longitudinal Associations Between Hand Grip Strength and Non-Alcoholic Fatty Liver Disease in Adults: A Prospective Cohort Study. Front. Med. 8:752999. doi: 10.3389/fmed.2021.752999
Received: 04 August 2021; Accepted: 29 September 2021;
Published: 29 October 2021.
Edited by:
Juan Armendariz-Borunda, University of Guadalajara, MexicoReviewed by:
Fernando Romeiro, São Paulo State University, BrazilManas Kumar Panigrahi, All India Institute of Medical Sciences Bhubaneswar, India
Copyright © 2021 Xia, Cao, Liu, Wang, Zhang, Meng, Zhang, Liu, Wu, Gu, Wang, Zhang, Wang, Sun, Zhou, Jia, Song, Niu and Zhao. This is an open-access article distributed under the terms of the Creative Commons Attribution License (CC BY). The use, distribution or reproduction in other forums is permitted, provided the original author(s) and the copyright owner(s) are credited and that the original publication in this journal is cited, in accordance with accepted academic practice. No use, distribution or reproduction is permitted which does not comply with these terms.
*Correspondence: Kaijun Niu, bmtqMDgwOUBnbWFpbC5jb20=; bml1a2FpanVuQHRtdS5lZHUuY24=; Yuhong Zhao, emhhb3l1aG9uZ0Bzai1ob3NwaXRhbC5vcmc=
†These authors have contributed equally to this work and share first authorship
‡These authors have contributed equally to this work and share last authorship