
95% of researchers rate our articles as excellent or good
Learn more about the work of our research integrity team to safeguard the quality of each article we publish.
Find out more
ORIGINAL RESEARCH article
Front. Med. , 04 October 2021
Sec. Precision Medicine
Volume 8 - 2021 | https://doi.org/10.3389/fmed.2021.715250
This article is part of the Research Topic Computational Genomics and Structural Bioinformatics in Personalized Medicines View all 18 articles
Objective: Long noncoding RNAs (lncRNAs) are key regulators during ovarian cancer initiation and progression and are involved in mediating autophagy. In this study, we aimed to develop a prognostic autophagy-related lncRNA signature for ovarian cancer.
Methods: Autophagy-related abnormally expressed lncRNAs were screened in ovarian cancer with the criteria values of |correlation coefficient| > 0.4 and p < 0.001. Based on them, a prognostic lncRNA signature was established. The Kaplan–Meier overall survival analysis was conducted in high- and low-risk samples in the training, verification, and entire sets, followed by receiver operating characteristics (ROCs) of 7-year survival. Multivariate Cox regression analysis was used for assessing the predictive independency of this signature after adjusting other clinical features. The associations between the risk scores and immune cell infiltration, PD-L1 expression, and sensitivity of chemotherapy drugs were assessed in ovarian cancer.
Results: A total of 66 autophagy-related abnormally expressed lncRNAs were identified in ovarian cancer. An autophagy-related lncRNA signature was constructed for ovarian cancer. High-risk scores were indicative of poorer prognosis compared with the low-risk scores in the training, verification, and entire sets. ROCs of 7-year survival confirmed the well-predictive efficacy of this model. Following multivariate Cox regression analysis, this model was an independent prognostic factor. There were distinct differences in infiltrations of immune cells, PD-L1 expression, and sensitivity of chemotherapy drugs between high- and low-risk samples.
Conclusions: This study constructed an autophagy-related lncRNA signature that was capable of predicting clinical outcomes and also therapeutic responses for ovarian cancer.
Ovarian cancer represents the major cause of death among gynecological malignancies (1). Surgery followed by chemotherapy (such as platinum and taxane) remained the first-line therapeutic strategy (2). Approximately 80% of the subjects originally respond to this therapy. Nevertheless, the majority of the subjects in late stages usually experienced recurrence following chemotherapy, thereby leading to an undesirable prognosis (5-year survival <50%). Hence, it is significant to probe into the pathogenesis of ovarian cancer and also predictive indicators for prognostic stratification.
Alterations in gene expression profiling have become fundamental laboratory tools for improving tumor diagnoses, survival outcomes, and also treatment responses, which overcome weaknesses of typical clinical and imaging features due to heterogeneity at the genetic and molecular levels (3). Dysregulated long non-coding RNAs (lncRNAs) such as LINC00189, CACNA1G-AS1, and CHRM3-AS2 have been implicated in ovarian cancer initiation and the progress, highlighting their promising functions as markers of precision medicine (4). Their correlations to survival outcomes and treatment responses are still indistinct in ovarian cancer. A few lncRNA-based expression signatures have been developed for predicting survival outcomes, status, and chemosensitivity in ovarian cancer. For instance, Zheng et al. developed a three-lncRNA signature (LOC101927151, LINC00861, and LEMD1-AS1) for predicting clinical outcomes of the subjects with ovarian cancer on the basis of copy number variation (5). Zhang et al. proposed a three-lncRNA signature (LINC01619, DLX6-AS1, and AC004943.2) that can predict survival and response of chemotherapy in ovarian cancer (6). In comparison to abundant lncRNAs identified by genome-wide studies, functionally lncRNAs require better characterization in ovarian cancer.
Autophagy, an evolutionarily conserved process, maintains cell homeostasis through a lysosomal degradation system that supports cell survival and also maintains homeostasis under various types of stress (7). Autophagy-based cell deaths provide molecular mechanisms and clinical implications upon ovarian cancer therapy (8). Thus, it is of significance to identify key regulators of autophagy for theoretical basis and clinical practice. Several studies have found that autophagy can be mediated by lncRNA regulators in ovarian cancer (9–12). For instance, GAS8-AS1 inhibits the progress of ovarian cancer by activation of autophagy through binding with Beclin1 (9). Moreover, lncRNA TUG1 induces autophagy-related paclitaxel resistance via sponging miR-29b-3p in ovarian cancer (10). Also, silencing HOTAIR enhances the sensitivity to cisplatin in ovarian cancer via inhibition of cisplatin-induced autophagy (11). LncRNA highly upregulated in liver cancer exerts a carcinogenic effect via targeting autophagy-related genes ATG7 and ITGB1 in an epithelial ovarian cancer (12). Thus, autophagy-related lncRNAs possess potential as prognostic indicators and therapeutic targets.
Ovarian cancer represents an insidious malignancy, which usually develops asymptomatically to late stages along with metastases, chemoresistance, and undesirable clinical outcomes (13). Autophagy is a key bioprocess during the initiation and progression of ovarian cancer (14). LncRNA regulators are involved in the autophagy process. There is still a lack of systematic analysis for identifying autophagy-related lncRNA signature for prediction of the survival outcomes of the patients with ovarian cancer. Herein, this study developed a prognostic autophagy-related lncRNA signature for ovarian cancer.
Among all databases, only the Cancer Genome Atlas (TCGA; https://portal.gdc.cancer.gov/) database has the RNA-seq expression profiling and corresponding clinical and prognostic information of ovarian cancer. Thus, we curated transcriptome data and clinical information containing age, survival time, recurrence, survival status, histologic grade, and pathologic stage of 379 ovarian cancer tissues from the TCGA database. Mutation annotation format (MAF) files of somatic mutation data of ovarian cancer samples were also downloaded from the TCGA database. Meanwhile, the RNA-seq expression profiles of 133 normal ovarian samples were obtained from the genotype tissue expression (GTEx; https://toil.xenahubs.net/download/GTEX_phenotype.gz) database (15). The RNA-seq counts values from the TCGA and GTEx databases were normalized and preprocessed by the TCGAbiolinks package (16). Based on the HUGO Gene Nomenclature Committee (HGNC; http://www.gene.ucl.ac.uk/cgi-bin/nomenclature/searchgenes.pl), lncRNAs and mRNAs were annotated (17).
Abnormally expressed lncRNAs between ovarian cancer and normal ovarian specimens were screened utilizing edgeR package (http://bioconductor.org) based on gene expression data (18). Adjusted p ≤ 0.05 and |log2fold change (FC)| ≥ 1 were set as the criteria values of abnormally expressed lncRNAs.
A total of 232 autophagy-related genes were retrieved from the Human Autophagy Database (HADb; http://www.autophagy.lu/). The correlation between abnormally expressed lncRNAs and autophagy-related genes was analyzed by psych package (https://CRAN.R-project.org/package=psych) with Pearson's correlation analysis. Autophagy-related lncRNAs were screened with the criteria values of |correlation coefficient| > 0.4 and p < 0.001.
By adopting the least absolute shrinkage and selection operator (LASSO) Cox regression analysis, this study constructed an autophagy-related lncRNA model utilizing the glmnet package (19). The association between the lncRNAs in this model and overall survival (OS) was assessed by univariate Cox regression analysis. LncRNAs with hazard ratio (HR) > 1 and p < 0.05 were risk factors, while those with HR <1 and p < 0.05 were protective factors. The risk score of each sample was determined. The formula was as follows: risk score = coefficient (lncRNA1) × expression (lncRNA1) + coefficient (lncRNA2) × expression (lncRNA2) + … + coefficient (lncRNAn) × expression (lncRNAn). The distributions of risk scores, survival status, and disease progress were assessed in the samples of ovarian cancer.
All the subjects with ovarian cancer were randomly separated into the training set and the validation set at a ratio of 1:1. The subjects with ovarian cancer were separated into high- and low-risk groups. The Kaplan–Meier survival analyses were carried out to assess the OS differences between high- and low-risk groups with survival package in the training set, validation set, and the whole dataset. Time-dependent receiver operating characteristic (ROCs) curves were depicted for estimating the predictive efficacy of survival time through risk score and other clinical features (age, pathologic stage, and histologic grade) utilizing the survival ROC package. Furthermore, the differences in the risk scores between patients with different histologic grades or pathologic stages were analyzed by one-way ANOVA. Multivariate Cox regression analysis was presented for evaluating whether the risk score could be independent of other clinical features including pathologic stage and histologic grade.
CIBERSORT algorithm (http://cibersort.stanford.edu/) can characterize cell compositions of complex tissues based on the gene expression profiles (20). This algorithm is superior to other methods in terms of noise, unknown mixture content, and closely related cell types. CIBERSORT algorithm was employed to characterize immune cell compositions (including B cells naïve, B cells memory, plasma cells, T cells CD8, T cells CD4, naïve T cells, CD4 memory resting, T cells CD4 memory activated, T cells follicular helper, T cells regulatory (Tregs), T cells gamma delta, NK cells resting, NK cells activated, monocytes, macrophages M0, macrophages M1, macrophages M2, dendritic cells resting, dendritic cells activated, mast cells resting, mast cells activated, eosinophils and neutrophils) in ovarian cancer tissues.
The fractions of stromal and immune cells were inferred in each ovarian cancer sample using the ESTIMATE algorithm (https://sourceforge.net/projects/estimateproject/) (21). The differences in immune and stromal scores were assessed between high- and low-risk samples of ovarian cancer by Student' t-test.
A total of 94 ovarian cancer-related chemotherapy drugs were collected from the Cancer Genome Project (CGP; version 2014). The pRRophetic package was employed to predict the clinical chemotherapeutic responses based on the gene expression profiles of ovarian cancer (22). The IC50 values of chemotherapy drugs were compared between high- and low-risk groups utilizing Student's t-test.
The “Masked Somatic Mutation” data were obtained and processed with VarScan software (version 2), a method for the detection of somatic mutation and copy number variation in exome data (23). The maftools package (24) was adopted to analyze the MAF of the somatic variants. The “titv” function classified single nucleotide polymorphisms (SNPs) into transitions (Ti) and transversions (Tv). The overall distribution of the six different SNVs and the proportion of transitions in each sample were evaluated. The oncoplot of the top 30 mutated genes was depicted by the “ComplexHeatmap” function. The “somaticInteractions” function was used to detect mutually exclusive or co-occurring genomes, which were tested by Fisher's exact test.
Pathways underlying the autophagy-related lncRNA signature were evaluated through GSEA package (25). The “c5.bp.v6.2.symbols.gm” gene set was curated from the Molecular Signatures Database, which was employed as a reference set. Terms with |nominal enrichment score (NES)| > 1.7 and nominal p < 0.05 were significantly enriched.
Herein, we retrieved RNA expression profiles of ovarian cancer and normal ovarian tissues from TCGA and GTEx datasets. Totally, 590 lncRNAs with adjusted p ≤ 0.05 and |log2FC| ≥ 1 were abnormally expressed in 379 specimens of ovarian cancer in comparison with the normal ovarian cancer (Figures 1A–C). There were 373 upregulated (Supplementary Table 1) and 217 downregulated (Supplementary Table 2) lncRNAs for ovarian cancer. We separately displayed the top 20 upregulated (Table 1) and downregulated (Table 2) lncRNAs for ovarian cancer (Figure 1D).
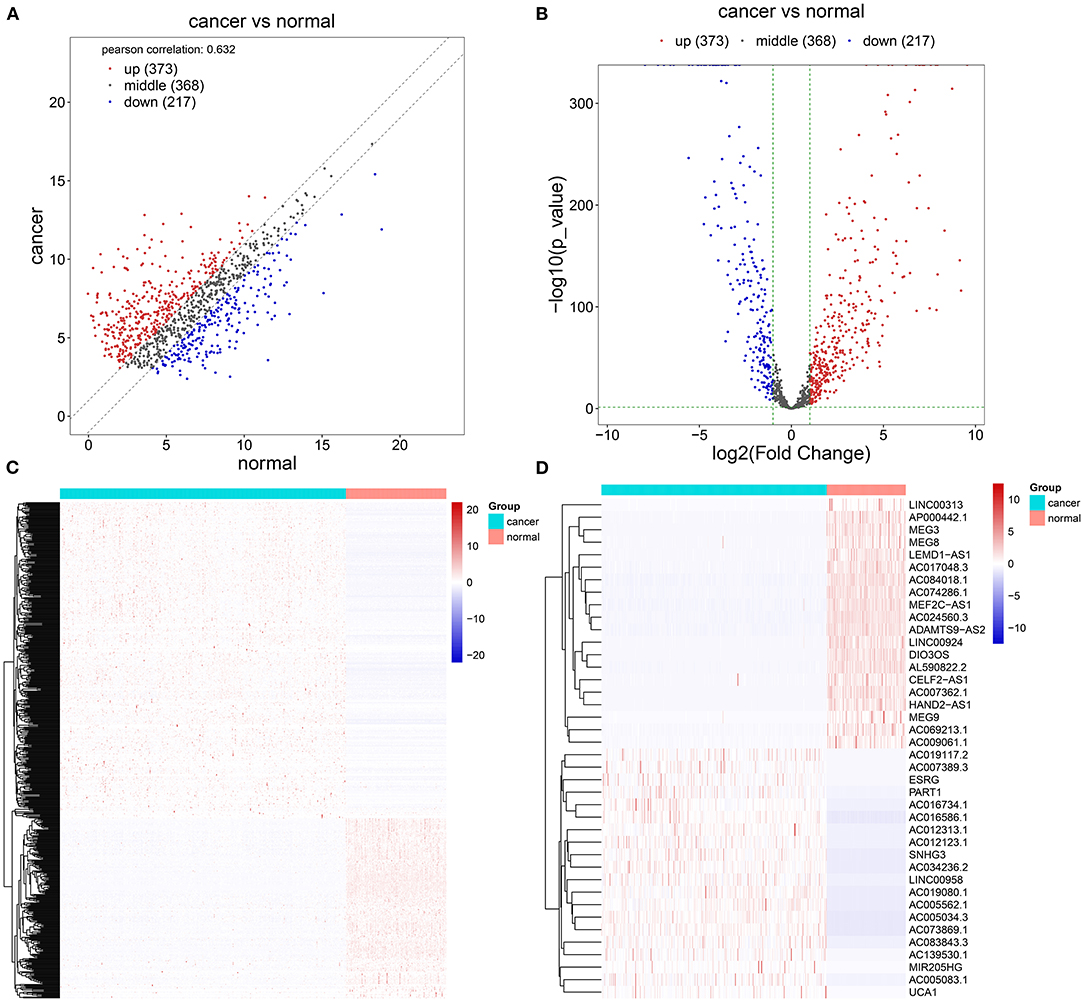
Figure 1. Screening abnormally expressed long noncoding RNAs (lncRNAs) between ovarian cancer and normal ovarian specimens using TCGA and GTEx datasets. (A–C) Scatter, volcano, and heatmap diagrams for the up (red) and downregulated (blue) lncRNAs in ovarian cancer and normal samples. (D) Heatmap for the top 20 up and downregulated lncRNAs for ovarian cancer.
The correlation between abnormally expressed lncRNAs and autophagy-related genes was evaluated by Pearson's correlation analysis, which was visualized into the heat map (Figure 2A; Supplementary Table 3). With the criteria values of |correlation coefficient| > 0.4 and p < 0.001, we selected 66 autophagy-related abnormally expressed lncRNAs, as shown in Table 3. Using LASSO regression analysis, we determined the regression coefficients of the 14 lncRNAs in the model (Figures 2B,C). The risk score of each specimen of ovarian cancer was calculated as follows: AC084018.1 expression * (−0.008315282) + AC092171.2 expression * 2.84E-05 + AP000695.1 * 0.395692194 + GAS6-AS1 expression * 0.028077942 + LINC00174 expression * 0.010226196 + LINC00893 expression * (−0.013179597) + LINC00996 expression * (−0.214479586) + MEIS1-AS3 expression * (−0.093561265) + MIR22HG expression * (−0.007661823) + NEAT1 expression * (0.000320475) + TEX26-AS1 expression * (−0.061717576) + U73169.1 expression * (−0.263275905) + UBE2Q1-AS1 expression * (−0.589381398) + USP30-AS1 expression * (−0.114206463). Univariate Cox regression analysis results showed that AP000695.1 (HR: 1.73, 95% CI: 1.05–2.85, p-value: 0.033) was a risk factor of ovarian cancer while LINC00996 (HR: 0.422, 95% CI: 0.235–0.758, p-value: 0.00388) and USP30-AS1 (HR: 0.794, 95% CI: 0.677–0.931, p-value: 0.00464) were protective factors of ovarian cancer (Figure 2D). In Figure 2E, we visualized the distributions of the risk scores of the patients with ovarian cancer. Also, we found that the risk scores displayed associations with survival status (Figure 2F) and disease progression (Figure 2G).
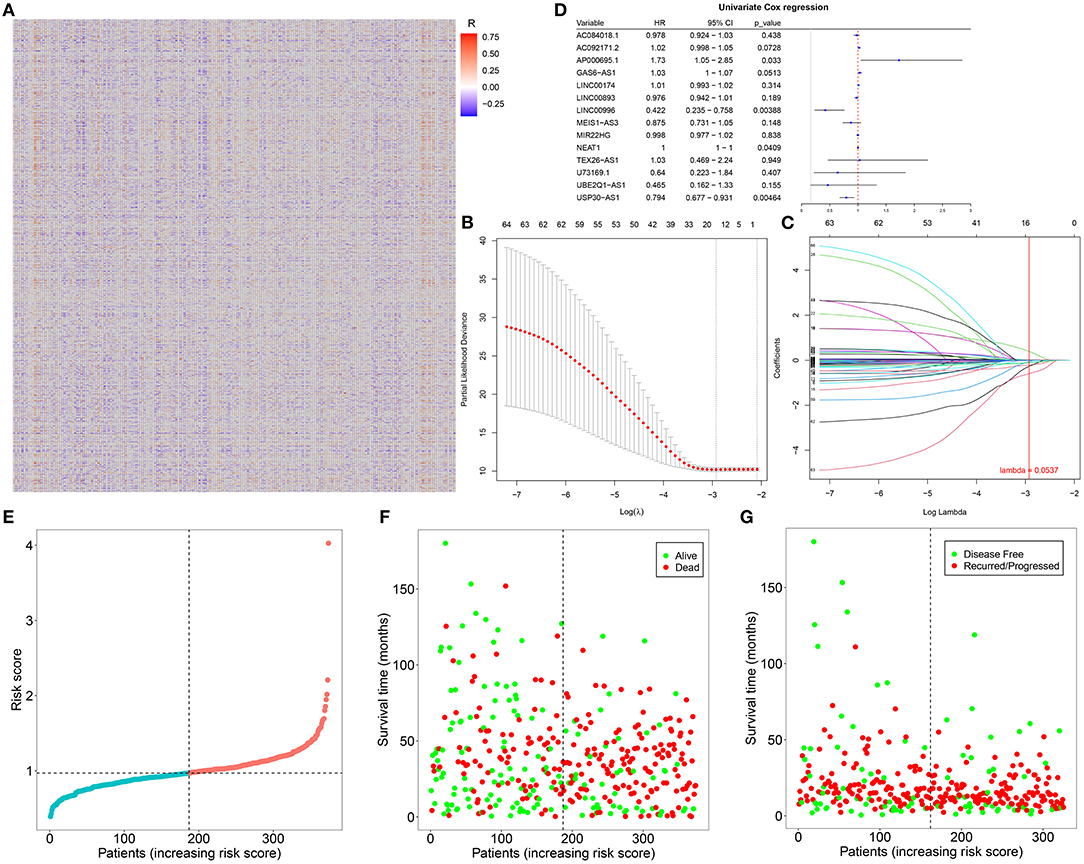
Figure 2. Construction of an autophagy-related lncRNA signature in ovarian cancer. (A) Heatmap for the correlation between abnormally expressed lncRNAs and autophagy-related genes in ovarian cancer specimens. Red indicates positive correlation while blue indicates negative correlation. (B) LASSO coefficient profiles based on autophagy-related abnormally expressed lncRNAs in ovarian cancer samples. (C) Selecting the optimal parameter (λ) in the LASSO model. (D) Forest plots for the univariate Cox regression analysis results of autophagy-related abnormally expressed lncRNAs. (E) The distributions of the risk scores of patients with ovarian cancer. (F,G) The distributions of survival status (green: alive and red: dead) and disease progress (green: disease-free and red: recurred/progressed) for the patients with ovarian cancer. Black dotted line indicates the median value of the risk scores.
Herein, all the patients with ovarian cancer were randomly separated into the training set and validation set (both n = 187) in Table 4. Based on the median value of the risk scores, the patients were divided into high- and low-risk groups. Our data showed that there were distinct differences in OS time between the two groups in the training set (p = 3.08e-10), validation set (p = 1.91e-03), and the whole dataset (p = 9.9e-10; Figures 3A–C). Patients in the low-risk group had prolonged OS duration in comparison with those in the high-risk group. ROCs were conducted to validate the predictive performance of this signature. The area under the curves under 7-year survival were 0.717, 0.747, and 0.727 in the training set, validation set, and the whole dataset, respectively (Figures 3D–F).
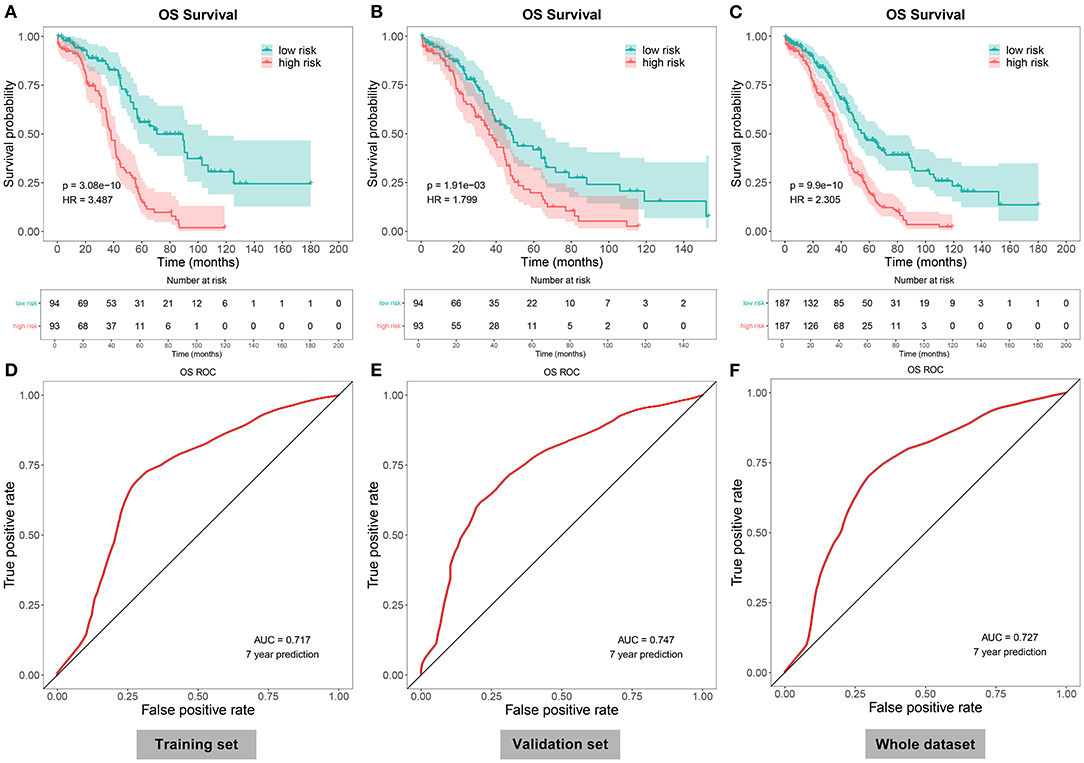
Figure 3. Evaluation of the autophagy-related lncRNA signature as a robust prognostic factor in ovarian cancer. (A–C) The Kaplan–Meier overall survival curves between high- and low-risk patients with ovarian cancer in the (A) training set, (B) validation set, and (C) the whole dataset. P-values for log-rank tests. (D–F) Receiver operating characteristics (ROCs) under 7-year survival in the (D) training set, (E) validation set, and (F) the whole dataset.
We further evaluated the correlations between the risk scores and other clinical features in specimens with ovarian cancer. As a result, lowered risk scores were detected in grade 3 than grade 2 (p = 8.55e-04; Figure 4A). Meanwhile, we found that the risk scores increased gradually as the pathologic stages increased (Figure 4B). The AUCs under 3-, 5-, and 7-year survival time were 0.602, 0.651, and 0.727 for the patients with ovarian cancer, indicating the well-predictive performance of this signature (Figure 4C). Furthermore, compared with the other clinical characteristics including age (AUC = 0.536), pathologic stage (AUC = 0.497), and histologic grade (AUC = 0.508), there was a higher AUC value under 7-year OS time for the risk score (Figure 4D). The data suggested that this risk score might possess higher sensitivity and accuracy in predicting the prognosis of the patients with ovarian cancer. Multivariate Cox regression analysis demonstrated that this risk score could be independently predictive of the prognosis of the patients (HR: 2.31, 95% CI: 1.75–3.03, p = 2.64e-09; Figure 4E).
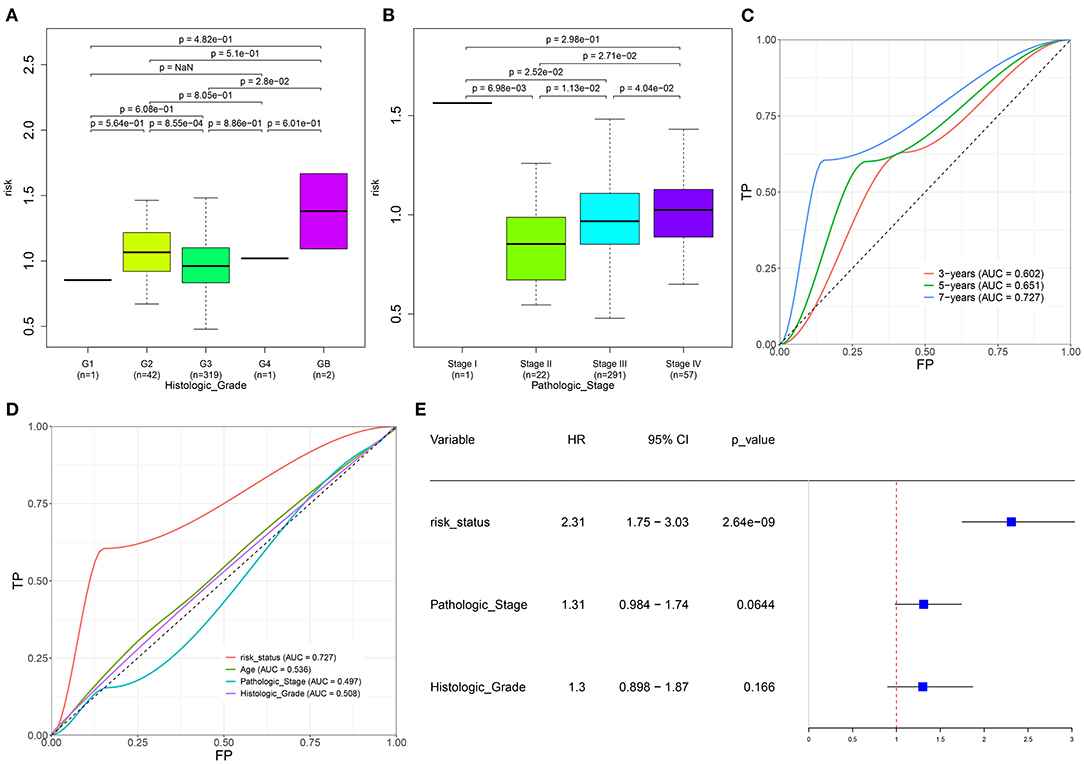
Figure 4. Evaluation of the autophagy-related lncRNA signature as an independent prognostic factor for ovarian cancer. (A,B) The distributions of the risk score in patients with ovarian cancer with different (A) histologic grades and (B) pathologic stages. (C) AUCs under 3-, 5-, and 7-year survival for the risk score. (D) AUCs under 7-year survival for the risk scores and other clinical features (age, pathologic stage, and histologic grade). (E) Multivariate Cox regression analysis of the risk score, pathologic stage, and histologic grade.
Here, we adopted the CIBERSORT algorithm to infer the immune cell infiltration in samples with ovarian cancer. Figure 5A visualized the proportions of 22 kinds of immune cell components in ovarian cancer tissues. Also, we analyzed the correlations between distinct immune cells. In Figure 5B, there were strong correlations between B cells naïve and macrophages M2 (r = 0.93), between B cells memory and monocytes (r = 0.98), between T cells CD4 naïve and T cells CD4 memory resting (r = 0.98), between T cells follicular helper and Tregs (r = 0.97), between T cells follicular helper and T cells gamma delta (r = 0.96), between Tregs and macrophages M0 (r = 0.97), between T cells gamma delta and mast cells activated (r = 0.92), and between monocytes and mast cells activated (r = 0.95) in ovarian cancer tissues. Also, heatmap visualized the differences in the immune cell infiltrations between high- and low-risk samples of the ovarian cancer (Figure 5C). Compared with the low-risk group, there were lowered infiltration levels of macrophages M1 (p < 0.0001), mast cells resting (p = 0.007), plasma cells (p = 0.003), T-cell CD8 (p = 0.016), and T-cell follicular helper (p = 0.001) and also higher infiltration levels of macrophages M2 (p = 0.003), mast cells activated (p < 0.0001), and neutrophils (p = 0.036) in the high-risk group (Figure 5D).
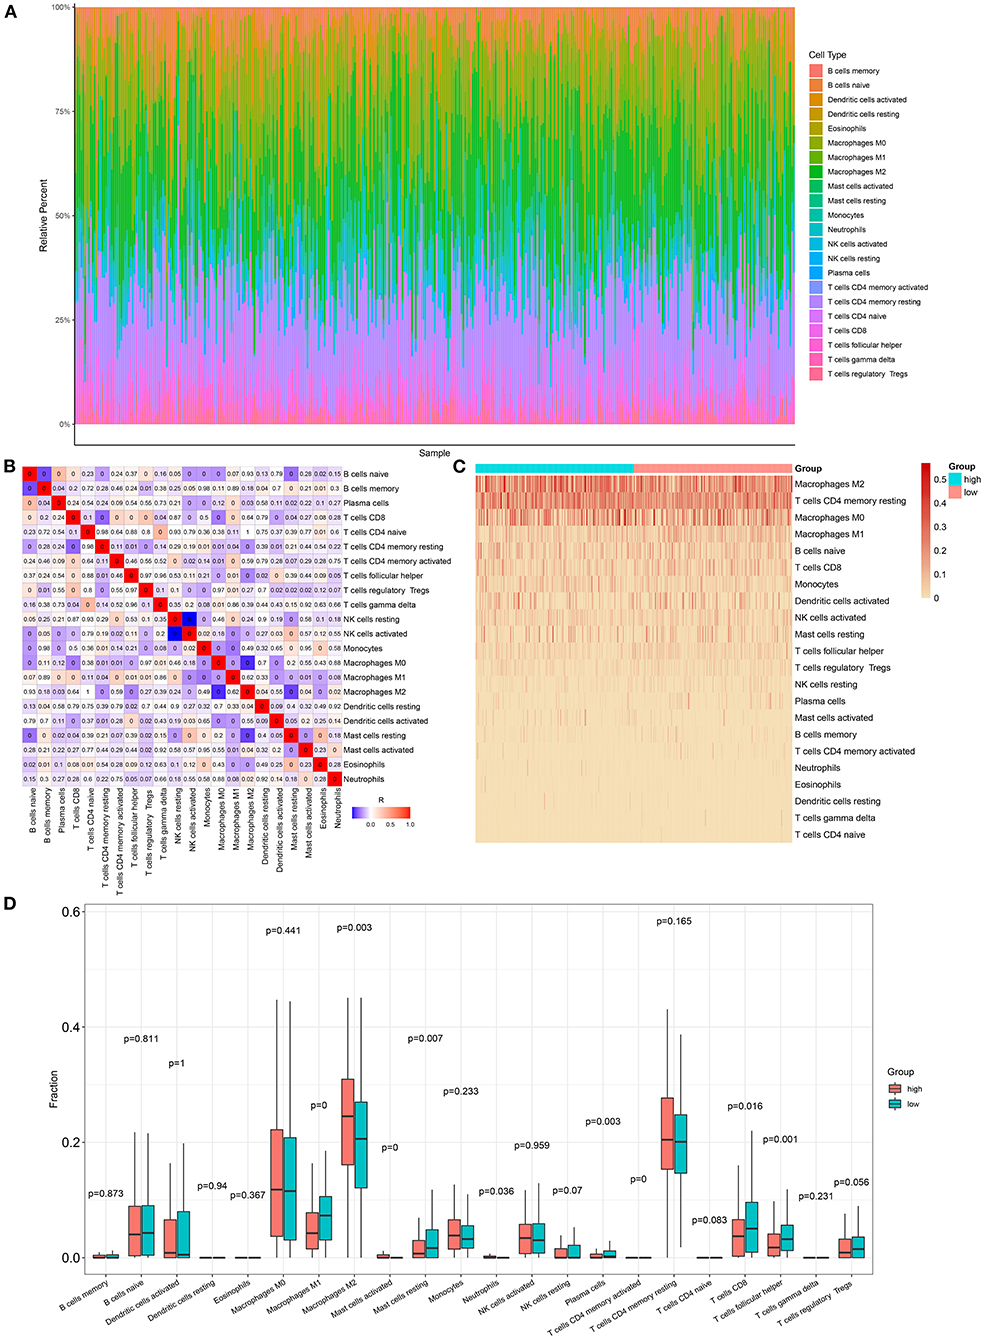
Figure 5. Association between the autophagy-related lncRNA signature and immune cell infiltration in ovarian cancer. (A) The proportions of different immune cell components in ovarian cancer tissues. (B) Heatmap for the correlations between different immune cells. The darker the color, the greater the |correlation coefficient|. Red: positive correlation and blue: negative correlation. (C) Heatmap for the infiltration levels of immune cells in the high- and low-risk samples with ovarian cancer. (D) Box plots for the differences in infiltration levels of immune cells between the high- and low-risk samples with ovarian cancer.
Herein, we observed whether the autophagy-related lncRNA signature was associated with the expression of immune checkpoints in ovarian cancer tissues. Higher LSECtin expression was found in the high-risk group compared with the low-risk group (Figure 6A). Furthermore, there was distinctly decreased PD-L1 expression in the low-risk group compared with the high-risk group (p = 2.79e-04; Figure 6B). We also assessed the correlations between the risk scores and immune or stromal scores. As a result, higher immune scores and lower stromal scores were detected in the high-risk samples compared with the low-risk samples, which were not statistically significant (Figures 6C,D).
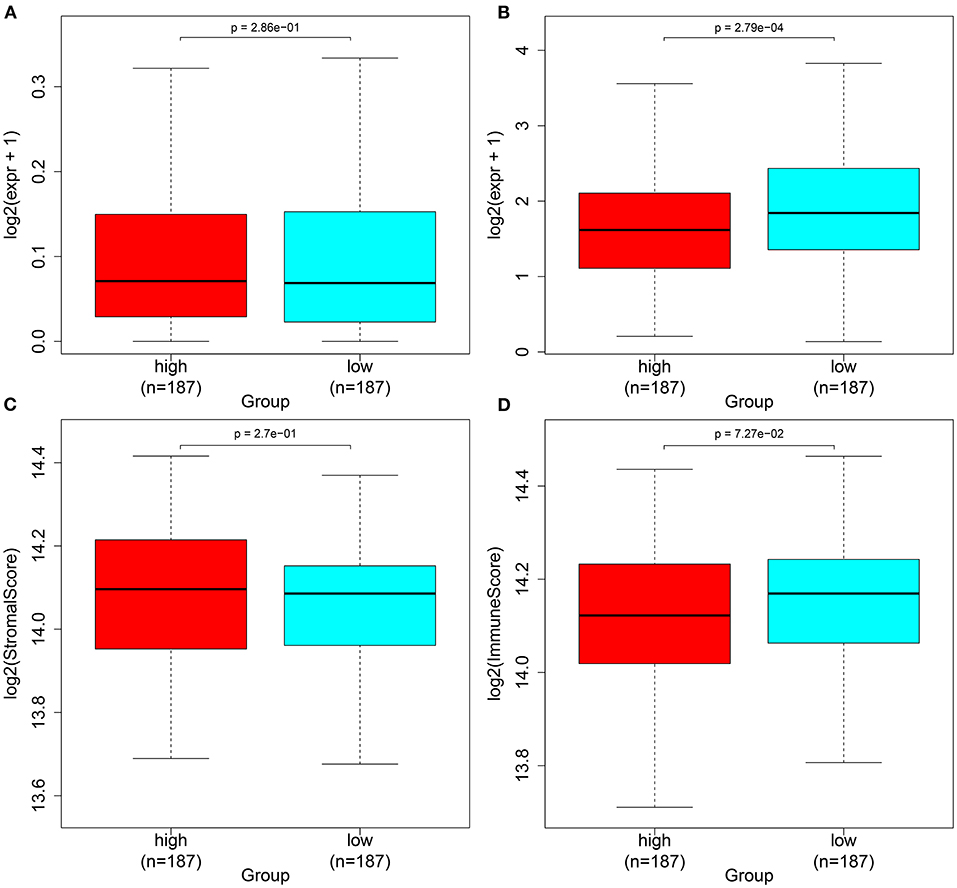
Figure 6. Associations between the autophagy-related lncRNA signature and immune checkpoints in ovarian cancer. (A,B) Box plots for the expression of immune checkpoints (A) LSECtin and (B) PD-L1 in the high- and low-risk groups. (C,D) Box plots for the (C) immune and (D) stromal scores in the high- and low-risk groups.
Based on the gene expression profiles, we predicted the responses to 94 chemotherapy drugs in each patient with ovarian cancer. Among them, there were significant differences in responses to 29 chemotherapy drugs with p < 0.05 between high- and low-risk patients with ovarian cancer, including CHIR.99021, methotrexate, cisplatin, bicalutamide, FH535, midostaurin, bexarotene, vinblastine, embelin, A.770041, bryostatin.1, GSK269962A, FTI.277, dasatinib, XMD8.85, WH.4.023, WZ.1.84, Obatoclax.Mesylate, thapsigargin, EHT.1864, cyclopamine, imatinib, RO.3306, AS601245, QS11, BMS.536924, mitomycin.C, JNK.9L, and etoposide (Figure 7; Supplementary Table 4).
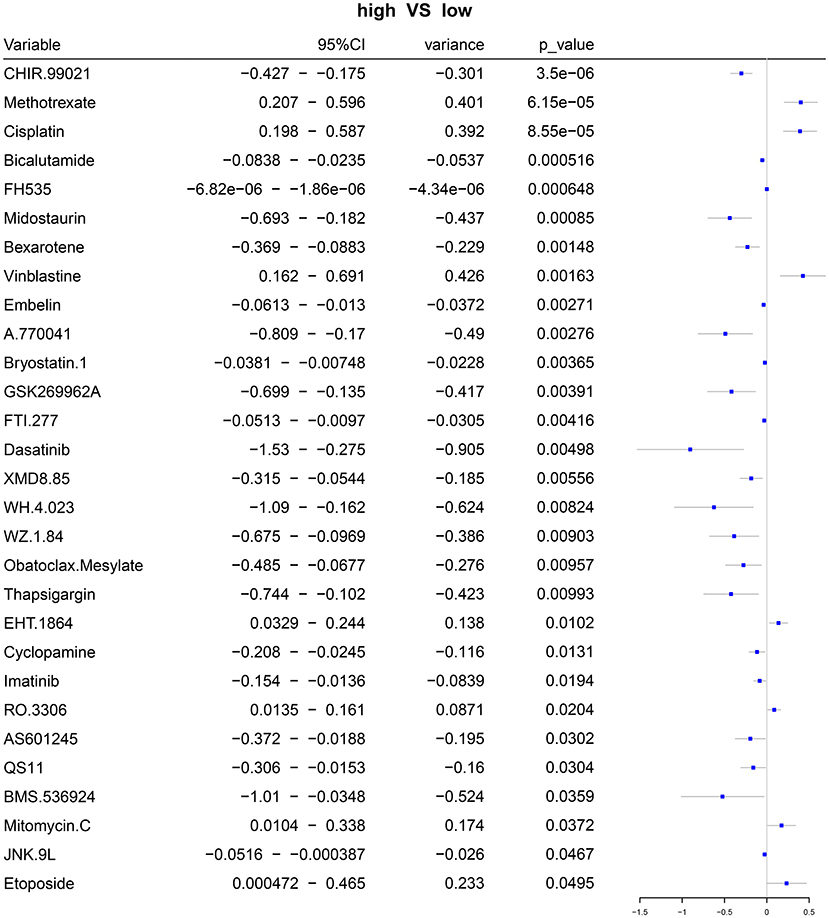
Figure 7. Forest plots for the differences in IC50 values of chemotherapy drugs between the high- and low-risk samples with ovarian cancer.
We further analyzed the somatic mutation landscapes in specimens of ovarian cancer. Both in the high- (Figure 8A) and low-risk (Figure 8B) samples, missense mutation was the most common mutation type. TP53 was the top-ranked mutated gene, followed by TTN. C > T mutation had the highest proportion in the two groups (Figures 8C,D). Furthermore, potential druggable categories targeted mutated genes were predicted, such as the druggable genome, clinically actionable, and kinase in the high- (Figure 8E) and low-risk (Figure 8F) samples. Approximately 98.48% of samples occurred genetic mutations in the high-risk samples (Figure 9A) and 99.28% of the occurred mutations in the low-risk samples (Figure 9B). Many genes co-occur in cancer or show strong exclusivity in their mutation patterns. Here, we visualized the close interactions between the mutated genes in the high- and low-risk samples (Figures 9C,D).
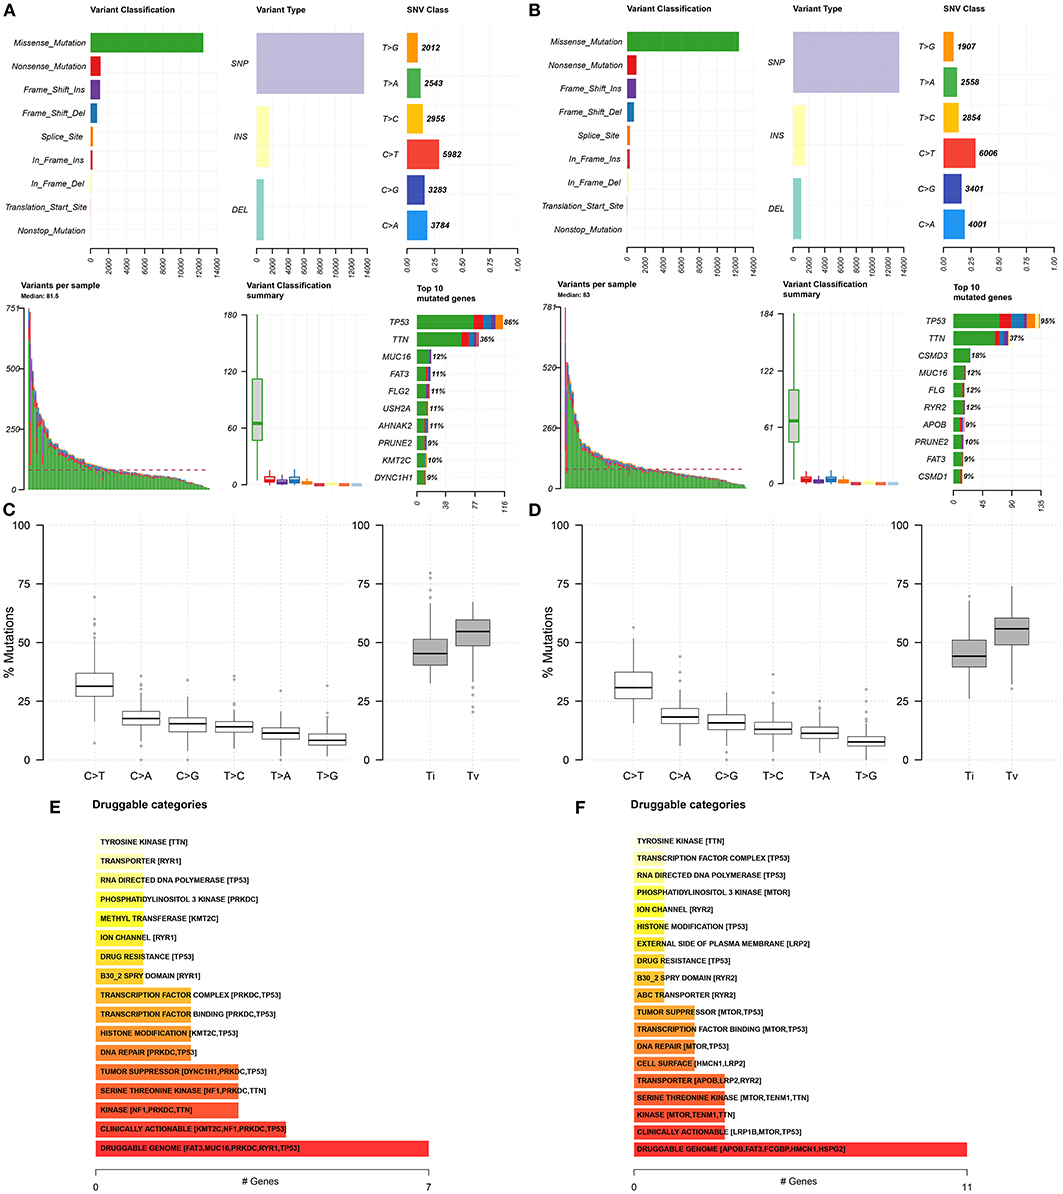
Figure 8. Somatic mutation landscapes in ovarian cancer. (A,B) The summary of mutation types and mutated genes in the high- and low-risk samples with ovarian cancer. (C,D) The overall distribution of the six different Single-nucleotide variants and the proportion of transitions in the high- and low-risk samples with ovarian cancer. (E,F) Druggable categories based on the mutated genes in the high- and low-risk samples.
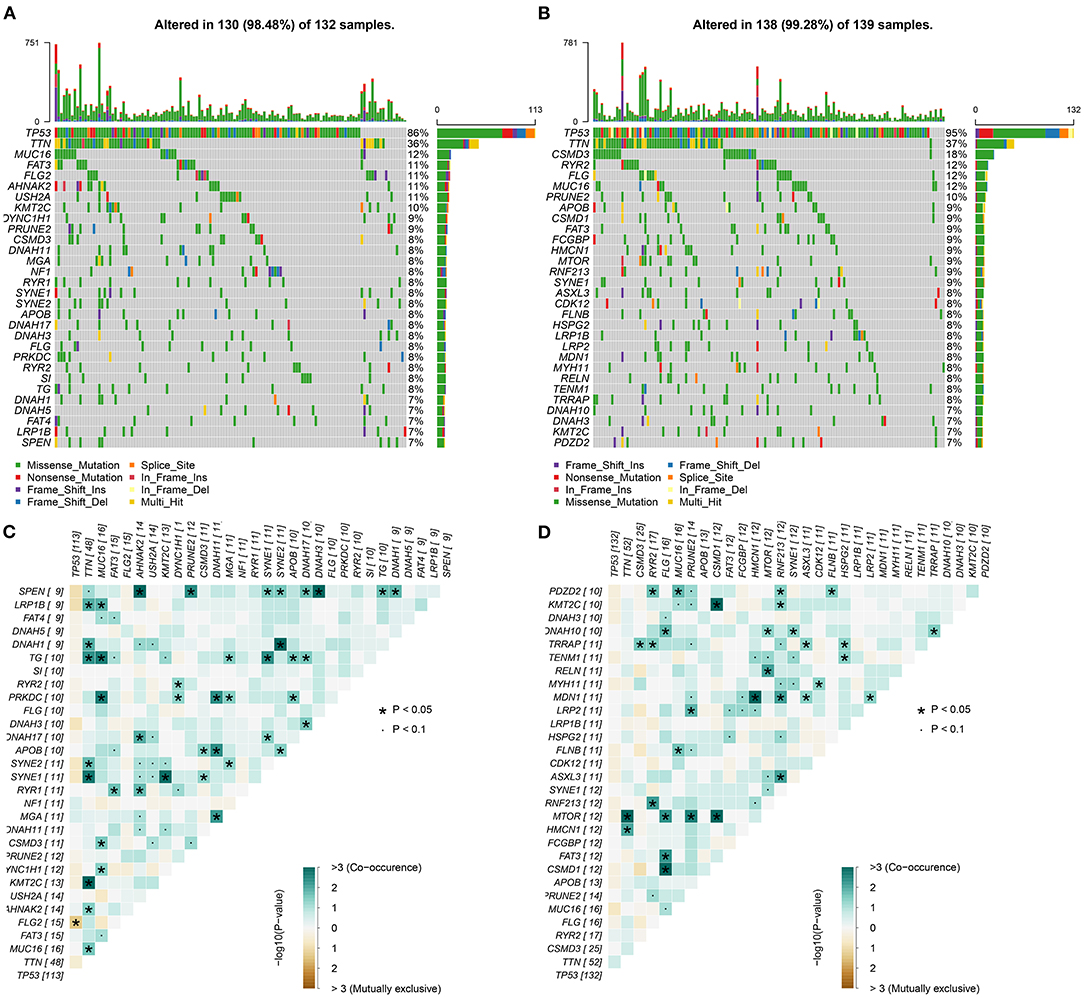
Figure 9. Mutated genes and their interactions in ovarian cancer. (A,B) Oncoplots for the top 30 mutated genes in the high- and low-risk samples with ovarian cancer. (C,D) The interactions between the mutated genes. The darker the color, the stronger the co-occurrence.
To explore the significant signaling pathways underlying the autophagy-related lncRNA signature, this study carried out GSEA by comparing high- and low-risk groups. As shown in Figure 10, we observed that ribosome (NES = 1.90 and nominal p = 0.019), oxidative phosphorylation (NES = 1.76 and nominal p = 0.037), and Parkinson's disease (NES = 1.74 and nominal p = 0.035) were markedly activated in the high-risk group. Meanwhile, various types of N-glycan biosynthesis (NES = −1.84 and nominal p = 0.002), lysosome (NES = −1.87 and nominal p = 0.002), and circadian rhythm (NES = −2.08 and nominal p < 0.0001) were enriched significantly in the low-risk group.
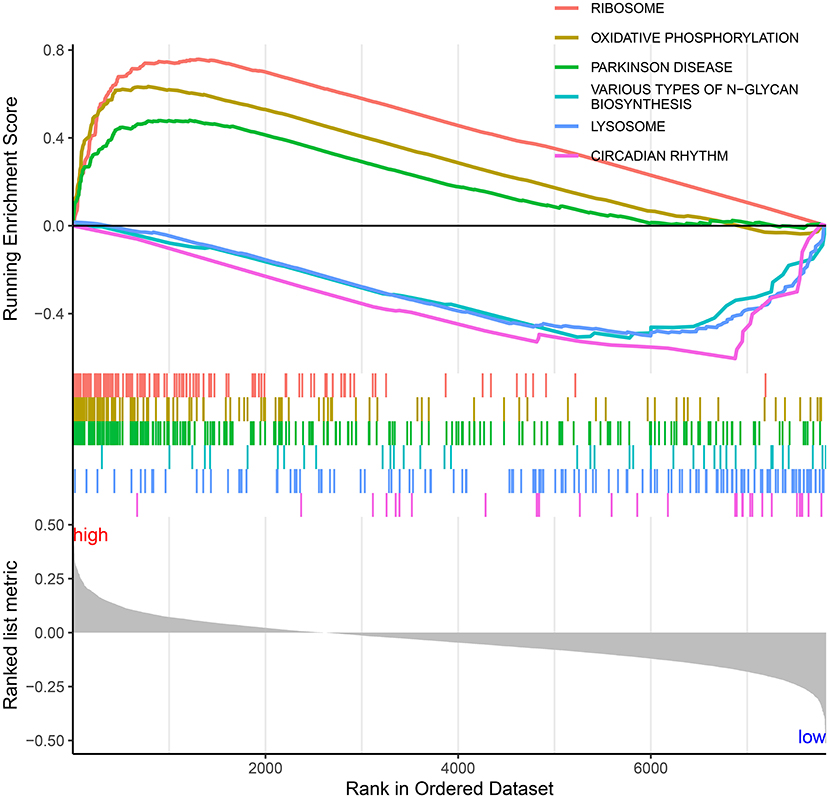
Figure 10. Significant signaling pathways underlying the autophagy-related lncRNA signature by Gene set enrichment analysis.
As per a previous study, 17 autophagy-related lncRNAs have been identified as prognostic predictors of ovarian cancer (26). Nevertheless, a single autophagy-related lncRNA often has limited predictive power. Furthermore, the established clinical prognostic biomarkers have limited accuracy and specificity. It has been confirmed that gene models exhibit higher predictive power than a single gene (5). This study employed the LASSO regression method to establish an autophagy-related lncRNA signature containing AC084018.1, AC092171.2, AP000695.1, GAS6-AS1, LINC00174, LINC00893, LINC00996, MEIS1-AS3, MIR22HG, NEAT1, TEX26-AS1, U73169.1, UBE2Q1-AS1, and USP30-AS1 for ovarian cancer based on abnormally expressed autophagy-related lncRNA profiles. After verification, this signature robustly and independently predicted the survival outcomes of the patients with ovarian cancer. Among the 14 lncRNAs in this signature, GAS6-AS1 exerts a carcinogenic effect in the breast cancer (27) and hepatocellular carcinoma (28). LINC00174 promotes glioma progression via miR-152-3p/SLC2A1 axis (29). LINC00893 suppresses papillary thyroid cancer by inactivating the AKT pathway and stabilizing PTEN (30). USP30-AS1 expression is related to autophagy in the bladder urothelial carcinoma (31). More experiments require to verify the regulatory roles of these lncRNAs on autophagy.
As immunogenic cancers, the spontaneous anticancer immune responses may increase survival duration, and the immune escape may cut down survival duration (32). In the recent years, several immune-based strategies such as immune checkpoint inhibition, vaccination, and antigen-specific active immunotherapy have been developed in ovarian cancer (33). The immune-suppressive networks in the tumor microenvironment have been considered for immunotherapy implementation (34). The immune-related markers may be utilized for predicting the responses to immunotherapy (35). Hence, the interactions between molecules and tumor microenvironment require in-depth exploration. Our study demonstrated that the autophagy-related lncRNA signature was in relation to infiltrations of macrophages M1, mast cells resting, plasma cells, T-cell CD8, T-cell follicular helper, macrophages M2, mast cells activated, and neutrophils, indicating the crosstalk between these autophagy-related lncRNAs and immune cells. Consistently, Deng et al. identified a novel autophagy-related lncRNA model that was distinctly related to the infiltrations of immune cells in pancreatic cancer (36). Ovarian cancer represents a low immune-reactive malignancy with restricted immune cell infiltrations and extensive immunosuppressive T cell infiltrations (37). Tumors positive for PD-L1 usually exhibit a higher response to immune checkpoint inhibition therapy, and highly expressed PD-L1 is a predictor of undesirable clinical outcomes (37). Here, our data showed that the low-risk ovarian cancer patients had higher PD-L1 expression in comparison to those with high risk.
Chemotherapy (platinum and taxanes) plays a fundamental role in adjuvant therapy against ovarian cancer (38). Despite the initial response to this therapy, most of the patients diagnosed with ovarian cancer developed chemotherapy resistance (39). This resistance may be driven by a range of mechanisms. Hence, it is of importance to develop individual markers for the prediction of the sensitivity to chemotherapy. Our data showed that the risk scores were in relation to 29 chemotherapy drugs such as cisplatin, indicating that the autophagy-related lncRNAs were involved in chemotherapy sensitivity, as a previous study (11).
Collectively, this study provided a knowledge base of novel autophagy-related lncRNAs in ovarian cancer, improving the understanding of the functions of lncRNA on the regulation of autophagy in ovarian cancer. We established an autophagy-related lncRNA signature as a robust prognostic marker for the prediction of survival outcomes, immunotherapy response, and chemotherapy sensitivity. Our findings may assist to precisely guide therapeutic strategies for individual patients with ovarian cancer in clinical practice.
The original contributions presented in the study are included in the article/Supplementary Material, further inquiries can be directed to the corresponding author/s.
JiW conceived and designed the study. YL and JuW conducted most of the experiments and data analysis and wrote the manuscript. FW, CG, and YC participated in collecting data and helped to draft the manuscript. All authors reviewed and approved the manuscript.
The authors declare that the research was conducted in the absence of any commercial or financial relationships that could be construed as a potential conflict of interest.
All claims expressed in this article are solely those of the authors and do not necessarily represent those of their affiliated organizations, or those of the publisher, the editors and the reviewers. Any product that may be evaluated in this article, or claim that may be made by its manufacturer, is not guaranteed or endorsed by the publisher.
The Supplementary Material for this article can be found online at: https://www.frontiersin.org/articles/10.3389/fmed.2021.715250/full#supplementary-material
Supplementary Table 1. The list of upregulated lncRNAs in ovarian cancer tissues.
Supplementary Table 2. The list of downregulated lncRNAs in ovarian cancer tissues.
Supplementary Table 3. The correlation analysis results between abnormally expressed lncRNAs and autophagy-related genes.
Supplementary Table 4. The list of chemotherapy drugs.
LncRNAs, long non-coding RNAs; TCGA, The Cancer Genome Atlas; GTEx, Genotype-Tissue Expression; FC, fold change; LASSO, least absolute shrinkage and selection operator; OS, overall survival; HR, hazard ratio; ROC, receiver operating characteristic; ESTIMATE, Estimation of STromal and Immune cells in Malignant Tumor tissues using Expression data.
1. Herrera FG, Irving M, Kandalaft LE, Coukos G. Rational combinations of immunotherapy with radiotherapy in ovarian cancer. Lancet Oncol. (2019) 20:e417–e33. doi: 10.1016/S1470-2045(19)30401-2
2. Das T, Anand U, Pandey SK, Ashby CR Jr., Assaraf YG, et al. Therapeutic strategies to overcome taxane resistance in cancer. Drug Resist Updat. (2021) 55:100754. doi: 10.1016/j.drup.2021.100754
3. Malone ER, Oliva M, Sabatini PJB, Stockley TL, Siu LL. Molecular profiling for precision cancer therapies. Genome Med. (2020) 12:8. doi: 10.1186/s13073-019-0703-1
4. Yang H, Gao L, Zhang M, Ning N, Wang Y, Wu D, et al. Identification and analysis of an epigenetically regulated five-lncRNA signature associated with outcome and chemotherapy response in ovarian cancer. Front Cell Dev Biol. (2021) 9:644940. doi: 10.3389/fcell.2021.644940
5. Zheng M, Hu Y, Gou R, Nie X, Li X, Liu J, et al. Identification three LncRNA prognostic signature of ovarian cancer based on genome-wide copy number variation. Biomed Pharmacother. (2020) 124:109810. doi: 10.1016/j.biopha.2019.109810
6. Zhang M, Wang G, Zhu Y, Wu D. Characterization of BRCA1/2-Directed ceRNA network identifies a novel three-lncRNA signature to predict prognosis and chemo-response in ovarian cancer patients with wild-type BRCA1/2. Front Cell Dev Biol. (2020) 8:680. doi: 10.3389/fcell.2020.00680
7. Levy JMM, Towers CG, Thorburn A. Targeting autophagy in cancer. Nat Rev Cancer. (2017) 17:528–42. doi: 10.1038/nrc.2017.53
8. Zhou J, Jiang YY, Chen H, Wu YC, Zhang L. Tanshinone I attenuates the malignant biological properties of ovarian cancer by inducing apoptosis and autophagy via the inactivation of PI3K/AKT/mTOR pathway. Cell Prolif. (2020) 53:e12739. doi: 10.1111/cpr.12739
9. Fang YJ, Jiang P, Zhai H, Dong JS. LncRNA GAS8-AS1 inhibits ovarian cancer progression through activating beclin1-mediated autophagy. Onco Targets Ther. (2020) 13:10431–40. doi: 10.2147/OTT.S266389
10. Gu L, Li Q, Liu H, Lu X, Zhu M. Long noncoding RNA TUG1 Promotes autophagy-associated paclitaxel resistance by sponging miR-29b-3p in ovarian cancer cells. Onco Targets Ther. (2020) 13:2007–19. doi: 10.2147/OTT.S240434
11. Yu Y, Zhang X, Tian H, Zhang Z, Tian Y. Knockdown of long non-coding RNA HOTAIR increases cisplatin sensitivity in ovarian cancer by inhibiting cisplatin-induced autophagy. J Buon. (2018) 23:1396–401.
12. Chen S, Wu DD, Sang XB, Wang LL, Zong ZH, Sun KX, et al. The lncRNA HULC functions as an oncogene by targeting ATG7 and ITGB1 in epithelial ovarian carcinoma. Cell Death Dis. (2017) 8:e3118. doi: 10.1038/cddis.2017.486
13. Braga EA, Fridman MV, Moscovtsev AA, Filippova EA, Dmitriev AA, Kushlinskii NE. LncRNAs in ovarian cancer progression, metastasis, and main pathways: ceRNA and alternative mechanisms. Int J Mol Sci. (2020) 21:8855. doi: 10.3390/ijms21228855
14. Zhu H, Gan X, Jiang X, Diao S, Wu H, Hu J. ALKBH5 inhibited autophagy of epithelial ovarian cancer through miR-7 and BCL-2. J Exp Clin Cancer Res. (2019) 38:163. doi: 10.1186/s13046-019-1159-2
15. Human Genomics. The genotype-tissue expression (GTEx) pilot analysis: multitissue gene regulation in humans. Science. (2015) 348:648–60. doi: 10.1126/science.1262110
16. Colaprico A, Silva TC, Olsen C, Garofano L, Cava C, Garolini D, et al. TCGAbiolinks: an R/Bioconductor package for integrative analysis of TCGA data. Nucleic Acids Res. (2016) 44:e71. doi: 10.1093/nar/gkv1507
17. Eyre TA, Ducluzeau F, Sneddon TP, Povey S, Bruford EA, Lush MJ. The HUGO gene nomenclature database, 2006 updates. Nucleic Acids Res. (2006) 34 (Database issue):D319–21. doi: 10.1093/nar/gkj147
18. Robinson MD, McCarthy DJ, Smyth GK. edgeR: a bioconductor package for differential expression analysis of digital gene expression data. Bioinformatics. (2010) 26:139–40. doi: 10.1093/bioinformatics/btp616
19. Engebretsen S, Bohlin J. Statistical predictions with glmnet. Clin Epigenetics. (2019) 11:123. doi: 10.1186/s13148-019-0730-1
20. Newman AM, Liu CL, Green MR, Gentles AJ, Feng W, Xu Y, et al. Robust enumeration of cell subsets from tissue expression profiles. Nat Methods. (2015) 12:453–7. doi: 10.1038/nmeth.3337
21. Yoshihara K, Shahmoradgoli M, Martínez E, Vegesna R, Kim H, Torres-Garcia W, et al. Inferring tumour purity and stromal and immune cell admixture from expression data. Nat Commun. (2013) 4:2612. doi: 10.1038/ncomms3612
22. Geeleher P, Cox N, Huang RS. pRRophetic: an R package for prediction of clinical chemotherapeutic response from tumor gene expression levels. PLoS ONE. (2014) 9:e107468. doi: 10.1371/journal.pone.0107468
23. Koboldt DC, Zhang Q, Larson DE, Shen D, McLellan MD, Lin L, et al. VarScan 2: somatic mutation and copy number alteration discovery in cancer by exome sequencing. Genome Res. (2012) 22:568–76. doi: 10.1101/gr.129684.111
24. Mayakonda A, Lin DC, Assenov Y, Plass C, Koeffler HP. Maftools: efficient and comprehensive analysis of somatic variants in cancer. Genome Res. (2018) 28:1747–56. doi: 10.1101/gr.239244.118
25. Subramanian A, Tamayo P, Mootha VK, Mukherjee S, Ebert BL, Gillette MA, et al. Gene set enrichment analysis: a knowledge-based approach for interpreting genome-wide expression profiles. Proc Natl Acad Sci USA. (2005) 102:15545–50. doi: 10.1073/pnas.0506580102
26. Meng C, Zhou JQ, Liao YS. Autophagy-related long non-coding RNA signature for ovarian cancer. J Int Med Res. (2020) 48:300060520970761. doi: 10.1177/0300060520970761
27. Li S, Jia H, Zhang Z, Wu D. LncRNA GAS6-AS1 facilitates the progression of breast cancer by targeting the miR-324-3p/SETD1A axis to activate the PI3K/AKT pathway. Eur J Cell Biol. (2020) 99:151124. doi: 10.1016/j.ejcb.2020.151124
28. Ai J, Sun J, Zhou G, Zhu T, Jing L. Long non-coding RNA GAS6-AS1 acts as a ceRNA for microRNA-585, thereby increasing EIF5A2 expression and facilitating hepatocellular carcinoma oncogenicity. Cell Cycle. (2020) 19:742–57. doi: 10.1080/15384101.2020.1729323
29. Shi J, Zhang Y, Qin B, Wang Y, Zhu X. Long non-coding RNA LINC00174 promotes glycolysis and tumor progression by regulating miR-152-3p/SLC2A1 axis in glioma. J Exp Clin Cancer Res. (2019) 38:395. doi: 10.1186/s13046-019-1390-x
30. Li S, Zhang Y, Dong J, Li R, Yu B, Zhao W, et al. LINC00893 inhibits papillary thyroid cancer by suppressing AKT pathway via stabilizing PTEN. Cancer Biomark. (2020) 30:277–286. doi: 10.3233/CBM-190543
31. Sun Z, Jing C, Xiao C, Li T. An autophagy-related long non-coding RNA prognostic signature accurately predicts survival outcomes in bladder urothelial carcinoma patients. Aging. (2020) 12:15624–37. doi: 10.18632/aging.103718
32. Kandalaft LE, Powell DJ Jr., Singh N, Coukos G. Immunotherapy for ovarian cancer: what's next? J Clin Oncol. (2011) 29:925–33. doi: 10.1200/JCO.2009.27.2369
33. Kandalaft LE, Odunsi K, Coukos G. Immunotherapy in Ovarian cancer: are we there yet? J Clin Oncol. (2019) 37:2460–71. doi: 10.1200/JCO.19.00508
34. Shimizu K, Iyoda T, Okada M, Yamasaki S, Fujii SI. Immune suppression and reversal of the suppressive tumor microenvironment. Int Immunol. (2018) 30:445–54. doi: 10.1093/intimm/dxy042
35. Darvin P, Toor SM, Sasidharan Nair V, Elkord E. Immune checkpoint inhibitors: recent progress and potential biomarkers. Exp Mol Med. (2018) 50:1–11. doi: 10.1038/s12276-018-0191-1
36. Deng Z, Li X, Shi Y, Lu Y, Yao W, Wang J. A novel autophagy-related IncRNAs signature for prognostic prediction and clinical value in patients with pancreatic cancer. Front Cell Dev Biol. (2020) 8:606817. doi: 10.3389/fcell.2020.606817
37. Majidpoor J, Mortezaee K. The efficacy of PD-1/PD-L1 blockade in cold cancers and future perspectives. Clin Immunol. (2021) 226:108707. doi: 10.1016/j.clim.2021.108707
38. Perez-Fidalgo JA, Grau F, Fariñas L, Oaknin A. Systemic treatment of newly diagnosed advanced epithelial ovarian cancer: from chemotherapy to precision medicine. Crit Rev Oncol Hematol. (2021) 158:103209. doi: 10.1016/j.critrevonc.2020.103209
Keywords: ovarian cancer, autophagy, lncRNAs, signature, prognosis, tumor microenvironment
Citation: Li Y, Wang J, Wang F, Gao C, Cao Y and Wang J (2021) Development and Verification of an Autophagy-Related lncRNA Signature to Predict Clinical Outcomes and Therapeutic Responses in Ovarian Cancer. Front. Med. 8:715250. doi: 10.3389/fmed.2021.715250
Received: 26 May 2021; Accepted: 30 August 2021;
Published: 04 October 2021.
Edited by:
Balu Kamaraj, Imam Abdulrahman Bin Faisal University, Saudi ArabiaReviewed by:
Abdul Azeez Sayed, Imam Abdulrahman Bin Faisal University, Saudi ArabiaCopyright © 2021 Li, Wang, Wang, Gao, Cao and Wang. This is an open-access article distributed under the terms of the Creative Commons Attribution License (CC BY). The use, distribution or reproduction in other forums is permitted, provided the original author(s) and the copyright owner(s) are credited and that the original publication in this journal is cited, in accordance with accepted academic practice. No use, distribution or reproduction is permitted which does not comply with these terms.
*Correspondence: Jianhua Wang, amlhaHV3QDE2My5jb20=
†These authors have contributed equally to this work
Disclaimer: All claims expressed in this article are solely those of the authors and do not necessarily represent those of their affiliated organizations, or those of the publisher, the editors and the reviewers. Any product that may be evaluated in this article or claim that may be made by its manufacturer is not guaranteed or endorsed by the publisher.
Research integrity at Frontiers

Learn more about the work of our research integrity team to safeguard the quality of each article we publish.