 Laura Hoffmann1†
 Katja Hatz
- 1Vista Klinik, Binningen, Switzerland
- 2Department of Vision Science and Optometry, University of Aalen, Aalen, Germany
- 3Faculty of Medicine, University of Basel, Basel, Switzerland
In patients with neovascular age-related macular degeneration (nAMD) there is often an inconsistency between their subjective visual impairment and a still relatively preserved standard Early Treatment of Diabetic Retinopathy Study (ETDRS) best corrected visual acuity. Therefore, in order to better capture the specific functional defects in nAMD, other tests need to be evaluated. In a previous study, we reported contrast sensitivity of the better eye to best correlate with near distance and distance vision related quality of life in patients with bilateral nAMD. Here, we evaluated Pelli-Robson contrast sensitivity, ETDRS visual acuity, low luminance visual acuity and Radner maximum reading speed and correlated them with several morphologic parameters as measured on fundus autofluorescence imaging, optical coherence tomography and optical tomography angiography in 54 patients. A multiple regression analysis was performed which correlated each visual function parameter with the anatomic features. The results showed the strongest correlations between the total area of macular geographic atrophy as well as the percentage of geographic atrophy in the central 1 mm and contrast sensitivity. Further, the regression model selected the total area of macular geographic atrophy, the photoreceptor inner and outer segments interface disruption score, the presence of subretinal fibrosis in the central 1 mm and the central retinal thickness as the variables that explained 71% of the variation in contrast sensitivity when including all eyes. Hence, our results suggest that among the evaluated measures of vision, contrast sensitivity is best correlated with the morphologic impairment in bilateral nAMD. Thus, contrast sensitivity may complement ETDRS visual acuity in clinical trials and serve as a standard diagnostic tool in clinical practice.
Introduction
Age-related macular degeneration (AMD) represents the leading cause of blindness in the elderly in the industrialized world and a major public health concern (1). As a result of the current demographic development, a considerable rise in the affected subjects is estimated in the future (2). Despite typically mild visual impairment in the early stages, the progression of the disease results in a severe central visual loss, which causes disability especially when both eyes are involved (3, 4). Progressive AMD is either represented by macular neovascularization (MNV) or an advanced stage of dry AMD mainly characterized by geographic atrophy (GA) of the outer retina and the retinal pigment epithelium (RPE) which might initially spare the fovea (5, 6). Eyes with neovascular AMD (nAMD) sometimes show GA zones at diagnosis or develop GA as well as subretinal scarring of MNV over the long-term (7). Subretinal fibrosis and GA, both leading to defects in the outer retina, account for the principal causes of vision loss in nAMD (8).
Typically, while patches of atrophy primarily present in the parafovea leading to difficulties in near-distance vision-related tasks such as reading, the central distance visual acuity [standard Early Treatment of Diabetic Retinopathy Study (ETDRS) protocol measurement at 4 m] is still relatively preserved (9). The loss of the RPE results in the decline of the photoreceptors so that the areas of GA correspond to an absolute scotoma (10). Within those lesions and, to a lesser extent in the still functional retina, a reduction in retinal sensitivity can be measured by the use of microperimetry (11, 12). In addition, with the enlargement of GA, a decrease in retinal sensitivity occurs (6, 13). The areas of reduced retinal sensitivity correlate morphologically with an impairment of the outer retina as observed by Optical Coherence Tomography (OCT), namely a disruption of the photoreceptors' inner and outer segments (IS/OS) interface and loss of the external limiting membrane (ELM) (14–16).
However, in AMD an inconsistency exists between the severity of the morphologic impairment and visual function since a wide range of visual acuity is observed in clinical practice (17). Furthermore, conventional high-contrast best-corrected visual acuity (BCVA) testing (ETDRS at 4 m), which is widely used in clinical practice and trials, does not adequately correlate with the patient's ability to execute vision-related tasks under conditions of everyday life. Even in the early stages, patients experience difficulties under low lightning and low contrast conditions, while central distance visual acuity is still reasonably intact (18). Hence, other functional tests have been evaluated to better correlate with the subjective visual impairment. Contrast sensitivity (CS) and low-luminance visual acuity (LLVA) have been reported to best capture the specific functional impairment in AMD when compared to healthy controls (19, 20). For our study population, contrast sensitivity is also documented to strongest correlate with patient's vision-related quality of life as measured by the National Eye Institute Visual Function Questionnaire (NEI-VFQ25) (21).
These findings suggest to evaluate whether alternative functional visual measures might be more reflective of macular morphology than conventional BCVA testing. Several quantitative and qualitative morphologic parameters, namely the retinal thickness, subretinal fibrosis and location of GA have been shown to correlate with standard distance visual acuity (15, 22–24). Furthermore, pre-existing RPE atrophy and disruption in the ELM are described to serve as predictors for an early poor visual response to anti-vascular endothelial growth factor (anti-VEGF) treatment in nAMD (7). Due to the heterogeneity of the morphologic impairment in AMD, data suggest that a combination of factors including location, size and component of the lesions explain the variety of visual function in AMD (23, 25). Currently, there are few studies describing the influence of foveal involvement of fibrosis and GA and size and location of MNV on contrast sensitivity which, in addition, did not use the latest image acquisition devices (23, 26, 27).
Amendments in OCT technology reveal detailed insight in outer retinal layer changes in eyes with AMD (28). Nevertheless, there are currently limited data correlating systemically alternative visual testing parameters and the plenitude of morphologic parameters as measured by fundus autofluorescence (FAF), spectral domain OCT (SD-OCT) and swept source OCT Angiography (SS-OCT-A). Therefore, the aim of our study was to evaluate the relations between different measures of visual function (distance acuity, contrast sensitivity, reading speed and LLVA) and morphologic characteristics in patients with bilateral nAMD to identify validated morphologic parameters which may serve as endpoints in clinical practice and research.
Patients and Methods
This was a cross-sectional, non-interventional and single-visit study of patients treated at the Vista Klinik, Binningen, Switzerland with a clinically confirmed diagnosis of bilateral nAMD by a retina specialist. The study received approval from the local ethics approval board [Ethikkommission Nordwestschweiz (EKNZ No. 2016-002216)] and was performed in accordance with the tenets of the Declaration of Helsinki and Good Clinical Practice (ICH-GCP). The study is registered at ClinicalTrial.gov (NCT 03438669).
Data were obtained between February 2017 and October 2017. Patients had to meet the following inclusion criteria to be eligible: age ≥ 55 years, bilateral nAMD with AMD-related lesions such as MNV or GA or subretinal fibrosis or pigment epithelial detachment (PED) within the central 1 mm ETDRS grid subfield confirmed by Spectral Domain Optical Coherence Tomography (SD-OCT; Spectralis, Heidelberg Eng., Heidelberg, Germany) and Swept-Source-OCT-Angiography (SS-OCTA; Plex Elite 9000, Carl-Zeiss Meditec, Dublin, USA), best corrected visual acuity (BCVA) of at least 49 letters (Snellen equivalent 20/100 or better) in the better eye using ETDRS charts at a distance of 4 m, sufficiently clear ocular media and adequate pupillary dilation and fixation permitting quality fundus imaging. All eyes were currently treated with intravitreal anti-vascular endothelial growth factor (VEGF) agents. Exclusion criteria were significant ocular disease other than neovascular AMD or a history of neurologic disease or cognitive impairment.
Visual Function Assessment
Study examinations took place no earlier than 4 days after the last intravitreal treatment and were always performed in the same order. All patients underwent a standardized refraction protocol with ETDRS BCVA at 4 m in designated rooms with an ambient illumination of 97–109 lux evaluated with a calibrated illuminometer. LLVA testing was realized immediately afterwards following the LLVA testing protocol of our clinic. First light switches were turned off and then the block out shutters were closed in order to have the ETDRS light box as the only illumination left. LLVA testing took place once the patients were ready to continue and no difficulties adapting to the lower lighting conditions were reported. Since the testing was not always performed in the same rooms because of differing vacancies and time of appointment, the illumination varied slightly between 02 and 10l ux. The low luminance deficit (LLD) was defined as the number of ETDRS letters read in standard BCVA testing minus LLVA. Maximal reading speed was tested monocularly and binocularly with Radner reading charts (Precision Vision, Inc.). Contrast sensitivity was measured using Pelli Robson charts (Precision Vision, Inc.) at 1 m. Further details of the visual function assessment in this study are described elsewhere (21).
Retinal Imaging Analysis
Morphological impairment was evaluated with SD-OCT (Heidelberg Engineering, Germany), using the following scans: horizontal volume scan 19 sections, macular star 9 sections and horizontal 6 mm scan. Grading was performed by two masked physicians according to a standardized protocol (LH, MG). The foveola was localized in the volume scans to overlay an ETDRS grid centered on the fovea. All lesions seen on OCT, FAF and OCT-A scans were classified dichotomously depending on presence or absence in each of the nine subfields of the disposed ETDRS grid. Lesions were then summarized as located within the central 1, 3, or 6 mm ring.
Photoreceptor inner segment and outer segments (IS/OS) interface and external limiting membrane (ELM) disruption were evaluated by calculating the mean of the score in the horizontal and vertical scans of the macular star scan (29). Disruption was graded as 0 (no disruption in 1 mm center), 1 (mild disruption <1/4 in 1 mm center), 2 (1/4 to 3/4 disruption in 1 mm center) and 3 (>3/4 disruption in 1 mm center) (29). Central subfield thickness (CRT) analysis was performed after centering of the scan and manual alignment of the automated lines. All scans were graded with regard to the presence of subretinal fibrosis and pigment epithelial detachment (PED). Subretinal fibrosis was considered as subretinal hyper-reflective material at the level above the retinal pigment epithelium. PED was defined as a focal elevation of the retinal pigment epithelium presenting with a height ≥200 μm or a width ≥400 μm (30). Maximum height of pigment epithelial detachment in the central 1 mm was measured.
Geographic atrophy (GA) was assessed by fundus autofluorescence imaging acquired with confocal scanning laser ophthalmoscope (HRA, Heidelberg Engineering, Germany) with an excitation wavelength of 488 nm and an emission spectrum of 500–700 nm. The GA pattern was classified as focal or multifocal and the surface area was measured with the built-in free-hand draw tool. Percentage of the spared surface within the central 1 mm ring was calculated.
All OCT-A analyses were performed with PLEX Elite 9000 Swept-Source OCT Angiography (Carl Zeiss Meditec Inc, Dublin, USA) using a 6 mm scan centered on the fovea. Manual correction was carried out to ensure an accurate segmentation. The CNV membrane was located in the en face OCT-A slabs of the outer retinal layer and choriocapillaris (ORCC) and surface was measured using the Image J tool (NIH Image, Bethesda, MD).
Statistical Analysis
Statistical analysis was performed using SPSS statistical package version 21 (SPSS, Inc., Chicago, IL). Data are presented as mean ± standard deviation (SD) or percentages, as appropriate. Lesions were subdivided depending on their presence or absence in the central 1, 3, or 6 mm ring and an unpaired t-test for comparison of means was used to test for differences in visual function between these groups. P-values for multiple comparisons were adjusted according to the Bonferroni-Holm adjustment (31). To evaluate correlations between morphologic and visual function parameters, Pearson correlation coefficients were calculated. Afterwards a multiple regression analysis was performed using the variables which were previously statistically significantly correlated with visual function as explanatory variables. To reduce potential collinearity, highly correlated variables (r > 0.90) were not included in the same model. Backward stepwise elimination was performed to select independent explanatory parameters. Each time a visual function parameter was used as the dependant variable and the model with the highest coefficient of determination (R2) was chosen. Despite the known dependence of both eyes of a patient (31), here data are reported for the better, the worse and for both eyes of each patient nevertheless in order to evaluate a possible early biomarker reflective of retinal morphology when comparing the correlations with retinal morphology according to the status of the eye. P-values <0.05 were considered statistically significant.
Results
Patient Characteristics
This study included 108 eyes from 54 patients with a mean age of 79.7 ± 7.8 years. 53.7% of patients were female, 46.3% were male.
Visual Function
Detailed analysis of the assessment of visual function of the study population has been described elsewhere (21). Mean BCVA for all eyes was 66.75 ± 24.33 ETDRS letters (0.37 ± 1.21 logMAR) with a statistically significant difference between the better and the worse eye (78.91 ± 7.93 letters (0.12 ± 1.54 logMAR) and 47.43 ± 35.96 letters (0.75 ± 0.98 logMAR), respectively, p < 0.001), see Table 1. Mean LLVA showed comparable results with a mean of 66.06 ± 24.17 letters (0.38 ± 1.22 logMAR). Mean contrast sensitivity for all eyes was 1.21 ± 0.42 log units. Mean binocular maximum reading speed did not differ significantly from mean maximum reading speed of the better eye (p = 0.7287). Mean monocular maximum reading speed for all eyes was significantly lower than binocular maximum reading speed (96.87 ± 48.16 wpm, p < 0.001).
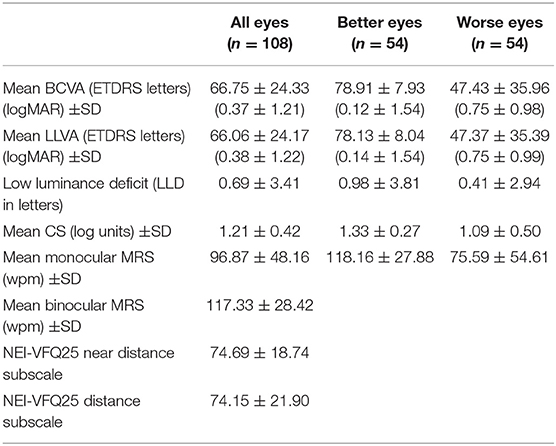
Table 1. Visual assessment.
Morphologic Parameters
Morphological characteristics are summarized in Table 2. There was a statistically significant difference for all of these parameters regarding the status of the eyes (better vs. worse eyes, p < 0.01) except for mean total area of CNV, presence of PED in the central 1 mm and disruption of the IS/OS interface in the central 1 mm. 26.9% of all eyes (n = 29) presented without geographic atrophy. For all other eyes, mean area of total macular GA was 3.02 ± 6.67 mm2, mean percentage of GA in the central 1 mm was 19.40 ± 32.99%. Considering only the eyes with GA (n = 79), 49.4% presented with multifocal GA. 63.9% of all eyes (n = 69) had sparing in the central 1 mm.
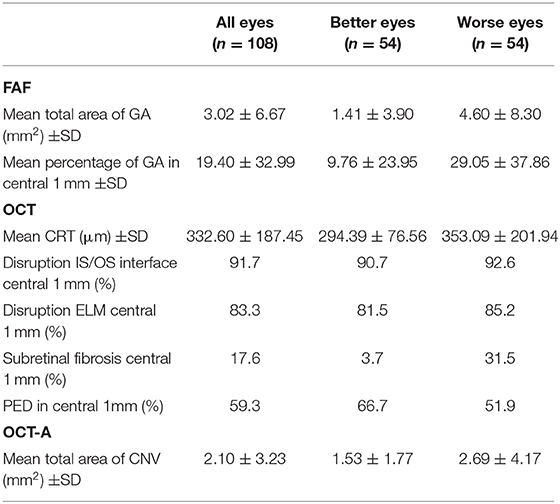
Table 2. Morphologic characteristics.
Mean central retinal thickness (CRT) was 332.60 ± 187.45 μm, mean height of pigment epithelium detachment (PED) in the central 1 mm was 156.02 ± 103.41 μm. 8.3% of all eyes (n = 9) showed an intact junction of the photoreceptors inner and outer segments (IS/OS junction line) and 16.7% (n = 18) an intact external limiting membrane (ELM). 17.6% of all eyes (n = 19) presented with subretinal fibrosis and 59.3% (n = 64) with a PED in the central 1 mm. 25 eyes (23.1%) presented with reticular pseudodrusen (RPD). 82.4% of all eyes (n = 89) showed a clearly identifiable choroidal neovascularization membrane in the OCT-A scans. In the remaining eyes the identification of a clear CNV membrane was limited at the time of the study due to progressed fibrosis and/or GA following a long-term anti-vascular endothelial growth factor (anti-VEGF) treatment. Seventy eyes (64.8%) were initially fluorescein angiography diagnosed as occult lesions, 27 (25%) as minimally classic, 8 (7.4%) as predominantly classic, and three as retinal angiomatous proliferation. Mean area of CNV was 2.10 ± 3.23 mm2 (range 0–24.32 mm2). Thirty-five eyes had sparing in the central 1 mm.
Correlations Between Visual Acuity Parameters and FAF, OCT, and OCT-A Parameters
The correlations are presented for all eyes as well as separately for the better and the worse eyes, respectively, in Table 3. All visual acuity parameters were statistically significantly correlated with the GA parameters measured by FAF when considering all eyes (Table 3).
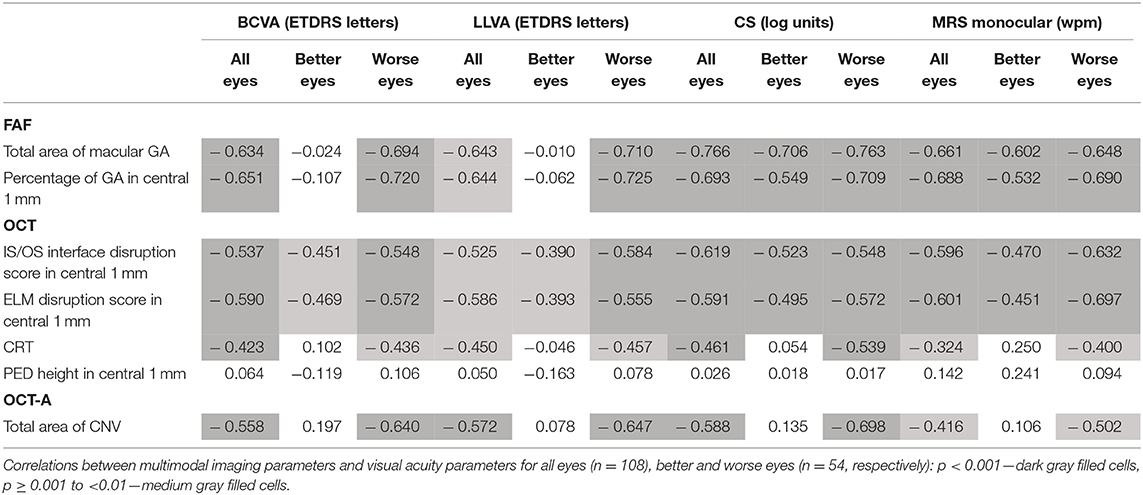
Table 3. Correlations between visual acuity measures, OCT, FAF and OCT-A parameters.
Strongest correlations were observed between contrast sensitivity and total area of macular GA (r = −0.766, p < 0.001) as well as percentage of GA in the central 1 mm (r = −0.693, p < 0.001) for all eyes. Interestingly, in the better eye group BCVA and LLVA did not correlate with the FAF parameters whereas CS and maximum reading speed still exhibited strong correlations. Figure 1 illustrates an eye with GA involving the central 1 mm but leaving an area of anatomic foveal preservation. The patient still had a well-preserved standard ETDRS distance BCVA of 80 letters but already showed a diminished CS and monocular MRS (1.20 log units and 81.28 wpm, respectively). For the correlations of maximum binocular reading speed and morphologic parameters, only the better eyes (n = 54) were included since there was no statistically significant difference between maximal binocular reading speed and maximal monocular reading speed of the better eyes. The binocular MRS was moderately correlated with the FAF parameters (r = −0.395, p = 0.001). Furthermore, significant associations were found between the NEI-VFQ25 near distance subscale and the total area of macular GA in the better eye group (r = −0.493, p = 0.001).
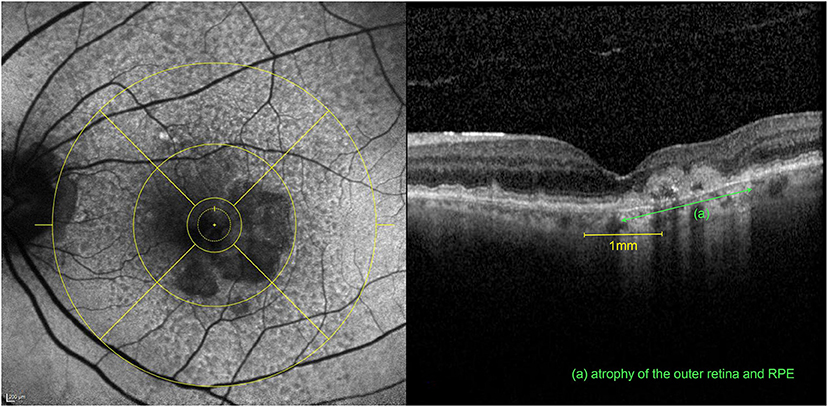
Figure 1. Multimodal imaging of the left eye of an 81-year-old patient after 6 intravitreal aflibercept and 19 ranibizumab injections for nAMD. The patient had a preserved BCVA of 80 letters ETDRS with an already diminished CS (1.20 log units) and monocular MRS (81.28 wpm) (compared to the mean values of all included eyes of 66.7 letters ETDRS, 1.21 log units CS and 96.9 wpm monocular MRS, respectively). Left: FAF image with an ETDRS grid overlay centered on the fovea with a horseshoe-shaped area of atrophy involving the central 1mm. Right: Corresponding volume OCT scan revealing at the same time, an area of intact anatomic preservation on the left, associated with an atrophy of the outer retina (ELM and IS/OS interface disruption) and the retinal pigment epithelium (RPE) (green) on the right within the fovea.
Considering the OCT parameters strong negative correlations were seen between IS/OS interface and ELM disruption score in the central 1 mm and all of visual acuity parameters except binocular MRS for which correlations were moderate (p < 0.001). Compared to the other functional measures, CS showed the strongest correlations with the mentioned OCT parameters with the highest correlation coefficient with the IS/OS interface disruption score when considering all eyes (r = −0.619, p < 0.001). The correlation coefficients were comparable between the better and the worse eye group although they were superior for CS than BCVA and LLVA in the better eyes. CRT exhibited moderate statistically significant negative correlations with all measures of visual acuity measured monocularly in the worse eyes. The maximal height of pigment epithelial detachment in the central 1 mm was not significantly correlated with visual function. Eyes with reticular pseudodrusen (n = 25) did not show a significant difference in BCVA (p =0.156), LLVA (p = 0.297), CS (p = 0.276), or MRS (p = 0.875) when compared to eyes without them (n = 83).
The total area of CNV exhibited moderate negative correlations with the visual acuity parameters with strongest correlation with contrast sensitivity for all eyes (r = −0.588, p < 0.001). However, the total area of CNV was not significantly correlated with visual function when including only the better eyes.
Relation Between Location of Lesions and Visual Acuity Parameters
Table 4 shows the influence of the presence or absence of each lesion component in the different ETDRS subfields on the different visual acuity parameters. The inner subfields of the ETDRS grid were summarized as the central 3 mm ring and the outer subfields as the central 6 mm ring. Comparison of means showed that all visual acuity parameters where significantly worse in the presence of geographic atrophy and subretinal fibrosis in the central 1, 3, and 6 mm ring when considering all eyes. A disrupted IS/OS interface and ELM in the central 3 mm, respectively, 6 mm was associated with a significantly lower CS both in the better and the worse eye group whereas BCVA and LLVA were not significantly changed. Eyes with a CNV in the central 3 mm exhibited a significantly worse CS, LLVA and BCVA considering all eyes. The presence of a PED was not associated with significantly worse visual acuity parameters.
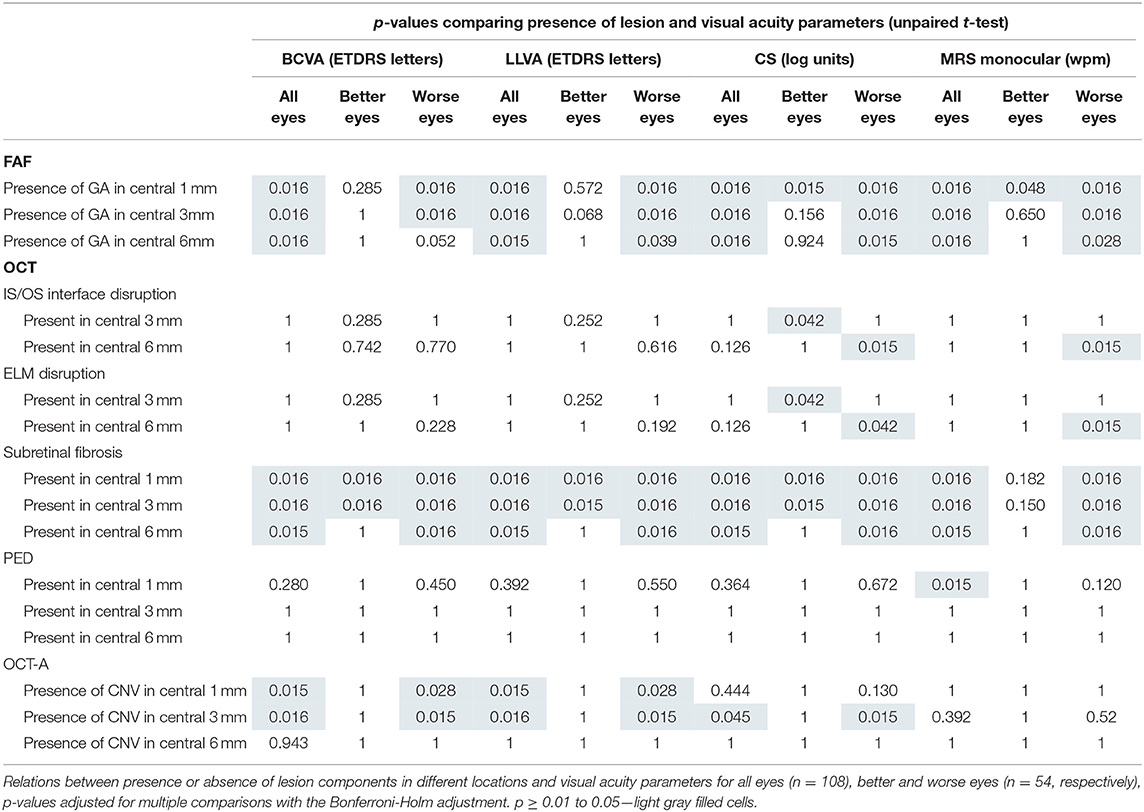
Table 4. Relations between location of lesions and visual function.
Multiple Regression Analysis
Multiple regression analysis run each time with a visual function parameter as the dependent variable, yielded values of adjusted R2 of 0.707 for contrast sensitivity, 0.596 for BCVA, 0.588 for LLVA and 0.591 for monocular MRS when all eyes were included. The model with contrast sensitivity as the dependant variable with the highest adjusted R2 is summarized in Table 5. This model selected the total area of macular GA, the IS/OS interface disruption score, the presence of subretinal fibrosis in the central 1 mm and CRT as significant independent parameters. Therefore, these factors explain ~71% of the variation of contrast sensitivity.
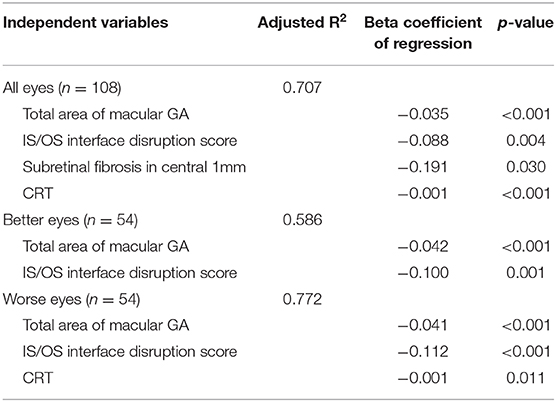
Table 5. Multiple regression analysis of contrast sensitivity and morphologic parameters.
When subdividing into two groups depending on the status of the eye (better vs. worse), results indicated a higher coefficient of determination for the worse eyes (0.772 vs. 0.586). Furthermore, only the total area of macular GA, the IS/OS junction line disruption score and CRT (only for the worse eyes) were selected as significant independent variables.
Discussion
Several studies have reported that anatomic parameters such as CNV area and diameter do not adequately explain changes in distance visual acuity in nAMD (23, 26). Yet, the majority of those studies did not include a multitude of morphologic parameters graded on the basis of the ETDRS grid subfields using latest image acquisition devices such as SD-OCT and OCT-A and did not evaluate different measures of visual function.
Our results suggest that contrast sensitivity (CS) exhibits the most consistent correlations with many of the anatomic parameters compared to the other assessed measures of vision. Likewise, Ghoshal et al. correlated different functional measures and retinal morphology and found CS to be associated with a few OCT parameters including thickness and volume of RPE and Bruch membrane (32). In our study, although significant correlations were observed for all measures of visual function, CS exhibited the strongest correlation coefficients for all the evaluated morphologic parameters and yielded the highest coefficient of determination in multiple regression analysis.
With regards to the component of the lesions, in our study the area of atrophy and the presence of subretinal fibrosis in the central 1 mm were selected as independent variables explaining the variation in CS for all eyes. In addition, their presence in all of the ETDRS subfields was significantly correlated with CS (for the better eye group only in the central 1 mm). Their influence on visual function in general is not surprising as it is in accordance with several other studies (23, 33). Subretinal fibrosis as the end stage of nAMD leads to a destruction of the overlying photoreceptors; on the one hand by interfering with the metabolic exchange with the RPE and on the other hand by a direct toxic effect (34). Likewise, subretinal fibrosis and atrophy go along with a destruction of the outer retina and the RPE resulting in decreased visual function. Similarly, Keane et al. reported strongest correlations between a decreased CS and an increased subretinal tissue volume for newly diagnosed nAMD patients explaining 24% of the variation in CS at baseline (24).
In our study both the total area of geographic atrophy (GA) as defined by hypoautofluorescence in autofluorescence imaging as well as the percentage of GA in the central 1 mm were strongly associated with CS and other measures of visual function. Accordingly, Ooto et al. reported a negative correlation between CS and size of confluent hypoautofluorescence as well as its involvement of the fovea in dry AMD (35). Despite the additional presence of other components in nAMD our results suggest that GA is a major factor influencing visual function in nAMD, too. Furthermore, we identified the percentage of GA in the central 1 mm as a significant influencing factor which has been previously described to better correlate with distance visual acuity than total GA size (22). In addition, it can serve as a better tool to predict visual impairment over time than the simply binary grading of foveal-sparing status. Furthermore, in our study the presence of GA in the central 3 and 6 mm had a significant impact on visual function. Correspondingly, Sayegh et al. reported that progression of GA depends on the distance to the fovea and argue for a grading of sparing in the central 3 mm as it correlates with both atrophy progression and visual acuity (36).
With newer OCT devices, the visualization of the degeneration of the photoreceptors is thought to be visible by a disruption of ELM and the IS/OS interface which may be present not only in atrophic areas but also in the junctional zones (37). In our study, the ELM and IS/OS interface disruption score exhibited strongest correlations with CS and a disruption of ELM and IS/OS interface in the central 3 mm (better eye group) and the central 6 mm (worse eye group) was significantly associated only with CS but not the other measures of vision. Whereas, the size of the ellipsoid zone defect has been shown to correlate with microperimetry scores (35), there are currently no studies investigating the relation between ELM and IS/OS interface disruption and CS in anti-VEGF treated nAMD patients.
Although distance visual acuity is widely used in clinical trials, several studies documented that it correlated less with morphological features in nAMD than for example near visual acuity (23, 26), indicating that standard BCVA at 4 m does not adequately correlate with foveal impairment in nAMD. In the present study, correlation coefficients were also generally weaker compared to CS. We observed a similar significant but moderate correlation between central retinal thickness (CRT) and ETDRS BCVA as well as CS when considering all eyes. Retinal thickening associated with intraretinal fluid exudation is commonly observed in nAMD. Although a reduction in CRT after anti-VEGF treatment has been shown to moderately correlate with long-term visual outcomes, many studies failed to detect stronger correlations between CRT and visual function (24, 38, 39). Similarly, our results may be reflective of the heterogeneous morphology in AMD where reduced retinal thickness in advanced atrophic lesions is associated with severe vision loss. Further, in our study the total area of CNV as evaluated on OCT-A was moderately correlated with visual function in the worse eyes and its presence in the central 1 and 3 mm showed a highly significant association with ETDRS visual acuity. In other studies based on angiographic measurements, these correlations were weaker and inconsistent (23, 26), probably due to the fact that our study cohort had already experienced a long disease duration so that the CNV had often resulted in a considerable amount of atrophy or fibrosis within the macula. With growth of the CNV below the RPE, the formation of a fibrovascular PED may occur which is often accompanied by leakage or hemorrhage. Our results did not indicate a correlation between the presence or the height of PED and ETDRS BCVA which is consistent with findings of other studies (24, 40). This lack of association is not surprising as even large PED may go along with functioning overlying photoreceptors. Furthermore, we did not characterize the PED subtypes, thus a possible correlation dependent on the structural characteristics of the PED remains unclear.
Whereas, LLVA has been shown to capture visual impairment in nAMD better than standard distance acuity (41), there is currently limited data correlating systematically LLVA and various morphologic characteristics. The Chroma and Spectri studies reported a weak negative correlation between LLVA and GA lesion size at baseline and week 48 in bilateral GA in dry AMD (42). Further, patients with foveal involvement already at baseline showed less decline in LLVA but not the other functional measures which reflects its relevance as a measure of foveal cone function in early disease stages in the absence of foveal lesions. In the present study LLVA showed globally similar correlations with retinal morphology than standard distance acuity, most likely due to their high intercorrelation level.
While reading speed is known to be significantly reduced in eyes with nAMD (9), in our study, correlations between the binocular MRS and the morphologic impairment of the better eye were globally weaker and inconsistent. This was probably due to the fact that the influence of the fellow eye was not taken into account. Since reading is performed best with central vision, monocular reading which prevents the compensation of a monocular central field loss by the fellow eye, is severely compromised in nAMD, possibly resulting in weaker correlations for the monocular MRS. Nevertheless, in our study monocular MRS exhibited stronger correlation coefficients with the autofluorescence parameters and ELM and IS/OS interface disruption score than standard BCVA. Reviewing the literature, reading speed has been described to correlate significantly with the size of GA (34, 42), central retinal thickness (24) as well as the foveal involvement of atrophy and subretinal fibrosis (23). Our results correspond to these findings with significant relations between monocular MRS and the presence of GA and subretinal fibrosis in the central 1, 3, and 6 mm considering all eyes. Especially the size of the foveal spared area seems to influence MRS as it has been shown that a minimal spared central area is required for fluent reading, otherwise the characters would not “fit” in the preserved space (43). Further, the Chroma and Spectri studies found MRS to be best correlated with progression of GA size compared to other functional measures in bilateral GA in dry AMD (42). Likewise, in our study strongest correlations for the monocular MRS were observed with the percentage of GA in the central 1 mm.
Analysis with two subgroups (better vs. worse eyes) revealed similar strong correlation coefficients between CS and the GA parameters as well as the disruption of the IS/OS interface and ELM independently of the status of the eye. However, standard BCVA was not reflective of the atrophic lesions in the better eyes. Hence, CS could serve as an early biomarker of impaired visual function especially in early disease stages and therefore be used even in the better eyes of patients with bilateral nAMD. Generally, the correlation coefficients were lower in the better eye than in the worse eye group which is consistent with findings in the literature (27). Possibly, the better eyes performed better than expected considering their morphologic lesions, since the subjects largely depended on it due to the impairment of the fellow eye.
To the best of our knowledge, there are no studies so far that systemically correlated a multitude of morphologic parameters graded on FAF, SD-OCT and SS-OCT-A with several measures of visual function of subjects with bilateral nAMD. The performance of a standardized visual assessment protocol under the same conditions and the homogenous study population contribute to the strengths of our study. Further standardized image evaluation protocols were used for FAF, SD-OCT and SS-OCT-A analyses. Limitations of this study included its cross-sectional design and relatively small study population. Unfortunately, due to a lengthy disease course a reliable statement about the activity status based on shape/branching pattern/anastomoses/morphology of vessel termini/perilesional halo was not always possible in the cross sectional OCTA exam. Furthermore, the LLVA testing protocol of our clinic did not include the use of a KODAK filter, thus potentially precluding a bigger low luminance deficit. Our results should be validated in larger cohorts evaluating how the progression of morphological impairment correlates with visual function over time in order to investigate its predictive value on future visual acuity change.
To summarize, in this study visual function did not depend on an unique anatomic parameter indicating that in nAMD which does not present as a single homogenous morphologic entity, the extent, composition and size of the lesions taken together account for the associated visual impairment. This study suggests that in bilateral nAMD contrast sensitivity is better correlated with anatomic characteristics than other functional visual measures including standard ETDRS BCVA with strongest correlations with total area of macular GA and IS/OS interface disruption score. These correlations were consistent even in the better eyes of a patient contrary to standard BCVA, thus CS may serve as a better biomarker in early disease stages. Furthermore, in comparison to the other assessed visual function measures, CS has been shown to best correlate with vision-related quality of life as reflected by the NEI-VFQ25 distance and near distance score (21). Thus, given the more consistent correlation with morphologic characteristics, the incorporation of CS as a surrogate endpoint in clinical trials may lead to improved accuracy. Furthermore, it may be used as a standard diagnostic tool in clinical practice to better reflect the patient's individual visual impairment.
Data Availability Statement
The raw data supporting the conclusions of this article will be made available by the authors, upon personal request.
Ethics Statement
The studies involving human participants were reviewed and approved by Ethikkommission Nordwest- und Zentralschweiz. The patients/participants provided their written informed consent to participate in this study.
Author Contributions
LH and PR: acquisition, interpretation of data, and statistics and writing of manuscript. M-MG: interpretation of data. KH: design of the study, acquisition, interpretation of data, supervision, and writing of manuscript. All authors critically reviewed the manuscript and approved the final version.
Funding
This study was supported by a grant of Retina Suisse Foundation.
Conflict of Interest
The authors declare that the research was conducted in the absence of any commercial or financial relationships that could be construed as a potential conflict of interest.
Acknowledgments
The authors thank Mrs. Susanne Müller for her valuable support during document preparation for ethics approval, data collection and manuscript submission. They also thank Mr. Jaco Botha for providing extensive statistical assistance and support.
References
1. Wong WL, Su X, Li X, Cheung CM, Klein R, Cheng CY, et al. Global prevalence of age-related macular degeneration and disease burden projection for 2020 and 2040: a systematic review and meta-analysis. Lancet Glob Health. (2014) 2:e106–16. doi: 10.1016/S2214-109X(13)70145-1
2. Colijn JM, Buitendijk G, Prokofyeva E, Alves D, Cachulo ML, Khawaja AP, et al. Prevalence of age-related macular degeneration in Europe: the past and the future. Ophthalmology. (2017) 124:1753–63. doi: 10.1016/j.ophtha.2017.05.035
3. Cahill MT, Banks AD, Stinnett SS, Toth CA. Vision-related quality of life in patients with bilateral severe age-related macular degeneration. Ophthalmology. (2005) 112:152–8. doi: 10.1016/j.ophtha.2004.06.036
4. Elshout M, Webers CA, van der Reis MI, de Jong-Hesse Y, Schouten JS. Tracing the natural course of visual acuity and quality of life in neovascular age-related macular degeneration: a systematic review and quality of life study. BMC Ophthalmol. (2017) 17:120. doi: 10.1186/s12886-017-0514-3
5. Lindner M, Böker A, Mauschitz MM, Göbel AP, Fimmers R, Brinkmann CK, et al. Directional kinetics of geographic atrophy progression in age-related macular degeneration with foveal sparing. Ophthalmology. (2015) 122:1356–65. doi: 10.1016/j.ophtha.2015.03.027
6. Fleckenstein M, Mitchell P, Freund KB, Sadda S, Holz FG, Brittain C, et al. The progression of geographic atrophy secondary to age-related macular degeneration. Ophthalmology. (2018) 125:369–90. doi: 10.1016/j.ophtha.2017.08.038
7. Zandi S, Weisskopf F, Garweg JG, Pfister IB, Pruente C, Sutter F, et al. Pre-existing RPE atrophy and defects in the external limiting membrane predict early poor visual response to ranibizumab in neovascular age-related macular degeneration. Ophthalmic Surg Lasers Imaging Retina. (2017) 48:326–32. doi: 10.3928/23258160-20170329-07
8. Okeagu CU, Agrón E, Vitale S, Domalpally A, Chew EY, Keenan T, et al. Principal cause of poor visual acuity following neovascular age-related macular degeneration: AREDS2 Report Number 23. Ophthalmol Retina. (2020) S2468-6530(20)30408-5. Advance online publication. doi: 10.1016/j.oret.2020.09.025
9. Sunness JS, Rubin GS, Applegate CA, Bressler NM, Marsh MJ, Hawkins BS, et al. Visual function abnormalities and prognosis in eyes with age-related geographic atrophy of the macula and good visual acuity. Ophthalmology. (1997) 104:1677–91. doi: 10.1016/S0161-6420(97)30079-7
10. Sunness JS, Schuchard RA, Shen N, Rubin GS, Dagnelie G, Haselwood DM. Landmark-driven fundus perimetry using the scanning laser ophthalmoscope. Invest Ophthalmol Vis Sci. (1995) 36:1863–74.
11. Pilotto E, Guidolin F, Convento E, Spedicato L, Vujosevic S, Cavarzeran F, et al. Fundus autofluorescence and microperimetry in progressing geographic atrophy secondary to age-related macular degeneration. Br J Ophthalmol. (2013) 97:622–6. doi: 10.1136/bjophthalmol-2012-302633
12. Meleth AD, Mettu P, Agrón E, Chew EY, Sadda SR, Ferris FL, et al. Changes in retinal sensitivity in geographic atrophy progression as measured by microperimetry. Invest Ophthalmol Vis Sci. (2011) 52:1119–26. doi: 10.1167/iovs.10-6075
13. Wong EN, Chew AL, Morgan WH, Patel PJ, Chen FK. The use of microperimetry to detect functional progression in non-neovascular age-related macular degeneration: a systematic review. Asia Pac J Ophthal (Phila). (2017) 6:70–9. doi: 10.22608/APO.201643
14. Wu Z, Ayton LN, Luu CD, Guymer RH. Relationship between retinal microstructures on optical coherence tomography and microperimetry in age-related macular degeneration. Ophthalmology. (2014) 121:1445–52. doi: 10.1016/j.ophtha.2014.01.025
15. Sayegh RG, Kiss CG, Simader C, Kroisamer J, Montuoro A, Mittermüller TJ, et al. A systematic correlation of morphology and function using spectral domain optical coherence tomography and microperimetry in patients with geographic atrophy. Br J Ophthalmol. (2014) 98:1050–5. doi: 10.1136/bjophthalmol-2014-305195
16. Pilotto E, Benetti E, Convento E, Guidolin F, Longhin E, Parrozzani R, et al. Microperimetry, fundus autofluorescence, and retinal layer changes in progressing geographic atrophy. Can J Ophthalmol. (2013) 48:386–93. doi: 10.1016/j.jcjo.2013.03.022
17. Bressler SB, Bressler NM, Fine SL, Hillis A, Murphy RP, Olk RJ, et al. Natural course of choroidal neovascular membranes within the foveal avascular zone in senile macular degeneration. Am J Ophthalmol. (1982) 93:157–63. doi: 10.1016/0002-9394(82)90410-X
18. Scilley K, Jackson GR, Cideciyan AV, Maguire MG, Jacobson SG, Owsley C. Early age-related maculopathy and self-reported visual difficulty in daily life. Ophthalmology. (2002) 109:1235–42. doi: 10.1016/S0161-6420(02)01060-6
19. Maynard ML, Zele AJ, Feigl B. Mesopic Pelli-Robson contrast sensitivity and MP-1 microperimetry in healthy ageing and age-related macular degeneration. Acta Ophthalmol. (2016) 94:e772–78. doi: 10.1111/aos.13112
20. Chandramohan A, Stinnett SS, Petrowski JT, Schuman SG, Toth CA, Cousins SW, et al. Visual function measures in early and intermediate age-related macular degeneration. Retina. (2016) 36:1021–31. doi: 10.1097/IAE.0000000000001002
21. Rossouw P, Guichard M, Hatz K. Contrast sensitivity and binocular reading speed best correlating with near distance vision-related quality of life in bilateral nAMD. Ophthalmic Physiol Opt. (2020) 40:760–9. doi: 10.1111/opo.12736
22. Bagheri S, Lains I, Silverman RF, Kim I, Eliott D, Silva R, et al. Percentage of foveal vs. total macular geographic atrophy as a predictor of visual acuity in age-related macular degeneration. J Vitreoretin Dis. (2019) 3:278–82. doi: 10.1177/2474126419859454
23. Hogg R, Curry E, Muldrew A, Winder J, Stevenson M, McClure M, et al. Identification of lesion components that influence visual function in age related macular degeneration. Br J Ophthalmol. (2003) 87:609–14. doi: 10.1136/bjo.87.5.609
24. Keane PA, Patel PJ, Ouyang Y, Chen FK, Ikeji F, Walsh AC, et al. Effects of retinal morphology on contrast sensitivity and reading ability in neovascular age-related macular degeneration. Invest Ophthalmol Vis Sci. (2010) 51:5431–7. doi: 10.1167/iovs.09-4846
25. Macular Photocoagulation Study Group. Visual outcome after laser photocoagulation for subfoveal choroidal neovascularization secondary to age-related macular degeneration. The influence of initial lesion size and initial visual acuity. Macular Photocoagulation Study Group. Arch Ophthalmol. (1994) 112:480–8. doi: 10.1001/archopht.1994.01090160056023
26. Moutray T, Alarbi M, Mahon G, Stevenson M, Chakravarthy U. Relationships between clinical measures of visual function, fluorescein angiographic and optical coherence tomography features in patients with subfoveal choroidal neovascularisation. Br J Ophthalmol. (2008) 92:361–4. doi: 10.1136/bjo.2007.123976
27. Doris N, Hart PM, Chakravarthy U, McCleland J, Stevenson M, Hudson C, et al. Relation between macular morphology and visual function in patients with choroidal neovascularisation of age related macular degeneration. Br J Ophthalmol. (2001) 85:184–8. doi: 10.1136/bjo.85.2.184
28. Fleckenstein M, Charbel Issa P, Helb HM, Schmitz-Valckenberg S, Finger RP, Scholl HP, et al. High-resolution spectral domain-OCT imaging in geographic atrophy associated with age-related macular degeneration. Invest Ophthalmol Vis Sci. (2008) 49:4137–44. doi: 10.1167/iovs.08-1967
29. Hatz K, Ebneter A, Tuerksever C, Pruente C, Zinkernagel M. Repeated dexamethasone intravitreal implant for the treatment of diabetic macular oedema unresponsive to anti-vegf therapy: outcome and predictive SD-OCT features. Ophthalmologica. (2018) 239:205–14. doi: 10.1159/000485852
30. Schmidt-Erfurth U, Waldstein SM, Deak GG, Kundi M, Simader C. Pigment epithelial detachment followed by retinal cystoid degeneration leads to vision loss in treatment of neovascular age-related macular degeneration. Ophthalmology. (2015) 122:822–32. doi: 10.1016/j.ophtha.2014.11.017
31. Holopigian K, Bach M. A primer on common statistical errors in clinical ophthalmology. Doc Ophthalmol. (2010) 121:215–22. doi: 10.1007/s10633-010-9249-7
32. Ghoshal R, Sharanjeet-Kaur S, Mohamad Fadzil N, Mutalib HA, Ghosh S, Ngah NF, et al. Correlation between visual functions and retinal morphology in eyes with early and intermediate age-related macular degeneration. Int J Environ Res Public Health. (2020) 17:6379. doi: 10.3390/ijerph17176379
33. Unver YB, Yavuz GA, Bekiroglu N, Presti P, Li W, Sinclair SH. Relationships between clinical measures of visual function and anatomic changes associated with bevacizumab treatment for choroidal neovascularization in age-related macular degeneration. Eye (Lond). (2009) 23:453–60. doi: 10.1038/eye.2008.349
34. Willoughby AS, Ying GS, Toth CA, Maguire MG, Burns RE, Grunwald JE, et al. Subretinal hyperreflective material in the comparison of age-related macular degeneration treatments trials. Ophthalmology. (2015) 122:1846–53.e5. doi: 10.1016/j.ophtha.2015.05.042
35. Ooto S, Suzuki M, Vongkulsiri S, Sato T, Spaide RF. Multimodal visual function testing in eyes with nonexudative age-related macular degeneration. Retina. (2015) 35:1726–34. doi: 10.1097/IAE.0000000000000608
36. Sayegh RG, Sacu S, Dunavölgyi R, Kroh ME, Roberts P, Mitsch C, et al. Geographic atrophy and foveal-sparing changes related to visual acuity in patients with dry age-related macular degeneration over time. Am J Ophthalmol. (2017) 179:118–28. doi: 10.1016/j.ajo.2017.03.031
37. Wolf-Schnurrbusch UE, Enzmann V, Brinkmann CK, Wolf S. Morphologic changes in patients with geographic atrophy assessed with a novel spectral OCT-SLO combination. Invest Ophthalmol Vis Sci. (2008) 49:3095–9. doi: 10.1167/iovs.07-1460
38. Fung AE, Lalwani GA, Rosenfeld PJ, Dubovy SR, Michels S, Feuer WJ, et al. An optical coherence tomography-guided, variable dosing regimen with intravitreal ranibizumab (Lucentis) for neovascular age-related macular degeneration. Am J Ophthalmol. (2007) 143:566–83. doi: 10.1016/j.ajo.2007.01.028
39. Keane PA, Sadda SR. Predicting visual outcomes for macular disease using optical coherence tomography. Saudi J Ophthalmol. (2011) 25:145–58. doi: 10.1016/j.sjopt.2011.01.003
40. Pauleikhoff D, Löffert D, Spital G, Radermacher M, Dohrmann J, Lommatzsch A, et al. Pigment epithelial detachment in the elderly. Clinical differentiation, natural course and pathogenetic implications. Graefes Arch Clin Exp Ophthalmol. (2002) 240:533–8. doi: 10.1007/s00417-002-0505-8
41. Pondorfer SG, Heinemann M, Wintergerst M, Pfau M, Strömer AL, Holz FG, et al. Detecting vision loss in intermediate age-related macular degeneration: a comparison of visual function tests. PLoS ONE. (2020) 15:e0231748. doi: 10.1371/journal.pone.0231748
42. Tschosik EA, Gray S, Ferrara D, Guymer R, Chroma and Spectri Study Investigators. Visual function decline resulting from geographic atrophy: results from the chroma and spectri phase 3 trials. Ophthalmol Retina. (2020) 4:673–88. doi: 10.1016/j.oret.2020.01.019
Keywords: contrast sensitivity, age-reated macular degeneration, AMD, visual function, OCT, OCTA, geographic atrophy, fundus autofluorecence
Citation: Hoffmann L, Rossouw P, Guichard M-M and Hatz K (2021) Strongest Correlation Between Contrast Sensitivity and Morphological Characteristics in Bilateral nAMD. Front. Med. 7:622877. doi: 10.3389/fmed.2020.622877
Received: 29 October 2020; Accepted: 30 December 2020;
Published: 28 January 2021.
Edited by:
Fang Hou, Wenzhou Medical University, ChinaReviewed by:
William Ridder, Marshall B. Ketchum University, United StatesCarlo Gesualdo, University of Campania Luigi Vanvitelli, Italy
Copyright © 2021 Hoffmann, Rossouw, Guichard and Hatz. This is an open-access article distributed under the terms of the Creative Commons Attribution License (CC BY). The use, distribution or reproduction in other forums is permitted, provided the original author(s) and the copyright owner(s) are credited and that the original publication in this journal is cited, in accordance with accepted academic practice. No use, distribution or reproduction is permitted which does not comply with these terms.
*Correspondence: Katja Hatz, a2F0amEuaGF0ekB2aXN0YS5jaA==
†These authors have contributed equally to this work