
94% of researchers rate our articles as excellent or good
Learn more about the work of our research integrity team to safeguard the quality of each article we publish.
Find out more
ORIGINAL RESEARCH article
Front. Mech. Eng., 14 April 2025
Sec. Vibration Systems
Volume 11 - 2025 | https://doi.org/10.3389/fmech.2025.1591815
This article is part of the Research TopicMechanical Component Fault Diagnosis and Intelligent Maintenance Systems: Challenges and AdvancesView all articles
 Huang Xiao
 Hanqing Jian*
Introduction: The health status of bearings is an essential prerequisite to ensure the safe and stable operation of vehicles. However, the negative impact of covariate shifts among data channels on diagnostic accuracy is an issue that is often overlooked in data-driven algorithms based on multi-channel data. Therefore, extracting the most representative features from multi-channel data is key to achieving highprecision fault diagnosis.
Methods: To address this issue, this paper proposes a fault diagnosis algorithm based on a multi-channel neighbor feature convolutional network. First, to mitigate the covariate shift problem in the data, inverted mel-scale frequency cepstral coefficients are introduced to obtain domain-invariant features with high recognition accuracy. Furthermore, to fully leverage multichannel data and extract more discriminative features, we design a multi-channel adjacent feature convolutional module. This module employs sparse mapping to extract local neighboring features while preserving global constraint characteristics.
Result and discussion: Experiments are carried out on Xi’an Jiaotong University and Case Western Reserve University data. The results show that the proposed method can achieve high performance and high precision fault diagnosis.
As one of the critical components in the automotive drive system, the performance of bearings directly impacts vehicle safety, reliability, and operational efficiency Tang et al. (2024); Cui et al. (2024). However, due to high-speed rotation and complex loads, bearings are prone to irreversible damage. This damage will affect the normal operation of the vehicle Guo et al. (2025). Therefore, it is very important to detect the bearing damage state in time and take preventive measures to ensure the healthy and stable operation of the equipment.
Nowadays, with the continuous development of artificial intelligence, most fault diagnosis algorithms rely on neural networks to achieve fault pattern recognition and classification Zhang and Wu (2024); Xu and Zhang (2023). Diagnostic algorithms can be divided into two categories based on different processing methods: feature extraction-based methods and deep learning-based methods. The former converts the bearing vibration signal or sound signal into frequency domain or time domain features and then uses machine learning or other algorithms for classification and diagnosis. The former method first converts the bearing vibration signal or sound signal into frequency domain or time domain features and then uses machine learning or other algorithms for classification and diagnosis. Common feature extraction methods include Fourier transform, wavelet transform, autocorrelation function, etc. Yang et al. (2024); Liang et al. (2023); Jiang et al. (2023); Chauhan et al. (2024); Ding et al. (2023). The deep learning-based method employs deep learning models such as deep neural networks or convolutional neural networks to learn the characteristics of bearing faults Wang P. et al. (2023); Fang et al. (2023); Hu et al. (2025); Tong et al. (2023); Song et al. (2024). This method can achieve more precise results by training on a large amount of data. However, these approaches also have some limitations. For instance, deep learning-based methods generally assume that the training and test data come from the same time series distribution. Distribution shifts in the data can decrease diagnostic accuracy Yao et al. (2022); Zhao Y. et al. (2023). Additionally, most diagnostic algorithms typically use data collected by a single sensor, which cannot fully express the fault characteristics and is easily influenced by unpredicted factors Song et al. (2023a); Wang G. et al. (2023). Therefore, extracting the fault feature information fully from multi-channel data is crucial to achieving high-precision fault diagnosis.
For multi-channel data feature extraction, many scholars have proposed their own methods. For example, Song et al. constructed an intelligent multi-channel spectral structure scanner using multivariate variational mode decomposition Song et al. (2023b). It can adaptively detect the potential center frequency characteristics in multi-channel bearing signals. Liu et al. segmented the multi-frequency information of each sensor and fused the information of different frequency components of multi-sensors by constructing weighted fusion rules Liu et al. (2022). Li et al. used a multi-channel fusion covariance matrix to obtain 22 statistical features from each channel data as a representation of fault features Li et al. (2022). Zhang et al. used data adaptive weighted fusion algorithm to fuse acoustic signals and vibration signals at the data level, and then used 1D convolutional neural network (1D-CNN) to mine fault features Zhang et al. (2022). In order to obtain the feature information that can best characterize the bearing state, wang et al. weighted the multi-sensor data Wang et al. (2022). The above methods have achieved good results. Scholars have given different attention to different channels through some hyperparameters, and comprehensively considered the data of different sensors. In addition to the above methods, another method is to reduce the dimension of multi-sensor data. The common fault diagnosis method is based on the single channel signal processing method. Therefore, we can reduce the dimension of multi-channel data to obtain the bearing fault state characteristics. For example, Wang et al.first extracted multi-channel signal fusion entropy features, and then used popular learning methods to map high-dimensional fusion entropy features to low-dimensional space Wang et al. (2021). Mamun et al proposed a frequency domain multi-linear principal component analysis method Al Mamun et al. (2023). This method first obtains the frequency domain tensor corresponding to the original signal, and then uses the frequency domain multi-linear principal component analysis method to decompose the frequency domain tensor to obtain the low-dimensional features of the fault data. The purpose of the above method is to design a suitable data processing method to improve the generalization ability of neural networks. Some scholars extract multi-channel data features from the perspective of network structure. For example, Xu et al. directly convert the signals collected by multiple sensors into images, and combine convolutional neural network (CNN), dilated residual networks (DRN), and long short term memory (LSTM) to construct parallel convolutional neural network (PCNN) to extract and fuse the features of the converted images Xu et al. (2020). Jin et al. added multi-scale convolution kernels to convolutional neural networks to improve the generalization ability of the model Jin et al. (2021). At the same time, the parallel structure of the diagnostic model makes up for the deficiency of the multi-channel input fusion method.
It can be seen that different scholars have different ideas for multi-channel feature extraction. They ignore the problem of data covariation shift when extracting feature extraction, which will lead to the distribution difference between the training set and test set. For the fault diagnosis algorithm based on a neural network, we do not input all the data collected by the sensor as a whole into the network, and often need to sample according to certain rules to adapt to the input of the network. The distribution of samples depends on the sampling time interval. If the interval is inconsistent, it will lead to a data covariant shift, resulting in a distribution difference between the training set and the test set. For a complex network structure, the distribution difference of single-channel data has little effect. However, multi-channel data will widen the distribution difference. This is because there are not only differences in multi-channel data due to inconsistent sampling time intervals, but also differences in distribution between different channels. Therefore, how to find a way to extract multi-channel data landmark features and reduce the impact of data covariant shift is the key to achieving high-precision fault diagnosis.
Based on the above analysis, this paper proposes a fault diagnosis algorithm based on a multi-channel neighbor feature convolutional network. The method consists of two parts, namely, inverted Mel-scaleFrequency Cepstral Coefficients (I-MFCC) and nearest neighbor feature convolution network. Considering the covariant shift problem of data, this paper first uses I-MFCC to preprocess the original multi-channel data. I-MFCC can not only obtain robust features without timing constraints, but also greatly improve the discrimination of different fault features. Then, the obtained I-MFCC features are input into the nearest neighbor feature convolution network. The core part of the network is the neighbor convolution block. The nearest neighbor convolution block can not only grasp the overall constraint features, but also extract the adjacent features between adjacent data. Experiments on Xi’an Jiaotong University (XJTU) and Case Western Reserve University (CWRU) datasets show that the proposed method can achieve excellent results. The contributions of this paper are as follows:
(i) To enhance fault diagnosis accuracy, this paper proposes a fault diagnosis algorithm based on a multi-channel neighbor feature convolutional network. Using multi-channel data as the research focus, we introduce I-MFCC for data preprocessing to mitigate internal temporal constraints and extract domain-invariant features with higher discriminative capability. The multi-channel neighboring feature convolutional network establishes a strong coupling relationship between features and fault labels in nonlinear data, enabling high-precision fault diagnosis.
(ii) To optimize feature representation from multi-channel data, this paper introduces a neighbor feature convolutional network (NFCN). By considering the spatial sparsity of the data, the module applies K nearest neighbors (KNN) for computation, which reduces dimensionality while improving feature characterization. Finally, a two-dimensional convolutional network is employed to extract key fault features.
This paper is organized as follows. Section 2 briefly introduces the related work, I-MFCC and nearest neighbor convolution. The third section describes the overall network structure of the methods used in this article. Section 4 introduces the experimental setup and the experimental results analysis. Section 5 summarizes this paper.
In this section, we will briefly introduce I-MFCCs and Nearest Neighbor Convolution (NNC), which are also key technologies for the methods used in this paper.
The Mel-Frequency Cepstral Coefficients (MFCC) is a signal processing method widely used in the field of speech recognition. Researchers have arranged a set of band-pass filters from low frequency to high frequency based on the critical bandwidth, with the filters transitioning from dense to sparse. These filters are used to process the input signal, and the energy output from each band-pass filter is taken as the fundamental feature of the signal. The processing steps are shown in Figure 1. Through a series of operations, including pre-emphasis, framing, windowing, Fast Fourier Transform (FFT), Mel filter bank processing, logarithmic transformation, and Discrete Cosine Transform (DCT), this method maximizes key information within the signal to extract more distinguishable features. Pre-emphasis is first applied to compensate for the attenuation of high-frequency components and enhance high-frequency features. Then, the signal is divided into short-time analysis windows through framing and windowing to capture time-varying characteristics. Next, FFT is employed to convert the time-domain signal into the frequency domain, followed by a set of band-pass filters arranged according to the Mel scale from low to high frequency. The calculation process is shown in Equation 1, which simulates the human auditory system’s sensitivity to different frequencies. After filtering, a logarithmic transformation is performed on the energy spectrum to enhance perceptual consistency across different frequencies. Finally, DCT is used for dimensionality reduction, removing redundant information, and improving computational efficiency.
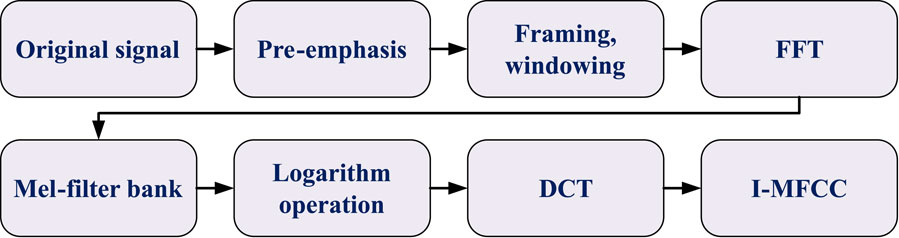
Figure 1. I-MFCCs feature extraction process.
Although MFCC performs well in speech recognition, its fixed filter arrangement structure limits its applicability in mechanical fault diagnosis. The primary fault characteristics of bearing vibration signals are often concentrated in the high-frequency range, whereas traditional MFCC struggles to effectively extract these high-frequency features. To address this issue, Zhao et al. proposed I-MFCC (Inverted MFCC) Zhao Y. et al. (2023). I-MFCC optimizes the filter distribution of MFCC by adopting a sparse low-frequency and dense high-frequency filter design, making it more suitable for the spectral distribution characteristics of bearing vibration signals, as shown in Figure 2. The improvements introduced by I-MFCC have demonstrated outstanding performance in fault diagnosis tasks. Additionally, its computational method reduces the strong temporal constraints of periodic data, thereby enhancing feature representation. Therefore, this paper adopts I-MFCC as a data preprocessing method to improve feature extraction for fault diagnosis.

Figure 2. Mel-filter distribution.
The nearest neighbor convolution block is a convolution block proposed by the paper Wang et al. (2018). Inspired by the characteristics of point cloud data and convolution operations, scholars utilize local geometric structures by constructing local domain maps and applying convolution-like operations on the edges connecting adjacent point pairs. Different from ordinary convolution, the data of each layer of convolution operation is dynamically updated. The method of dynamic update is KNN.
KNN is a classical classification algorithm, with its core relying on two key parameters: the K value and the distance calculation method. KNN is used to dynamically search for the K nearest neighbors of each data point and construct a local feature space based on these neighbors. Specifically, suppose a set of data appears as a disordered waveform in a two-dimensional plane. When mapped to a three-dimensional geometric space, it exhibits a certain sparsity. However, this sparse distribution may obscure some critical local features, making it difficult for traditional convolution operations to capture the local structure of the data. Based on this, the algorithm incorporates the KNN method, utilizing Euclidean distance to measure the contribution of different data points within the feature space and retaining the data points with higher contributions to enhance the feature representation capability.
In order to obtain the domain feature information while paying attention to the global feature information, scholars input the KNN processed data in parallel with the original data into the network. Different parts of the data contribute different information. In addition, the neighbor information can complement the global information. The specific neighborhood convolution block structure is shown in Figure 3.
where
where
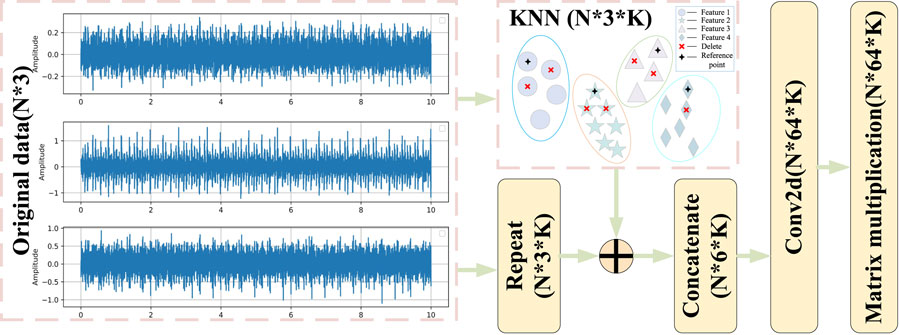
Figure 3. NNC structure.
The specific calculation process is: we construct a graph structure, assuming that there is a sample, the set of points in the sample can be shown by Formula 2, where each point is represented by a three-dimensional coordinate. Firstly, we calculate each point by KNN to construct the spatial structure relationship between points. According to the spatial structure information, we use Formula 3 to represent the edge feature. In order to make the local information more representative, we discard some feature information that is not important to the center point. Finally, this paper combines the local neighbor information and the global structure information to form the sample feature information, which can be seen in Formula 4.
Based on data-driven fault diagnosis algorithms, the vibration signals collected are typically periodic and consist of long time series, making it impossible to directly input the data into the network for processing. Therefore, the first step is to sample the raw data to convert it into a format suitable for model input. The periodic nature of vibration signals means that features within each signal cycle may vary significantly at different sampling points. If the sampling standards are not consistent, this can lead to feature shifts between adjacent samples, thus affecting the diagnostic accuracy of the model. This problem becomes even more complex with multi-channel data. In multi-channel data, covariate shifts can occur not only within the same channel, causing feature drift within a single channel, but also between different channels. This cross-channel shift leads to inconsistencies in the signals captured by different sensors, which in turn reduces the precision of the diagnostic algorithm.
To address this challenge, this paper proposes a fault diagnosis algorithm based on multi-channel nearest neighbor convolutional networks. By incorporating the KNN method, the algorithm can dynamically search for the nearest neighbors of each data point within its neighborhood and construct a more robust feature space based on these neighbors. This not only helps mitigate shifts in single-channel data but also effectively addresses covariate shifts between multi-channel data, thereby improving fault diagnosis accuracy. In this way, the algorithm can ensure global feature consistency while effectively capturing local features, thus enhancing the overall diagnostic performance.
The algorithm’s overall structure can be divided into two parts: I-MFCC preprocessing and neighbor feature convolutional network, as illustrated in Figure 4. Initially, the vibration signal data collected by the sensor cannot be directly input into the model. Therefore, the first step involves sampling the original data to a suitable length, which is 2048 in this study. To simulate the distribution differences between training and test data in real-world scenarios, random interval sampling is chosen to achieve varied time series distributions. The sampled data set then undergoes I-MFCC processing. This step serves multiple purposes: it reduces the impact of data distribution differences on diagnostic accuracy, enhances fault characteristics, and alleviates the learning burden on the model. Subsequently, the I-MFCC processed data is divided into a training set and a test set, following a 1:4 ratio. Next, the data is inputted into the network, which consists of four NNConv blocks. Each block is capable of extracting different levels of fault features. To make optimal use of these features, a combination of deep and shallow features is employed. Deep features capture the detailed texture of the data, while shallow features represent the general contour features. This fusion methodology enables the network to learn more representative features. The experiments are conducted on both the CWRU dataset and the XJTU dataset. By optimizing the model parameters based on the training data, a bearing diagnosis model with high classification performance is obtained. The model’s effectiveness is evaluated using the test dataset, and the results are visualized through a confusion matrix diagram and TSNE diagram. Additionally, Table 1 displays the parameters for each layer of the model.
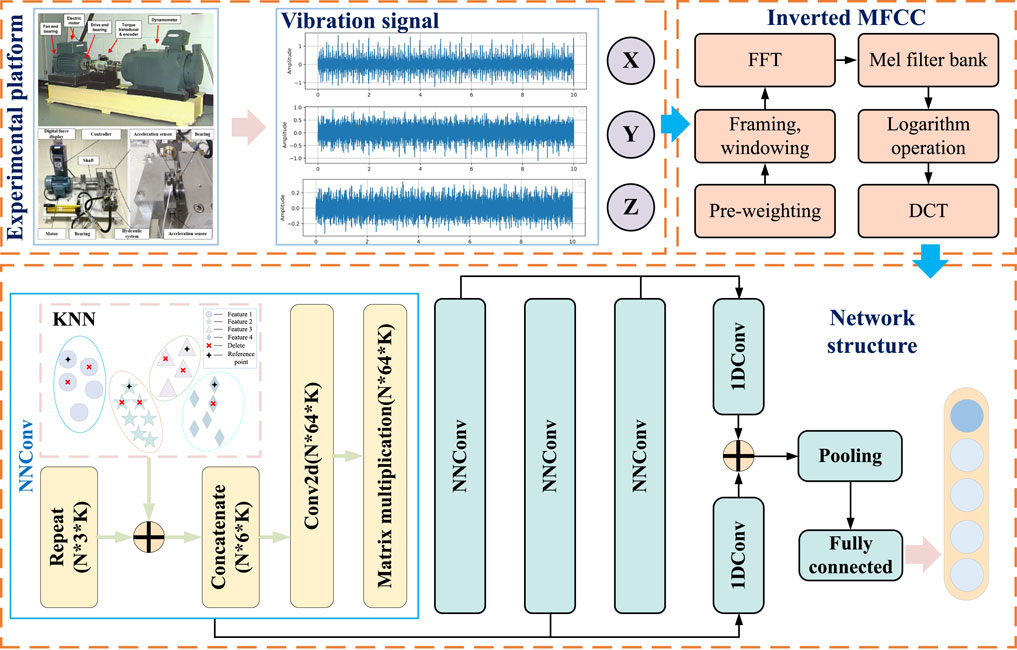
Figure 4. Overall algorithm structure.

Table 1. Model construction parameters.
In this section, we mainly introduce two parts, data acquisition and experimental content. The data acquisition part introduces the method of high-dimensional data mapping, and the experimental content introduces the network structure parameter setting and experimental steps.
XJTU: The Xi’an Jiaotong University (XJTU) data set is collected and provided by the research team of Xi’an Jiaotong University. It includes a large amount of bearing operation data collected in the laboratory, encompassing three different operating conditions. Each working condition consists of five bearings with varying degrees or locations of damage. In this study, each working condition is treated as an independent entity, resulting in a total of 15 bearing states. However, it should be noted that while the network input in this paper is based on three-channel data, the XJTU data set only provides two channels, namely, horizontal and vertical. To accommodate the model’s data requirements, the mean of the data from the two channels is computed and used as the third channel. Additionally, the method of random interval sampling is employed, where each sample has a length of 2048 data points and a dimensionality of.
CWRU: The Case Western Reserve University (CWRU) data set was collected and provided by the research and experimental team of Case Western Reserve University. It utilizes four different fault sizes (0.1778 mm, 0.3556 mm, 0.5334 mm, 0.7112 mm) operating under four distinct operating conditions. It comprises five fault types, including inner ring faults, rolling element faults, and outer ring faults in the three o’clock direction, six o’clock direction, and twelve o’clock direction. Each dataset consists of five dimensions: drive end accelerometer data, fan end accelerometer data, base accelerometer data, time series data, and RPM during testing. For this study, only two fault sizes, namely, 0.1778 mm and 0.5334 mm, were selected, resulting in a total of ten fault types. The drive end accelerometer data, fan end accelerometer data, and base accelerometer data from each dataset were chosen to construct the model’s required three-channel data. Please refer to Table 2 for specific fault types and corresponding labels.
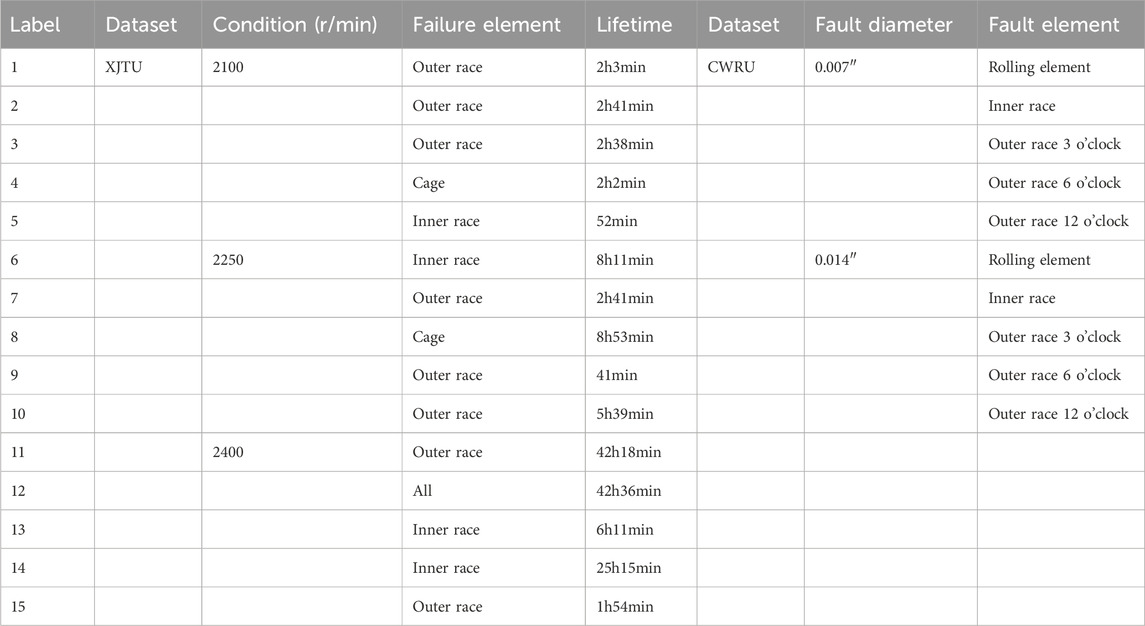
Table 2. Bearing fault type.
The above two datasets are the subjects of experimentation in this paper. The original data is transformed into n
The experimental results consist of three parts: accuracy-loss curve, confusion matrix, and t-Distributed Stochastic Neighbor Embedding (t-SNE) plot. The accuracy and loss curves show the test results and loss over 30 iterations, as shown in Figure 5. From Figure 5, it can be observed that the test accuracy of the data processed by I-MFCCs significantly improved under the condition of NFCN as the backbone network, which is evident in both datasets. This reflects the effectiveness of I-MFCCs preprocessing. The difference between NFCN and CNN lies in the inclusion of the NNConv block. Under the condition that the data are processed, both NFCN and CNN maintain stable classification accuracy on both datasets, but NFCN achieves a rapid convergence to 100
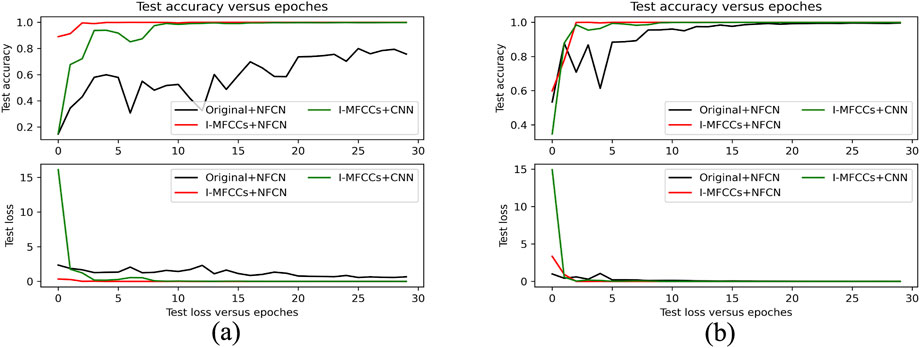
Figure 5. Test accuracy and loss based on inconsistent data feature distribution on XJTU dataset (a) and CWRU dataset (b).
Confusion matrix and t-SNE plot are methods used for visualizing classification results. The confusion matrix presents the relationship between the model’s predicted results and the actual results in a tabular form. In this study, the confusion matrix is presented as a heatmap, where the x-axis represents the predicted results and the y-axis represents the actual results. The t-SNE plot is a visualization method for high-dimensional data that maps the data into two or three-dimensional space, allowing us to better understand the structure and similarity of the data. These two methods provide a simple and intuitive way to assess classification performance. Therefore, they were chosen in this study to visualize the classification results. The classification results can be seen in Figures 6, 7. Figure 6 demonstrate that the proposed method’s predicted results fit perfectly with the actual results. Figure 7 indicate that the proposed method achieves accurate classification of different fault types.
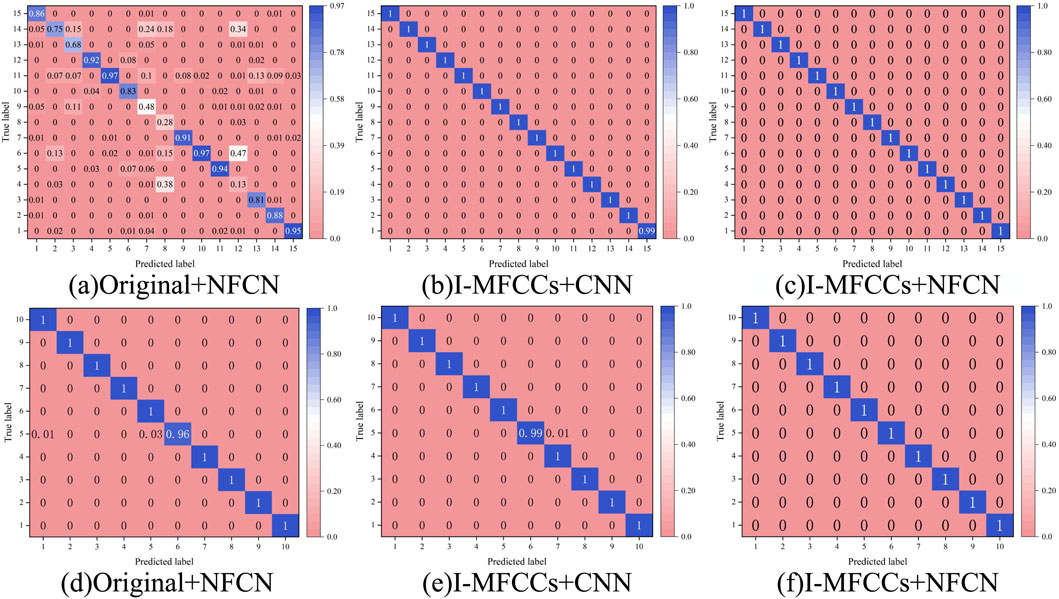
Figure 6. XJTU (a–c) and CWRU (d–f) data confusion matrix diagram.
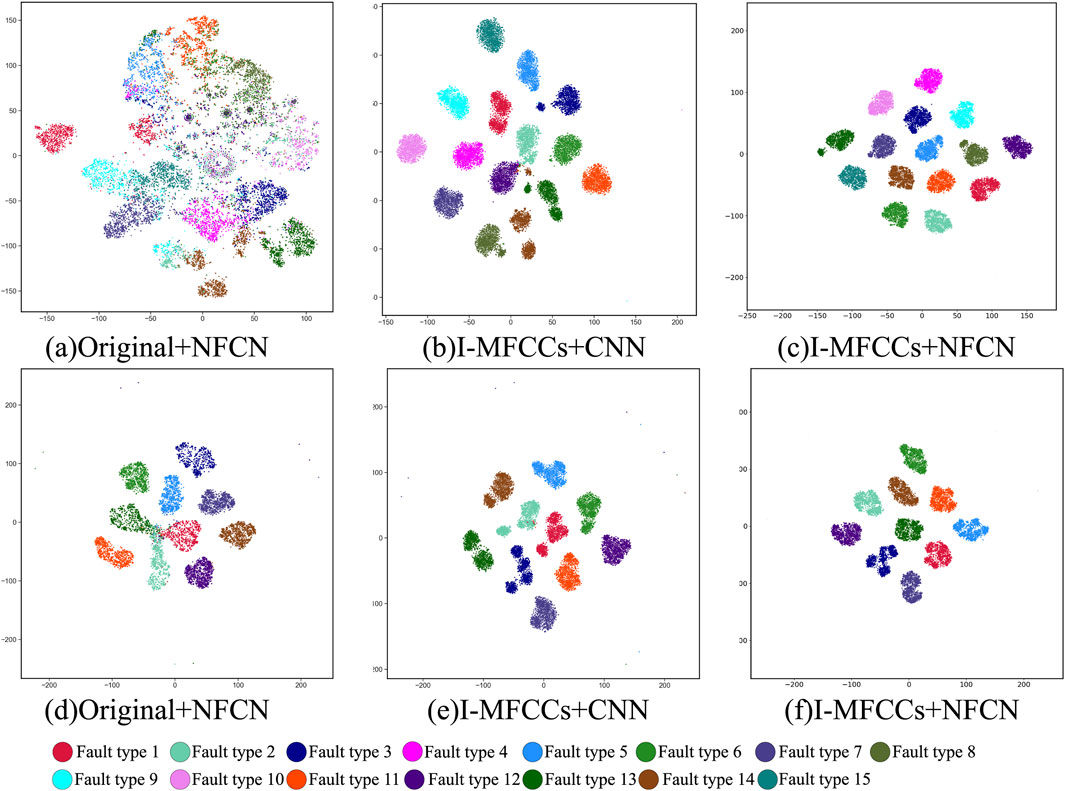
Figure 7. T-SNE diagram of XJTU (a–c) and CWRU (d–f) data.
To enhance the persuasiveness of the results, this study selected recent papers that performed classification tasks on the XJTU and CWRU datasets and compared the results obtained in those papers with the proposed method. It’s worth noting that during the initial training of deep models, parameter adjustments are required, which can lead to significant differences in accuracy compared to normal values. To eliminate the influence of this objective condition on the assessment of method performance, the first two iterations were excluded, and the remaining 28 iterations were used for comparison. The classification results are presented in Table 3. According to the tables, the average accuracy of the proposed method reaches 99.91
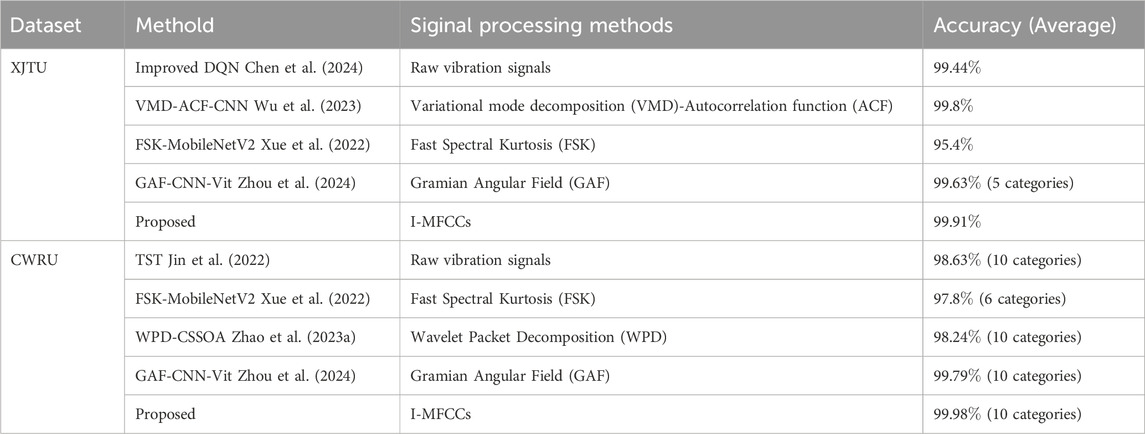
Table 3. Comparison with other thesis methods.
In this paper, a bearing fault diagnosis model based on I-MFCCs and NFCN is proposed, and the validity of the model is verified using XJTU and CWRU data sets. Additionally, this paper conducts various comparative experiments to assess the impact of I-MFCCs and NNConv on the model’s accuracy. The classification results are visualized using the confusion matrix and t-SNE map. The main conclusions are as follows:
(i) Initially, we create data sets using random interval sampling to simulate the covariant shift environment under actual working conditions. Next, the I-MFCCs preprocess the data set to obtain highly discriminating data features. Finally, the deep features of the data are extracted and classified using the NFCN constructed by NNconv. Experimental results indicate that the average fault recognition accuracy of the combined I-MFCCs and NFCN on XJTU and CWRU datasets reaches 99.91
(ii) The confusion matrix and t-SNE are employed to visualize the classification results in the space. It is observed that the combination of I-MFCCs and NFCN enhances the similarity of similar features and the dissimilarity of different fault types, significantly improving the spatial distinguishability of the data.
In future work, we will focus on fault diagnosis under variable working conditions. One limitation of this method is considering the same type of fault under different working conditions as different fault types. Therefore, our next step will involve considering more effective preprocessing methods that can enhance the spatial distinguishability of the data or exploring more efficient networks for extracting the most representative features from the data.
Publicly available datasets were analyzed in this study. This data can be found here: https://gitcode.com/open-source-toolkit/166e4https://drive.google.com/open?id=1_ycmG46PARiykt82ShfnFfyQsaXv3_VK.
HX: Writing – original draft. HJ: Writing – review and editing.
The author(s) declare that financial support was received for the research and/or publication of this article. This research is supported by the Innovation Project of Guangxi Science and Technology Program (Grant No. AB24010143) and the project of improving the basic scientific research ability of young and middle-aged teachers in Guangxi universities (Grant No. 2023KY0911).
The authors declare that the research was conducted in the absence of any commercial or financial relationships that could be construed as a potential conflict of interest.
The author(s) declare that no Gen AI was used in the creation of this manuscript.
All claims expressed in this article are solely those of the authors and do not necessarily represent those of their affiliated organizations, or those of the publisher, the editors and the reviewers. Any product that may be evaluated in this article, or claim that may be made by its manufacturer, is not guaranteed or endorsed by the publisher.
Al Mamun, A., Bappy, M. M., Mudiyanselage, A. S., Li, J., Jiang, Z., Tian, Z., et al. (2023). Multi-channel sensor fusion for real-time bearing fault diagnosis by frequency-domain multilinear principal component analysis. Int. J. Adv. Manuf. Tech. 124, 1321–1334. doi:10.1007/s00170-022-10525-4
Chauhan, S., Vashishtha, G., Kumar, R., Zimroz, R., Gupta, M. K., and Kundu, P. (2024). An adaptive feature mode decomposition based on a novel health indicator for bearing fault diagnosis. Measurement 226, 114191. doi:10.1016/j.measurement.2024.114191
Chen, J., Wang, H., Su, B., and Li, Z. (2024). Rolling bearing fault diagnosis based on drs frequency spectrum image and improved dqn. Trans. Can. Soc. Mech. Eng. 48, 437–446. doi:10.1139/tcsme-2024-0020
Cui, L., Tian, X., Wei, Q., and Liu, Y. (2024). A self-attention based contrastive learning method for bearing fault diagnosis. Expert Syst. Appl. 238, 121645. doi:10.1016/j.eswa.2023.121645
Ding, S., Chen, R., Liu, H., Liu, F., and Zhang, J. (2023). An improved re-parameterized visual geometry group network for rolling bearing fault diagnosis. Rev. Sci. Instrum. 94, 035007. doi:10.1063/5.0130984
Fang, H., Liu, H., Wang, X., Deng, J., and An, J. (2023). The method based on clustering for unknown failure diagnosis of rolling bearings. IEEE T. Instrum. Meas. 72, 1–8. doi:10.1109/TIM.2023.3251406
Guo, Z., Xu, L., Zheng, Y., Xie, J., and Wang, T. (2025). Bearing fault diagnostic framework under unknown working conditions based on condition-guided diffusion model. Measurement 242, 115951. doi:10.1016/j.measurement.2024.115951
Hu, B., Liu, J., and Xu, Y. (2025). A novel multi-scale convolutional neural network incorporating multiple attention mechanisms for bearing fault diagnosis. Measurement 242, 115927. doi:10.1016/j.measurement.2024.115927
Jiang, Z., Zhang, K., Xiang, L., Yu, G., and Xu, Y. (2023). A time-frequency spectral amplitude modulation method and its applications in rolling bearing fault diagnosis. Mech. Syst. Signal. Pr. 185, 109832. doi:10.1016/j.ymssp.2022.109832
Jin, Y., Chen, C., and Zhao, S. (2021). Multisource data fusion diagnosis method of rolling bearings based on improved multiscale cnn. J. Sensors 2021. doi:10.1155/2021/2251530
Jin, Y., Hou, L., and Chen, Y. (2022). A time series transformer based method for the rotating machinery fault diagnosis. Neurocomputing 494, 379–395. doi:10.1016/j.neucom.2022.04.111
Li, X., Yang, Y., Hu, N., Cheng, Z., Shao, H., and Cheng, J. (2022). Maximum margin riemannian manifold-based hyperdisk for fault diagnosis of roller bearing with multi-channel fusion covariance matrix. Adv. Eng. Inf. 51, 101513. doi:10.1016/j.aei.2021.101513
Liang, X., Yao, J., Zhang, W., and Wang, Y. (2023). A novel fault diagnosis of a rolling bearing method based on variational mode decomposition and an artificial neural network. Appl. Sci-Basel. 13, 3413. doi:10.3390/app13063413
Liu, C., Tong, J., Zheng, J., Pan, H., and Bao, J. (2022). Rolling bearing fault diagnosis method based on multi-sensor two-stage fusion. Meas. Sci. Technol. 33, 125105. doi:10.1088/1361-6501/ac8894
Song, B., Liu, Y., Fang, J., Liu, W., Zhong, M., and Liu, X. (2024). An optimized cnn-bilstm network for bearing fault diagnosis under multiple working conditions with limited training samples. Neurocomputing 574, 127284. doi:10.1016/j.neucom.2024.127284
Song, Q., Jiang, X., Du, G., Liu, J., and Zhu, Z. (2023a). Smart multichannel mode extraction for enhanced bearing fault diagnosis. Mech. Syst. Signal. Pr. 189, 110107. doi:10.1016/j.ymssp.2023.110107
Song, Q., Jiang, X., Du, G., Liu, J., and Zhu, Z. (2023b). Smart multichannel mode extraction for enhanced bearing fault diagnosis. Mech. Syst. Signal. Pr. 189, 110107. doi:10.1016/j.ymssp.2023.110107
Tang, H., Tang, Y., Su, Y., Feng, W., Wang, B., Chen, P., et al. (2024). Feature extraction of multi-sensors for early bearing fault diagnosis using deep learning based on minimum unscented kalman filter. Eng. Appl. Artif. Intell. 127, 107138. doi:10.1016/j.engappai.2023.107138
Tong, J., Tang, S., Wu, Y., Pan, H., and Zheng, J. (2023). A fault diagnosis method of rolling bearing based on improved deep residual shrinkage networks. Measurement 206, 112282. doi:10.1016/j.measurement.2022.112282
Wang, G., Fu, Z., Hu, Z., Zhang, M., and Lu, G. (2023a). Bearing fault diagnosis method based on multi-scale domain adaptative network across operating conditions. Meas. Sci. Technol. 34, 035106. doi:10.1088/1361-6501/aca422
Wang, P., Xiong, H., and He, H. (2023b). Bearing fault diagnosis under various conditions using an incremental learning-based multi-task shared classifier. Knowl-Based. Syst. 266, 110395. doi:10.1016/j.knosys.2023.110395
Wang, T., Xu, X., Pan, H., Chang, X., Yuan, T., Zhang, X., et al. (2022). Rolling bearing fault diagnosis based on depth-wise separable convolutions with multi-sensor data weighted fusion. Appl. Sci-Basel. 12, 7640. doi:10.3390/app12157640
Wang, Y., Sun, Y., Liu, Z., Sarma, S. E., Bronstein, M. M., and Solomon, J. M. (2018). Dynamic graph CNN for learning on point clouds. Corr. abs/1801, 07829. doi:10.48550/arXiv.1801.07829
Wang, Z., Chen, H., Yao, L., Chen, X., Qi, X., and Zhang, J. (2021). An effective multi-channel fault diagnosis approach for rotating machinery based on multivariate generalized refined composite multi-scale sample entropy. Nonlinear Dyn. 106, 2107–2130. doi:10.1007/s11071-021-06827-z
Wu, Y., Liu, L., and Qian, S. (2023). A small sample bearing fault diagnosis method based on variational mode decomposition, autocorrelation function, and convolutional neural network. Int. J. Adv. Manuf. Tech. 124, 3887–3898. doi:10.1007/s00170-021-08126-8
Xu, P., and Zhang, L. (2023). A fault diagnosis method for rolling bearing based on 1d-vit model. IEEE Access 11, 39664–39674. doi:10.1109/ACCESS.2023.3268534
Xu, X., Tao, Z., Ming, W., An, Q., and Chen, M. (2020). Intelligent monitoring and diagnostics using a novel integrated model based on deep learning and multi-sensor feature fusion. Measurement 165, 108086. doi:10.1016/j.measurement.2020.108086
Xue, T., Wang, H., and Wu, D. (2022). Mobilenetv2 combined with fast spectral kurtosis analysis for bearing fault diagnosis. Electronics-Switz 11, 3176. doi:10.3390/electronics11193176
Yang, M., Zhang, K., Sheng, Z., Zhang, X., and Xu, Y. (2024). The amplitude modulation bispectrum: a weak modulation features extracting method for bearing fault diagnosis. Reliab. Eng. Syst. Saf. 250, 110241. doi:10.1016/j.ress.2024.110241
Yao, P., Wang, J., Zhang, F., Li, W., Lv, S., Jiang, M., et al. (2022). Intelligent rolling bearing imbalanced fault diagnosis based on mel-frequency cepstrum coefficient and convolutional neural networks. Measurement 205, 112143. doi:10.1016/j.measurement.2022.112143
Zhang, T., Xu, F., and Jia, M. (2022). A centrifugal fan blade damage identification method based on the multi-level fusion of vibro-acoustic signals and cnn. Measurement 199, 111475. doi:10.1016/j.measurement.2022.111475
Zhang, Z., and Wu, L. (2024). Graph neural network-based bearing fault diagnosis using granger causality test. Expert Syst. Appl. 242, 122827. doi:10.1016/j.eswa.2023.122827
Zhao, F., Jiang, Y., Cheng, C., and Wang, S. (2023a). An improved fault diagnosis method for rolling bearings based on wavelet packet decomposition and network parameter optimization. Meas. Sci. Technol. 35, 025004. doi:10.1088/1361-6501/ad0691
Zhao, Y., Qin, B., Zhou, Y., and Xu, X. (2023b). Bearing fault diagnosis based on inverted mel-scale frequency cepstral coefficients and deformable convolution networks. Meas. Sci. Technol. 34, 055404. doi:10.1088/1361-6501/acb0ea
Keywords: bearing, fault diagnosis, mel-scale frequency cepstral coefficient, multi-channel data, nearest neighbor convolution block
Citation: Xiao H and Jian H (2025) Fault diagnosis algorithm based on multi-channel neighbor feature convolutional network. Front. Mech. Eng. 11:1591815. doi: 10.3389/fmech.2025.1591815
Received: 11 March 2025; Accepted: 07 April 2025;
Published: 14 April 2025.
Edited by:
Zhenzhen Jin, Guangxi University, ChinaReviewed by:
Fan Zhang, Southwest Jiaotong University, ChinaCopyright © 2025 Xiao and Jian. This is an open-access article distributed under the terms of the Creative Commons Attribution License (CC BY). The use, distribution or reproduction in other forums is permitted, provided the original author(s) and the copyright owner(s) are credited and that the original publication in this journal is cited, in accordance with accepted academic practice. No use, distribution or reproduction is permitted which does not comply with these terms.
*Correspondence: Hanqing Jian, amhxNjEyN0AxNjMuY29t
Disclaimer: All claims expressed in this article are solely those of the authors and do not necessarily represent those of their affiliated organizations, or those of the publisher, the editors and the reviewers. Any product that may be evaluated in this article or claim that may be made by its manufacturer is not guaranteed or endorsed by the publisher.
Research integrity at Frontiers
Learn more about the work of our research integrity team to safeguard the quality of each article we publish.