
94% of researchers rate our articles as excellent or good
Learn more about the work of our research integrity team to safeguard the quality of each article we publish.
Find out more
ORIGINAL RESEARCH article
Front. Mech. Eng., 27 February 2025
Sec. Vibration Systems
Volume 11 - 2025 | https://doi.org/10.3389/fmech.2025.1547120
 Zongfang Zhang1*
 Maoyou Zhang2
As train operating speeds increase, the quality of pantograph-catenary current collection deteriorates, sometimes even resulting in contact loss. To ensure stable current collection during high-speed operation, it is crucial to optimize the design parameters of the catenary system. This study employs finite element analysis and constructs a pantograph-catenary coupling model using MSC. Marc software to simulate the coupled motion between the catenary and the pantograph. During the research process, the primary technical challenge was accurately evaluating the comprehensive effects of multi-parameter variations on pantograph-catenary current collection quality. First, we independently analyzed the effects of catenary tension and linear density variations on contact pressure to clarify the mechanisms of individual parameter influences. However, recognizing that multiple parameters might change simultaneously in actual operations, we introduced the Response Surface Methodology (RSM) to deeply explore the combined effects of two parameters on current collection quality. The innovation of this study lies not only in considering the effects of individual parameters but also in systematically analyzing the impact of multi-parameter interactions using RSM. Furthermore, from the perspective of the combined effects of catenary tension and contact wire linear density, we proposed an optimized catenary design scheme for the 500 km/h high-speed train operation scenario. Specifically, by increasing the contact wire tension, reducing the messenger wire tension, and lowering the linear density of the contact wire, we can significantly improve pantograph-catenary current collection quality, thereby providing robust support for the safe and stable operation of high-speed railways. In conclusion, this study addresses key technical challenges in multi-parameter optimization and proposes a practical optimization scheme with significant application value, offering important references for the design and optimization of high-speed railway catenary systems.
In typical high-speed electrified railways, power is supplied to trains through the interaction between the pantograph and the catenary (Wu et al., 2022). The stability of this interaction, indicated by the contact pressure, directly reflects the quality of current collection (Pombo et al., 2009). As train speeds increase, disturbances from wheel-rail dynamics and aerodynamic forces exacerbate pantograph vibrations and catenary oscillations (Luo et al., 2024). These effects lead to significant fluctuations in contact pressure, resulting in issues such as loss of contact and electrical arcing, which pose critical challenges to achieving higher operational speeds (Liu et al., 2023a).
Previously, extensive research has been conducted on current collection quality for high-speed pantograph-catenary systems (Liu et al., 2023b). Studies by Zhang et al. (2006) and Zhou and Zhang (2011), Zhou et al. (2011) have examined how different suspension types and structural parameters affect contact pressure. Jin Hee Lee and colleagues highlighted the importance of contact wire tension on current collection quality (Jin et al., 2015), while J. Pombo explored the impact of pantograph vibration characteristics and parameter adjustments on contact pressure (Pombo and Ambrósio, 2012). Mitsuo Aboshi analyzed how reflection coefficients affect current collection quality, and other studies investigated the influence of factors like pantograph speed and suspension stiffness on the dynamics of the pantograph-catenary system (Aboshi and Manabe, 2000).
Above mentioned previous studies have primarily focused on analyzing the impact of variations in individual parameters on the current collection quality of the pantograph-catenary system (Liu et al., 2023b; Zhang et al., 2006; Zhou and Zhang, 2011; Zhou et al., 2011; Jin et al., 2015; Pombo and Ambrósio, 2012; Aboshi and Manabe, 2000). However, during high-speed train operation, the intensified vibrations of the pantograph and oscillations of the contact wire make it challenging to meet current collection requirements by adjusting a single parameter alone.
Based on above discussions, this study considers the combined effects of multiple parameters and proposes an optimized catenary structure capable of ensuring stable current collection during high-speed operation. Building upon the analysis of individual parameter effects, this study employs the response surface methodology to evaluate the influence of pairwise parameter combinations on current collection quality. Response surface methodology has widely been used in optimization of the pantograph-catenary interactions in the high-speed railway systems (Wang et al., 2024; Su et al., 2023; Song et al., 2024; Liu et al., 2024). Furthermore, based on the simultaneous variation of multiple parameters, a specific design scheme for catenary parameters is proposed for trains operating at 500 km/h. This scheme offers meaningful guidance for the design of catenary parameters in high-speed railway systems.
In this study, to improve the accuracy of contact pressure calculations in the pantograph-catenary system, an Euler-Bernoulli beam element was employed, taking into account factors such as droppers’ stiffness and supporting devices. A finite element model of the catenary was established to simulate the motion of various nodes within the catenary system (Park et al., 2003).
In the model, the motion equation for each mass point of the contact wire is expressed as:
In the Equation 1, Mc represents the unit mass of the contact wire, EIc denotes the bending stiffness of the contact wire, and Tc indicates the tension in the contact wire. The Dirac delta function δ accounts for the impact forces, while F represents the contact pressure between the pantograph and the contact wire. The displacement of the contact wire is denoted as uc, and um represents the displacement of the messenger wire. Furthermore, xn is the distance between the dropper point and the motion point, x is the position of the motion point, t represents the motion time, and v is the train’s operating speed.
The motion equation for the load-bearing cable is:
In the Equation 2, mm represents the unit mass of the load-bearing cable; EIm denotes the bending rigidity of the cable; Tm is the tension in the load-bearing cable; kd indicates the stiffness of the suspension wire; ks refers to the equivalent stiffness of the supporting device; and xs is the distance between the support point and the motion point.
A three-mass model, which reflects the high-frequency vibrations of the pantograph, is adopted (Massat et al., 2006; Bruni et al., 2018; Cho et al., 2010). The equation of motion is given by Equation 3:
In the equation, m1 represents the mass of the pantograph head; m2 is the mass of the upper frame; m3 denotes the mass of the pantograph lower frame; ki indicates the equivalent stiffness;ci refers to the equivalent damping; F(t) is the contact pressure between the pantograph and the overhead contact wire; and F0 is the static lifting force provided to the pantograph by the push rod.
In the parameter design of the model, the contact network adopts the elastic chain suspension structure of the Beijing-Tianjin Intercity High-Speed Railway, and the pantograph employs the Faiveley single-slide pantograph structure. The specific design parameters of the pantograph-wire system are shown in Figure 1. Based on the contact network-pantograph structure and parameters shown in Figure 2, a simulation model of the full-anchor segment elastic chain suspension contact network and single-slide pantograph is established using MSC. marc simulation software, as depicted in Figure 2.
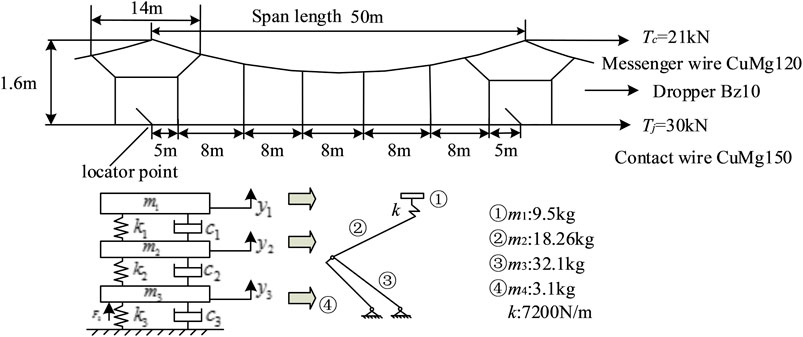
Figure 1. Schematic diagram of the elastic chain contact network and pantograph coupling model structure.
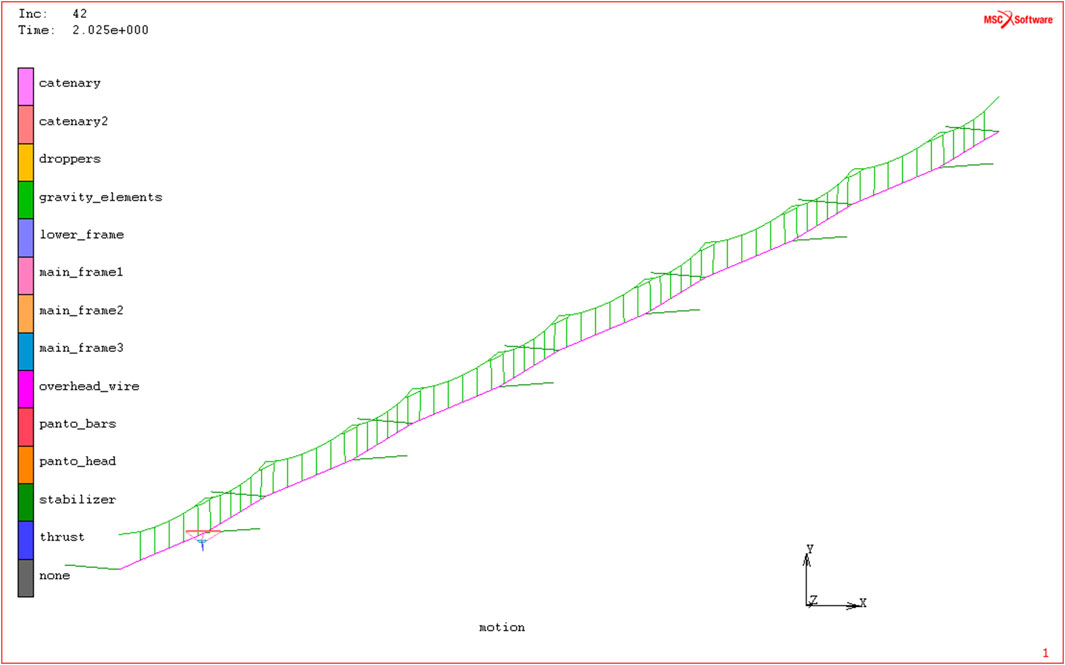
Figure 2. Simulation model of the elastic chain contact network and pantograph system.
In this study, the pantograph-wire model is validated according to the European railway standard EN50318 (EN50318, 2002). Based on the pantograph-wire parameters provided in the EN50318 standard, an Euler-Bernoulli beam contact network model and a three-mass pantograph model are established in MSC. Marc. The contact pressure at operating speeds of 250 km/h and 300 km/h is calculated and compared with the specified range in the EN50318 standard, as shown in Table 1.
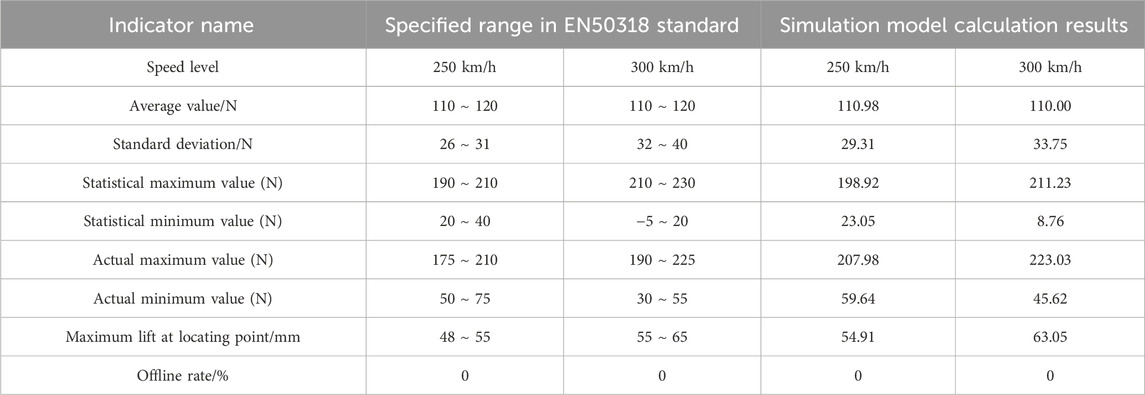
Table 1. Statistical data of pantograph-wire simulation results and the specified range in EN50318 standard.
As shown in Table 1, under the operating speeds of 250 km/h and 300 km/h, the simulation results obtained from the modeling in MSC. Marc fall within the specified range of the EN50318 standard. This confirms the feasibility of establishing the pantograph-wire finite element model in MSC.marc.
Under a constant pantograph speed, contact pressure across various points within a span is influenced by the catenary’s elasticity and line mass. This can be described with the following dynamic equation (Li et al., 2022):
In the equation, F represents the contact pressure; η is the elasticity of the overhead contact line particle; C is the damping of the overhead contact line particle; M is the mass of the overhead contact line particle. Under the condition of neglecting the mass of the suspension wires and locating points, M is composed of the mass of the contact line and the carrying cable.
The elasticity at each position point within a span of the overhead contact line can be expressed as follows:
In the equation, x represents the position of a point within the span; l is the span length; Tc and Tj represent the tension in the carrying cable and the contact line, respectively.
Substituting Equation 5 into Equation 4 yields:
From the above Equation 6, it can be seen that, under the condition of not changing the structural parameters of the overhead contact line — that is, without altering the span length, the spacing of the suspension wires, the structural height, and other parameters — the contact pressure at each point within the span is primarily related to the tension in the contact line and the design parameters of the line’s mass.
The average value and standard deviation of the contact pressure are important indicators for measuring the quality of current collection between the pantograph and the overhead contact line. The following analysis will use the average contact pressure and standard deviation as evaluation metrics to examine the impact of individual variations in contact line design parameters on contact pressure, as well as the effects of combinations of two variables changing simultaneously on contact pressure.
Based on the simulation model in Section 2.1, the effects of changes in the contact line tension and the supporting cable tension on the contact pressure are analyzed separately. When analyzing the effect of contact line tension, other parameters are kept constant, with the train running at a speed of 300 km/h. The contact pressure curves are calculated for contact line tensions of 21 kN, 24 kN, 27 kN, 30 kN, and 30 kN. Similarly, the contact pressure curves are calculated for supporting cable tensions of 15 kN, 18 kN, 21 kN, 24 kN, and 27 kN. Figures 3A, B show the contact pressure curves under varying contact line and supporting cable tensions.
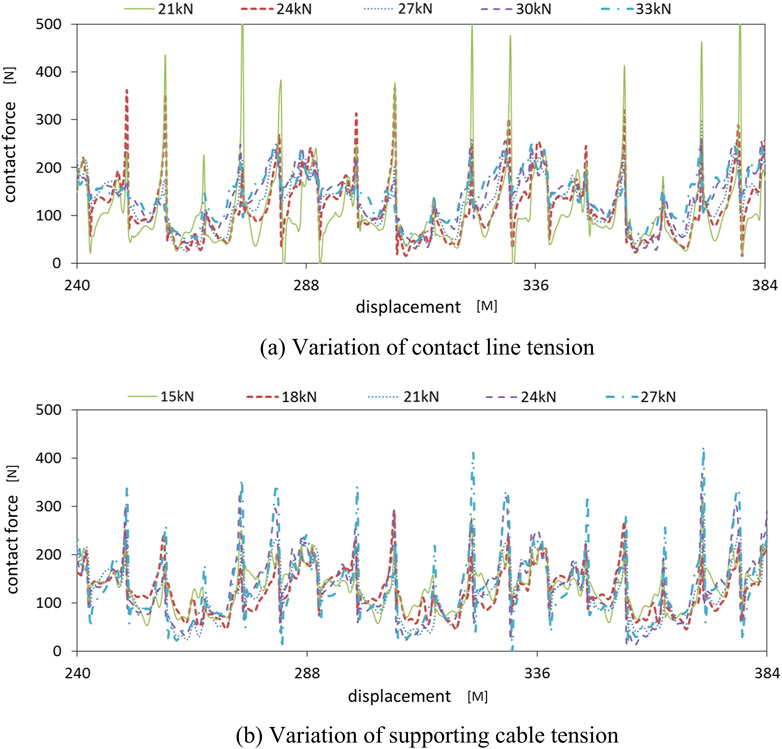
Figure 3. Contact pressure variation curve with changes in tension of the contact line. (A) Variation of contact line tension. (B) Variation of supporting cable tension.
From Figures 3A,B, it can be seen that the contact pressure curve exhibits periodic variation with the span as a cycle. Within one cycle, there is a peak in contact pressure near the positioning points, while the pressure is relatively low in the middle of the span. This is because the stiffness of the catenary near the positioning points is high, which limits the lifting of the pantograph, making it difficult to raise the contact line. On the other hand, the stiffness of the catenary in the middle of the span is lower, allowing the contact line to be lifted more easily, hence the observed phenomenon. As the tension in the contact line and supporting cable increases, the contact pressure curve generally shifts upwards. This is due to the fact that increasing the line tension enhances the overall stiffness of the catenary, leading to an increase in the average contact pressure. From Figure 3A, it can be observed that increasing the contact line tension tends to reduce the peak contact pressure, while in Figure 3B, increasing the supporting cable tension tends to increase the peak contact pressure. This is because increasing the contact line tension reduces the unevenness in the stiffness of the catenary, whereas increasing the supporting cable tension increases the stiffness unevenness of the catenary. Therefore, in Figures 3A, B, the variation in peak contact pressure shows opposite trends with respect to the changes in the tensions of the contact line and the supporting cable.
Based on the simulation model presented in Section 2.1, the effects of variations in the contact wire line density and supporting cable line density on the contact pressure are analyzed. When discussing the effect of wire line density, all other parameters are kept constant, with the train operating speed set at 300 km/h. The contact pressure curves are calculated for contact wire and supporting cable line densities of 0.78 kg/m, 0.93 kg/m, 1.08 kg/m, 1.23 kg/m, and 1.38 kg/m, as shown in Figure 4.
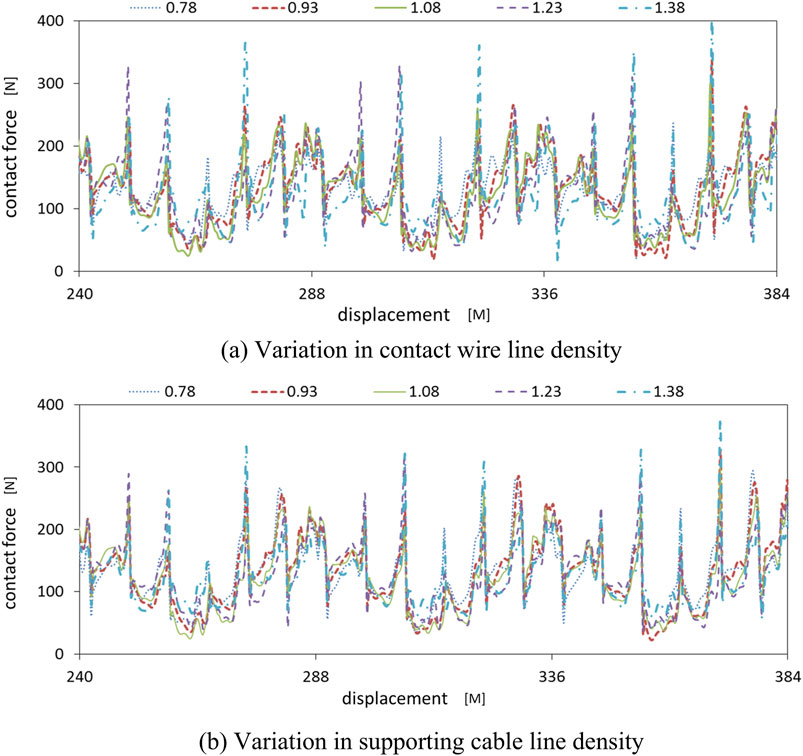
Figure 4. Variation of contact pressure curve with changes in wire line density. (A) Variation in Contact Wire Line Density. (B) Variation in Supporting Cable Line Density.
From Figures 4A, B, it can be observed that as the wire line density increases, the amplitude of the contact pressure curve increases. The contact pressure value in the middle span decreases, while the peak value near the contact point increases. This is due to the increase in the wire line density, which enhances the inertia of the catenary system, making it harder for the operating state of the catenary to change. When the pantograph and contact wire move in contact with each other, the larger mass of the catenary leads to an opposite or relative motion between the pantograph and the contact wire. As a result, increasing the wire line density causes the amplitude variation of the contact pressure curve to become larger.
In summary, within a certain range, modifying a single parameter of the catenary system—such as increasing the contact wire tension, reducing the supporting cable tension, or decreasing the line density of the contact wire or supporting cable-can improve the quality of pantograph-catenary current collection.
To further discuss the influence of the combination of contact wire tension, catenary tension, contact wire linear density, and catenary linear density on contact pressure, this paper introduces the response surface method to conduct experiments, modeling, and data analysis between catenary design parameters and contact pressure. By establishing the functional relationship between independent variables and dependent variables, the contour maps of the combination of various factors are obtained, and the optimal value of the response and combination parameters are predicted.
In this paper, the most common test method in response surface analysis, namely, the central composite experiment (Lundstedt et al., 1998; Bartz-Beielstein et al., 2010), is used. The test points of the two-level central composite design are shown in Figure 5.
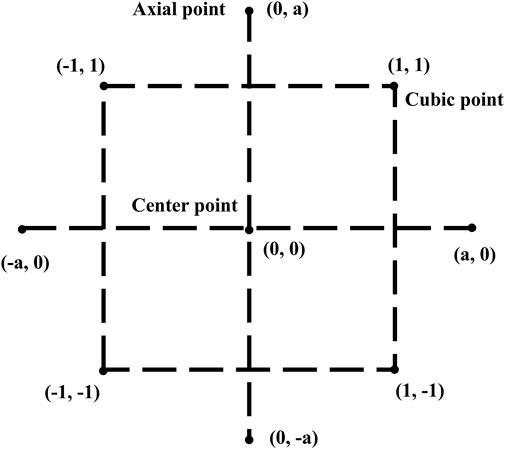
Figure 5. Test points of central composite design.
To analyze the train operating speed at 300 km/h, this design takes four catenary design parameters as independent variables and the statistical values of contact pressure as the dependent variable. A response surface methodology analysis was conducted to study the relationship between them. As discussed in the previous section, there is a significant functional relationship between the contact wire tension, messenger wire tension, contact wire linear density, and messenger wire linear density and the statistical indicators of contact pressure. However, this relationship is not strictly linear. Therefore, the regression equation is set as a second-order interaction nonlinear model (2FI model), which is expressed as Equation 7:
Here,
The basic parameters of the catenary are Tj0 = 27 kN, Tc0 = 21 kN, Mj0 = 1.08 kg/m, and Mc0 = 1.08 kg/m. Design-Expert 8.0 is used to perform response surface analysis on the experimental data, and contour maps of the maximum contact pressure and the standard deviation of contact pressure are obtained respectively. As shown in Figures 6, 7, the analysis results are shown in Tables 2, 3 respectively.
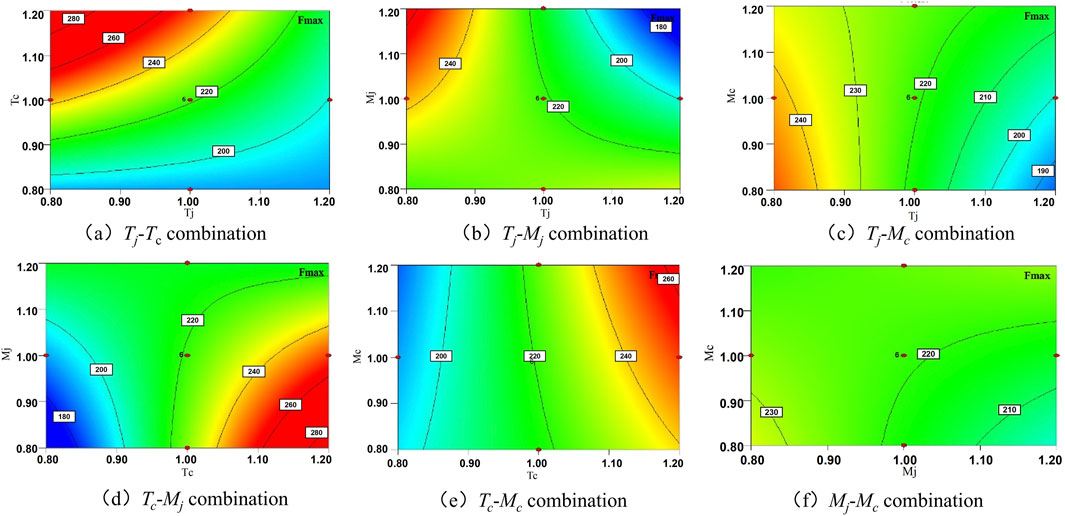
Figure 6. Contour map of the maximum contact pressure at 300 km/h. (A) Tj-Tc combination (B) Tj-Mj combination (C) Tj-Mc combination (D) Tc-Mj combination (E) Tc-Mc combination (F) Mj-Mc combination.
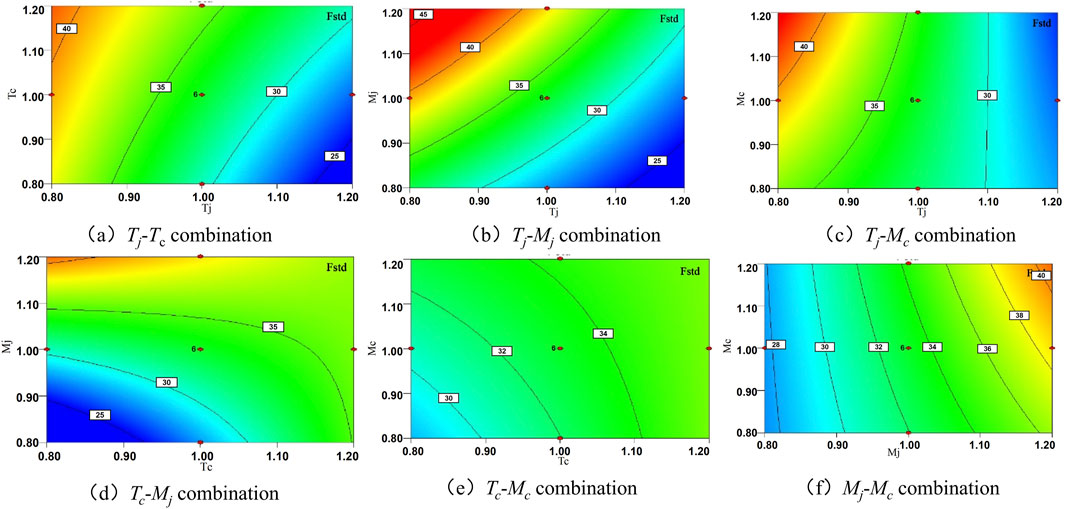
Figure 7. Contour map of the standard deviation of contact pressure at 300 km/h. (A) Tj-Tc combination (B) Tj-Mj combination (C) Tj-Mc combination (D) Tc-Mj combination (E) Tc-Mc combination (F) Mj-Mc combination.
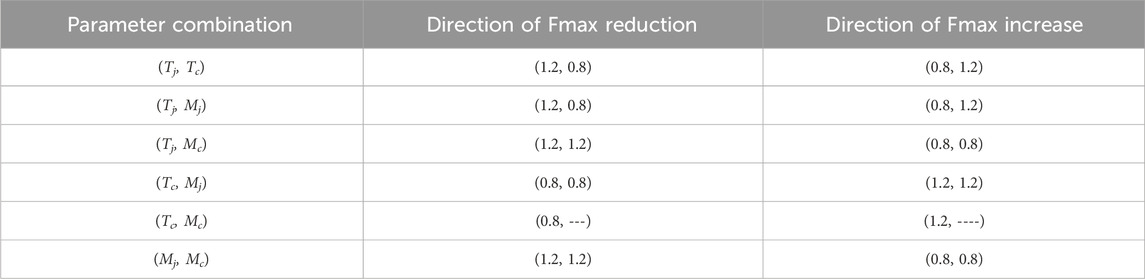
Table 2. Trend of maximum value with parameters.
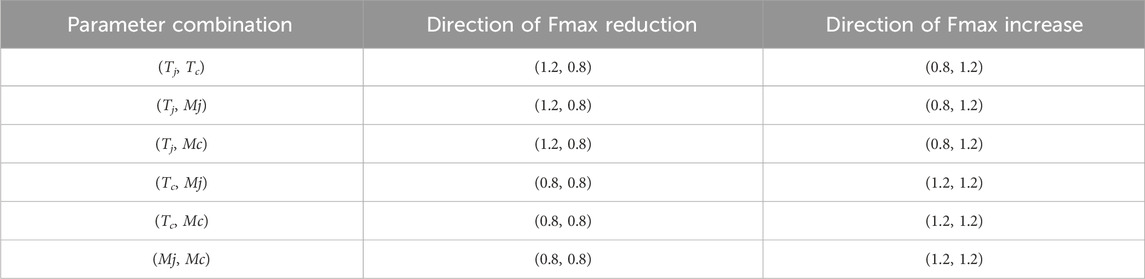
Table 3. Trend of standard deviation with parameters.
According to Figure 6; Table 2, at a speed level of 300 km/h, when the design parameters change simultaneously, increasing the contact wire tension, reducing the catenary tension, and reducing the linear density of the contact wire can lead to a consistent decreasing trend in the standard deviation of contact pressure. However, the influence of the linear density of the catenary on the standard deviation of contact pressure is inconsistent when combined with different parameter combinations, and the combined effect with other parameters needs to be considered. According to the overall changing trend, the parameter combination that minimizes the standard deviation of contact pressure within the test area is in the neighborhood of (Tj = 1.2Tj0, Tc = 0.8Tc0, Mj = 0.8Mj0, Mc = 1.2Mc0). At 300 km/h, to minimize the maximum contact pressure, the catenary parameters need to be optimized in this direction.
According to Figure 7; Table 3, at a speed level of 300 km/h, when the design parameters change simultaneously, increasing the contact wire tension, reducing the catenary tension, and reducing the linear density of the contact wire can lead to a consistent decreasing trend in the standard deviation of contact pressure. However, the influence of the linear density of the catenary on the standard deviation of contact pressure is inconsistent when combined with different parameter combinations, and the combined effect with other parameters needs to be considered. According to the overall changing trend, the parameter combination that minimizes the standard deviation of contact pressure within the test area is in the neighborhood of (Tj = 1.2Tj0, Tc = 0.8Tc0, Mj = 0.8Mj0, Mc = 1.2Mc0). This indicates that under the condition of 300 km/h, to minimize the standard deviation of contact pressure, the catenary parameters need to be optimized in this direction.
From the above analysis, when two parameters are combined with each other, the contact wire tension and catenary tension are important factors affecting the contact pressure. When the linear density of the catenary and the tension of the wires are combined respectively, the main variable affecting the contact pressure is the wire tension, while the influence of the linear density of the catenary is very small.
Considering the influence of the change of catenary parameters on the standard deviation and average value of contact pressure comprehensively, when the train running speed is 300 km/h, increasing the contact wire tension, reducing the catenary tension, and reducing the linear density of the contact wire can improve the current collection quality of the pantograph-catenary system.
When the train running speed is 500 km/h, there are more off-line points between the pantograph and catenary. Therefore, the influence of the pairwise combination of catenary parameters on the maximum contact pressure, the standard deviation of contact pressure, and the off-line rate will be discussed below.
The contour map of the maximum contact pressure at a running speed of 500 km/h is shown in Figure 8.
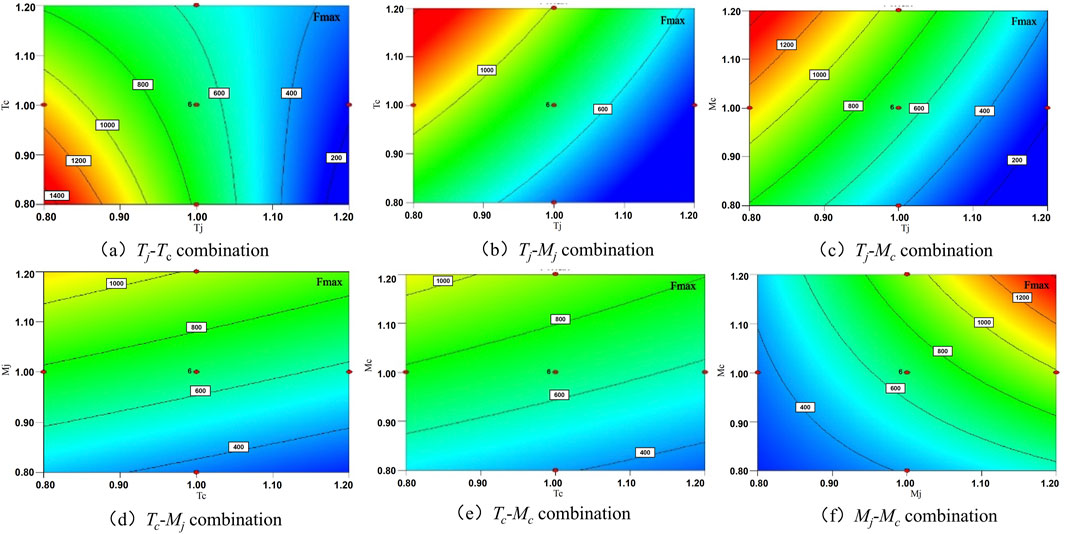
Figure 8. Contour map of the maximum contact pressure at 500 km/h. (A) Tj-Tc combination (B) Tj-Mj combination (C) Tj-Mc combination (D) Tc-Mj combination (E) Tc-Mc combination (F) Mj-Mc combination.
According to Figure 8; Table 4, it can be known that at a speed level of 500 km/h, when the design parameters change simultaneously, increasing the contact wire tension, increasing the messenger wire tension, and reducing the contact wire linear density can make the standard deviation of contact pressure show a consistent decreasing trend. However, the influence of the messenger wire linear density on the standard deviation of contact pressure is inconsistent when combined with different parameter combinations, and the combined effect with other parameters needs to be considered. According to the overall change trend, the parameter combination that minimizes the standard deviation of contact pressure within the test area is in the neighborhood of (Tj = 1.2Tj0, Tc = 1.2Tc0, Mj = 0.8Mj0, Mc = 0.8Mc0). At 500 km/h, to minimize the standard deviation of contact pressure, the catenary parameters need to be optimized in this direction.
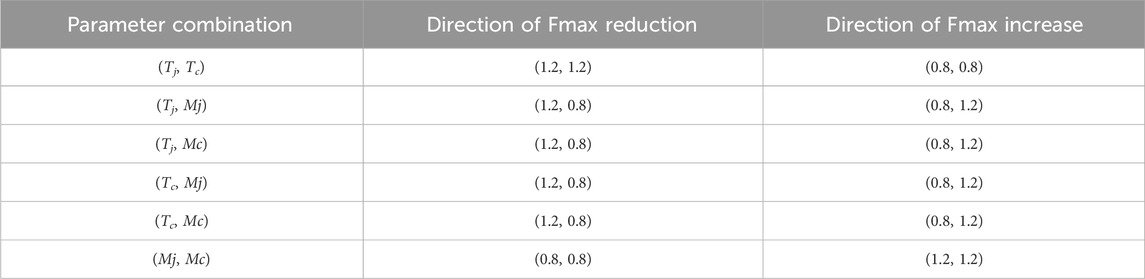
Table 4. The variation trend of the maximum value with parameters.
The contour map of the standard deviation rate of contact pressure under the condition of an operating speed of 500 km/h is shown in Figure 9.
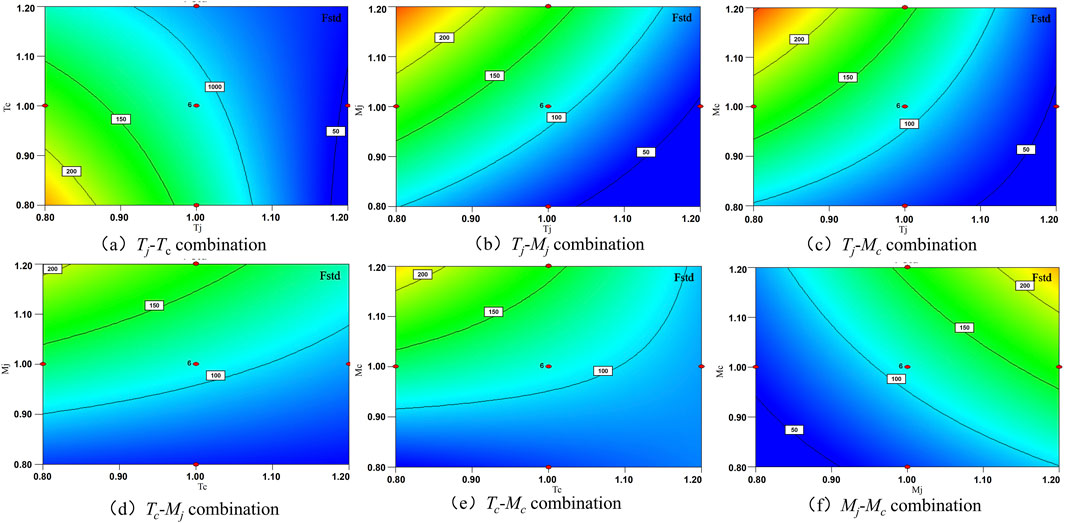
Figure 9. Contour map of standard deviation at 500 km/h. (A) Tj-Tc combination (B) Tj-Mj combination (C) Tj-Mc combination (D) Tc-Mj combination (E) Tc-Mc combination (F) Mj-Mc combination.
According to Figure 9; Table 5, at a speed level of 500 km/h, when the design parameters change simultaneously, increasing the contact wire tension, reducing the catenary wire tension, and reducing the contact wire linear density can make the standard deviation of contact pressure show a consistent decreasing trend. However, when the catenary wire linear density is combined with different parameter combinations, the influence on the standard deviation of contact pressure is inconsistent, and the combined effect with other parameters needs to be considered. According to the overall variation trend, the parameter combination that minimizes the standard deviation of contact pressure within the test area is in the neighborhood of (Tj = 1.2Tj0, Tc = 1.2Tc0, Mj = 0.8Mj0, Mc = 0.8Mc0). This indicates that under the condition of 500 km/h, to minimize the standard deviation of contact pressure, the catenary parameters need to be optimized in this direction. The off-line contour map of contact pressure under the condition of an operating speed of 500 km/h is shown in Figure 10.
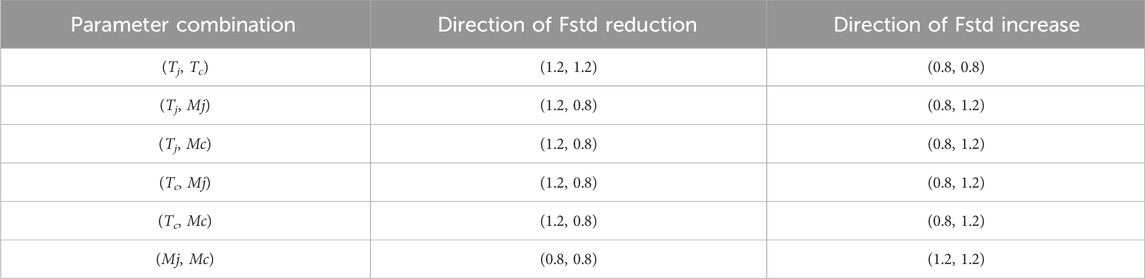
Table 5. The variation trend of standard deviation with parameters.
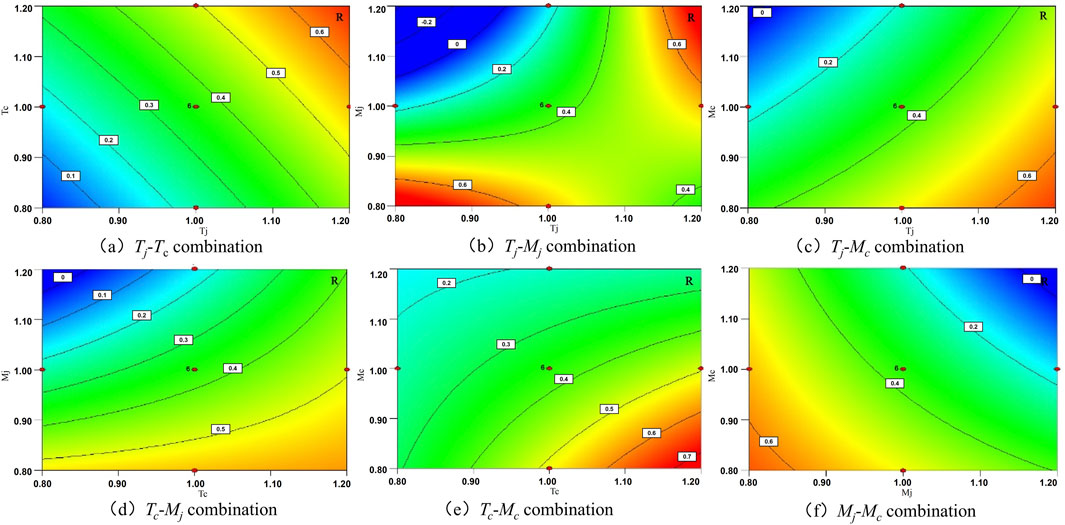
Figure 10. Contour map of off-line rate at 500 km/h. (A) Tj-Tc combination (B) Tj-Mj combination (C) Tj-Mc combination (D) Tc-Mj combination (E) Tc-Mc combination (F) Mj-Mc combination.
As can be seen from Figure 10 and Table 6, at a level of 500 km/h, the influence trends of various parameters on the off-line rate are not consistent. Increasing the tension of the contact wire, reducing the tension of the catenary wire, and reducing the linear density of the contact wire all reduce the off-line rate under any combination. The change of the linear density of the catenary wire is not consistent according to different combinations. In comprehensive consideration, the parameter combination that can reduce the off-line rate is within the neighborhood of (Tc = 0.8Tc0, Tj = 1.2Tj0, Mc = 1.2Mc0, Mj = 0.8Mj0).
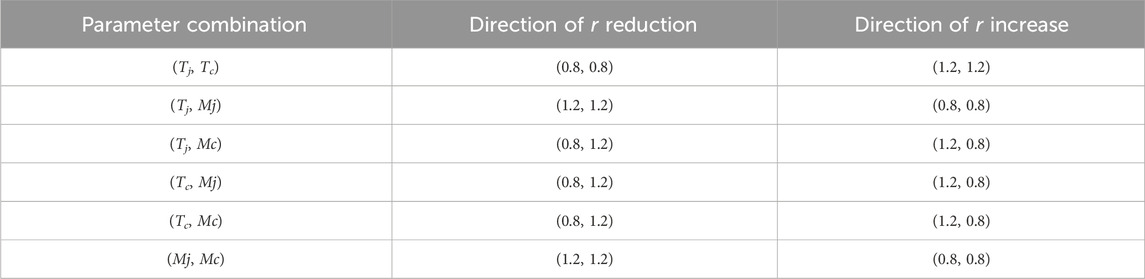
Table 6. Variation trend of off-line rate with parameters.
According to the analysis of the response surface contour map of the maximum contact pressure, standard deviation, and off-line rate at a speed level of 500 km/h, when changing the linear density of the catenary wire under different parameter combinations, the influence on the standard deviation of contact pressure is consistent, but the influence on the off-line rate is inconsistent. However, considering the overall change of contact pressure, the optimization direction is (Tc = 0.8Tc0, Tj = 1.2Tj0, Mc = 1.2Mc0, Mj = 0.8Mj0), that is, increasing the tension of the contact wire, reducing the tension of the catenary wire, reducing the linear density of the contact wire, and increasing the linear density of the catenary wire.
From the above analysis, it can be seen that the tension of the contact wire, the tension of the catenary wire, and the linear density of the contact wire have a consistent influence on the contact pressure under mutual combinations, while the influence of the linear density of the catenary wire is not very consistent. Therefore, this paper proposes the following optimization schemes. As shown in Table 7.
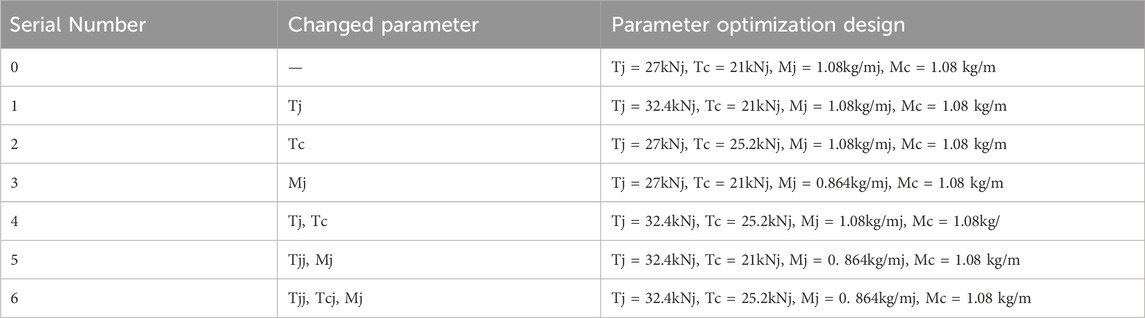
Table 7. Optimization design scheme of catenary parameters for high-speed projectile chain with a speed of 500 km per hour.
According to the optimized parameter settings in Table 7, the contact pressures obtained under several schemes are compared with the contact pressure before optimization, as shown in Figures 11, 12.

Figure 11. Comparison of contact pressure change curves before and after optimization. (A) The optimization effect of Scheme 1 (B) the optimization effect of Scheme 2 (C) the optimization effect of Scheme 3 (D) the optimization effect of Scheme 4 (E) the optimization effect of Scheme 5 (F) the optimization effect of Scheme 6.
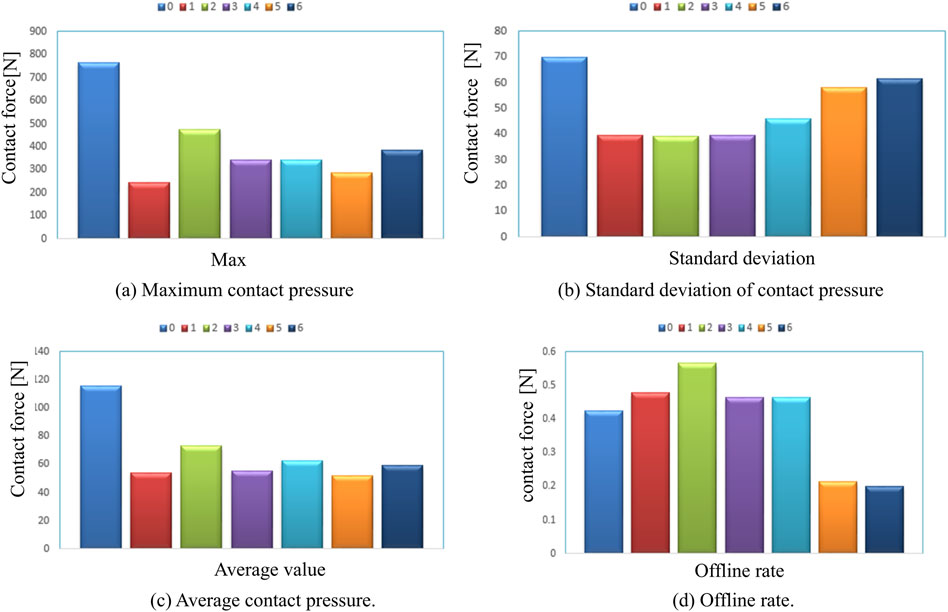
Figure 12. Comparison of statistical values of contact pressure before and after optimization. (A) Maximum contact pressure (B) standard deviation of contact pressure (C) average contact pressure (D) offline rate.
As can be seen from Figures 11, 12, when two parameters are optimized simultaneously, the peak value of contact pressure is greatly reduced. The maximum contact pressure is reduced to below 250 N. The average contact pressure increases, and the standard deviation value is significantly reduced. The offline rate is greatly reduced. When three parameters are changed simultaneously, the optimization effect on contact pressure is more obvious. The standard deviation of contact pressure is further reduced, and the offline rate is reduced to within 1%. It fully meets the requirements of pantograph-catenary current collection quality. In conclusion, at a running speed of 500 km/h, by increasing the contact wire tension, reducing the catenary wire tension, and reducing the contact wire density, a catenary structure can be optimized to make the pantograph-catenary operation result very ideal.
The pantograph-catenary coupling finite element model is established by using MSC. Marc software. The influence of single parameter change of catenary on contact pressure is analyzed. Then, the response surface method is introduced to study the influence of the combined change of two parameters on contact pressure. Finally, based on the influence of multiple parameters, the catenary structure parameters with a running speed of 500 km/h are optimized, and the following conclusions are obtained:
(1) When the catenary parameters change singly, within a certain range, increasing the contact wire tension, reducing the catenary wire tension, reducing the contact wire linear density, and reducing the catenary wire linear density can improve the pantograph-catenary current collection quality.
(2) Based on the response surface analysis method, when two parameters are combined with each other, the contact wire tension, catenary wire tension and contact wire linear density have basically the same influence on the average value and standard deviation of contact pressure. When the catenary wire linear density is combined with the wire tension respectively, the change of wire tension has a greater influence on contact pressure, and the influence of catenary wire linear density is smaller.
(3) In order to optimize the catenary at 500 km/h, under the conditions of increasing the contact wire tension, reducing the catenary wire tension and reducing the contact wire linear density, the average value of contact pressure is increased, the standard deviation, maximum value and offline rate of contact pressure are reduced, and the pantograph-catenary current collection quality is significantly improved.
The original contributions presented in the study are included in the article/supplementary material, further inquiries can be directed to the corresponding author.
ZZ: Conceptualization, Data curation, Formal Analysis, Funding acquisition, Investigation, Methodology, Project administration, Resources, Software, Supervision, Validation, Visualization, Writing–original draft, Writing–review and editing. MZ: Investigation, Project administration, Resources, Visualization, Writing–original draft, Writing–review and editing.
The author(s) declare that financial support was received for the research, authorship, and/or publication of this article. ZZ would like to acknowledge financial support from the Special Scientific Research Program of the Education Department of Shaanxi Province (Project No. 24JK0615).
Author MZ was employed by China Construction Third Engineering Bureau Co., Ltd.
The author(s) declare that no Generative AI was used in the creation of this manuscript.
All claims expressed in this article are solely those of the authors and do not necessarily represent those of their affiliated organizations, or those of the publisher, the editors and the reviewers. Any product that may be evaluated in this article, or claim that may be made by its manufacturer, is not guaranteed or endorsed by the publisher.
Aboshi, M., and Manabe, K. (2000). Analyses of contact force fluctuation between catenary and pantograph. Q. Rep. RTRI 41 (4), 182–187. doi:10.2219/rtriqr.41.182
T. Bartz-Beielstein, M. Chiarandini, L. Paquete, and M. Preuss (2010). Experimental methods for the analysis of optimization algorithms (Berlin: Springer).
Bruni, S., Bucca, G., Carnevale, M., Collina, A., and Facchinetti, A. (2018). Pantograph–catenary interaction: recent achievements and future research challenges. Int. J. Rail Transp. 6 (2), 57–82. doi:10.1080/23248378.2017.1400156
Cho, Y. H., Lee, K., Park, Y., Kang, B., and Kim, K.-nam (2010). Influence of contact wire pre-sag on the dynamics of pantograph–railway catenary. Int. J. Mech. Sci. 52 (11), 1471–1490. doi:10.1016/j.ijmecsci.2010.04.002
EN50318 (2002). “Railway applications-Current collection system-Validation of simulation of the dynamic interaction between pantograph and overhead contact line.”
Jin, H. L., Park, T. W., Oh, H. K., and Kim, Y. G. (2015). Analysis of dynamic interaction between catenary and pantograph with experimental verification and performance evaluation in new high-speed line. Veh. Syst. Dyn. 53 (8), 1117–1134. doi:10.1080/00423114.2015.1025797
Li, T., Qin, D., Zhou, N., Zhang, J., and Zhang, W. (2022). Numerical study on the aerodynamic and acoustic scale effects for high-speed train body and pantograph. Appl. Acoust. 196, 108886. doi:10.1016/j.apacoust.2022.108886
Liu, Y., Song, Y., Duan, F., and Liu, Z. (2024). Suppression of railway catenary galloping based on structural parameters’ optimization. Sensors 24 (3), 976. doi:10.3390/s24030976
Liu, Z., Wang, H., Chen, H., Wang, X., Song, Y., and Han, Z. (2023b). Active pantograph in high-speed railway: review, challenges, and applications. Control Eng. Pract. 141, 105692. doi:10.1016/j.conengprac.2023.105692
Liu, Z., Yang, S., Gao, S., and Wang, H. (2023a). Review of perspectives on pantograph-catenary interaction research for high-speed railways operating at 400 km/h and above. IEEE Trans. Transp. Electrification 10 (3), 7236–7257. doi:10.1109/TTE.2023.3346379
Lundstedt, T., Seifert, E., Abramo, L., Thelin, B., Nyström, Å., Pettersen, J., et al. (1998). Experimental design and optimization. Chemom. intelligent laboratory Syst. 42 (1-2), 3–40. doi:10.1016/s0169-7439(98)00065-3
Luo, Q., Mei, G., Chen, G., and Zhang, W. (2024). Study of pantograph-catenary system dynamic in crosswind environments. Veh. Syst. Dyn. 62 (4), 813–836. doi:10.1080/00423114.2023.2199456
Massat, J. P., Laine, J. P., and Bobillot, A. (2006). Pantograph–catenary dynamics simulation. Veh. Syst. Dyn. 44 (Suppl. 1), 551–559. doi:10.1080/00423110600875443
Park, T.-J., Han, C.-S., and Jang, J.-H. (2003). Dynamic sensitivity analysis for the pantograph of a high-speed rail vehicle. J. Sound Vib. 266 (2), 235–260. doi:10.1016/s0022-460x(02)01280-4
Pombo, J., and Ambrósio, J. (2012). Influence of pantograph suspension characteristics on the contact quality with the catenary for high speed trains. Comput. and Struct. 110, 32–42. doi:10.1016/j.compstruc.2012.06.005
Pombo, J., Ambrósio, J., Pereira, M., Rauter, F., Collina, A., and Facchinetti, A. (2009). Influence of the aerodynamic forces on the pantograph–catenary system for high-speed trains. Veh. Syst. Dyn. 47 (11), 1327–1347. doi:10.1080/00423110802613402
Song, Y., Lu, X., Yin, Y., Liu, Y., and Liu, Z. (2024). Optimization of railway pantograph-catenary systems for over 350 km/h based on an experimentally validated model. IEEE Trans. Industrial Inf. 20, 7654–7664. doi:10.1109/tii.2024.3361485
Su, K., Zhang, J., Zhang, J., Yan, T., and Mei, G. (2023). Optimisation of current collection quality of high-speed pantograph-catenary system using the combination of artificial neural network and genetic algorithm. Veh. Syst. Dyn. 61 (1), 260–285. doi:10.1080/00423114.2022.2045029
Wang, X., Liu, Z., Song, Y., Hu, G., Zhou, S., Duan, F., et al. (2024). Structural performance analysis and optimization design of railway pantograph under high-speed operating conditions. IEEE Trans. Instrum. Meas. 73, 1–14. doi:10.1109/tim.2024.3470994
Wu, G., Dong, K., Xu, Z., Xiao, S., Wei, W., Chen, H., et al. (2022). Pantograph–catenary electrical contact system of high-speed railways: recent progress, challenges, and outlooks. Railw. Eng. Sci. 30 (4), 437–467. doi:10.1007/s40534-022-00281-2
Zhang, W., Liu, Yi, and Mei, G. (2006). Evaluation of the coupled dynamical response of a pantograph—catenary system: contact force and stresses. Veh. Syst. Dyn. 44 (8), 645–658. doi:10.1080/00423110600744656
Zhou, N., and Zhang, W. (2011). Investigation on dynamic performance and parameter optimization design of pantograph and catenary system. Finite Elem. analysis Des. 47 (3), 288–295. doi:10.1016/j.finel.2010.10.008
Keywords: catenary, current collection quality, design parameters, response surface methodology, optimization
Citation: Zhang Z and Zhang M (2025) Multi-parameter optimizations of elastic chain catenary based on response surface methodology for high-speed railway. Front. Mech. Eng. 11:1547120. doi: 10.3389/fmech.2025.1547120
Received: 17 December 2024; Accepted: 07 February 2025;
Published: 27 February 2025.
Edited by:
Govind Vashishtha, Wrocław University of Science and Technology, PolandReviewed by:
Khandaker Noman, Northwestern Polytechnical University, ChinaCopyright © 2025 Zhang and Zhang. This is an open-access article distributed under the terms of the Creative Commons Attribution License (CC BY). The use, distribution or reproduction in other forums is permitted, provided the original author(s) and the copyright owner(s) are credited and that the original publication in this journal is cited, in accordance with accepted academic practice. No use, distribution or reproduction is permitted which does not comply with these terms.
*Correspondence: Zongfang Zhang, MTQ1NTQ3OTU4N0BxcS5jb20=
Disclaimer: All claims expressed in this article are solely those of the authors and do not necessarily represent those of their affiliated organizations, or those of the publisher, the editors and the reviewers. Any product that may be evaluated in this article or claim that may be made by its manufacturer is not guaranteed or endorsed by the publisher.
Research integrity at Frontiers
Learn more about the work of our research integrity team to safeguard the quality of each article we publish.