 Yawen Han
 Yuxing Bai1
 Liguo Zang
- 1School of Traffic Engineering, Nanjing Institute of Technology, Nanjing, China
- 2National Key Laboratory of Automotive Chassis Integration and Bionics, Changchun, China
- 3Jiangsu Haopeng Machinery Co., Ltd., Taizhou, China
In Formula Student Electric (FSE) racing competitions, battery overheating is a common challenge due to inadequate thermal dissipation at high discharge rates, negatively impacting the performance of the racing vehicle. This study introduces an innovative and optimized battery box cooling system designed to mitigate overheating by reducing the maximum battery temperature and the temperature gradient.The cooling system is developed using a combined approach of simulation analysis and orthogonal experiments. The design optimization focuses on improving airflow distribution by increasing the number of inlet and outlet vents and adjusting the airflow velocity, which enhances the heat dissipation capacity. Experimental tests show that, under a 5C discharge rate for 60 s, the maximum temperature within the optimized cooling system is reduced to 27.4°C. The temperature difference decreases from 3.5°C to 2.4°C, resulting in a 31.4% improvement in optimization efficiency. Additionally, the optimized system achieves a more uniform temperature distribution across the battery pack, outperforming the pre-optimization design in all evaluated metrics. The optimized cooling system demonstrates a significant improvement in thermal performance compared to the original design. The findings highlight the effectiveness of the proposed optimization in enhancing the thermal management of the battery box and offer a practical, applicable strategy for improving thermal efficiency in electric vehicle applications.
1 Introduction
The battery thermal management system (BTMS) for battery boxes is critical to the safe and efficient operation of Formula Student Electric Racing Car. In recent years, extensive research on battery thermal management systems has been conducted by numerous scholars both domestically and internationally. As the core energy storage unit of Electric Racing Car, the efficiency of battery storage and recovery directly influences system performance. Michaelides et al. (2023) demonstrated that the round-trip efficiency of batteries helps reduce energy losses and enhance energy utilization. Although Formula Student Electric Racing Cars operate under more demanding battery loads and environmental conditions, insights from this study can be leveraged to optimize battery energy management, thereby improving overall energy efficiency. Park (2013) found that optimizing cooling air flow rates and channel layouts significantly enhances heat dissipation efficiency and reduces temperature fluctuations in high-power battery cooling systems. Fan et al. (2013) reported that increased battery gaps promote more uniform temperature distributions in natural air cooling systems. Sun et al. (2012) demonstrated that tapered inlet and outlet manifolds improve temperature uniformity in U-shaped and Z-shaped systems. Suo et al. (2024) showed that a convex plenum at the inlet and outlet of forced air-cooled systems enhances cooling performance, achieving reductions in maximum temperature and temperature difference of 35.06% and 76.98%, respectively. Bai et al. (2024) revealed that increasing anisotropic thermal conductivity (kx) improves heat dissipation efficiency by 24%, while ky and kz have limited effects. Pu et al. (2024) presented advanced 3D cooling plate designs that enhance cooling performance with reduced mass flow and pressure drop, leading to lower power consumption in lithium-ion battery systems. Moosavi et al. (2023) found that optimal cell spacing in large-scale lithium battery packages improves temperature uniformity and thermal gradients. Wang C. et al. (2023) achieved a 65.5% reduction in maximum temperature difference with a reciprocating air-cooling strategy and proposed an energy-saving intermittent cooling scheme. Luo et al. (2023) reported that their X-type air-cooled battery thermal management system reduces maximum temperature by 4.33°C and enhances performance through inlet and outlet optimization. Zhang et al. (2024) optimized air-cooling systems via simulation, showing that outlet position adjustments lower average and maximum temperatures. Chen et al. (2020) demonstrated that optimizing flow guide plate shape reduced maximum battery box temperature by over 3.7°C despite a 20% increase in pressure drop. Verma and Saraswati (2024) found that optimized spacing in aligned air-cooled Li-ion battery packs improved thermal performance. Wang et al. (2021) developed a novel BTMS with spoilers that reduced maximum temperature by 2.24°C and system volume by 4.87%. Khan et al. (2023) investigated the axial air cooling performance of lithium-ion battery packs using COMSOL Multiphysics simulations, concluding that optimizing the control volume outlet dimensions and introducing convergence significantly improved temperature homogeneity and cooling efficiency, particularly by enhancing airflow turbulence in the system. Narkhede et al. (2024) designed a cooling system combining fins and phase change materials (PCM), demonstrating through experiments and simulations superior performance compared to traditional natural air convection cooling. At a 5C discharge rate, the PCM system reduced battery temperature by 31 K, while the fin-PCM system achieved a reduction of 33 K, significantly enhancing thermal efficiency. Sur et al. (2023) proposed a polymer-based heat sink for lithium-ion batteries in electric vehicles, which improved heat dissipation and reduced system weight. Li et al. (2020), using simulation and orthogonal experiments, investigated the temperature field dynamics of Formula Electric Vehicle (FEV) cooling systems under high-current discharge conditions, finding that the gap between cells and modules significantly affected thermal performance. Zhao et al. (2019) conducted an in-depth study of the FSE battery cooling system, validating the consistency between experimental and simulation results, with a maximum error of 2°C. Optimization of cooling fan placement and cell layout reduced the maximum temperature difference by 38.35%. Yu et al. (2024) proposed an electro-thermal model with an adaptive estimation algorithm for jointly estimating the state of charge (SOC) and state of temperature (SOT) of the battery. The study demonstrated effective control of SOC and SOT estimation errors across a wide temperature range, offering valuable insights for battery thermal management.
Existing research on air cooling systems primarily focuses on the operating conditions of conventional passenger vehicles, where battery performance is stable, temperature variations are gradual, and system loads are low. In contrast, Formula Student Electric racing car experience extreme conditions, such as high loads, large current outputs, and rapid movements, resulting in rapid temperature rises and significant thermal gradients, with cooling demands much higher than those of typical vehicles. Despite advances in optimizing air cooling structures, challenges remain, particularly in maintaining temperature stability under high load and current conditions. To address the aforementioned issue, this paper proposes a cooling solution more aligned with the specific requirements of Formula Student Electric (FSE) racing cars. By combining simulation analysis with orthogonal experiments, and using maximum temperature and temperature difference as the optimization criteria, the structural layout of the air-cooling system, battery gaps, airflow path design, and airflow direction were meticulously adjusted. This approach significantly enhanced the heat dissipation performance of the battery pack and effectively optimized thermal management under extreme operating conditions.
2 Theoretical model
2.1 Convective heat transfer model
The convective heat transfer model integrates the effects of thermal convection and conduction to describe heat transfer in fluids. The fundamental equation is represented in its convective form of the heat conduction equation (Wang Z. H. et al., 2023), expressed as Equation 1:
In the equation,
2.2 Turbulence model
After a comparison of various turbulence models, the standard k-epsilon model is selected for simulating airflow in the battery box to more accurately reflect flow field characteristics and to ensure higher precision and reliability. The governing equations are presented as Equation 2 (Hu et al., 2012; Kim et al., 2019):
Where
2.3 Heat dissipation of the battery box
The battery box is treated as a closed, opaque system, with the effects of thermal radiation at high temperatures on heat dissipation being neglected. The primary heat exchange is considered to occur between the battery surface and the surrounding air. The formula for calculating heat transfer (Fatukasi and Bello-Ochende, 2022) is as Equation 3:
Where
3 Physical model
3.1 Geometric model
The FSE competition imposes strict limitations on battery pack power and voltage, requiring the battery to operate stably at a maximum power of 80 kW and a voltage of 600V, while also supporting the completion of a 22 km endurance race. Therefore, the energy density and endurance of the battery pack are critical. Considering factors such as driving range and acceleration performance, a lithium iron phosphate (LiFePO₄) battery was selected. The detailed specifications of the LiFePO₄ battery cells used in this study are provided in Table 1.
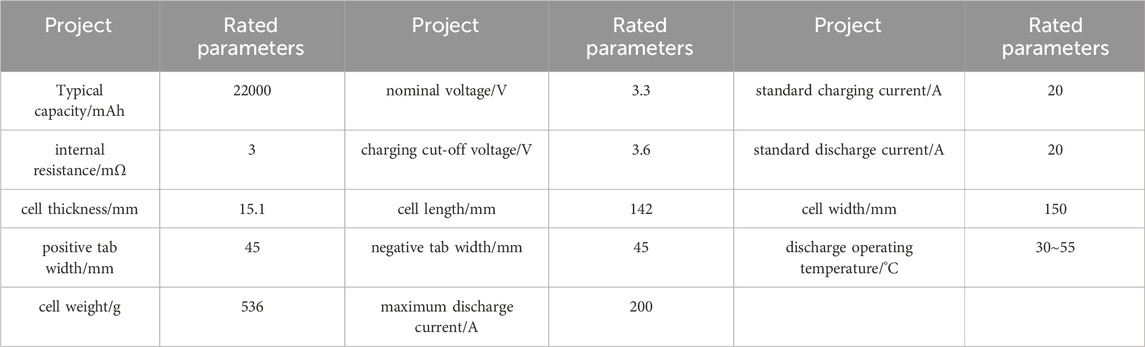
Table 1. Physical parameters of the lithium iron phosphate (LiFePO₄) battery cell.
The battery box design consists of 42 individual cells arranged into 6 modules in a 3-row by 2-column configuration. Each module is formed by connecting 7 cells in series. The dimensions of each cell are 26.8 × 148 × 98 mm³. The battery box is constructed with an aluminum structure, with a side thickness of 1 mm and a top and bottom thickness of 1 mm. The overall dimensions of the battery box are 419 × 396 × 188.5 mm³. The 3D model is shown in Figure 1.
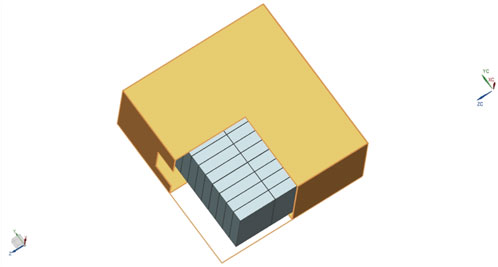
Figure 1. 3D model of the battery box.
Given the diversity and complexity of the internal materials in battery cells, an equivalent approach is employed in this study. By applying empirical formulas for thermal properties, the thermal characteristics of the various materials within the cell are integrated, treating the cell as a whole for equivalent analysis. The thermal physical parameters of the battery are as follows: equivalent density ρ = 1677.62 kg⋅m-3; equivalent specific heat capacity c = 1632.63 J⋅kg-1⋅K-1; equivalent thermal conductivity: x-direction = 1.297 W⋅m-1⋅K-1, y-direction = 2.950 W⋅m⁻1⋅K⁻1, z-direction = 0.216 W⋅m⁻1⋅K⁻1.
3.2 Mesh generation
The three-dimensional model is simplified as needed, dividing it into the solid battery region and the air region of the box. One inlet and two outlets are established. Meshing is performed for the individual batteries, the battery box shell, and the airflow region. Considering mesh quality and node density, a tetrahedral unstructured mesh is utilized with a cell size of 3 mm, resulting in 5,493,208 elements and 953,773 nodes. The average orthogonal quality is 0.73314, with a standard deviation of 0.15412, indicating a well-distributed mesh quality. Figure 2 illustrates the mesh generation of the battery box.
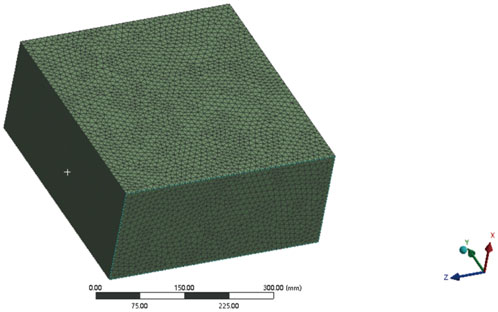
Figure 2. Mesh division of the battery box.
3.3 Boundary conditions
Based on the thermal physical specifications of the studied battery, the following parameters are set in Fluent: the turbulence model selected is the K-Epsilon (2 eqn) model with standard wall functions (SWF). The cell region is defined as solid, and a source term is added to the cells. Convection heat transfer is applied, with the inlet temperature set to 25°C and the convection heat transfer coefficient uniformly set at 5 W/m2·K⁻1.
4 Simulation analysis
Due to the extreme conditions of high-current, short-duration, and peak discharges in the FSE competition, the temperature rise within the electric racing car’s power battery is more pronounced, placing higher demands on the reliability of the battery thermal management system. To ensure the battery pack remains stable during high power output, rapid charge and discharge, and prolonged operation, thermal management objectives for the entire vehicle are defined, as shown in Table 2, based on the required operating temperature of the battery.
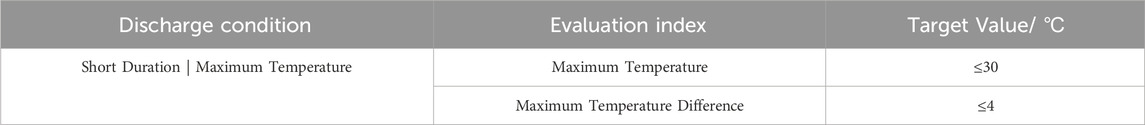
Table 2. Definition of thermal management objectives.
The thermal dissipation simulation results for the battery box under high current conditions provide representative insights. Simulations were performed for four discharge scenarios, with discharge rates of 5C and 8C, and discharge durations of 45 and 60 s, respectively. The temperature variations of the battery under each condition are presented in Table 3.
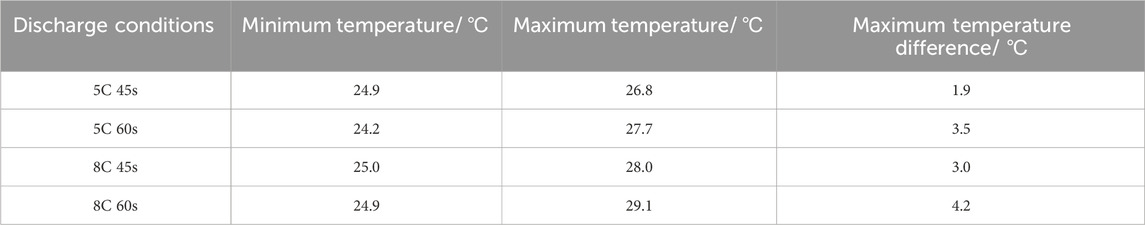
Table 3. Thermal simulation results under four discharge conditions.
The results indicate that the temperature rise and temperature difference within the battery box are more significant under the 5C for 60 s and 8C for 60 s discharge conditions. To better understand the changes in thermal performance and to optimize the thermal design of the battery box, a detailed comparative analysis of the temperature fields under these two conditions is conducted.
Figure 3 presents the simulation results under the “5C for 60 s” discharge condition. It is observed that after discharging the battery box at a rate of 5C for 60 s, the maximum temperature of the entire battery box reaches 27.7°C, with a maximum temperature differential of 3.5°C. An analysis of the airflow patterns and temperature distribution within the battery box indicates that the airflow generated by the fan contributes to a certain degree of cooling, resulting in varying degrees of temperature reduction throughout the battery box. Notably, the temperatures at the air intake and the corresponding longitudinal position directly opposite the intake are significantly lower than those at the left and right rear positions of the battery box, where heat accumulation is clearly observed.
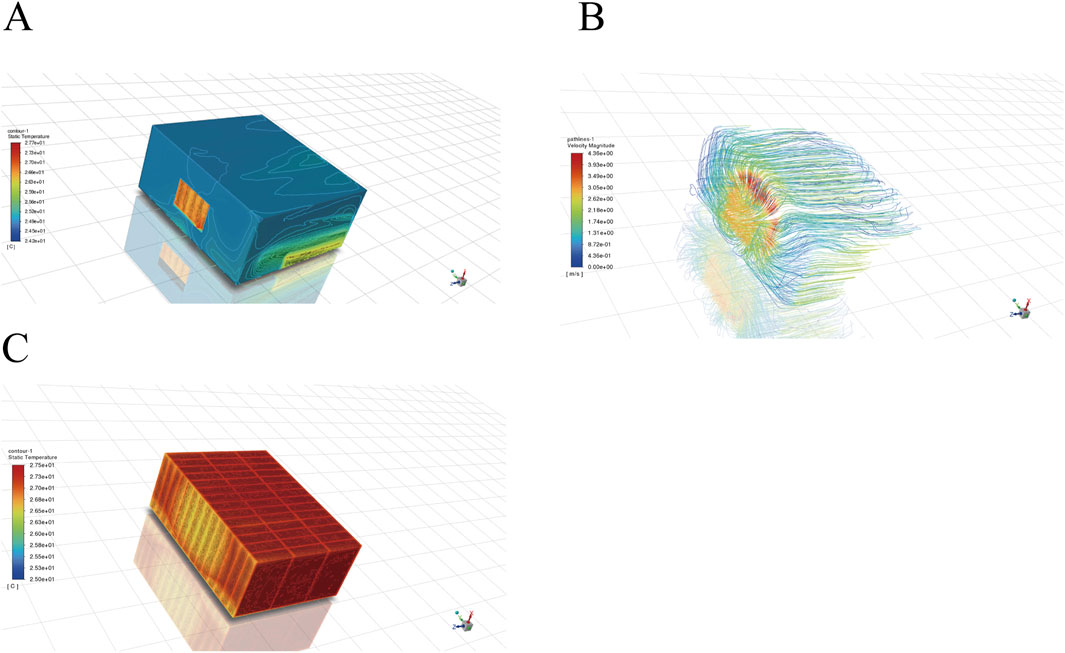
Figure 3. Simulation results of the battery box under 5C, 60s condition. (A) Temperature distribution map of the battery box. (B) Airflow trajectory map of the battery. (C) Temperature distribution map of the battery.
Figure 4 shows the simulation results for the “8C 60s” discharge condition. After 60 s of discharging at an 8C rate, the maximum temperature of the battery box reached 29.1°C. While the lowest temperature still occurs near the air inlet, the maximum temperature difference within the system increased to 4.2°C, exceeding the established thermal management target. These results indicate that the initial thermal model does not meet the required standards for this operating condition.
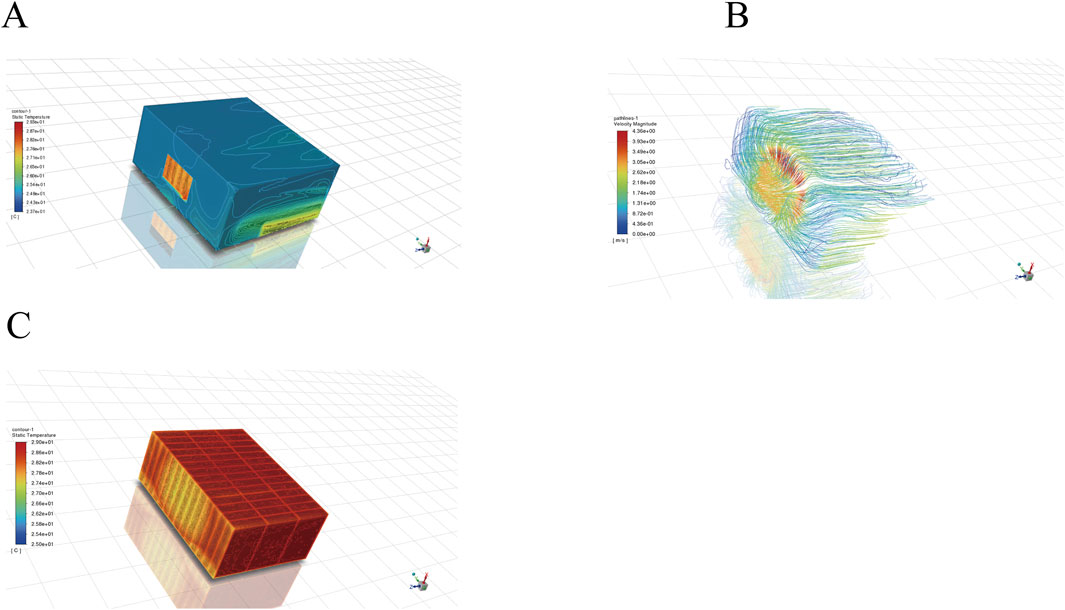
Figure 4. Simulation results of the battery box under 8C, 60s condition. (A) Temperature distribution map of the battery box. (B) Airflow trajectory map of the battery. (C) Temperature distribution map of the battery.
The lower temperature near the air inlet suggests that the fan-driven airflow enhances the efficiency of convective heat transfer to some extent. However, the relatively high temperature at the air outlet indicates that the current air cooling system is inadequate for meeting the cooling requirements. The effectiveness of the air cooling system is significantly affected by factors such as the number of air inlets and outlets, inlet air velocity, spacing between individual battery cells, and the convective heat transfer coefficient.
5 Battery box optimization design
5.1 Orthogonal test protocol design
Since there are many factors that affect the heat dissipation effect, in order to effectively control the variables, to ensure the reliability of the test results. As an effective experimental design method, orthogonal experimental design (Wang et al., 2022) can obtain comprehensive results with the least number of tests by reasonably arranging the test combination, so the orthogonal test method is used to optimize the heat dissipation system of the battery box.
The primary function of the cooling system lies in the heat exchange process between the airflow and the battery surface. Therefore, optimizing airflow velocity and channel design represents the most direct approach to enhancing heat dissipation efficiency. Based on existing simulation results and practical considerations, air velocity (A), number of air inlets (B), number of air outlets (C), and spacing between battery groups (D) were selected as the main influencing factors. Each factor was assigned three levels, and the L9 (34) standard orthogonal table was used to design the specific test plan for this experiment. Table 4 presents the factor level settings, while Table 5 details the nine experimental schemes.
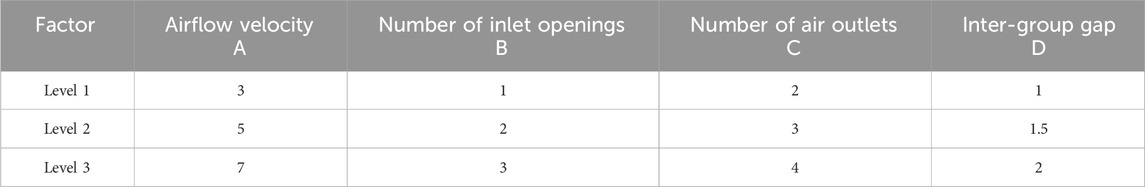
Table 4. Factor level settings for orthogonal experiment.
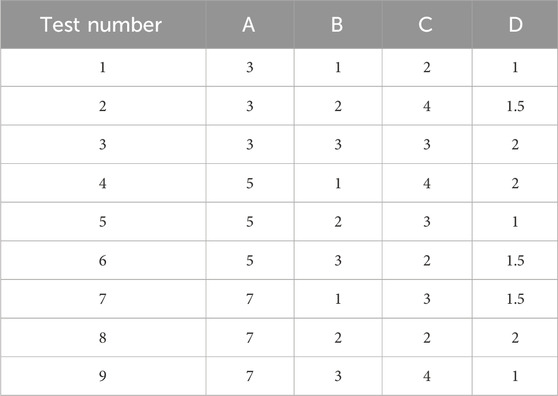
Table 5. Experimental design for orthogonal experiment.
5.2 Orthogonal experiment and result analysis
Under the 5C for 60 s discharge condition, the highest temperature, lowest temperature, and maximum temperature difference within the battery box are utilized as evaluation metrics. A thermal model of the battery box is established in Fluent to simulate the nine experimental schemes, allowing for a visual assessment of cooling effectiveness.
Figure 5 presents the results for the “highest temperature” metric. Orthogonal range analysis is employed to conduct a visual analysis of the simulation results for the highest temperature, as summarized in Table 6.
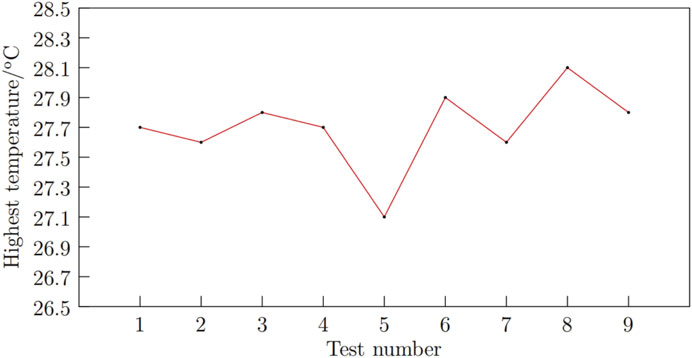
Figure 5. Simulation results of maximum temperature.
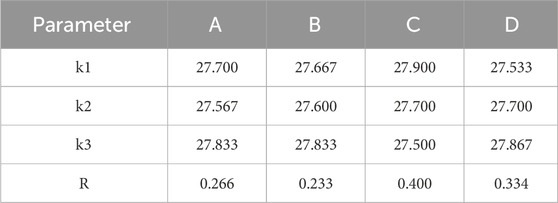
Table 6. Simulation results of maximum temperature intuitive analysis.
In the orthogonal experiment, the comprehensive average value k is utilized to represent the average of the evaluation standards, indicating the effects produced by different levels of the same factor. The range R serves as a comparative basis for assessing the degree of influence among factors; a larger R indicates a greater impact on the final evaluation metric. The effect curve graph provides a visual representation of the results from the orthogonal experiment. By analyzing the trends presented in Table 4, the study examines how variations at three levels of the four factors affect the cooling system, identifying the extreme values at each factor level and generating the effect curve graph shown in Figure 6. According to the simulation and range results, the order of influence on the cooling system for the “highest temperature” metric is determined to be: C > D > A > B.
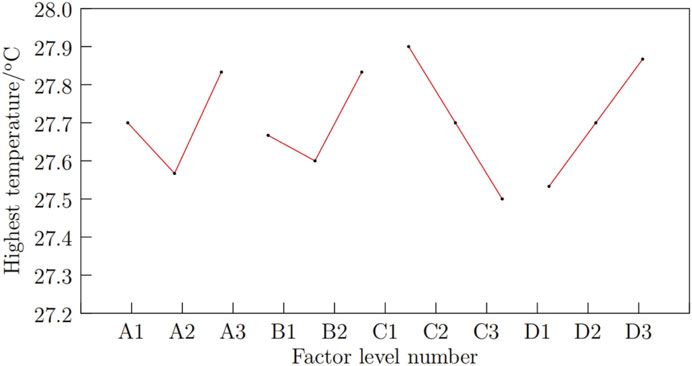
Figure 6. Effect curve of maximum temperature.
In Figure 6, it is evident that factor B (number of inlet openings) shows a larger fluctuation, followed by factor C (number of outlet openings). For heat dissipation, a lower maximum temperature is preferable, indicating that the optimal Scheme 1 should be: A2B2C3D1.
The results for the “lowest temperature” metric are shown in Figure 7, with the visual analysis summarized in Table 7.
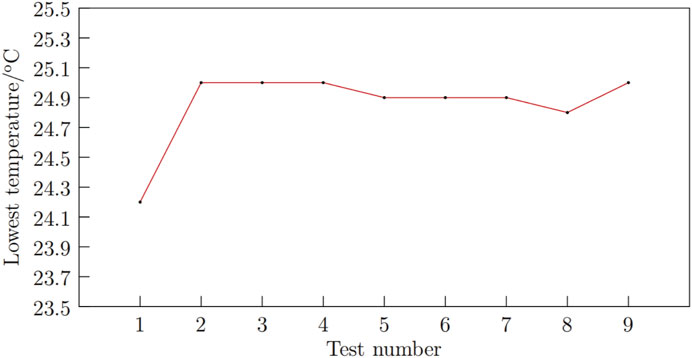
Figure 7. Simulation results of minimum temperature.
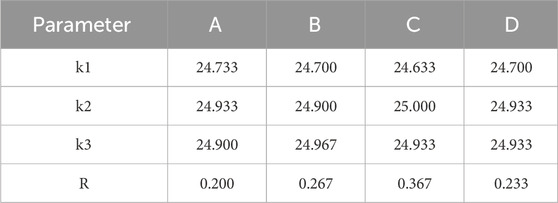
Table 7. Visual analysis of minimum temperature simulation results.
By analyzing the trends presented in Table 7, the study examines how variations at three levels of the four factors affect the cooling system, identifying the extreme values at each factor level and generating the effect curve graph shown in Figure 8. According to the simulation and range results, the order of influence on the cooling system for the “lowest temperature” metric is determined to be: C>B>D>A.
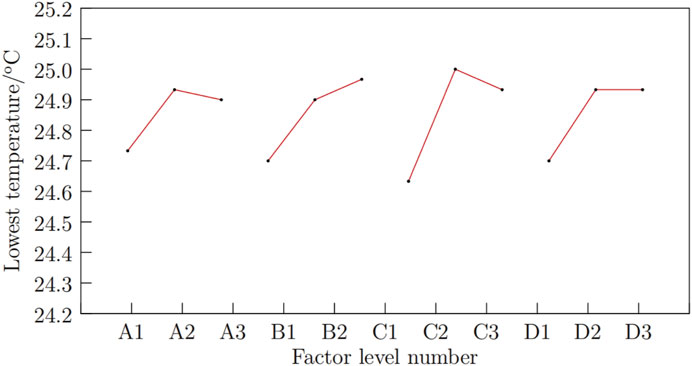
Figure 8. Minimum temperature effect curve.
For effective heat dissipation, the lower the minimum temperature within a reasonable range, the better the heat dissipation performance. Through comprehensive analysis, the optimal scheme 2 should be A1B1C1D1. The results for the “temperature difference” metric are presented in Figure 9, with the visual analysis summarized in Table 6.
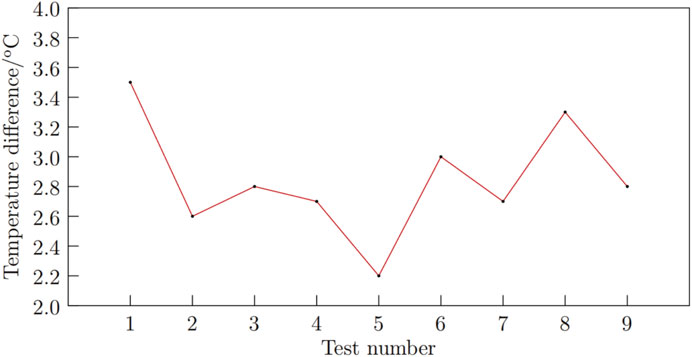
Figure 9. Maximum temperature difference simulation results.
Based on the trend analysis from Table 8, the study examines how variations at three levels of the four factors affect the cooling system, identifying the extreme values at each factor level and creating the effect curve graph shown in Figure 10. According to the simulation and range results, the order of influence on the cooling system for the “maximum temperature difference” metric is: C > A > B > D.
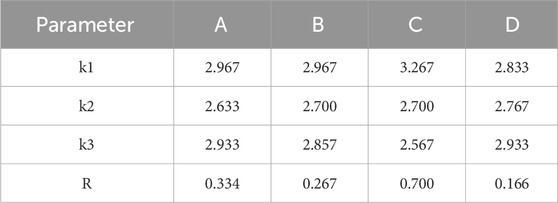
Table 8. Visual analysis of maximum temperature difference simulation results.
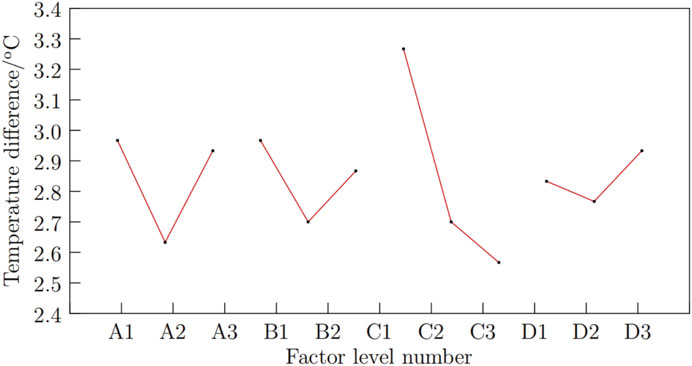
Figure 10. Maximum temperature difference effect curve.
For heat dissipation, a smaller maximum temperature difference indicates a more uniform temperature distribution and better cooling performance. A comprehensive analysis suggests that the optimal Scheme 3 is: A2B2C3D2.
5.3 Optimal Scheme determination
To select the optimal cooling scheme among the three options, a comparative analysis of the cooling indicators—highest temperature, lowest temperature, and maximum temperature difference—of the three schemes is necessary, as shown in Table 9.
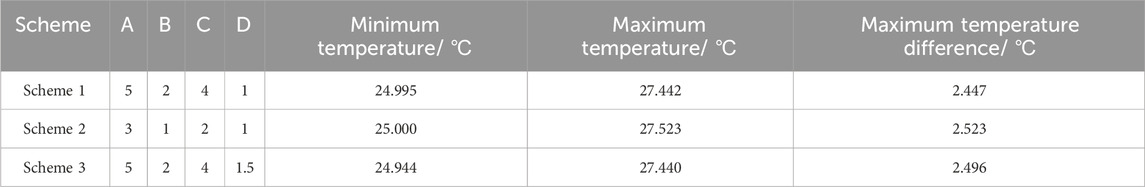
Table 9. Results of the three optimization schemes.
Based on the results of the thermal simulation data, it is observed that, in terms of maximum temperature metrics, Scheme 2 exhibits the highest temperature, while the differences between Scheme 1 and Scheme 3 are not significant. Consequently, Scheme 2 is eliminated. Regarding minimum temperature performance, Scheme 3 slightly outperforms Scheme 1; however, Scheme 1 demonstrates superior performance in terms of maximum temperature difference compared to Scheme 3. The temperature distribution for Schemes 1 and 3 is illustrated in Figure 11, which presents the thermal contour map of the battery box.
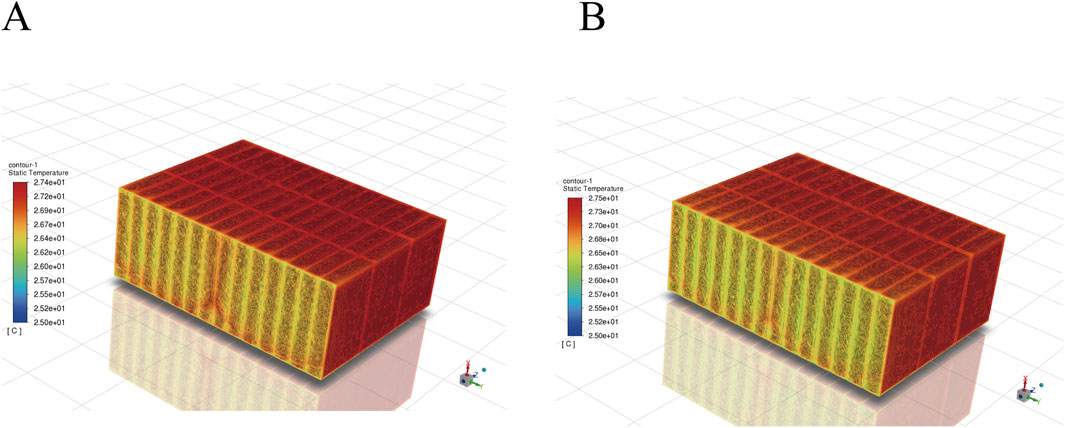
Figure 11. Temperature cloud map of the battery box. (A) Scheme 1. (B) Scheme 3.
Figure 11 indicates that the temperature distributions for the battery box under Scheme 1 and Scheme 3 are generally consistent. However, Scheme 3 exhibits a significant heat accumulation near the outlet, and its maximum temperature difference is relatively large. This suggests that during extended operation, the maximum temperature difference may exceed the ideal range. Therefore, considering the heat dissipation evaluation metrics, temperature uniformity, and heat accumulation, Scheme 1 is determined to be the optimal thermal management solution.
6 Optimization effect analysis
6.1 Simulation of different working conditions post-optimization
To verify the thermal performance and effectiveness of the optimized cooling system, a model based on the enhanced thermal management scheme is developed. Simulations are conducted to assess the temperature variations within the battery box under various operating conditions, facilitating an evaluation of the performance of the optimized solution. The results are presented in Table 10.
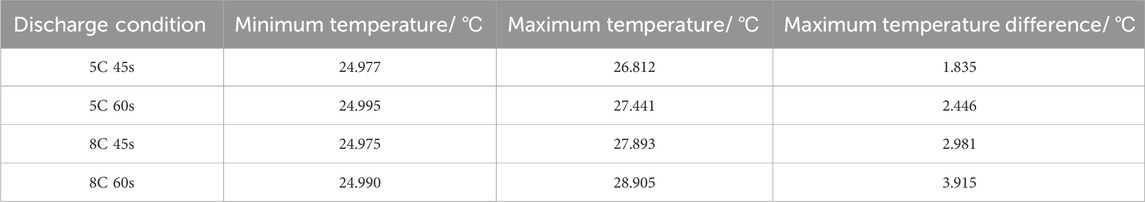
Table 10. Thermal simulation results of the optimization model under four discharge conditions.
The results indicate that under an 8C discharge condition for 60 s, the optimized cooling system achieves a maximum temperature of 28.905°C, a minimum temperature of 24.990°C, and a maximum temperature difference of 3.915°C, all demonstrating significant improvement compared to the pre-optimized scheme. Furthermore, the temperature rise and difference within the battery box remain within the ideal range, thereby meeting the established design objectives.
6.2 Temperature variation in the battery box
In the optimized scheme, enhancements in air circulation within the battery box are achieved through an increased gap between the battery box and the addition of multiple intake and outlet vents, resulting in a significant reduction in the maximum temperature of the battery box. A comparative analysis of the battery temperature field cloud maps, generated before and after optimization under 5C discharge conditions for both 60 s and 5 min, is presented in Figure 12.
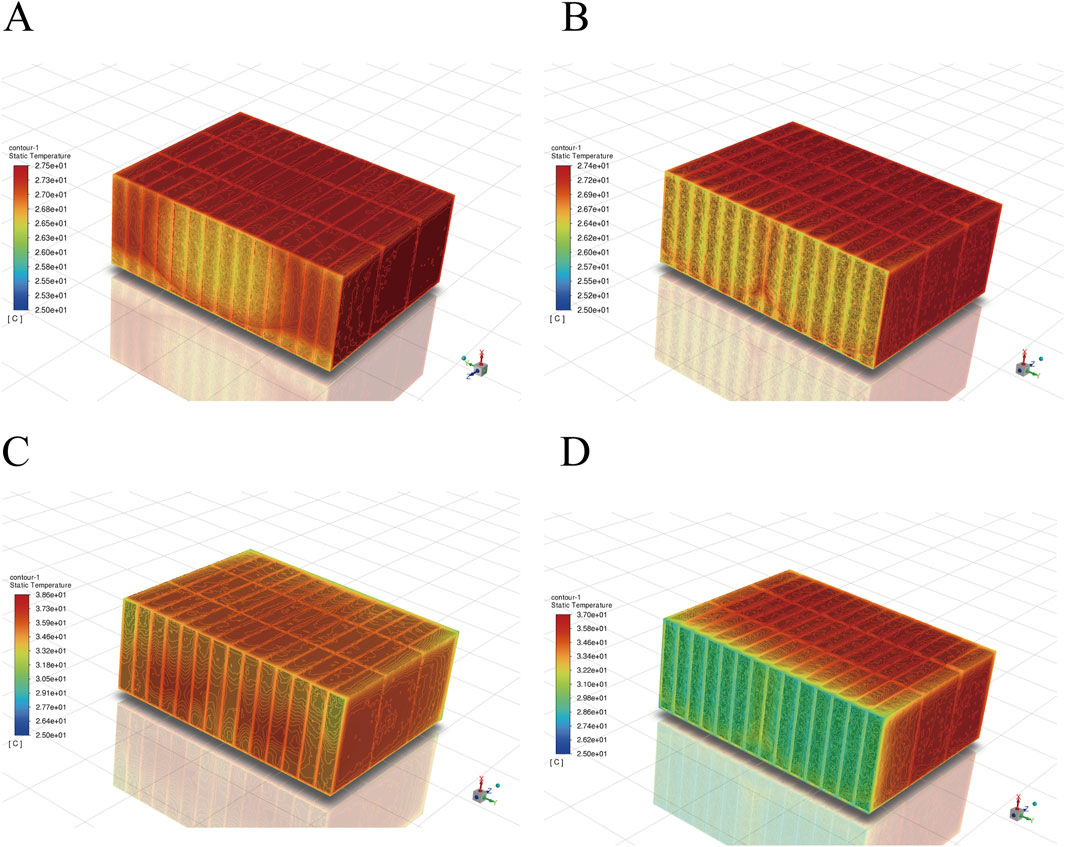
Figure 12. Comparison of battery temperature field cloud maps before and after optimization. (A) Before optimization at 5C, 60s. (B) After optimization at 5C, 60s. (C) Before optimization at 5C, 5min. (D) After optimization at 5C, 5min.
From the figure, it is observed that under both discharge conditions, the maximum temperature of the battery box has decreased to varying degrees, indicating effective optimization. In the 5C discharge case for 60 s, the maximum temperature prior to optimization was recorded at 27.5°C, with a maximum temperature difference of 3.5°C. The increase in the number of intake and outlet vents resulted in enhanced air velocity, thereby amplifying the cooling effect facilitated by air circulation. Consequently, the temperature distribution at the intake has become more uniform compared to the pre-optimization state, and heat accumulation at the outlet has been alleviated to some extent.
In the 5C discharge case for 5 min, while the changes in maximum temperature and temperature difference were not substantial, the optimized battery box exhibited superior temperature uniformity. Although the overall temperature of the battery box remained slightly elevated, it was still within the normal operating range, with individual cell temperatures at the intake and surrounding areas approximately at 30°C, allowing most cells to operate safely. Overall, effective temperature control has been achieved.
6.3 Airflow distribution in the battery box
A comparative analysis of the airflow trajectory maps within the battery box, both prior to and following optimization under the 5C discharge conditions for 60 s and 5 min, is presented in Figure 13.
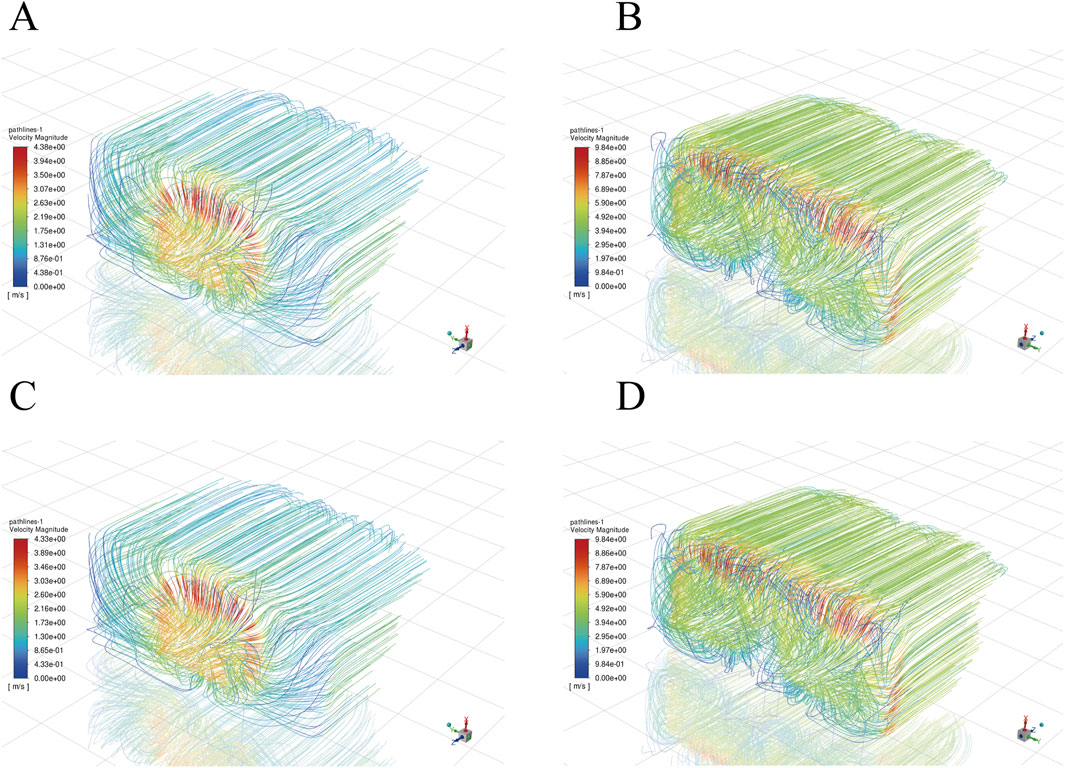
Figure 13. Comparison of battery air streamline diagrams before and after optimization. (A) Before optimization at 5C, 60s. (B) After optimization at 5C, 60s. (C) Before optimization at 5C, 5min. (D) After optimization at 5C, 5min.
Prior to optimization, the battery box features a single intake vent, resulting in an airspeed of only 3 m/s. Cold air primarily circulates above the individual batteries, hindering effective airflow through the sides and gaps between the cells. Consequently, as air traverses the cells, its velocity decreases significantly, with portions of the airflow failing to reach the outlet. This inefficiency leads to elevated battery temperatures and uneven heat dissipation, accompanied by noticeable heat accumulation at the outlet.
In contrast, the optimized cooling system incorporates multiple air inlets and outlets, which are uniformly distributed throughout the battery enclosure. This modification enhances airflow uniformity and increases air velocity to 5 m/s, thereby aligning the intake airflow more closely with the internal flow dynamics of the battery enclosure. Furthermore, the gaps between the battery modules are judiciously adjusted to facilitate air circulation through the sides of the battery enclosure and the interstitial spaces between the batteries, resulting in improved airflow dynamics and a more uniform temperature distribution across the battery pack.
7 Conclusion
This study constructs an air-cooling thermal management model for the battery box in the FSE electric vehicle, optimizing key parameters such as maximum temperature, minimum temperature, maximum temperature difference, and temperature distribution. Based on the results of orthogonal experiments, an optimized thermal model for the battery box has been developed, and thermal simulation analysis has been conducted to validate the effectiveness of the optimization results. The conclusions drawn from this research are as follows:
1. Orthogonal experimental results indicate that the number of air intakes has the most significant impact on the maximum temperature, with an increased number of intakes helping to reduce the peak temperature of the battery pack. In contrast, the number of air outlets plays a more critical role in controlling the minimum temperature and maximum temperature difference. These findings suggest that optimal configuration of the number of intakes and outlets can effectively regulate the internal temperature distribution of the battery pack, thereby enhancing heat dissipation efficiency.
2. In the optimized cooling system, an airflow velocity of 5 m/s, 2 inlet vents, 4 outlet vents, and a 1 mm gap between battery modules are employed. Under a 5C, 60-second operating condition, the optimized system reduces the maximum temperature of the battery box to 27.4°C, while the maximum temperature difference decreases from 3.5°C to 2.4°C, achieving an optimization efficiency of 31.4%. The improved cooling system effectively enhances the uniformity of the battery temperature field, reduces the risk of localized overheating, and significantly increases battery stability and safety.
3. This study not only improves the thermal performance of the battery box but also provides valuable insights for the thermal management design of electric car and other energy storage systems. The optimized design effectively controls the temperature distribution within the battery pack, preventing localized overheating and excessive temperature gradients, thereby reducing performance degradation due to temperature non-uniformity. This optimization is crucial for enhancing the overall safety of the battery system, prolonging battery lifespan, and improving the power performance of electric car.
Data availability statement
The raw data supporting the conclusions of this article will be made available by the authors, without undue reservation.
Author contributions
YH: Funding acquisition, Conceptualization, Supervision, Writing–original draft. YB: Methodology, Software, Validation, Writing–original draft. WZ: Data curation, Software, Writing–review and editing. SC: Data curation, Software, Writing–review and editing. LZ: Visualization, Writing–review and editing. HD: Formal Analysis, Investigation, Writing–review and editing.
Funding
The author(s) declare that financial support was received for the research, authorship, and/or publication of this article. This research presented in this paper was conducted with the support of the National Natural Science Foundation of Jiangsu Province, grant number BK20220685; Qing Lan Project, grant number Su teacher letter [2024] No. 14; the National Key Laboratory of Automotive Chassis Integration and Bionics, grant number 20210205; Key Research and Development Program of Jiangsu Province, grant number BE2022146; Research Foundation of Nanjing Institute of Technology, 202411276020Z.
Conflict of interest
Author HD is employed by Jiangsu Haopeng Machinery Co., Ltd.
The remaining authors declare that the research was conducted in the absence of any commercial or financial relationships that could be construed as a potential conflict of interest.
Generative AI statement
The author(s) declare that no Generative AI was used in the creation of this manuscript.
Publisher’s note
All claims expressed in this article are solely those of the authors and do not necessarily represent those of their affiliated organizations, or those of the publisher, the editors and the reviewers. Any product that may be evaluated in this article, or claim that may be made by its manufacturer, is not guaranteed or endorsed by the publisher.
References
Bai, X. H., Jin, H. L., Duan, C. G., Gao, Y., Nakayama, A., and Liu, C. (2024). Simulation study on heat dissipation of a prismatic power battery considers anisotropic thermal conductivity in air cooling system. Therm. Sci. Eng. Prog. 55, 102920. doi:10.1016/j.tsep.2024.102920
Chen, K., Hou, J. S., Chen, Y, and Wang, S. (2020). Shape optimization of plenums in parallel air-cooled battery thermal management system. CIESC J. 71 (S2), 55–61. doi:10.11949/0438-1157.20200484
Fan, L., Khodadadi, J., and Pesaran, A. (2013). A parametric study on thermal management of an air-cooled lithium-ion battery module for plug-in hybrid electric vehicles. J. Power Sources 238, 301–312. doi:10.1016/j.jpowsour.2013.03.050
Fatukasi, S. O., and Bello-Ochende, T. (2022). Numerical development of effective cooling system for battery pack of electric vehicles. Mater. Today Proc. 65 (3), 2192–2200. doi:10.1016/j.matpr.2022.06.070
Hu, X. S., Li, S. B., and Peng, H. (2012). A comparative study of equivalent circuit models for Li-ion batteries. J. Power Sources 198, 359–367. doi:10.1016/j.jpowsour.2011.10.013
Khan, M., Alkhedher, M., Ghazal, M., Abdelkareem, M. A., Ramadan, M., and Olabi, A. G. (2023). Effects of control volume outlet variation on axial air cooling of lithium-ion batteries. Int. J. Thermofluids 19, 100373. doi:10.1016/j.ijft.2023.100373
Kim, J., Oh, J., and Lee, H. (2019). Review on battery thermal management system for electric vehicles. Appl. Therm. Eng. 149, 192–212. doi:10.1016/j.applthermaleng.2018.12.020
Li, H., Xu, Y., Yang, Y., and Si, C. (2020). Simulation and optimization of FEV limit discharge’s heat dissipation based on orthogonal experiments. Materials 13 (23), 5563. doi:10.3390/ma13235563
Luo, L. S., Liu, Y. C., Liao, Z. M., and Zhong, J. (2023). Optimal structure design and heat transfer characteristic analysis of X-type air-cooled battery thermal management system. J. Energy Storage 67, 107681. doi:10.1016/j.est.2023.107681
Michaelides, E. E., Nguyen, V. N. D., and Michaelides, D. N. (2023). The effect of electric vehicle energy storage on the transition to renewable energy. Green Energy Intelligent Transp. 2, 100042. doi:10.1016/j.geits.2022.100042
Moosavi, A., Ljung, A. L., and Lundström, T. S. (2023). A study on the effect of cell spacing in large-scale air-cooled battery thermal management systems using a novel modeling approach. J. Energy Storage 72, 108418. doi:10.1016/j.est.2023.108418
Narkhede, S., Sur, A., Kothari, G., and Netke, A. (2024). “Design and thermal analysis of Fin-PCM-integrated thermal management system for lithium-ion cylindrical battery pack,” in Proceedings of the institution of mechanical engineers, Part E: journal of process mechanical engineering. doi:10.1177/09544089231221668
Park, H. (2013). A design of air flow configuration for cooling lithium ion battery in hybrid electric vehicles. J. Power Sources 239, 30–36. doi:10.1016/j.jpowsour.2013.03.102
Pu, J. H., Li, R. C., Li, Y., Zhang, H., Du, M., Hua, N., et al. (2024). The novel stereoscopic cooling plate designs and performance analysis for battery thermal management systems. Appl. Therm. Eng. 257, 124330. doi:10.1016/j.applthermaleng.2024.124330
Sun, H. G., Wang, X. H., Tossan, B., and Dixon, R. (2012). Three-dimensional thermal modeling of a lithium-ion battery pack. J. Power Sources 206, 349–356. doi:10.1016/j.jpowsour.2012.01.081
Suo, Y. H., Tang, C. B., Han, E. H., and Chen, Z. (2024). Comparative assessment and optimization among several plenum shapes and positions for the forced air-cooled battery thermal management system. J. Energy Storage 99, 113319. doi:10.1016/j.est.2024.113319
Sur, A., Narkhede, S., Netke, A., et al. (2023). “Design and analysis of polymer heat sink for Li-ion battery thermal management system,” in Recent trends in mechanical engineering, lecture notes in mechanical engineering. Editors A. Maurya, A. K. Srivastava, P. K. Jha, and S. M. Pandey (Singapore: Springer). doi:10.1007/978-981-19-7709-1_33
Verma, S. P., and Saraswati, S. (2024). Comprehensive analysis of airflow stream interaction, space utilization and optimization of an aligned configured air-cooled Li-ion battery pack. Int. J. Heat Mass Transf. 227, 125550. doi:10.1016/j.ijheatmasstransfer.2024.125550
Wang, C., Xu, J., Wang, M. W., and Xi, H. (2023a). Experimental investigation on reciprocating air-cooling strategy of battery thermal management system. J. Energy Storage 58, 106406. doi:10.1016/j.est.2022.106406
Wang, N. B., Li, C. B., Li, W., Huang, M., and Qi, D. (2021). Effect analysis on performance enhancement of a novel air cooling battery thermal management system with spoilers. Appl. Therm. Eng. 192, 116932. doi:10.1016/j.applthermaleng.2021.116932
Wang, S., Ma, X., Hu, Z., and Sun, S. (2022). Multi-parameter optimization of heat dissipation structure of double disk magnetic coupler based on orthogonal experimental design. Energies 15 (23), 8801. doi:10.3390/en15238801
Wang, Z. H., Xiong, X., and Gao, Q. J. (2023b). Performance study of a cylindrical lithium battery thermal management system based on a spider-web-like flow channel design. J. Mech. Eng. 59 (22), 22–59. doi:10.3901/JME.2023.22.150
Yu, C., Zhu, J., Liu, W., Dai, H., and Wei, X. (2024). Co-estimation of state-of-charge and state-of-temperature for large-format lithium-ion batteries based on a novel electrothermal model. Green Energy Intelligent Transp. 3 (4), 100152. doi:10.1016/j.geits.2024.100152
Zhang, S. B., Nie, F., Cheng, J. P., Yang, H., and Gao, Q. (2024). Optimizing the air flow pattern to improve the performance of the air-cooling lithium-ion battery pack. Appl. Therm. Eng. 236, 121486. doi:10.1016/j.applthermaleng.2023.121486
Keywords: formula student electric racing car, orthogonal experiments, thermal simulation, air cooling system, discharge status
Citation: Han Y, Bai Y, Zhang W, Cui S, Zang L and Ding H (2025) Study of thermal management system for battery box for formula student electric racing car. Front. Mech. Eng. 11:1529633. doi: 10.3389/fmech.2025.1529633
Received: 17 November 2024; Accepted: 20 January 2025;
Published: 06 February 2025.
Edited by:
Hamit Solmaz, Gazi University, TürkiyeReviewed by:
Lei Zhang, Beijing Institute of Technology, ChinaAnirban Sur, Symbiosis International University, India
Copyright © 2025 Han, Bai, Zhang, Cui, Zang and Ding. This is an open-access article distributed under the terms of the Creative Commons Attribution License (CC BY). The use, distribution or reproduction in other forums is permitted, provided the original author(s) and the copyright owner(s) are credited and that the original publication in this journal is cited, in accordance with accepted academic practice. No use, distribution or reproduction is permitted which does not comply with these terms.
*Correspondence: Liguo Zang, emFuZ2xpZ3VvQG5qaXQuZWR1LmNu