 Wenhua Chu1,2,3*
 Zijing Zhao
94% of researchers rate our articles as excellent or good
Learn more about the work of our research integrity team to safeguard the quality of each article we publish.
Find out more
ORIGINAL RESEARCH article
Front. Mech. Eng., 04 March 2025
Sec. Fluid Mechanics
Volume 11 - 2025 | https://doi.org/10.3389/fmech.2025.1458310
In trawling fisheries, otter boards are essential tools that expand net openings and gather fish schools. This study uses the Smoothed Particle Hydrodynamics (SPH) method to create a three-dimensional numerical model for a biplane-type otter board. A scaled model is fabricated for dynamic flume experiments, validating the numerical results. Analysis with Computational Fluid Dynamics (CFD) demonstrates that the three-dimensional SPH model enhances computational accuracy over traditional CFD. A comprehensive analysis of hydrodynamic performance under various structural parameters, including camber ratio and the position of maximum camber ratio, was conducted. Results indicate that both the camber ratio and its position significantly affect the hydrodynamic performance. For maximum lift coefficient, setting the camber ratio of both boards to approximately 20% is optimal. However, for a higher lift-to-drag ratio, a 5% camber ratio for both boards is preferable. When the position of maximum camber ratio is at 10%, the lift coefficient peaks, offering the best expansion effect. Conversely, setting this position at 30% maximizes the lift-to-drag ratio, indicating better overall performance. This study provides valuable insights for optimizing otter board design in trawling fisheries.
Trawl fishing, as an efficient fishing method, employs vessel power to tow bag-shaped fishing gear through water areas to catch fish, shrimp, and other marine organisms (Figure 1). It is characterized by its maneuverability and adaptability, but it also consumes high energy and significantly impacts fisheries resources and marine ecology. The otter board serves as a crucial component in trawl fishing, and its performance directly affects fishing efficiency. A low lift force reduces dragging resistance, while appropriate resistance ensures the stability of the otter board. Balancing these two factors is essential for optimizing otter board design and improving fishing efficiency, representing the key to achieving efficient fishing while protecting resources. After reading numerous literature, it has been found that there are many advanced technologies in other fluid dynamics fields that are utilized to increase lift and reduce drag (Abdolahipour, 2023; Abdolahipour et al., 2022a; Abdolahipour et al., 2022b).
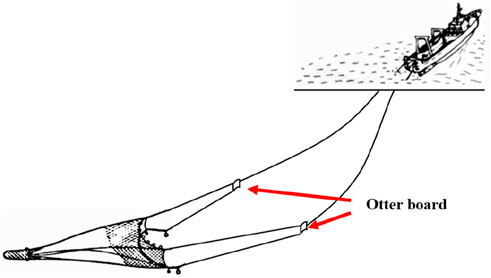
Figure 1. Diagram of single-vessel trawling.
Otter boards are widely used in trawling fisheries due to their characteristics of expanding the net opening and driving and collecting fish schools. The hydrodynamic performance of otter boards directly affects the fishing and economic benefits of trawling (Broadhurst et al., 2012). With the widespread application of otter boards, exploring changes in the hydrodynamic performance of otter boards by altering their structure, and developing efficient and energy-saving otter boards have become hot topics of research for many scholars. Among them, the biplane-type otter board developed by Takahashi et al. (2017) is at the forefront. In the 1990s, Fukuda et al. (1997) and Fukuda et al. (1999) found through research that the expansion force of the biplane-type otter board is higher than that of the traditional monoplane otter board used in Japan, and the suitable angle of attack range to achieve higher lift is about twice that of the monoplane otter board. Xie et al. (2022) studied the hydrodynamic characteristics of biplane-type otter board with canvas through a flume test. You et al. (2020) studied the hydrodynamic characteristics of biplane-type otter board with a camber ratio of 20% under different angles of attack through a flume test. Takahashi et al. (2015) conducted a computational Fluid Dynamics (CFD) analysis on a biplane-type otter board model, visualized the streamlines and separation zones around the otter board, and compared the results with those from a flume test, verifying the accuracy of CFD in studying the hydrodynamic performance of the biplane-type otter board. Zhuang et al. (2022) studied through a flume test and CFD calculation and found that the wingtip vortex generated by the monoplane-type hyper-lift trawl door (HLTD) with a slit of 0.2c is beneficial for suppressing flow separation at medium to high angles of attack, which is related to the increase in lift and drag coefficients. Wang et al. (2022) through an orthogonal experiment investigated the impact of the aspect ratio, camber of the fore wing, and gap ratio of front and rear wing panels on the hydrodynamic performance of the propeller blade, determining that the optimal otter board possesses an aspect ratio of 2.0, a camber of the fore wing of 0.16, and a gap ratio of front and rear wing panels of 0.35, with the aspect ratio exerting the most significant influence on performance.
Despite the achievements made in these numerical simulations, one can see that due to the irregular shape of the otter board, which is not a standard cube, cuboid, or sphere, issues such as grid deformation and distortion can arise during mesh generation. Significant grid deformation can reduce the calculation accuracy and affect computational efficiency. Smoothed Particle Hydrodynamics (SPH) (Liu et al., 2003; Wang and Liu, 2010; Xiong et al., 2006; Ye et al., 2019; Li et al., 2023; Toosi et al., 2015; Chen et al., 2023), a particle-based technique for simulating fluid flow problems, is suitable for handling strongly nonlinear flows. In otter board research, the SPH method can more flexibly handle changes in otter board shape and structure, while accurately simulating the interaction between the fluid and the otter board. For instance, Islam (2024) employed weakly compressible SPH to simulate fluid flow and used a pseudo-spring-based SPH solver to model structural responses. Dong et al. (2016) proposed a smooth particle hydrodynamics modeling program, which is used to simulate the surface erosion caused by impact. Lyu et al. (2023) presents an improved smoothed particle hydrodynamics (SPH) model through a rigorous mathematical derivation based on the principle of virtual work. Guan et al. (2024) combined SPH with several improved numerical techniques to simulate fluid-structure interaction (FSI), utilizing a quaternion-based approach to model rigid body motion. Compared to Eulerian grid-based methods, SPH models have demonstrated significant advantages in capturing large deformations of free surfaces and splashing droplets. Zhang et al. (2003) proposed an SPH interaction method to establish a numerical fluid-structure interaction model and modified the particle velocities in the momentum equation. Cheng et al. (2017) studies the fluid dynamics during the flooding of a damaged ship numerically and experimentally, and established SPH method with an improved boundary treatment. Shi et al. (2024) utilized the numerical method of smooth particle hydrodynamics to simulate the fluid flow around the flexible net panel. The accuracy of the model was verified through the comparison of existing experimental and simulation data. The results showed that this method can accurately simulate the flow of the flexible net panel and provide detailed analysis of velocity distribution and deformation.
From the various literature mentioned above, one can see the adaptability of the SPH method to complex flow problems. Therefore, this paper takes the biplane-type otter board as the research object, establishes a three-dimensional SPH model for its hydrodynamic performance, and rigorously validates this model through flume tests to ensure its accuracy and data reliability. Based on the aforementioned model, a practical operation model of the otter board is established to conduct detailed research and analysis on the hydrodynamic performance of the otter board under different angles of attack. Simultaneously, the study explores the impact of structural changes on the hydrodynamic performance of the otter board, aiming to gain a deeper understanding of its flow characteristics, optimize its design, and enhance the accuracy of performance predictions. Additionally, this research can provide new ideas and methods for studies in related fields.
In this paper, the biplane-type otter board is chosen as the research subject. The otter board has a wingspan of l = 2270 mm and a chord length of b = 1200 mm. It also exhibits a camber ratio of f = 15% and an aspect ratio of λ (L/b) = 1.90. The otter board is equipped with two cambered boards at both ends and two stiffeners in the middle. Additionally, the body of the otter board is fitted with rings for connecting the handrope and towrope. Since the rings have a minimal impact on the hydrodynamic performance of the otter board, they are simplified during the numerical simulation process.
The simplified geometric model and structural parameters of the biplane-type otter board are illustrated in Figure 2. In the figure, the horizontal distance between the two cambered boards A and B is denoted as d, and the camber ratio is defined as the maximum distance h from the arc to the chord line on the cross-section of the cambered board, divided by the sum of the chord lengths (c1 + c2) and expressed as a percentage, i.e., f = h/(c1 + c2) × 100%. The position of the maximum camber (P) is defined as the ratio of the projection of the point with the maximum distance from the arc to the chord line on the cross-section of the cambered board to the chord length, measured from one end of the arc, expressed as a percentage, i.e., c2/(c1 + c2) × 100%. The ratio of the horizontal distance between the chords of the two wings to the chord of the wing (i.e., M = d/b) is 0.83.
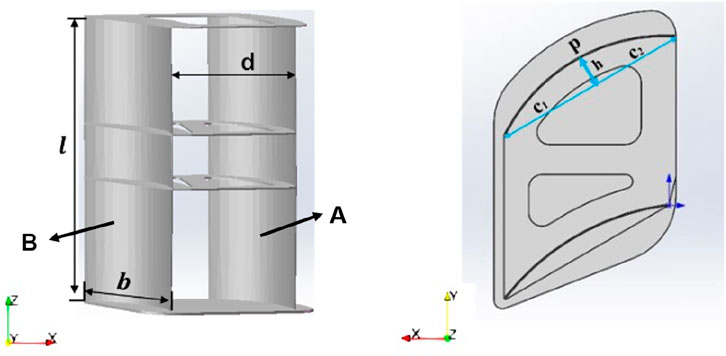
Figure 2. Biplane-type otter board structure model.
The hydrodynamic performance parameters of the biplane-type otter board primarily include the lift coefficient (
In the Equations 1–3:
The kernel function is crucial to the Smoothed Particle Hydrodynamics (SPH) method, as it determines the form of the function approximation, the size of the particle’s support domain, and significantly influences the degree and accuracy of kernel approximation and particle approximation. In this paper, the Wendland function is adopted due to its superior numerical stability and computational efficiency, making it suitable for large-scale simulation problems. Following the article (Wendland et al.), Wendland kernel reads (Wendland, 1995):
In the Equation 4: Where
The process of fluid motion follows three fundamental physical principles, namely, the three governing equations: the mass conservation equation (also known as the continuity equation), the momentum conservation equation (Navier-Stokes equation), and the energy conservation equation.
In some complex mechanical environments, solving the governing equations involving variables such as energy, density, and velocity can often be challenging. The SPH method represents the computational domain using a particle distribution, converts the partial differential equations to be solved into integral forms using kernel function approximation, discretizes the kernel function equations using particle approximation, and obtains the variables within the particle field by solving the discrete equations. The discretized expression (Gomez-Gesteira et al., 2021a; Gomez-Gesteira et al., 2021b) of the continuity equation is as follows:
In the Equation 5:
In 1994, Monaghan (1994) proposed an artificial viscosity calculation method that can be used to calculate fluid viscosity, discretizing the momentum equation into SPH particle form as
In the Equation 6:
The specific form of the viscous term,
In the Equation 7:
In the Equations 8, 9: The smoothing length,
By applying particle approximation to the energy conservation equation, a discretized energy conservation equation is obtained, which can be expressed as (Owen, 2014):
In the Equation 10:
In setting the parameters for the numerical simulation conducted in this paper, the velocity inlet is set as a uniform flow in the positive direction of the X-axis, with four layers of particles at the inlet. The inlet boundary is configured as a Dirichlet boundary condition. The objective of this simulation is to observe the hydrodynamic characteristics of the otter board during its operation, rather than to specifically focus on the detailed pressure or velocity distribution at the outlet. This generally implies that no additional forces or constraints are applied to the particles at the outlet, hence a free-outflow boundary condition is employed, with four layers of particles at the outlet. The four lateral sides of the flow field adopt a fixed wall boundary condition, where the particles on the wall are assigned the same initial properties as the fluid particles (inter-particle distance, particle mass, and density). Both types of particles satisfy the same equations. This method treats the wall boundary particles as fluid particles, adhering to the same equations. However, while the fluid particles move according to their inherent forces, the boundary particles remain fixed in position.
The numerical simulation based on the aforementioned three-dimensional structural model is completed using the Dualsphysics method. This section takes the experimental model of the otter board as an example, which is placed appropriately within the flow domain. The biplane-type otter board model is then established in SolidWorks and exported as an STL file, which is directly read by the source code with default dynamic boundary conditions.
Based on the selection of key parameters mentioned earlier, the flow field and the biplane-type otter board are particleized to establish a three-dimensional numerical model for the operation process of the otter board, as shown in Figure 3A. During the particleization process of the flow field and the otter board, the setting of the attack angle is a crucial parameter. The attack angle, also known as the angle of attack, refers to the angle between the chord of the otter board and the direction of the water flow, as illustrated in Figure 3B. In the numerical model, the flow velocity is set to 0.7 m·s-1, and the flow field region has dimensions of X = 12000mm, Y = 8800mm, and Z = 7800 mm. The total computation time is set to 12.0s with a time step of 0.02s. GPU computation is utilized to enhance the accuracy and efficiency of the model calculations. Multiple computations are conducted following the principle of controlled variables, with parameters set based on empirical values or specific gradients.
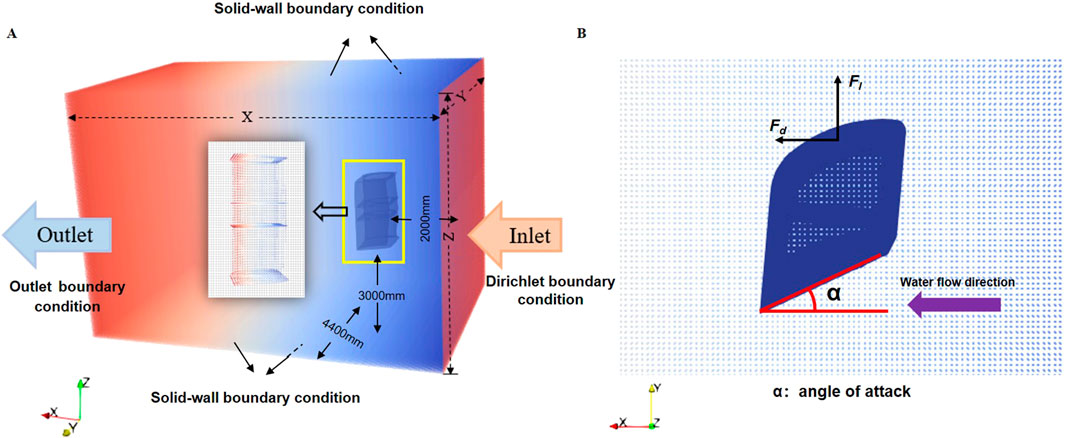
Figure 3. Three-Dimensional SPH Model of Biplane-type otter board Operation Process. [(A) Particleized model of biplane-type otter board and flow domain (B) Definition of attack angle for biplane-type otter board operation).
To validate the effectiveness of the three-dimensional SPH model established in this study for the operation process of the biplane-type otter board, a dynamic flume model test was designed and conducted. Considering the size of the flume and the measurement range of the six-component force sensor, a model scale ratio of 6:1 was adopted for the test design, as illustrated in Figure 4. The test was carried out in the recirculating flume at Shanghai Ocean University, with a test section length of A = 10.0m, width of C = 3.0m, and depth of B = 2.0 m. The flume’s flow velocity can be adjusted within the range of 0–1.4 m·s-1. The flume was equipped with a flow velocity detection instrument and a six-component force sensor with a measurement range of 0–500N and an accuracy of 0.1%. The otter board was fixed at the end of the six-component force sensor, connected by a metal rod with a length of 0.5 m. It was positioned 3m–5 m away from the inlet of the flume and submerged at a depth of 0.61 m. The water temperature in the flume was maintained at t = 21.0°C, with a water density of ρ = 997.0 kg/m^2.
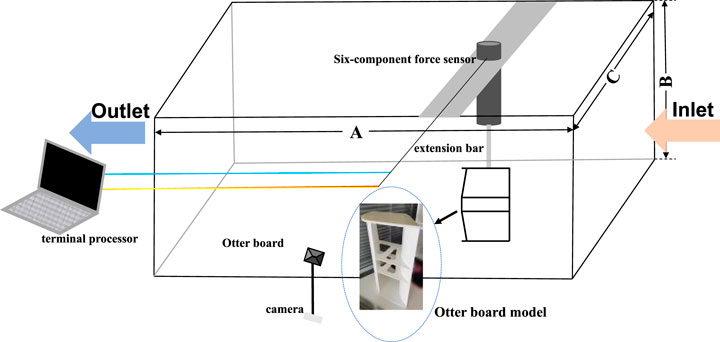
Figure 4. The principle diagram of biplane-type otter board dynamic flume test.
Based on the experimental process described above, three-dimensional numerical models of the same scale were established using both SPH and CFD for hydrodynamic performance calculations.
Based on the aforementioned three-dimensional structural model of the otter board, this paper utilizes the computational fluid dynamics (CFD) software ICEM 19.0, developed by ANSYS Inc. in the United States, to perform mesh generation for the flow field surrounding the otter board structure, and FLUENT 19.0 for the computations. The turbulence model is set to the RNG K-epsilon model. The upstream inlet is configured as a velocity inlet boundary with a flow direction along the positive X-axis and a flow velocity of 0.7 m·s⁻1. The turbulence intensity is set to 5%, and the turbulence intensity ratio is set to 3. The downstream outlet is configured as a pressure outlet boundary. The surface of the otter board structure and the boundaries of the computational domain are set as no-slip walls. To enhance computational accuracy, a structured prismatic layer mesh is placed along the surface of the otter board, which consists of 5 expansion layers with a growth rate of 3. The far-field area employs unstructured tetrahedral meshes, while the near-wall area uses prismatic meshes for refinement. The finite volume method (FVM) is employed to discretize the Reynolds governing equations in the simulation. To ensure the correctness of the numerical simulation, grid independence tests were conducted on numerical simulation results with 8 million, 10 million, and 11 million grids, respectively. The deviation values among the three numerical simulation results were all less than 1%. Referring to the research by WANG (WANG et al., 2021), the number of numerical simulation grids is controlled at around 10 million, with a maximum grid size of 100 mm and a minimum grid size of 2.2 mm (Figure 5). Continuous local refinement is applied to boundaries such as the vertical hyperboloidal otter board, and the feasibility of the grids is continually verified to obtain unstructured grids with good computational accuracy. The grid density around the otter board is enhanced by setting up 5 layers of inflation, with the thickness of the first inflation layer being 42 mm (9.06 < y⁺ < 90.01), and the total number of nodes and elements is approximately 1.75 × 10⁶ and 5.82 × 10⁶, respectively.
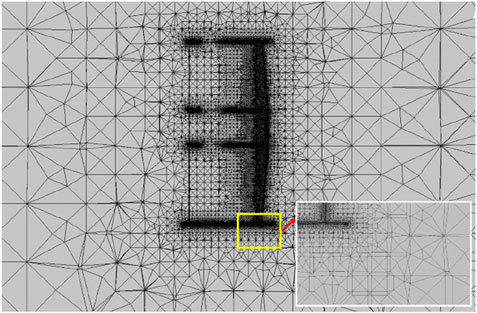
Figure 5. The grids around the otter board.
The simulated results were then compared with the experimental results obtained from the flume test, as shown in Figure 6.
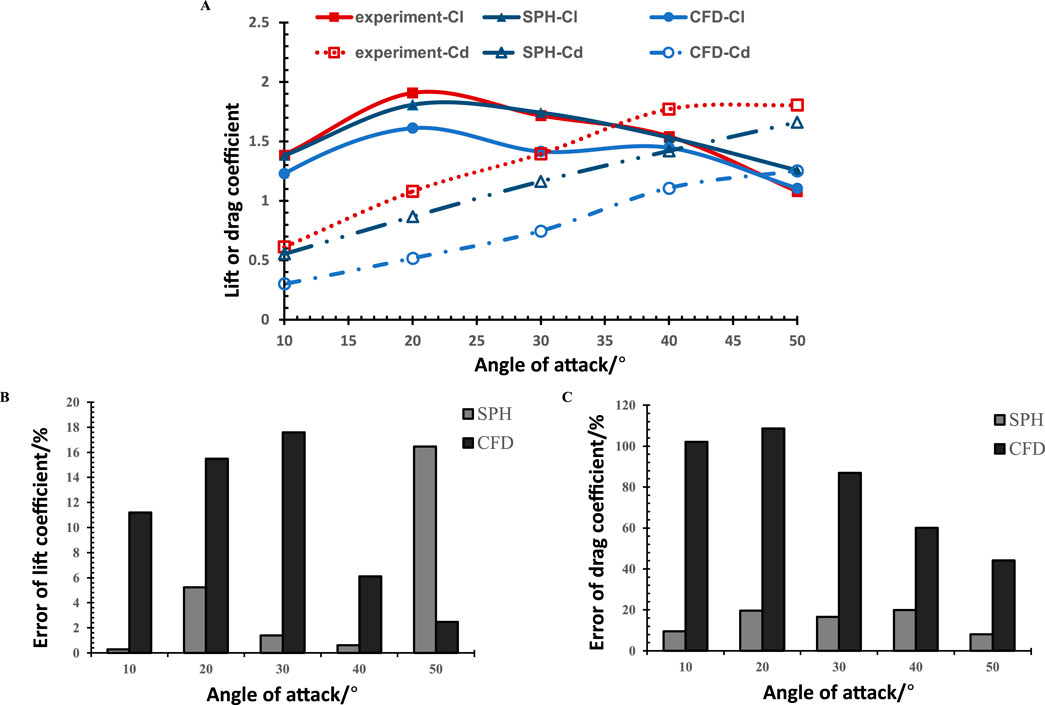
Figure 6. Comparison of two numerical simulation and experimental results of hydrodynamic performance of biplane-type otter board [(A) Lift/drag coefficient curve diagram. (B) Error of lift coefficient diagram (C) Error of drag coefficient diagram).
As evident from the comparison in Figures 6A, under the same flow velocity (V = 0.7 m·s-1), both numerical simulation methods for the hydrodynamic performance of the biplane-type otter board exhibit a general consistency with the experimental results, demonstrating an initial increase and subsequent decrease in lift coefficient as the angle of attack increases, and a gradual increase in drag coefficient with an increasing angle of attack. However, the SPH calculation results are closer to the experimental values, exhibiting a high degree of overlap with the experimental data within the range of 10°–40° for the lift coefficient curve. The maximum lift coefficient occurs at an angle of attack of 20° in both the flume test and SPH calculation, with a maximum lift coefficient of 1.90 in the experimental results, 1.80 in the SPH calculation, and 1.61 in the CFD calculation. The SPH numerical results are more aligned with the experimental values.
Figures 6B, C- respectively showcase the relative errors of lift coefficient and drag coefficient. The error in drag coefficient and the error in lift coefficient are both calculated as the percentage of the difference between the numerically simulated coefficients and the experimentally obtained coefficients, relative to the experimentally obtained coefficients. It is evident from the figures that the relative errors of both lift coefficient and drag coefficient obtained from SPH calculations are lower than those from CFD calculations. The minimum relative error of lift coefficient from SPH calculations is 0.29%, while that from CFD calculations is 2.52%. The average relative error of lift coefficient from SPH calculations (4.80%) is significantly lower than that from CFD calculations (10.59%), with a relative error at the maximum lift coefficient exceeding 15%, whereas the maximum lift coefficient error from SPH calculations is only 5.23%. Additionally, the relative error of drag coefficient from SPH calculations is approximately 8%, while the relative error from CFD calculations exceeds the permissible error range.
By comparing the SPH numerical simulation results with the flume test results, the feasibility and reliability of the SPH numerical simulation method in terms of computational accuracy are validated within the permissible error range.
Based on the validation of the three-dimensional SPH model for the operation process of the biplane-type otter board, a actual scale model was established with an incoming flow velocity set at 1 m/s. The hydrodynamic performance of the otter board under different attack angles (AOA = 10°, 15°, 20°, 25°, 30°, 40°, and 50°) was then calculated and analyzed.
The variations of lift and drag coefficients, as well as the lift-to-drag ratio, with the attack angle in the numerical simulation of the actual scale biplane-type otter board are shown in Figure 7. The lift coefficient exhibits a trend of increasing first and then decreasing as the attack angle increases. When the attack angle is less than 25°, the lift coefficient continues to increase with the increase in the attack angle, reaching a maximum value of 1.51 at an attack angle of 25°. At this point, the otter board exhibits a strong ability to expand the net opening. However, when the attack angle exceeds 25°, the lift coefficient begins to decrease with the further increase in the attack angle. Meanwhile, the drag coefficient continues to increase with the increase in the attack angle, ranging from 0.59 to 1.38, indicating that a larger attack angle results in greater resistance on the otter board. Throughout the process, the lift coefficient of the biplane-type otter board remains greater than the drag coefficient when the attack angle is less than 40°. The lift-to-drag ratio continuously decreases with the increase in the attack angle. The rate of decline in the lift-to-drag ratio is relatively gentle when the attack angle is between 10° and 25°, but it becomes steeper between 25° and 35°, reaching its maximum decline rate at an attack angle of 30°.
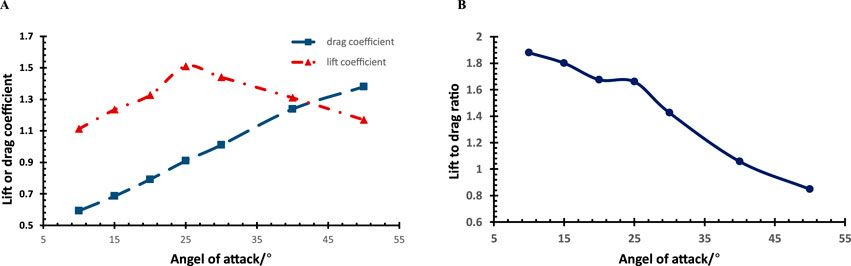
Figure 7. Hydrodynamic numerical simulation results of biplane-type otter board [(A) Lift/drag coefficient curve diagram (B) Lift-drag ratio curve diagram].
To more intuitively demonstrate the hydrodynamic performance of the biplane-type otter board at different attack angles, this study visualizes the particle distribution and velocity around the actual scale otter board during operation, generating particle distribution maps and cross-sectional slices of velocity distribution maps. During the slicing process, to ensure optimal visualization, this study selects the velocity distribution maps of the otter board operating at attack angles of 10°, 25°, and 50° and slices the cross-sections at Y = 2.5m, 3.5m, and 4.5m, which correspond to the upper, middle, and lower ends of the otter board, respectively. As shown in Figure 8, a clear calculation of the otter board’s shape and the velocity distribution pattern of the surrounding flow field can be obtained at Y = 3.5 m. Therefore, all subsequent distribution maps are extracted from this cross-section.
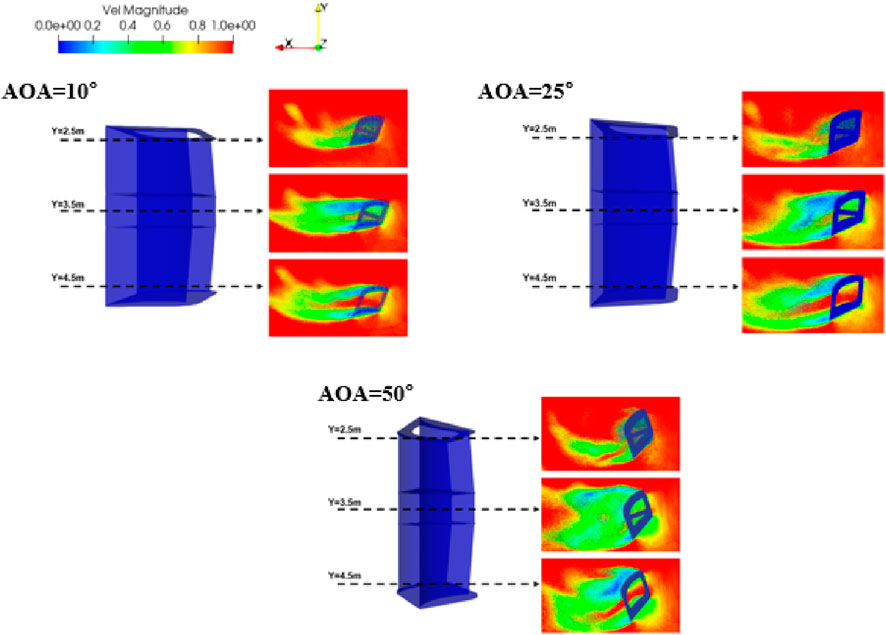
Figure 8. The velocity distribution maps near different cross-sections of the biplane-type otter board at various angles of attack.
Figure 9 demonstrates the distribution of particles near the central section of a biplane-type otter board with a camber ratio of 15%, under varying working angles of attack. Darker colors represent denser particles, while lighter colors indicate sparser particles. This indicates that the two curved plates effectively rectify the flow. The particle distribution on the backflow side of the otter board reaches its lowest point and forms a vortex there. The likely cause of this vortex is the formation of a thin boundary layer on the otter board’s surface as the water flows past its back. As the flow velocity increases, the water gradually separates from the otter board’s surface, resulting in boundary layer separation. The viscous forces during this separation cause the flow to recirculate and form a vortex. The vortex gradually expands as the number of particles increases from the inside out. As shown in Figure 9, as the attack angle increases, the vortex moves from the trailing edge to the leading edge of the curved plates and a new counterclockwise separation vortex forms at the trailing edge. During operation, the flow field around the otter board remains stable and uniform at working attack angles, with turbulence in the wake only occurring at larger attack angles.
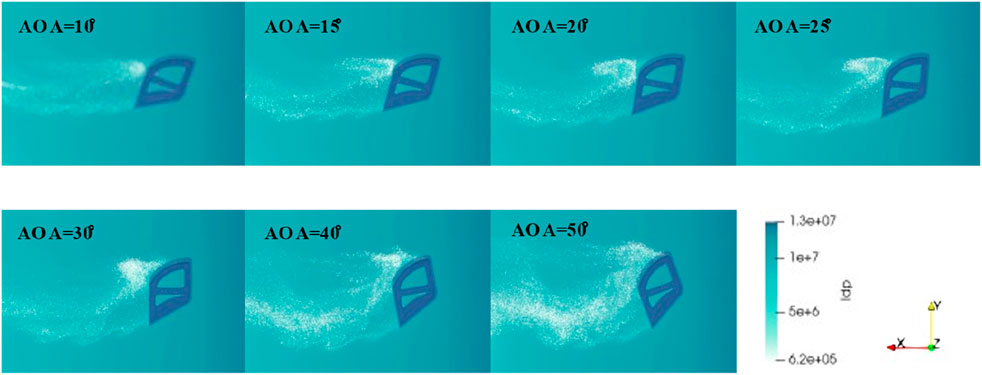
Figure 9. Particle distribution near the middle section of biplane-type otter board at different angles of attack.
As a crucial design parameter of the biplane-type otter board, camber ratio has a significant impact on its performance. To investigate the influence of changes in camber ratio on the hydrodynamic performance of the biplane-type otter board, the Smoothed Particle Hydrodynamics (SPH) method was employed. Based on the validation of the three-dimensional SPH model for the operation process of the biplane-type otter board, an actual-scale model was established. The incoming flow velocity was set to 1 m/s, and the camber ratios were set to 5%, 10%, 15%, 20%, and 25%. The hydrodynamic performance of the biplane-type otter board under different camber ratios was then calculated and analyzed.
Figure 10 illustrates the lift coefficient curves and the drag coefficient curves for the biplane-type otter board with synchronous changes in camber ratio within the same range of angle of attack. For different camber ratios, Figure 10A presents the lift coefficient initially increases and then decreases as the angle of attack increases, but the specific pattern of how the lift coefficient varies with the camber ratio is not entirely clear. Over the entire range of angles of attack, the maximum lift coefficient is achieved at a camber ratio of 20% and an angle of attack of around 25°, reaching a peak value of 1.52. As the camber ratio of the otter board increases, the maximum lift coefficient first decreases, then increases, and finally decreases again. Specifically, at an angle of attack of 25°, the maximum lift coefficient follows the trend: 5% camber change >10% camber change, 15% camber change <20% camber change, and 20% camber change >25% camber change. In other words, the maximum lift coefficient reaches its highest value when the camber ratio changes synchronously to 20%, corresponding to an angle of attack of 25°. Figure 10B presents the drag coefficient curves for the biplane-type otter board with varying camber ratios within the same range of angle of attack. For the biplane-type otter boards with different camber ratios, the drag coefficient consistently increases as the angle of attack increases. Additionally, the drag coefficient also increases with the synchronous increase in camber ratios of both cambered boards. The drag coefficient curves for different camber ratios are nearly parallel, indicating that the influence of camber ratio on the drag coefficient of the biplane-type otter board follows an approximately linear pattern. Notably, under the angle of attack range of 25°–30°, where the maximum lift coefficient is observed, the drag coefficient for a camber ratio of 15% almost overlaps with that of a 10% camber ratio.
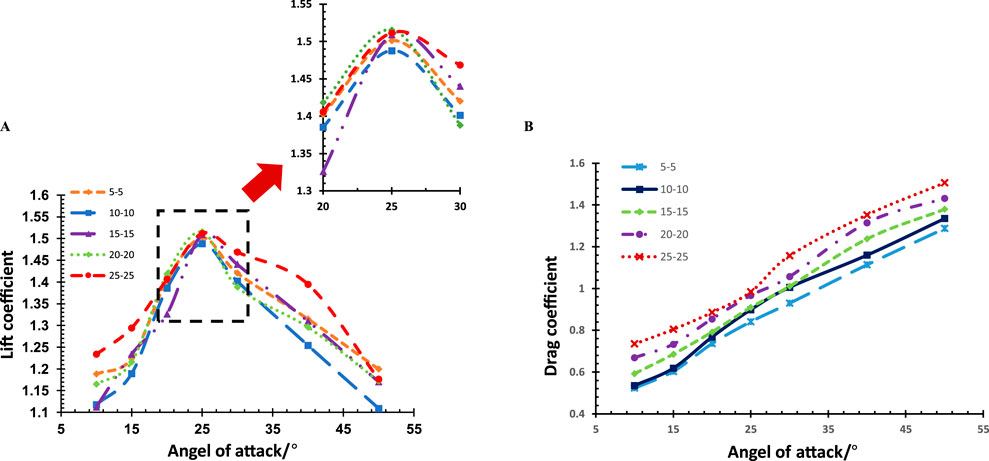
Figure 10. Lift coefficient curve and drag coefficient curve of biplane-type otter board under synchronous change. (A) Lift coefficient curve (B) Drag coefficient curve.
Figure 11A depicts the velocity distribution in the Z-direction for the biplane-type otter board with synchronous camber ratio changes. Negative velocities, indicating high-pressure zones, are observed near the upstream faces of the cambered boards A and B, primarily concentrated at the rear of the boards. Conversely, the large velocity regions, representing low-pressure zones, are primarily located at the front of the downstream faces of the cambered boards A and B. This results in a pressure difference in both the lateral and end directions of the otter board, generating a vertical lift force perpendicular to the flow direction. As the angle of attack increases, the velocity attenuation zone at the front of the cambered boards gradually expands, while the attenuation zone at the rear enlarges significantly. At an angle of attack of 20°, as the camber ratio of the otter board increases, the high-pressure zone first narrows and then expands, while the low-pressure zone exhibits a similar trend. This indicates that the pressure difference first decreases and then increases. Conversely, at an angle of attack of 30°, as the camber ratio increases, the high-pressure zone initially expands and then narrows, while the low-pressure zone follows the opposite pattern. This explains the changes in the lift coefficient curve observed in Figure 14 within the range of 20°–30° angles of attack.
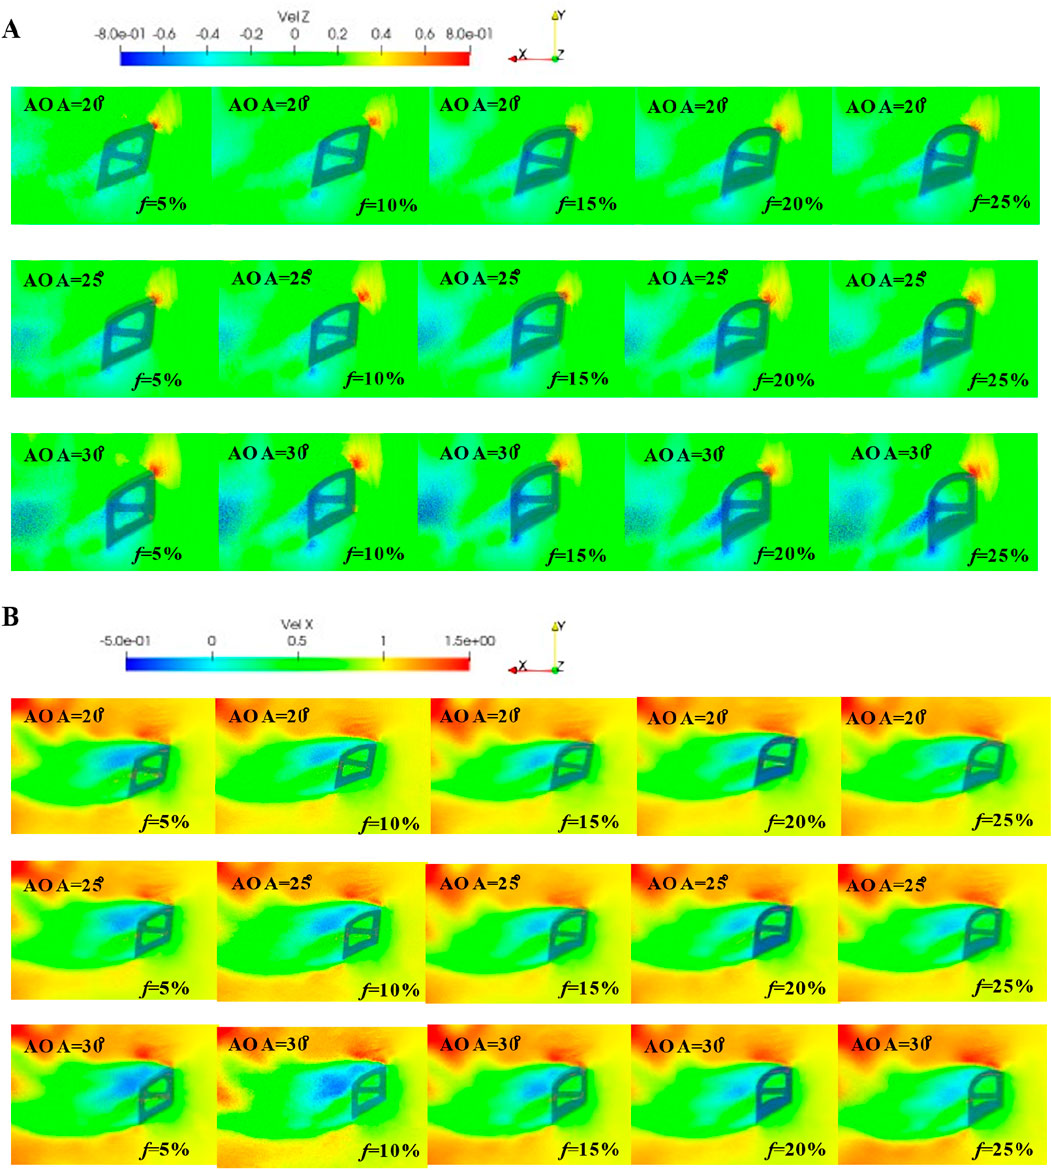
Figure 11. Velocity distribution map near the middle section of biplane-type otter board under synchronous change of camber ratio [(A) Z direction (B) X direction].
Figure 11B illustrates the X-direction velocity component for the biplane-type otter board with varying camber ratios. Similar to the previous section, Bernoulli’s principle applies, with the upstream faces of the cambered boards constituting low-pressure zones and the downstream faces high-pressure zones. This creates a pressure difference across the board’s sides and ends, with the pressure difference vector pointing in the opposite direction to the incoming flow, resulting in drag. As the angle of attack increases, the difference in area between the high- and low-pressure zones continues to expand. At a given angle of attack, the area difference increases with the increase in camber ratio, validating the trend observed in the drag coefficient curves in Figure 10B. Furthermore, under the same angle of attack, the difference in area between the high- and low-pressure zones enlarges as the camber ratio increases, corroborating the aforementioned linear relationship.
Figure 12 presents the lift-to-drag ratio curves of the cambered board under varying camber ratios within the same range of angle of attack. The lift-to-drag ratio of the otter board with different cambered board camber ratios exhibits a trend of initial slow decrease followed by a rapid decrease as the angle of attack varies. The optimal angle of attack is approximately 10° for all cases, and the maximum lift-to-drag ratio decreases as the camber ratio of the cambered board increases. Notably, when the camber ratio of both cambered boards is 5%, the maximum lift-to-drag ratio reaches its peak value of 2.27. Within the angle of attack range of 10°–25°, the lift-to-drag ratio varies more gradually with increasing camber ratio, indicating that the optimal angle of attack range should be less than 10°.
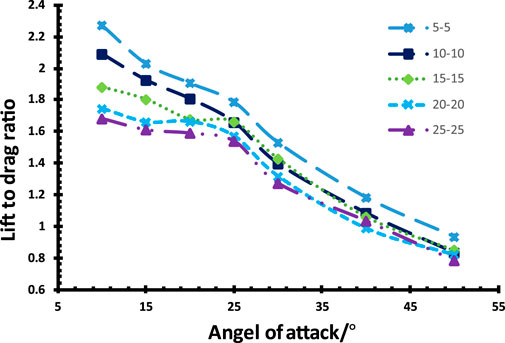
Figure 12. Lift to drag ratio curve of biplane-type otter board under synchronous change.
Excessive maximum camber may cause significant deformation in the otter board when subjected to water flow impact, leading to reduced structural stability. To analyze the impact of the position of maximum camber ratio on the hydrodynamic performance of the otter board, a practical-scale model is established based on the validation of the three-dimensional SPH model for the operational process of the biplane-type otter board. With the incoming flow velocity set at 1 m/s, the hydrodynamic performance of the biplane-type otter board is calculated and analyzed under different positions of maximum camber (
The maximum camber, serving as a crucial indicator to describe the deformation capability of the otter board, directly influences its deformation degree and stability when exposed to water flow. Figure 13 presents the lift coefficient curves and the drag coefficient curves of the biplane-type otter board with varying positions of maximum camber ratio under the same range of angle of attack parameters. As shown in Figure 13A, for different positions of maximum camber, the lift coefficient initially increases and then decreases with the increase of the angle of attack. When the angle of attack ranges from 10° to 20°, the lift coefficient exhibits high similarity at camber positions of 20%, 30%, and 50%. However, within the angle of attack range of 20°–40°, the lift coefficient demonstrates remarkable similarity at camber positions of 10%, 30%, and 50%. Changes in the position of maximum camber ratio have a certain impact on the maximum lift coefficient of the biplane-type otter board, but the regularity is not evident. The maximum lift coefficient reaches its peak value of 1.52 at an angle of attack of around 25° when the position of maximum camber ratio is changed to 10%. As observed from the figure, the optimal operating angle of attack range for the otter board remains stable at 20°–30°. Before the emergence of the maximum lift coefficient, the lift coefficient first increases and then decreases with the increase in the position of maximum camber ratio. Near the optimal angle of attack, the advantage of the position of maximum camber ratio becomes apparent, with the lift coefficient values being higher for models with the maximum camber position close to the middle and the end compared to other models.
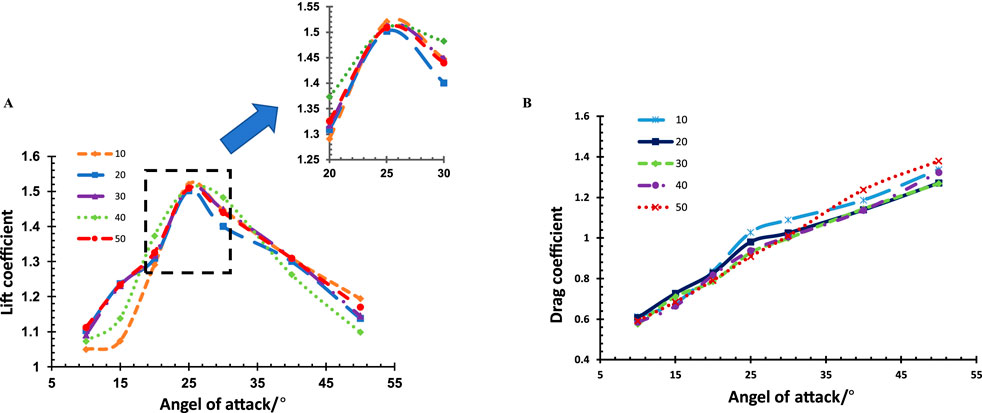
Figure 13. Lift coefficient curve and drag coefficient curve of biplane-type otter board under the variation in the position of maximum camber ratio. (A) Lift coefficient curve (B) Drag coefficient curve.
Figure 13B presents the drag coefficient curves for the biplane-type otter board with varying positions of maximum camber under the same range of angle of attack parameters. Regardless of the position of maximum camber ratio, the drag coefficient consistently increases with the increase in the angle of attack, indicating that there is no specific correlation between the drag coefficient and the increase in the position of maximum camber ratio.
As illustrated in Figure 14A, based on Bernoulli’s principle, negative velocities, indicating high-pressure areas, are observed near the upstream face of the cambered boards A and B, primarily distributed at the rear end. In contrast, large flow velocity areas, representing low-pressure zones, are mainly located at the front of the downstream face of the cambered boards A and B. This results in a pressure area difference with vectors directed upward on both sides and ends of the otter board, generating a lift force perpendicular to the direction of the water flow. As the angle of attack increases, the flow velocity attenuation zone at the front of the cambered board gradually enlarges, while the attenuation zone at the rear increases significantly. The high similarity in some flow field distribution patterns aligns with the curve distributions presented in Figure 13A. As illustrated in Figure 14B, the upstream face of the biplane-type otter board belongs to a low-pressure zone, while the downstream face constitutes a high-pressure zone. Pressure differences are formed on both sides and ends of the otter board, with the vectors of these pressure differences directed towards the right, opposite to the direction of the incoming flow, thereby generating drag. At the same angle of attack, as the position of maximum camber ratio moves closer to the middle of the cambered board, the area of the high-pressure zone on the otter board’s back gradually decreases. However, as the angle of attack increases, the area of the high-pressure zone enlarges. The area of the low-pressure zone is relatively small, and its change pattern with respect to the position of camber and the angle of attack is not evident. As the angle of attack increases, the area of the low-pressure zone also increases. The high similarity in some flow field distribution patterns aligns with the curve distributions presented in Figure 13B.
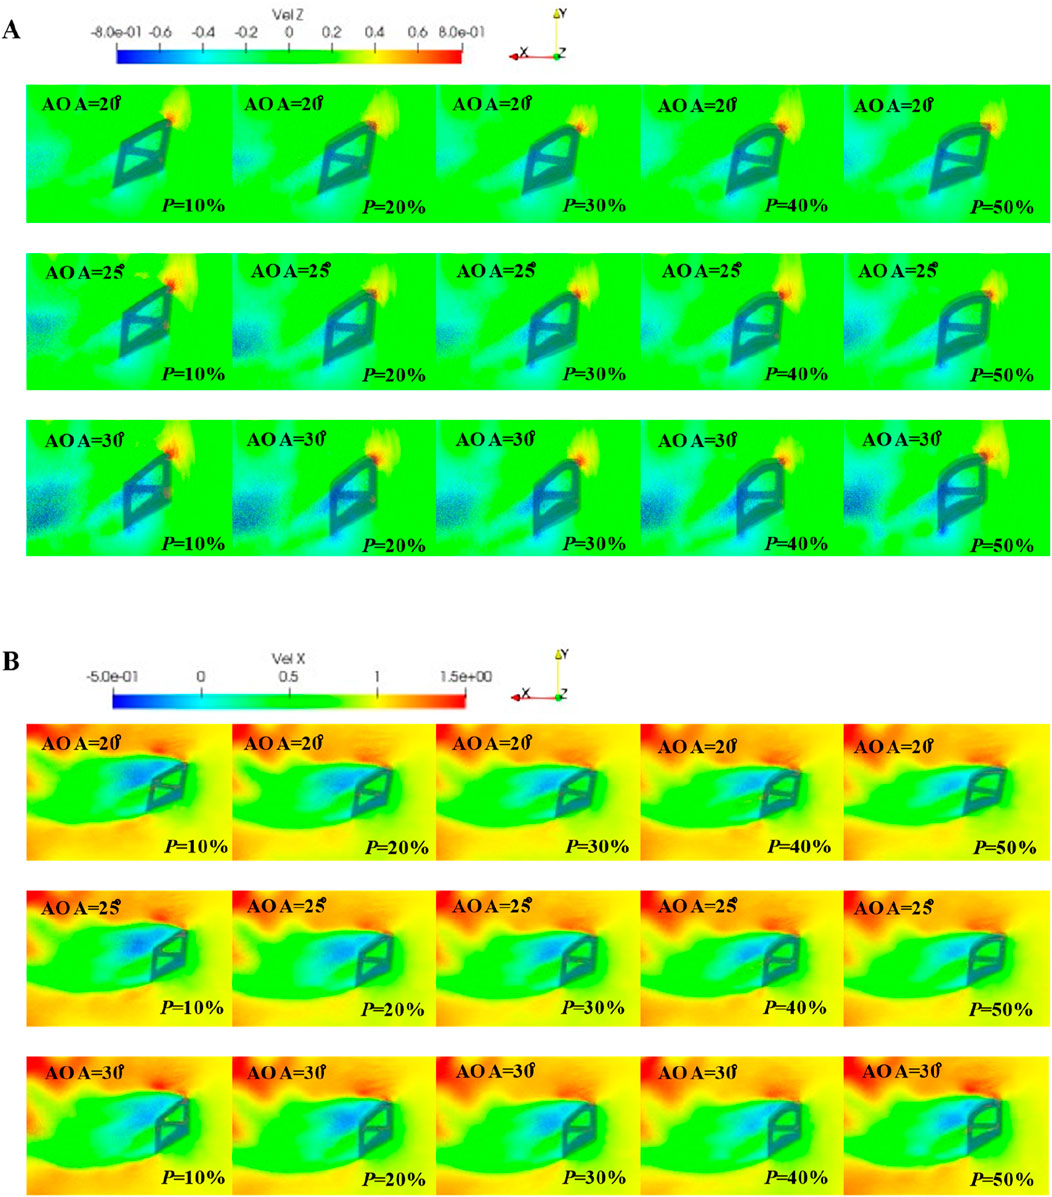
Figure 14. Velocity distribution map near the middle section of biplane-type otter board under the variation in the position of maximum camber ratio [(A) Z direction (B) X direction].
Figure 15 presents the lift-to-drag ratio curves for the biplane-type otter board with varying positions of maximum camber under the same range of angle of attack parameters. As the angle of attack increases, the lift-to-drag ratio of the otter boards with different positions of maximum camber first decreases gradually and then rapidly. The optimal angle of attack is around 10° for all cases. The maximum lift-to-drag ratio increases as the position of maximum camber ratio approaches the middle of the cambered board. Notably, the maximum lift-to-drag ratio reaches its peak value of 1.90 when the position of maximum camber ratio of both cambered boards are set at 30%. Within the range of angles of attack from 15° to 25°, the lift-to-drag ratio changes more gradually with increasing camber. Consequently, the optimal range of angles of attack should be less than 10° to maximize the lift-to-drag ratio.
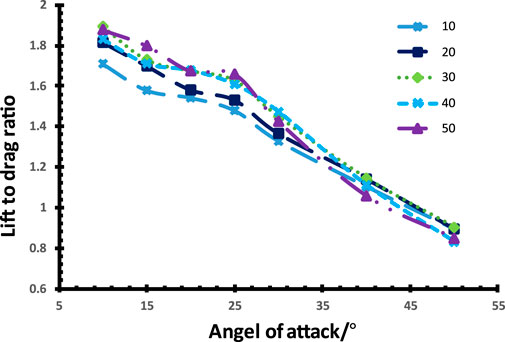
Figure 15. Lift to drag ratio curve of biplane-type otter board under the variation in the position of maximum camber ratio.
The otter board is widely used in trawling fisheries to enhance fishing efficiency. Therefore, optimizing the design of the otter board and improving its hydrodynamic performance are crucial. Unlike traditional methods that rely on CFD software for analyzing the otter board’s hydrodynamics, this paper establishes a three-dimensional numerical model for the operational process of the biplane-type otter board based on SPH theory. By validating the model’s effectiveness through dynamic flume tests, we analyze the otter board’s hydrodynamic performance and influencing parameters. The main conclusions are as follows:
(1) The three-dimensional SPH model established in this study for the operational process of the biplane-type otter board demonstrates high validity, as the calculated lift and drag coefficients exhibit smaller relative errors compared to CFD results when benchmarked against the results of the flume test. Specifically, the SPH calculations align more closely with the experimental values than CFD results. The relative error of the calculated lift coefficient is approximately 0.3%, and the relative error of the drag coefficient is around 8%, both compared to the flume test results. For this type of biplane-type otter board, as the angle of attack increases, the lift coefficient initially rises and then decreases, while the drag coefficient gradually increases. The maximum lift coefficient occurs at an angle of attack of 20°.
(2) When the camber ratio of the biplane-type otter board changes simultaneously, the maximum lift coefficient exhibits a trend of increasing first and then decreasing as the angle of attack increases, while the drag coefficient continues to increase. A camber ratio of 20% results in the best expansion effect for the otter board. For the biplane-type otter board, increasing the camber ratio within a certain range can be an effective structural improvement for enhancing its lift, but increasing the camber ratio also leads to an increase in drag, resulting in a decrease in the lift-to-drag ratio.
(3) At the same angle of attack, the lift-to-drag ratio of the biplane-type otter board exhibits a trend of first increasing and then decreasing as the position of camber changes. When the camber positions of both otter boards are set to 10% and the angle of attack is 25°, the lift coefficient reaches its maximum value of 1.52. When the camber positions of both otter boards are set to 30% and the angle of attack is 10°, the lift-to-drag ratio reaches its peak value of 1.90. However, both values are lower than the maximum lift coefficient and the highest lift-to-drag ratio achieved under the optimized scheme with varying camber ratios, indicating that the improvement in hydrodynamic performance is not particularly significant.
(4) If only considering the expansion effect, setting the camber ratio of both cambered boards A and B to approximately 20% can maximize the maximum lift coefficient of the biplane-type otter board within a certain range. However, considering the overall performance of the otter board, setting the camber ratio of both cambered boards A and B to 5% can achieve a higher optimal lift-to-drag ratio. When the position of maximum camber ratio of both cambered boards are set to 10%, the lift coefficient of the otter board reaches its maximum value, indicating the best expansion effect. Conversely, when the camber positions of both cambered boards are set to 30%, the maximum lift-to-drag ratio is achieved, indicating better overall performance of the otter board.
The original contributions presented in the study are included in the article/supplementary material, further inquiries can be directed to the corresponding author.
WC: Conceptualization, Writing–review and editing, Funding acquisition, Project administration, Supervision. ZZ: Conceptualization, Methodology, Software, Validation, Visualization, Writing–original draft, Writing–review and editing. HG: Methodology, Software, Supervision, Writing–review and editing. JY: Supervision, Writing–review and editing.
The author(s) declare that financial support was received for the research, authorship, and/or publication of this article. This research was funded by the National Natural Science Foundation of China grant number No. 31972845.
We thank the staff who assisted with the project and funding sources for their invaluable support and assistance.
The authors declare that the research was conducted in the absence of any commercial or financial relationships that could be construed as a potential conflict of interest.
All claims expressed in this article are solely those of the authors and do not necessarily represent those of their affiliated organizations, or those of the publisher, the editors and the reviewers. Any product that may be evaluated in this article, or claim that may be made by its manufacturer, is not guaranteed or endorsed by the publisher.
Abdolahipour, S. (2023). Effects of low and high frequency actuation on aerodynamic performance of a supercritical airfoil. Front. Mech. Eng. 9, 1290074. doi:10.3389/fmech.2023.1290074
Abdolahipour, S., Mani, M., and Arash, S. T. (2022a). Experimental investigation of flow control on a high-lift wing using modulated pulse jet vortex generator. J. Aerosp. Eng. 35 (5), 05022001. doi:10.1061/(asce)as.1943-5525.0001463
Abdolahipour, S., Mani, M., and Taleghani, A. S. (2022b). Pressure improvement on a supercritical high-lift wing using simple and modulated pulse jet vortex generator. Flow. Turbul. Combust. 109, 65–100. doi:10.1007/s10494-022-00327-9
Altomare, C., Crespo, A. J. C., Domínguez, J. M., Gómez-Gesteira, M., Suzuki, T., and Verwaest, T. (2015). Applicability of smoothed particle hydrodynamics for estimation of sea wave impact on coastal structures. Coast. Eng. 96, 1–12. doi:10.1016/j.coastaleng.2014.11.001
Broadhurst, M. K., Sterling, D. J., and Cullis, B. R. (2012). Effects of otter boards on catches of an Australian penaeid trawl. Fish. Res. 131, 67–75. doi:10.1016/j.fishres.2012.07.015
Chen, D., Huang, W. X., Huang, D., and Liang, C. (2023). An adaptive multi-resolution SPH approach for three-dimensional free-surface flow with fluid impacting. Eng. Anal. Bound. Elem. 155, 642–651. doi:10.1016/j.enganabound.2023.07.013
Cheng, H., Zhang, A. M., and Ming, F. R. (2017). Study on coupled dynamics of ship and flooding water based on experimental and SPH methods. Phys. Fluids. 29, 107101. doi:10.1063/1.4986004
Crespo, A. J. C., Domínguez, J. M., Rogers, B. D., Gómez-Gesteira, M., Longshaw, S., Canelas, R., et al. (2015). DualSPHysics: open-source parallel CFD solver based on smoothed particle hydrodynamics (SPH). Comput. Phys. Commun. 187, 204–216. doi:10.1016/j.cpc.2014.10.004
Dong, X. W., Liu, G. R., Li, Z. L., and Zeng, W. (2016). A smoothed particle hydrodynamics (SPH) model for simulating surface erosion by impacts of foreign particles. Tribol. Int. 95, 267–278. doi:10.1016/j.triboint.2015.11.038
Fukuda, K., Hu, F., Tokai, T., and Matuda, K. (1999). Effects of aspect and camber ratios on hydrodynamic characteristics of biplane-type otter board. Nippon. Suisan Gakk 65, 860–865. doi:10.2331/suisan.65.860
Fukuda, K., Matuda, K., Hu, F. X., and Tokai, T. (1997). A model experiment on hydrodynamic characteristics of biplane-type otter board. Nippon. Suisan Gakk 63, 207–212. doi:10.2331/suisan.63.207
Gomez-Gesteira, M., Crespo, A. J. C., Rogers, B. D., Dalrymple, R. A., Dominguez, J. M., and Barreiro, A. (2012b). SPHysics-development of a free-surface fluid solver-Part2: efficiency and test cases. Comput. Geosci. 48, 300–307. doi:10.1016/j.cageo.2012.02.028
Gomez-Gesteira, M., Rogers, B. D., Crespo, B. D., Dalrymple, R. A., Narayanaswamy, M., and Dominguez, J. M. (2021a). SPHysics-development of a free-surface fluid solver-Part1: theory and formulations. Comput. Geosci. 48, 289–299. doi:10.1016/j.cageo.2012.02.029
Guan, X. S., Sun, P. N., Xu, Y., Lyu, H. G., and Geng, L. M. (2024). Numerical studies of complex fluid-solid interactions with a six degrees of freedom quaternion-based solver in the SPH framework. Ocean. Eng. 291, 116484. doi:10.1016/j.oceaneng.2023.116484
Islam, M. R. I. (2024). SPH-based framework for modelling fluid-structure interaction problems with finite deformation and fracturing. Ocean. Eng. 294, 116722. doi:10.1016/j.oceaneng.2024.116722
Li, Y. C., Shi, H. B., and Zhang, B. Y. (2023). An algorithm to couple smoothed particle hydrodynamics and finite element method for fluid-structure interaction problems. Phys. Fluids. 35, 117101. doi:10.1063/5.0169801
Liu, M. B., Liu, G. R., Lam, K. Y., and Zong, Z. (2003). Smoothed particle hydrodynamics for numerical simulation of underwater explosion. Comput. Mech. 30, 106–118. doi:10.1007/s00466-002-0371-6
Lyu, H. G., Sun, P. N., Liu, P. Z., Huang, X. T., and Golagrossi, A. (2023). Derivation of an improved smoothed particle hydrodynamics model for establishing a three-dimensional numerical wave tank overcoming excessive numerical dissipation. Phys. Fluids. 35, 067102. doi:10.1063/5.0153363
Monaghan, J. J. (1994). Simulating free surface flows with SPH. J. Comput. Phys. 110, 399–406. doi:10.1006/jcph.1994.1034
Owen, J. M. (2014). A compatibly differenced total energy conserving form of SPH. Int. J. Numer. Meth. Fl. 75, 749–774. doi:10.1002/fld.3912
Shi, Q., Zhao, D., Xue, D., Zhang, N., Zhang, L., and Pan, Y. (2024). Numerical modelling of the interaction between flexible net panels and fluids using SPH method. Front. Mar. Sci. 11. doi:10.3389/FMARS.2024.1365857
Takahashi, Y., Fujimori, Y., Hu, F. X., and Kimura, N. (2017). Shape optimization for otter board using computational fluid dynamics analysis and response surface methodology. Nippon. Suisan Gakk 83, 950–960. doi:10.2331/suisan.16-00076
Takahashi, Y., Fujimori, Y., Hu, F. X., Shen, X. L., and Kimura, N. (2015). Design of trawl otter boards using computational fluid dynamics. Fish. Res. 161, 400–407. doi:10.1016/j.fishres.2014.08.011
Toosi, S., Ayyoubzadeh, S., and Valizadeh, A. (2015). The influence of time scale in free surface flow simulation using Smoothed Particle Hydrodynamics (SPH). KSCE J. Civ. Eng. 19, 765–770. doi:10.1007/s12205-012-0477-0
Wang, B. L., and Liu, H. J. (2010). Application of SPH method on free surface flows on GPU. Hydrodyn 22, 869–871. doi:10.1016/s1001-6058(10)60051-0
Wang, L., Zhang, X., Wan, R., Xu, Q., and Qi, G. (2022). Optimization of the hydrodynamic performance of a double-vane otter board based on orthogonal experiments. J. Mar. Sci. Eng. 10, 1177. doi:10.3390/jmse10091177
Wang, G., Huang, L., Wang, L., Zhao, F., Li, Y., and Wan, R. (2021). A metamodeling with CFD method for hydrodynamic optimisations of deflectors on a multi-wing trawl door[J]. Ocean. Eng. 232: 109045. doi:10.1016/j.oceaneng.2021.109045
Wendland, H. (1995). Piecewise polynomial, positive definite and compactly supported radial functions of minimal degree. Adv. Comput. Math. 4, 389–396. doi:10.1007/bf02123482
Xie, S. J., Wu, R. K., Hu, F. X., and Song, W. H. (2022). Hydrodynamic characteristics of the biplane-type otter board with the canvas through flume-tank experiment. China Ocean. Eng. 36, 911–921. doi:10.1007/s13344-022-0080-1
Xiong, H. B., Chen, L. H., and Liu, J. Z. J. (2006). Smoothed particle hydrodynamics modeling of free surface flow. Hydrodyn 18, 443–445. doi:10.1016/S1001-6058(06)60091-7
Ye, T., Pan, D. Y., Huang, C., and Liu, M. B. (2019). Smoothed particle hydrodynamics (SPH) for complex fluid flows: recent developments in methodology and applications. Phys. Fluids. 31, 011301. doi:10.1063/1.5068697
You, X. X., Hu, F. X., Kumazawa, T., Dong, S. C., and Shiode, D. (2020). Hydrodynamic performance of a newly designed biplane-type hyper-lift trawl door for otter trawling. Appl. Ocean. Res. 104, 102354. doi:10.1016/j.apor.2020.102354
Zhang, J. W., Wang, B. P., Jiang, Q., Hou, G., Li, Z. R., and Liu, H. Z. (2003). Numerical study of fluid-solid interaction in elastic sluice based on SPH method. Water, 15. doi:10.3390/w15213738
Keywords: smoothed particle hydrodynamics, biplane-type otter board, hydrodynamic performance, numerical simulation, structural parameters
Citation: Chu W, Zhao Z, Guo H and Yan J (2025) Analysis of hydrodynamic performance and structural parameter impacts of biplane-type otter board based on smoothed particle hydrodynamics method. Front. Mech. Eng. 11:1458310. doi: 10.3389/fmech.2025.1458310
Received: 03 July 2024; Accepted: 11 February 2025;
Published: 04 March 2025.
Edited by:
Nitesh Nama, University of Nebraska-Lincoln, United StatesReviewed by:
Arash Shams Taleghani, Aerospace Research Institute, IranCopyright © 2025 Chu, Zhao, Guo and Yan. This is an open-access article distributed under the terms of the Creative Commons Attribution License (CC BY). The use, distribution or reproduction in other forums is permitted, provided the original author(s) and the copyright owner(s) are credited and that the original publication in this journal is cited, in accordance with accepted academic practice. No use, distribution or reproduction is permitted which does not comply with these terms.
*Correspondence: Wenhua Chu, d2hjaHVAc2hvdS5lZHUuY24=
Disclaimer: All claims expressed in this article are solely those of the authors and do not necessarily represent those of their affiliated organizations, or those of the publisher, the editors and the reviewers. Any product that may be evaluated in this article or claim that may be made by its manufacturer is not guaranteed or endorsed by the publisher.
Research integrity at Frontiers
Learn more about the work of our research integrity team to safeguard the quality of each article we publish.