- 1State Key Laboratory of Water Resources Engineering and Management, Wuhan University, Wuhan, China
- 2Department of Mechanical Engineering, Kathmandu University, Dhulikhel, Nepal
Sediment erosion in turbine materials is caused by various flow phenomena. The study of these phenomena can identify suitable measures to minimize their effect on the turbine. Various experimental test rigs have been developed alongside numerical analysis to study erosion and predict wear. In hydraulic turbines, erosion in Francis turbines is mostly seen at the guide vanes and runners, and in Pelton turbines, the needle and the bucket regions are the most vulnerable components. Prediction of wear due to erosion in various parts of the turbine is difficult, as wear depends on the properties of flow, base material, and sediment. Past studies have shown that the test rigs developed to investigate erosion have considered reducing the number of independent parameters to simplify the experiment. Erosion rates and wear patterns are predicted through both quantitative and qualitative methods. This article aims to conduct a systematic review of experimental setups and the results of those studies. This work is expected to be useful in understanding the vulnerable areas of erosion in hydraulic turbines and different mathematical relationships developed to quantify erosion, as well as to know the contemporary understanding in the sector of experimental investigation of sediment erosion.
1 Introduction
Sediment erosion is a continuous process as the unwavering force of water disrupts the shape of rocks, causing the swift-flowing river to carry the sediments along its path. These sediments are a formidable challenge in hydropower plants as they cause abrasive and erosive wear in hydropower components and are very difficult to track, especially the sediment particles with small size and high hardness like quartz and feldspar with Mohr’s hardness at approximately 7 (Kapali et al., 2019). Along with the huge hydropower potential in the Himalayan rivers, sediments are most prominent in these rivers due to the young topography, rugged and steep terrain, and constant weathering (Neopane et al., 2019; Morin et al., 2018). Not only in the Himalayas, but sediment-loaded water flow in rivers is also a major challenge in the Andes, Alps, and the Pacific ranges with extreme flooding due to climate changes resulting in high sediment concentration during the rainy season (Winkler, 2014).
Hydro-abrasive erosion mostly affects high-head Pelton and Francis turbines because these turbines’ components are exposed to extremely high velocity flows as the hydropower plant’s head values increase. In certain cases, a turbine may have significant damage even after one monsoon season. Some hydropower components, such as settling basins, trash racks, desilting basins, and flushing gates, can filter sediments, but these components are usually only designed to filter out sediments larger than 200 µm (Thapa, 2004a). Sediments smaller than 200 µm cannot be removed by filtering. The turbine components get eroded when highly accelerated water flow carrying these sediments strikes the turbine. The materials used in turbines are frequently exposed to sediments that degrade their structure and functionality. As a result, sediment erosion causes efficiency loss over time, vibration, cavitation, and increased maintenance costs (Dahlhaug et al., 2010; Chhetry and Rana, 2015).
Erosion in turbine materials is one form of wear. The rate at which material is lost due to wear is influenced by various aspects such as the shape of the surfaces involved, the way they interact, the characteristics of the materials, the applied force and pressure, the environmental conditions like temperature and humidity, the surrounding atmosphere, the properties of the surfaces, and the relative speeds at which they interact (Thapa, 2004a). Turbine material wear is classified as erosive wear and abrasive wear. Erosive wear is generated due to the impact of small particles at a high angle of attack. Depending upon the material and erodent speed, the erosive wear could be fatigue erosion if the speed is low, plastic deformation if the speed is medium for ductile material, and brittle fracture if the material is brittle. Corrosion in turbine materials also causes damage fatigue in turbine materials. In contrast, as illustrated by Figure 1, abrasive wear results from the impact of big particles at a low angle of attack (Stachowiak and Batchelor, 2006; Burwell, 1957). Supplementary Table S1 shows a brief comparison between the Francis and Pelton turbine with Supplementary Figure S1. S2.
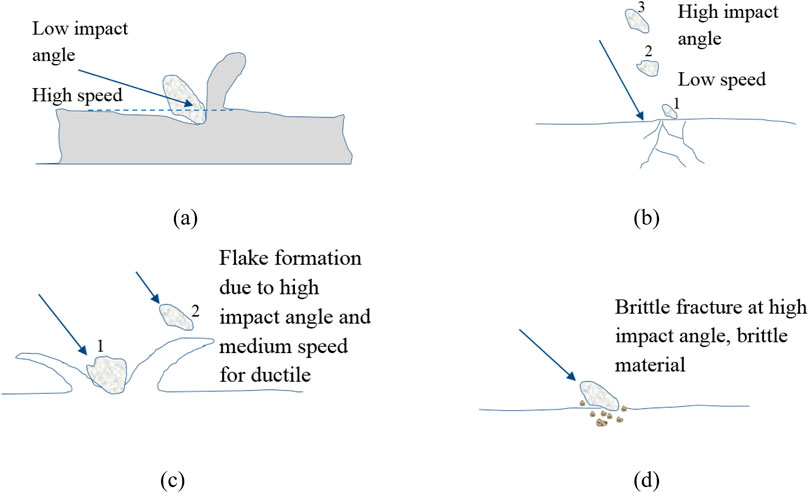
Figure 1. The mechanisms responsible for erosion wear: (A) abrasive wear, (B) erosive wear due to fatigue, (C) erosive wear due to plastic deformation, and (D) erosive wear due to brittle fracture (Stachowiak and Batchelor, 2006).
Francis turbines are the most general hydropower turbine type around the world, with an operation range of low to medium head conditions (Kaunda et al., 2014). A Francis turbine operates with a guide vane controlling the flow going into the runner, which rotates at a certain number of revolutions per unit of time. A Francis turbine is a mixed-flow reaction turbine with the water flowing in the runner radially and exiting axially; the turbine is completely submerged in water (Bansal, 2010). As it is a reaction turbine, the turbine runner rotates due to the pressure energy and partially due to the kinetic energy. The most affected parts of this turbine due to erosion are runner blades, guide vanes, stay vanes, facing plates, and labyrinth seals (Aslam Noon and Kim, 2017). There are four different types of erosion in the guide vanes: turbulence erosion is the erosion at the guide vane (GV) outflow caused by a high fine particle velocity; secondary flow erosion is brought on by the horseshoe vortex formed by secondary flow from the clearing gap; leakage erosion occurs at the clearance gap as a result of the water’s rapid acceleration; and acceleration erosion occurs as a result of the coarse particles as the water rotates in front of the runner (Chitrakar et al., 2016; Chitrakar, 2018). There are three different types of erosion in the runner: turbulence erosion, which occurs when tiny particles exit the runner at high speed; acceleration erosion, which occurs when high acceleration occurs at the blade inlet, wrong stagnation angle erosion and leakage flow vortex filament; and cross-flow erosion, which is erosion resulting from blade tilting-induced cross flow from the hub and shroud (Chitrakar et al., 2019; Chitrakar et al., 2017a). Erosion between the rotating and stationary parts of the labyrinth seal is due to unstable leakage and turbulent flow (Brekke et al., 2002; Chitrakar et al., 2018). Figures 2, 3 show the erosion effects at the Francis turbine runner and guide vane (Chitrakar et al., 2016; Kumar and Saini, 2010; Neopane, 2010).

Figure 2. Runner of Francis turbine: (A) vulnerable zones of sediment erosion and cavitation (Thapa, 2004a; Chitrakar et al., 2016; Kumar and Saini, 2010) and (B) runner inlet of Cahua HP (Neopane, 2010).
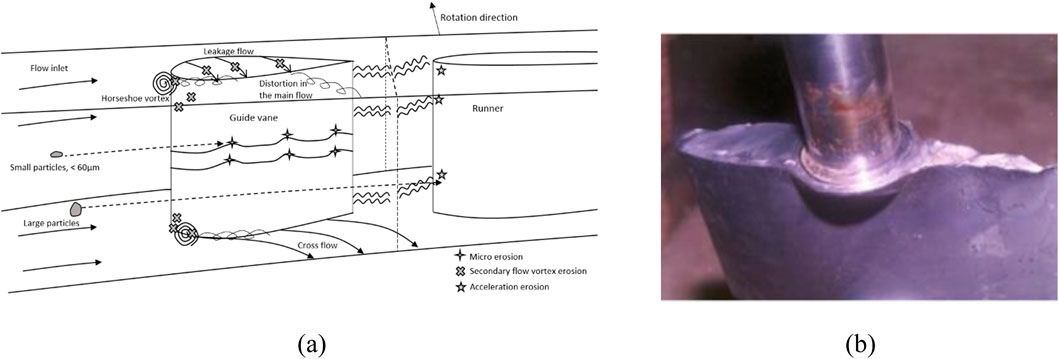
Figure 3. Guide vanes of Francis turbine: (A) erosion phenomena (Chitrakar et al., 2016) and (B) erosion at Jhimruk HP (Thapa, 2004a).
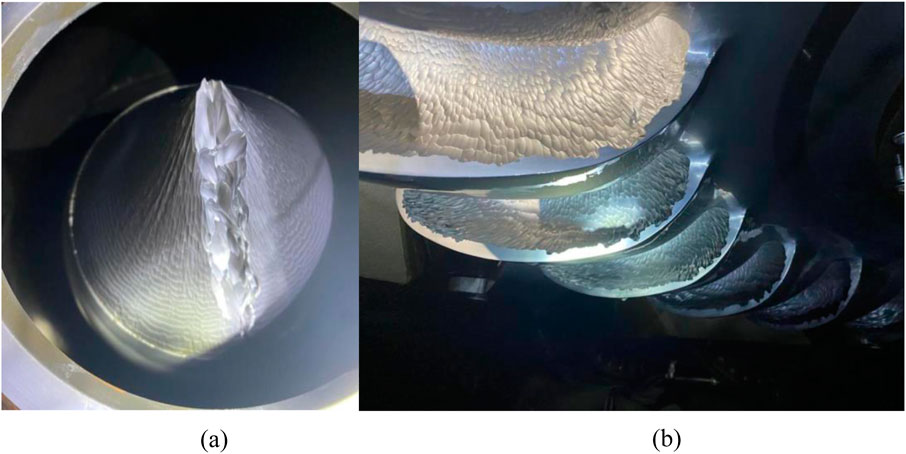
Pelton turbines are impulse-type turbines. Pelton turbines are used in hydropower plants in regions with high-head water resources and low flow rates, which are common in the Himalayas. The Himalayas have very high sediment concentrations with excessive composition of hard minerals, giving rise to severe sediment erosion problems. The main components affected by sediment erosion are the injector system and runner buckets. The main reasons for the accretion of sediment erosion problems in Pelton turbines are accelerated flows, turbulent flows, and vortex formations (Brekke, 2002). The injector system includes a needle, seat rings, and nozzle casing. In real cases, the formation of a needle guide vortex (NGV) downstream of the needle guide with secondary flow phenomena, plus the acceleration in the contraction region, leads to severe hydro-abrasive erosion in the injector system (Guo et al., 2020; Bajracharya et al., 2019). The erosion severity in Pelton turbines also depends on the needle opening and is more susceptible to erosion for low openings (Chongji et al., 2014; Messa et al., 2019). The erosion in buckets is mainly due to the direct contact of waterjet and sediment particles flowing into runner buckets with high velocity. The main regions of runner buckets susceptible to erosion are the cutout regions, the splitter, and the near outlet (Bajracharya et al., 2008; Bajracharya et al., 2020; Guo et al., 2021; Ge et al., 2021). Erosion in runner buckets gets aggravated with very high particle accumulation and separation in sharp curvatures (Guo et al., 2021). The cutout back region gets the first direct impact of the water jet with very high velocity, making it most vulnerable to erosion (Guo et al., 2021). Similarly, as the flow and bucket motion progress, the splitter of the runner buckets divides the jet into two halves toward the curvatures of the bucket to change the direction of flow and extract forces from the water jet. The sediment particles also have a direct impact on the splitter of the runner buckets (Ge et al., 2021; Leguizamón et al., 2019). The larger sediments affect the starting sections of the runner bucket curvature due to easy and early separation from the waterjet flow. Similarly, smaller sediment affects the end sections of the curvature (near-outflow regions) of the runner buckets due to the lower capability of separation from the flow (Guo et al., 2021; Thapa, 2004b). Figure 4 shows the erosion in the injector system and bucket of a Pelton turbine.
The discussion above shows the importance of developing wear and erosion models so that erosion can be predicted. Predicting wear is challenging as the wear depends upon factors such as material properties, sediment properties, attacking angle of sediments, failure mechanisms, etc. Many diverse variables and constants have been used to predict these erosions (Meng ’ and Ludema, 1995). Essentially, the turbine material is exposed to a complex mechanism of friction and wear, which also represents a complex tribological phenomenon. Even though the necessary factors for hydro-abrasive erosion have been determined, the precise point at which these characteristics lead to erosion caused by hydro-abrasion is still unclear.
Corrosion due to water flow significantly impacts the durability and efficiency of hydraulic turbines, especially in harsh or sediment-laden environments. A comprehensive approach that includes optimized material selection, advanced designs, and proactive maintenance is essential to mitigate these effects and ensure long-term operational efficiency (Predescu et al., 2019). Given that the turbine blades in a water turbine are constantly exposed to water and dynamic forces, they need high corrosion resistance and strength. During the load transition, variations in the turbine and other components can create stresses and vibrations, leading to stresses and, ultimately, fatigue cracks occurring due to easy corrosion in such regions (Kumar and Singal, 2015). Corrosion is one of the possible causes of degradation of the runner blade assembly besides cavitation wear, abrasion wear, fatigue, and material defects. The main causes of corrosion and defects in hydraulic metal structures include corrosion, cavitation, and erosion wear (Niu et al., 2020). The other factors rather than defects, wear, and surface heterogeneities responsible for corrosion might be physical factors, such as temperature, pH, and salinity of the environment, and chemical factors, such as high levels of chloride ions or dissolved oxygen (Predescu et al., 2019). The electrochemical contribution of the environment can also act together with the erosion and cavitation phenomenon to enhance the degradation mechanisms.
This review covers the experimental test rigs, empirical relationships, and the qualitative studies conducted on erosion, prioritizing the erosion wear effects in Francis and Pelton turbines. These studies are important because erosion occurs in the runner and guide vanes of the Francis turbine due to their complex geometry and operation under mixed-flow conditions. Pelton turbines, operating with high-velocity water jets, experience erosion on their buckets, especially in high-head applications. Understanding erosion mechanisms in both turbines helps improve efficiency, durability, and maintenance approaches in sediment-rich environments (Zhang and Zhang, 2014; Mirza Umar et al., 2024).
2 Method
For the most part, Francis and Pelton turbines have been used in experimental test rigs set up to study erosion in hydraulic turbines. The research articles related to the experiments conducted in these experimental test rigs were collected in Mendeley Reference Manager to address the following research questions:
• What experimental techniques are applied in test rigs to evaluate erosion in hydraulic turbines?
• How do experimental techniques predict the erosion wear in hydraulic turbines?
• Can experimental test rigs predict erosion similar to that observed in actual turbines?
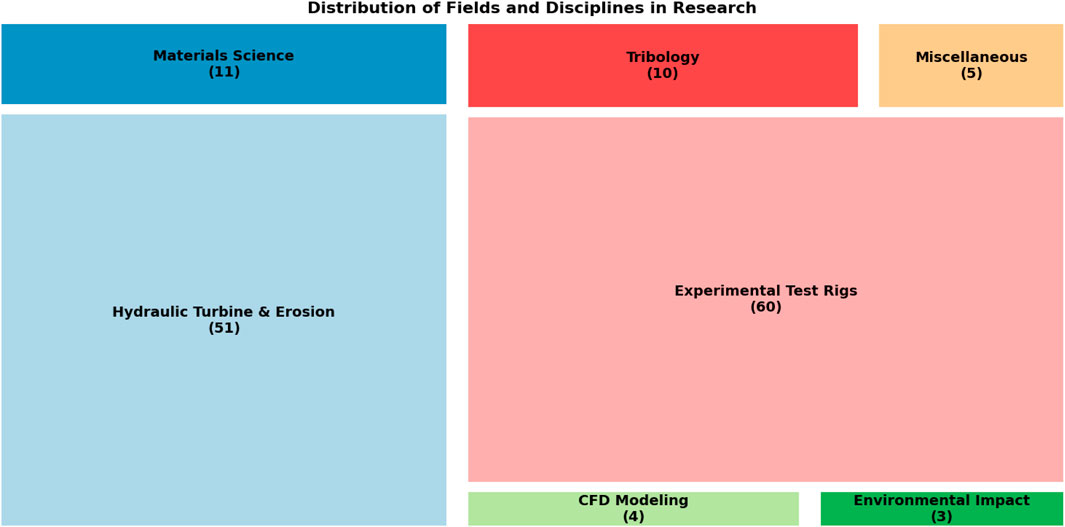
Sediment erosion problems are more prevalent in the hydropower plants developed in rivers in the Himalayas, the Andes, and the Alps. Most of the articles reviewed considered erosion in the hydraulic turbines of these regions. The bubble chart shown in Supplementary Figure S3 illustrates the research included from different regions around the world. Most articles reviewed were from Nepal, followed by India and China. Some of the important erosion models were developed in Japan and Pakistan. The remaining articles were from South American countries like Brazil, Chile, and Colombia, where sediment erosion is prevalent, and from some European countries. Most of the articles included centered around the wear and erosion in the turbine, the materials used in the turbine, and experimental test rigs, which are also illustrated in Figure 5. Some included articles provide information about the Francis and Pelton turbines and hydropower plants in general.
3 Experimental studies
Numerous numerical and experimental studies have been conducted to analyze the sediment erosion in hydro-turbines. These studies have helped develop a mathematical relationship between the sediment erosion parameters and different hydraulic components (Thapa, 2004a; Neopane, 2010; Padhy and Saini, 2009; Bajracharya et al., 2006; Wood, 1999; Thapa et al., 2021a). Numerical analysis, like computational fluid dynamics (CFD), is gaining popularity with recent computational advances. However, those approaches were developed on simplified assumptions about material behavior, fluid flow patterns, or boundary conditions that introduce uncertainties. Experimental investigation gives a real-world representation to provide a more accurate understanding of the erosion process and material degradation understanding, but it could be expensive and difficult to implement. Erosion and wear have a major effect on turbine lifetime and performance. Other high-load, high-friction systems, such as internal combustion engine compressors, have been found to have comparable difficulties. Milojević et al. (2023) looked at aluminum alloys reinforced with cast iron and anti-friction coatings to lower friction and wear in reciprocating air compressors, leading to noticeable durability. Potential remedies, in addition to ceramic coatings for reducing wear in turbine components, may be provided by such material changes and surface treatments. The study of sediment erosion in turbine materials in lab conditions could be categorized into two main categories (Thapa, 2004a; Wood and Wheeler, 1998) based on the working principles which are: (a) a jet erosion type test rig and (b) a rotating disc type test rig. Table 1 shows the division of test rigs in terms of their working principles.

Table 1. Classification of erosion test rigs in terms of their working principle (Thapa, 2004a; Neopane, 2010; Goyal et al., 2012; Thapa et al., 2012b).
3.1 Jet erosion test rigs
A jet erosion test rig is an experimental rig to evaluate the erosion resistance of materials when subjected to sediment and water or air (Karthik and Amarendra, 2019). The major components are the jet nozzle, from where the high-speed water jet is directed to the test sample; a test chamber, where the sample is placed and is subjected to the water jet; and the water supplier, which includes the pumps and pipes to deliver water at a controlled pressure and flow rate. The model also includes a sample holder to hold the sample materials correctly, measuring instruments such as the high-speed camera to observe the erosion process, and a control system to control the test parameters such as the velocity of the jet. Neilson and Gilchrist (1967) studied sediment erosion on a material of aluminum, glass, Perspex, and carbon plates from sediment-laden gas streams. They examined the impacts of particle shape, velocity, and angle of attack through experimental results on various specimen materials with varying physical characteristics. A simple theoretical analysis is provided to correlate the experimental data, allowing the prediction of erosion characteristics at different angles of attack for various materials. This was one of the early experimental setups of a jet erosion test rig for erosion testing. Elkholy (1983) studied the abrasive wear on the materials of slurry pumps, which are aluminum and cast iron, with Brinell hardness values of 121 and 230, respectively. A jet abrasion test facility was developed for the experiment with components such as a test tank, specimen holder, sand entrance, nor bide nozzle, centrifugal pump, pressure gauge, air supply, variable speed motor, weight scale, and sample nozzle. The varying parameters for the experiment were the velocity of the jet, the impingement angle, sediment with different hardness, such as silica sand, sediment particle size, and sediment concentrations. The wear resistance erosion model of cast iron was predicted from the experiment. Wiederhorn and Hockey (1983) conducted erosion analysis on several materials to observe how they eroded, compared the materials in terms of erosion rate at various particle velocities, and developed a general wear rate equation.
Turenne et al. (1989) utilized a jet erosion test rig configuration to study erosion on test materials and discovered that slurry erosion is dependent on the fluid’s characteristics, the erodent’s properties, operation settings, and the properties of the materials to be evaluated. A fixed number of sediments was introduced to a water tank, and the mixture was circulated using an air-powered slurry pump. Thapa et al. (2005) developed a slurry jet erosion test rig in which a container with sediment is located along the main flow line where water is propelled by a centrifugal pump that disturbs the sediments at the container controlled by the valve. The material to be tested is kept at the container. Haugen et al. (1995) studied the erosion damage brought on by sand particles in oil and gas production equipment, notably choke valves. That study emphasizes the significance of maximizing design and using erosion-resistant materials to increase the longevity of these components. The study tested 28 different materials for erosion resistance, including tungsten carbide, coatings, ceramics, and several grades of steel. The findings show that choosing the proper material may boost a component’s lifespan by a factor of over 10. Choke valve design optimization can also result in considerable financial savings.
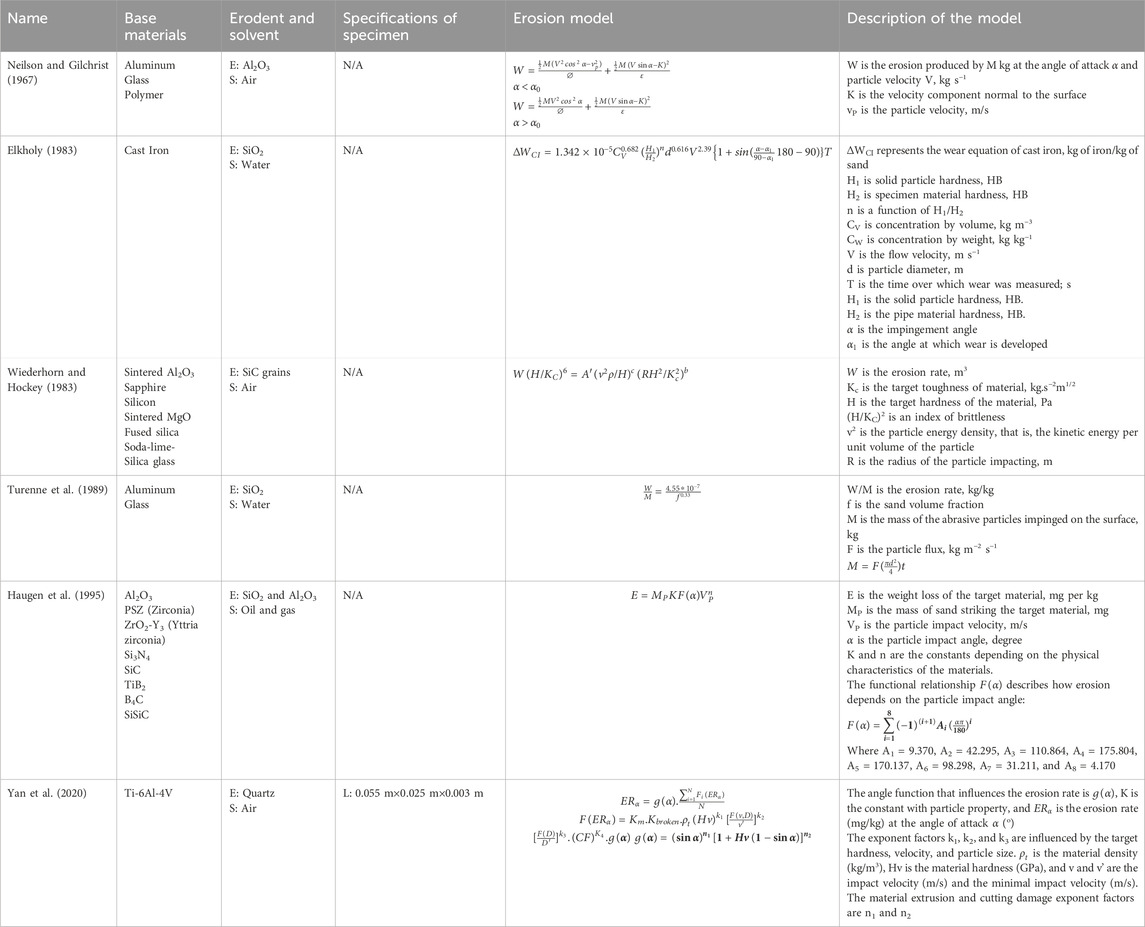
Erosion modeling with computational fluid dynamics is essential to anticipate erosion rates and sites. The research highlighted the importance of material selection and design optimization in lessening erosion damage in offshore oil and gas production equipment. Karthik and Amarendra (2019) developed a slurry erosion test rig based on the concept of a Venturi meter. Sediments are injected into the main flow from the funnel. The test specimen, brass, was subjected to erosion at different impingement angles from 0° to 90°, once with clear water erosion and once with slurry erosion. Because it is a ductile material, brass was found to erode more at the 30° impingement angle in both conditions. The water erosion test was conducted for 10 min, and the slurry erosion test was conducted for 1 min. Scanning electron microscope (SEM) results revealed that the slurry erosion created more microcracks in only a minute at all impingement angles. Yan et al. (2020) developed a model to estimate the rate of erosion of titanium alloy blades in a sediment-laden environment while taking into account the effects of sand fracture, particle size, and velocity. The erosion models obtained from the experiments based on a jet tester are listed in Table 2. The details about the test conditions and turbine material are shown in Supplementary Table S2. Figures 6A, B show the experimental setup of high-speed sand erosion; the components of the test rig are a gas inlet from where the air is injected, a sand feeding device-to inject sand into the test chamber-where the test material for the erosion to be tested is fixed (Yan et al., 2020; Burstein and Sasaki, 2000). Supplementary Tables S4A, B show the jet test rig injector system employed by Zu et al. (1990), Lin et al. (2006), and Santa et al. (2009).
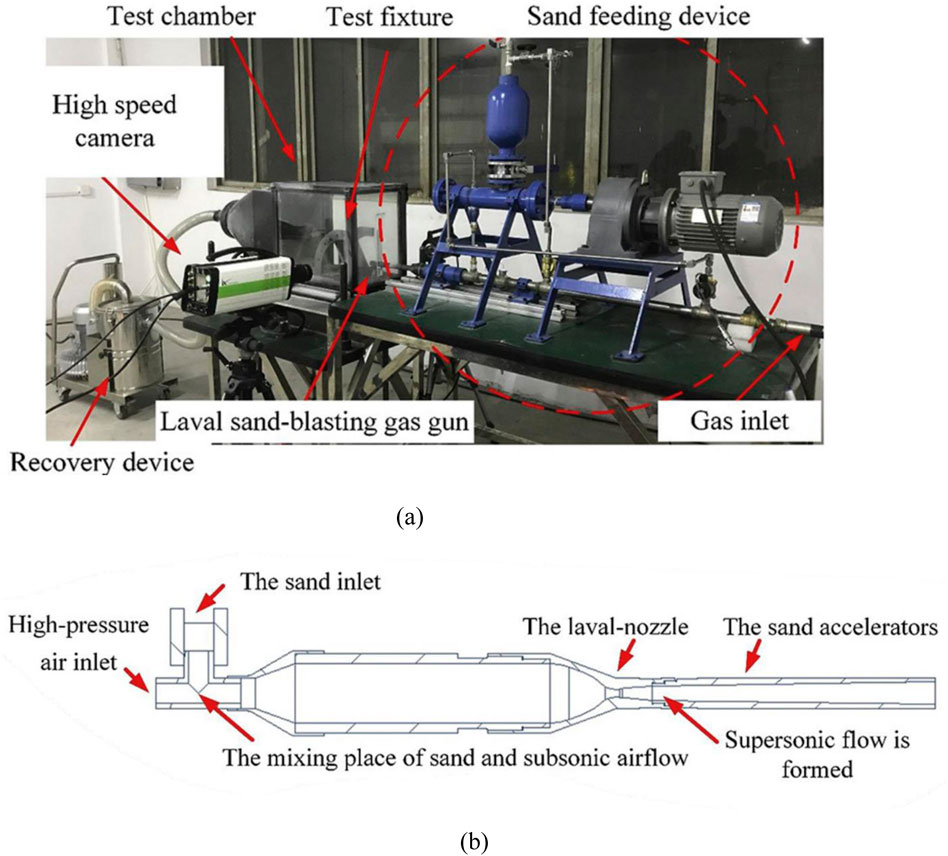
Figure 6. (A) Test equipment for high-speed sand erosion (Yan et al., 2020; Burstein and Sasaki, 2000). (B) Schematic diagram of the blasting nozzle (Yan et al., 2020).
3.2 Pot erosion testers
Another type of erosion test rig used to examine how different materials behave when subjected to varying solid concentrations, impacts, and impact angles is the pot tester (More et al., 2014). As shown in Figure 13, the experimental setup comprises a revolving main shaft with test samples and a slurry pot unit with a pot. The motor is attached at the end of the shaft, which is installed on the lid. Using a specially designed testing setup, Tsai et al. (1981) determined that it was possible to see the faster degradation of three different steel alloys caused by coal and SiC in kerosene. An experiment was conducted to measure erosion rates, and dimensional analysis was used to correlate the results. Empirical constants were determined through regression analysis. The experiments revealed the effects of factors like particle velocity, density, concentration, hardness, temperature, and fluid mechanics on the erosion of materials. De Bree et al. (1982) created one of the first configurations for the pot erosion tester, which consisted of two horizontal discs with four specimens within, spinning in opposing directions on concentric vertical shafts. One such pot tester designed by W.J. Schumacher had three hubs, which could individually support eight specimens on a vertical plane while the specimens were being transported through silt-eroded particles in a stationary slurry (Schumacher, 1987). This type of erosion tester was used to characterize erosion and select appropriate materials.
The impact of solid particles suspended in a fluid on a material surface results in slurry erosion. Slurry erosion test rigs simulate this process by pumping a slurry mixture onto the test material, typically using a slurry jet or a rotating impeller. Control over aspects such as impact velocity, solid particle concentration, and impact angle is possible with the jet impingement slurry erosion test setup. There are two main types of slurry erosion test methods: laboratory simulation testing and pipe wear tests. Although pipeline testing offers settings more akin to those seen in actual practice, simulation testing is still commonly used because of its low cost, ease of setup and operation, and speed of result generation (Zu et al., 1990). Gupta et al. (1995) discussed wear in a slurry pipeline with a particular emphasis on erosion wear brought on by variables such as velocity, concentration, and particle size. Wear on brass and mild steel pipes using a pot tester was noted, and connections to forecast erosion wear were made. For multi-sized slurries, the weighted mean diameter and created formulae to forecast uneven wear were calculated. Utilizing local concentration, particle size, and velocity, the concept helps in pipeline design and optimization by calculating wear in a pipeline. Pot tester data are a tool for determining the best conditions for operation and extending pipeline longevity. However, there is a lack of control over the erosion parameters. Gandhi et al. (1999) examined the erosion wear brought on by solid particle cutting in flows containing solids and liquids. The study focused on parallel flow erosion using a specifically created slurry pot tester. The studies investigated various solid concentrations, particle sizes, and velocities and showed that increasing solid concentration, particle size, and velocity results in increased parallel flow wear. Velocity has a greater impact than solid concentration or particle size. In order to anticipate the wear rate, the research tried to comprehend the details of erosion by creating correlations and improving power law connections.
Patil et al. (2011) conducted a study focusing on the wear caused by erosion of ductile materials in solid–liquid combinations, particularly on aluminum in a sand-water slurry. In the study, erosion wear was examined in relation to factors such as impact angle, particle size, velocity, and solid concentration using a pot tester. Up to a 45° impact angle, the erosion wear grew with the impact but reduced beyond that. At high impact angles, particle size displayed a linear relationship with erosion wear. The severity of the wear was positively influenced by solid concentration, although the effect weakened as concentration increased and velocity had a substantial impact on eroding wear (Naidu, 1997a). Based on the investigated factors, a correlation with a 16% error margin was created to predict erosion wear. More et al. (2014) developed a pot tester to mimic the erosion wear caused by mixtures of solid and liquid. The setup consisted of a revolving propeller and a shaft from the top with a test specimen attached that was connected to a motor to spin at different speeds from the bottom. The study concerned how AISI SS304L ductile material behaved with respect to erosion under various environmental factors. The impact angle, concentration, velocity, and impacts of particle size on wear may all be measured with the pot tester’s design. In order to comprehend erosion mechanisms, eroded surfaces were subjected to SEM investigation. The results exhibit strong agreement with experimental data, allowing for a more accurate wear assessment of industrial components.
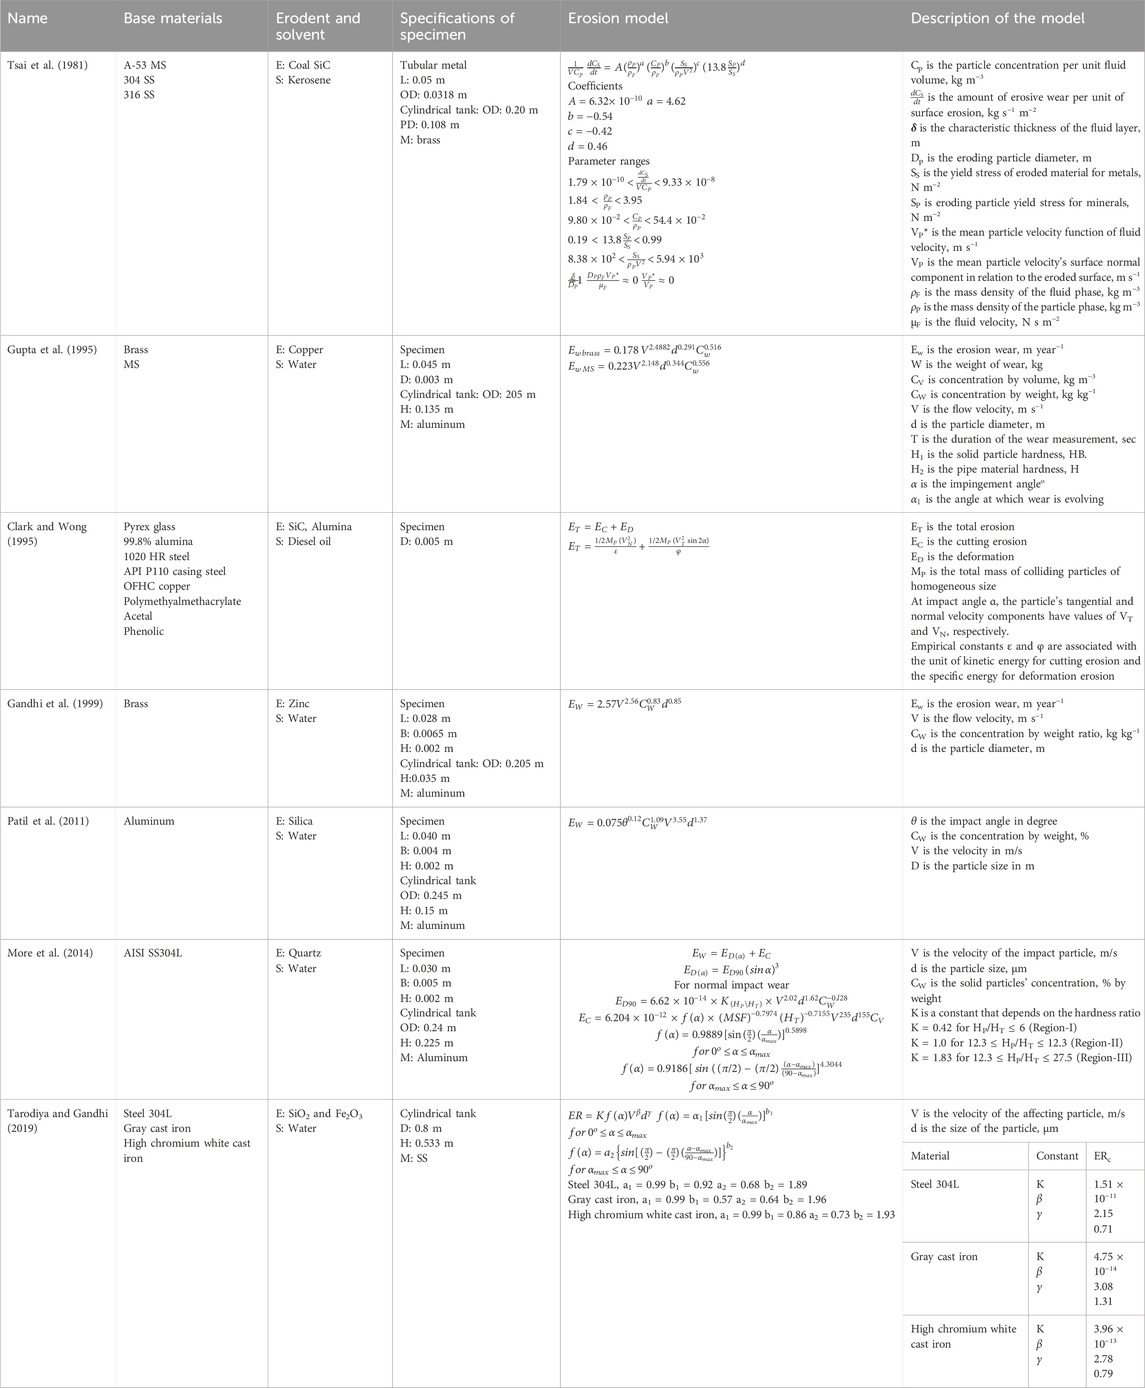
Tarodiya and Gandhi (2019) studied how the erosion rates of various materials, namely, steel 304L, gray cast iron, and high chromium white cast iron, vary in slurry conveyance systems reacting to slurry erosion using a pot tester. The effects of impact angle, particle size, and velocity on erosion were investigated. According to power law correlations, erosion rates were observed to rise with particle size and velocity. However, the erosional process remained constant with varying velocity. Correlations were made to estimate erosion rates with a maximum inaccuracy of 15%. Among the materials, white cast iron with a high chromium content demonstrated higher erosion resistance. Some of the erosion models from the study are shown in Table 3. Figure 7A, B shows the experimental setup of the pot tester, which consists of components such as rotating arms to hold the sample and rotate inside a pot that contains slurries.
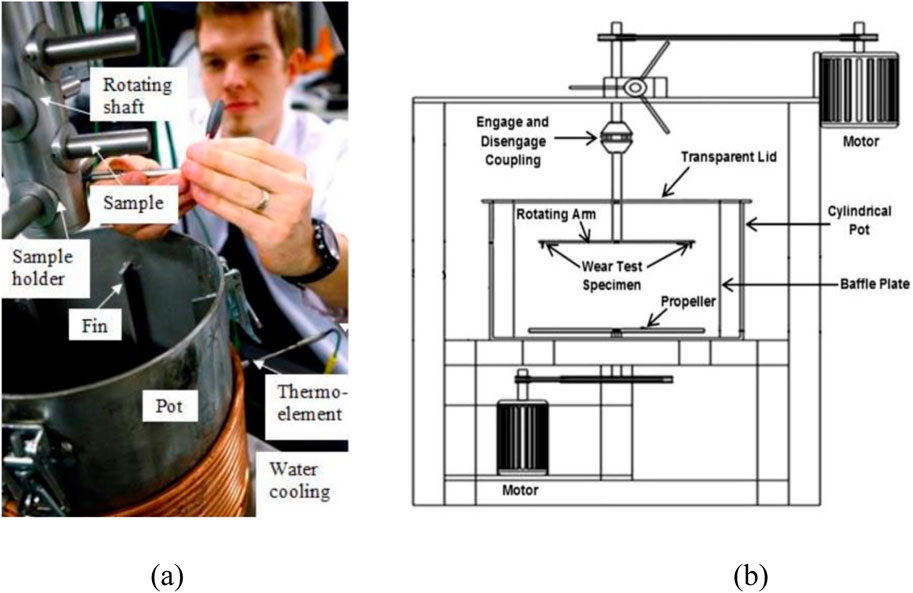
Figure 7. (A) Pin mill slurry-pot tester (Ojala et al., 2015). (B) Schematic diagram of slurry-pot tester (Sharma and Gandhi, 2020).
3.3 Rotating disc apparatus
The rotating disc apparatus (RDA) primarily consists of a rotating disc and an electrical motor to rotate the disk (Rashed et al., 2016). A revolving disc or arm is immersed in a solution of water and sediment. Thapa et al. (2007) used an RDA to investigate the combined effects of cavitation and erosion in turbine materials. The use of an RDA for erosion and cavitation analyses is discussed separately in the following sections.
3.3.1 Rotating disc apparatus: erosion setup
Rajkarnikar et al. (2013) designed a setup to carry out erosion tests on Francis turbine runner blades of aluminum as base material using the hydraulic parameters of the Jhimruk Hydropower Plant of Nepal. The motor speed used for the experiment was 1,440 rpm, which gave a velocity of 15 m/s at the blade’s inlet. The casing of the RDA was filled with sand and water. Two painted blades were mounted on the disc, and the setup was operated for about 30 min. According to Brekke (2002), the rotational motion of the fine sand particles may have caused micro erosion, which could be the cause of the erosion in the outlet region. Similar to this, obstructions in the flow course cause secondary flow vortex erosion, which is the cause of the erosion at the inlet edge (Brekke, 2002). After running the experiment for 350 min, the weight loss in the specimen and the rate of erosion were calculated, concluding that the effects of sediment erosion with different materials and coating could be compared with the RDA setup. Shrestha et al. (2021) studied the amount of erosion and erosion rate in the cross-flow turbine blade materials of SUS304, SUS440C, SUS630, SCM440, and STD11, using an RDA. SUS304 had the highest cumulative erosion, while STD11 had the lowest. Tungsten carbide coatings improved erosion resistance for SUS304 and SUS440C but increased erosion in coated WC-STD11. Erosion rates were highest in SUS304 and lowest in STD11, generally increasing linearly with time. Flow pattern analysis showed similar velocity patterns in CFT and RDA, with differences in flow separation and vortex formation due to blade number and rotation mechanisms. A study by Aryal et al. (2022) compared the erosion patterns in a guide vane using CFD and the patterns of erosion using the RDA. The experiment in the RDA was done using a mild steel specimen in a controlled environment. The study showed that the flow region around the guide vanes in the RDA closely matches that of actual turbines and with similar stagnation points and pressure distributions. The erosion patterns observed in the RDA aligned with the CFD simulation results, particularly in high-velocity regions and areas prone to vortex formations. Acharya et al. (2022) conducted an experiment in an RDA to validate the erosion induced by the sediments in the sidewall gaps of the Francis turbine predicted by the CFD method. The experimental setup aimed to imitate the conditions defined in the numerical model. The disc rotated at 750 RPM, which is the same as the reference turbine’s speed. The sediment used in the experiments had a concentration of around 50,000 parts per million (ppm), with particles having an average shape factor of 0.68 and a diameter of less than 150 µm. Two areas of erosion were seen in the experiment: the first was at the farthest end from the center of rotation, where the greatest erosion was caused by flow recirculation and centrifugal forces. The second region is less than a 90-degree angle to the slot length, where erosion was influenced by both radial and circumferential velocity components acting on the sediment particles. Figure 8A shows the RDA experimental rig, which consists of a disc where the test sample is mounted that rotates from the torque generated by the motor. Openings include the water-in, where water enters the apparatus, and the water-out, where the water exits the setup. The sand-in opening is for adding the sand to the apparatus. Figures 8B, C show the erosion pattern observed from the experiment in the RDA and from the CFD done in ANSYS CFX v18.1 using an ICEM mesh.
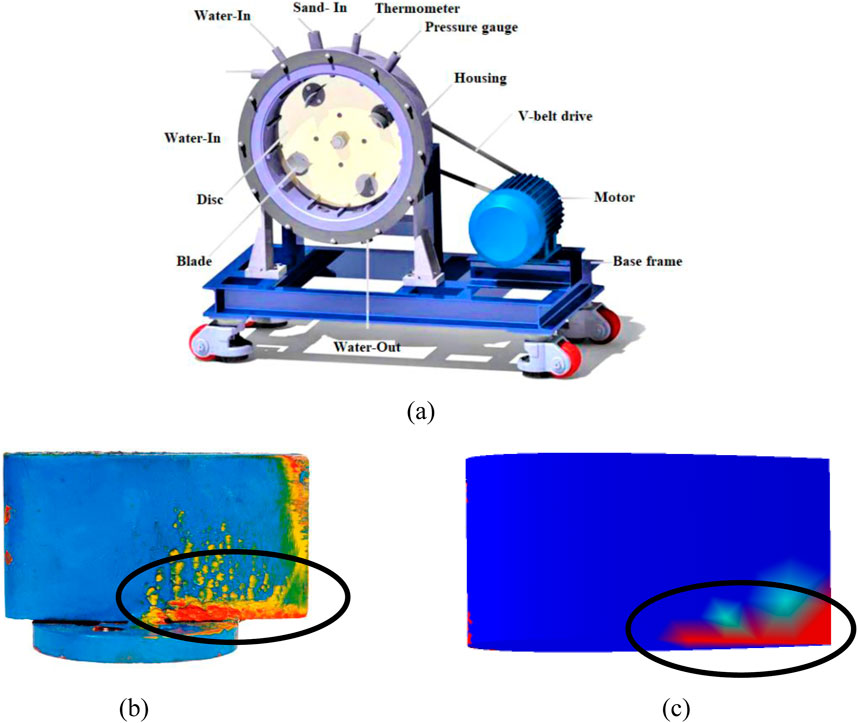
Figure 8. (A) Rotating disc apparatus (RDA) (Shrestha et al., 2021). (B, C) Comparison of the erosion patterns in the RDA and CFD experiments (Aryal et al., 2022).
3.3.2 Rotating disc apparatus: cavitation setup
Shima et al. (1992) examined stainless steel’s resilience to cavitation damage in an RDA throughout a large peripheral speed range of 65–77 m/s. Using a through-hole as the cavitation inducer, the cavitation number in the research was utilized to estimate the location and extent of damage on the specimen. The erosion was observed in the regions where cavitation clouds collapsed, and higher peripheral velocities resulted in a decrease in the cavitation number at which maximum erosion occurred. According to the study, higher peripheral speeds also tend to result in an increase in the velocity exponent, which shows how much velocity affects erosion. A fixed static pressure resulted in a greater velocity exponent when compared to findings obtained with a fixed cavitation number. Under different test settings, a power law relationship between the cumulative weight loss and the weight loss rate was discovered during the erosion acceleration period, offering insights into the erosion process itself (Zhang et al., 1996). Bazanini et al. (2008) conducted an experiment to observe the cavitation pattern and quantify the mass loss due to the cavitation in an RDA. The setup consisted of a rotating metallic disk with cavity inducers, such as holes, to evaluate the effects of cavitation erosion on metal specimens. The system used a disk and chamber made of stainless steel, an intermediary device for a more compact design, and a frequency inverter for motor control in order to replicate erosion conditions with various periphery velocities for various disk positions. The test was done on cast iron, aluminum, and brass at 4,400 rpm with flow velocities of 36.7 m/s for cast iron and 47.9 m/s for aluminum and brass. The mass loss in the materials was compared to previous studies done by Veerabhadra Rao et al. (1980), Vivekananda (1983), and Zhiye (1983). The mass loss of brass was comparable to the previous studies. However, the mass loss of aluminum and cast iron was very low and was assumed to be due to the oxidation of these materials. Figure 9A, B shows the rotating disk specimens with bubble inducers as pins and through holes to induce cavitation.
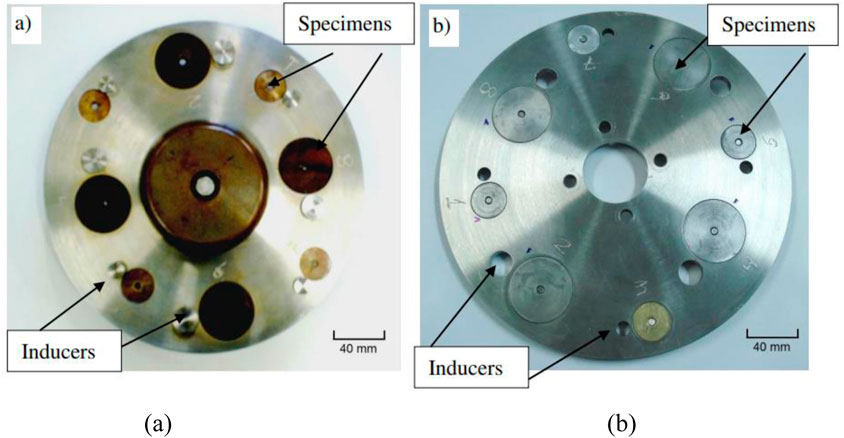
Figure 9. Rotating disk specimens with bubble inducers (A) pins and (B) through holes (Divo Bressan et al., 2014).
3.4 Guide vane cascade rigs
Guide vanes in a Francis turbine are airfoil-shaped vanes used for flow regulation. These components are one of the most severely affected parts in the Francis turbine due to sediment erosion. The guide vane cascade rig consists of a series of guide vanes arranged in a controlled manner to simulate the flow conditions experienced in the actual turbomachinery. The rig allows researchers to investigate the aerodynamic properties of the guide vanes, including their lift, drag, pressure distribution, and flow swirling capabilities. The working principle of a cascade rig involves the passage of fluid through the cascade of guide vanes that are carefully positioned and aligned to mimic the flow patterns encountered in the Francis turbine. Sensors and measurement devices are placed strategically within the rig to collect data on various parameters such as velocity, pressure, and temperature (Chitrakar et al., 2016; Thapa et al., 2017).
The cascade rig experiments are used to validate CFD models, optimize the design of guide vanes, and understand the fundamental flow phenomena like the leakage flow effect occurring in Francis turbines. Thapa et al. (2016) proposed two alternative designs and optimization for the three-guide vane cascade rig and one-guide vane cascade rig that could replicate the velocity distribution of the turbine of the Jhimruk Hydropower Plant. The study used both analytical and CFD methods along with experimental validations to design and optimize the cascade rig. Supplementary Figure S5 shows the reference turbine layout and the section considered for the three-guide vane cascade from the five chosen guide vanes.
Five guide vanes with four flow channels were taken into consideration for the construction of the reference case guide vane cascade rig, with two outer GVs forming the cascade walls. The walls defined by the free vortex flow profile are taken from the spiral casing center to direct the vane input. Instead of using a circular section, the cascade was created using flat plates of the same height. The skewness in the velocity distribution and the optimized design raised the curvature for the inner walls and decreased it for the outside walls to lessen skewness. The velocity distribution across the reference design and optimized cascade rig is shown in Supplementary Figure S5B. The experimental setup of the cascade rig setup to study the particle image velocimetry (PIV) is shown in Figure 10. Chitrakar (2018) considered the three-guide vane cascade rig to test in various GV angles, which could cover 60° of the full guide vanes of the Jhimruk Hydropower Plant. From the experiments in the three-guide vane cascade rig setup, Koirala et al. (2019) found that the erosion at the GV increases the pressure at the GV outlet. The most vulnerable region of the GV was found to be the leading edge, along with the trailing edge and clearance gap.
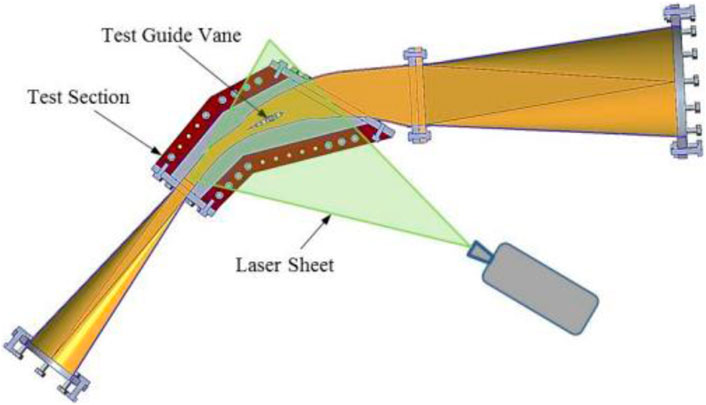
Figure 10. One GV cascade rig test setup (Thapa et al., 2016).
3.4.1 Particle image velocimetry (PIV)
Particle image velocimetry (PIV) is a technique used to visualize the velocity of fluid particles by capturing the movement of “seed” particles like silica, which are introduced into the flow (Grant, 1997). These particles are chosen for their ability to scatter light efficiently and their near-neutral buoyancy, and they are tracked using multiple-exposure photography. The recorded positions of these particles at different times help to analyze the fluid’s velocity (Adrian and Westerweel, 2011). This method is used to characterize the flow after the erosion.
Thapa et al. (2016) used PIV to visualize the velocity distribution in the guide vane cascade rig. Based on the optimized one-guide vane cascade rig, the experimental test rig setup was made for PIV measurements. The flow field at the clearance gap and the mid-span of the GV is shown in Figure 11A, B. The flow field was found to be similar to CFD done in ANSYS CFX v15.0, and the grid was done using the ICEM O-grid method. The pressure values and the velocity around the GV surfaces are shown in Figure 11C, D. At some points, the PIV velocity measurements could be seen as less stable than the analytical velocity, which could be due to the measurements being conducted at low velocity. Chitrakar et al. (2017b) carried out an experiment using PIV at different NACA profiles to study leakage flow through Clearance gap (CG). NACA4412 showed the least pressure difference compared to the profiles of NACA2412 and NACA0012, due to the leakage flow, although the clearance gap was observed to be less.
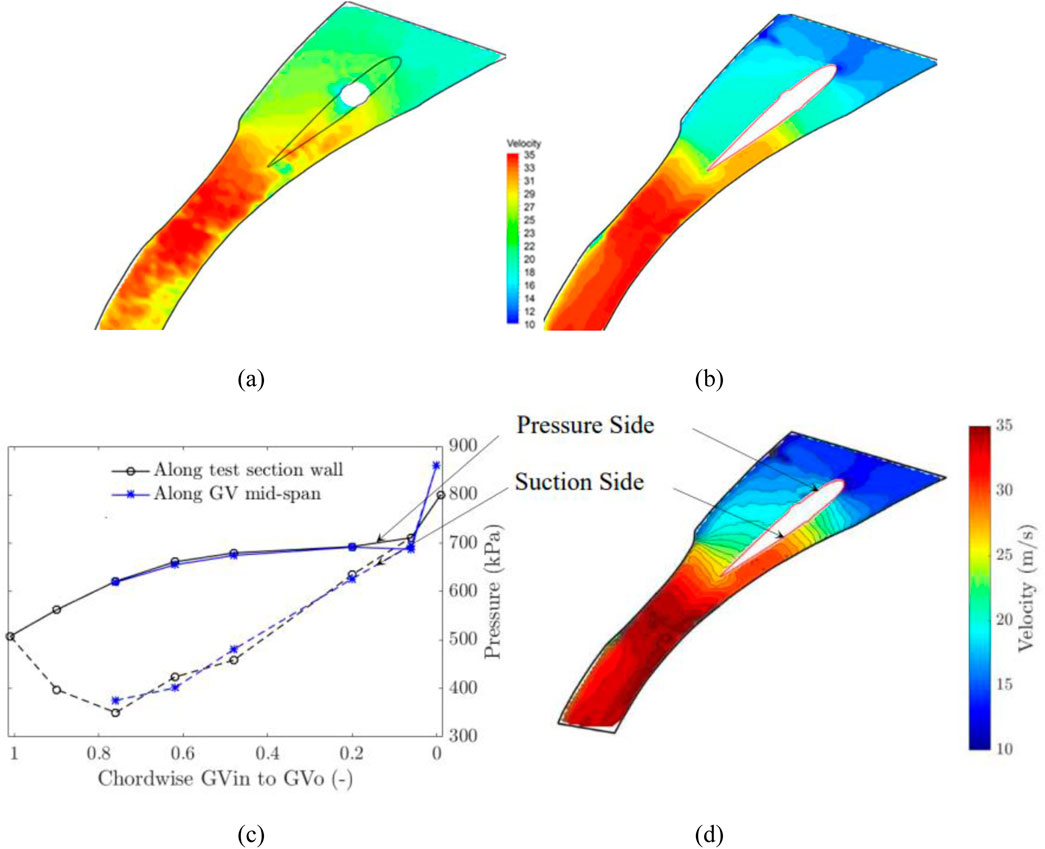
Figure 11. Velocity field: (A) Leakage flow at CG, (B) Mid-span of a GV cascade rig (Chitrakar et al., 2017a), (C) Pressure values at GV surfaces, and (D) Velocity field around GVs (Singh Thapa, 2016; Thapa et al., 2018).
Similar to the three-guide vane cascade rig, a one-guide vane cascade rig (Thapa, 2016) could also produce a constant velocity profile at the runner inlet similar to that of the Francis turbine. The velocity and distribution for the one-guide vane cascade rig showed the pressure difference in a symmetric NACA profile. Another study by Chitrakar et al. (2017a) compared the leakage flow in guide vanes with different hydro profiles using PIV and found that the leakage flow in the NACA4412 profile was 1.31% less than the reference GV used of NACA0012, which causes leakage flow erosion in a Francis turbine.
4.5 Francis turbine test rigs
A Francis turbine test rig is an experimental setup to evaluate the performance of the Francis turbine at many operating conditions. A model of a Francis turbine of a certain hydropower plant is used as an experimental test setup. An investigation of the erosion in the Francis turbine runner and guide vane was done with an RDA because the results of the erosion were very comparable to the numerical simulation and real case. However, the Francis turbine test rig has conditions similar to the real case of a turbine. Quantitative erosion testing on turbine blades can now be performed using a non-recirculating type of sediment erosion test setup (Kapali, 2021). The components of the test rig are divided into hydro-rig components: main pump, pressure tank, sediment injector, test rig, and hydro-cyclone separator and measuring components, which include a pressure gauge, pressure transducers, electromagnetic flow meter, VFD, and pressure relief valve, as shown in Figure 12. After developing the test rig, the study also evaluated the erosion patterns and rates on the aluminum test blades of the runner by accelerating sediment concentration. The erosion rate was also calculated as the quantity of erosion per unit time of operation as in the Rajkumar model (Rajkarnikar et al., 2013). The average erosion rate was 0.174 mg/gm/hr. The erosion rate prediction seemed to be better than the predicted by the RDA, as the RDA does not consider changes in sediment particle properties after hitting the sample (Noon and Kim, 2021). An experimental study was done to study the performance of the pico-hydraulic Francis turbine using the setup (Kayastha et al., 2020). The study examined the effects of sediments on turbine efficiency. Hydro-cyclone separators reduced the sediments going into the turbine. However, they also cause discharge loss at higher heads.

Figure 12. Erosion experimental setup at Turbine Testing Lab, Kathmandu University (Kapali, 2021).
A study by Poudel et al. (2024) investigated the impact of sediment-laden flow on the performance of Francis turbines. The experiments revealed that sediment presence caused efficiency curves to shift, requiring higher discharge for the same efficiency. While the maximum efficiency remained stable at smaller GV openings, it decreased by approximately 1.1% at larger GV openings. The sediment did not significantly affect the head but slightly reduced output power. These findings signified the importance of sediment management in maintaining the efficiency and durability of Francis turbines, particularly in sediment-rich regions like the Himalayas. The experimental setup used for the study is shown in Figure 13.
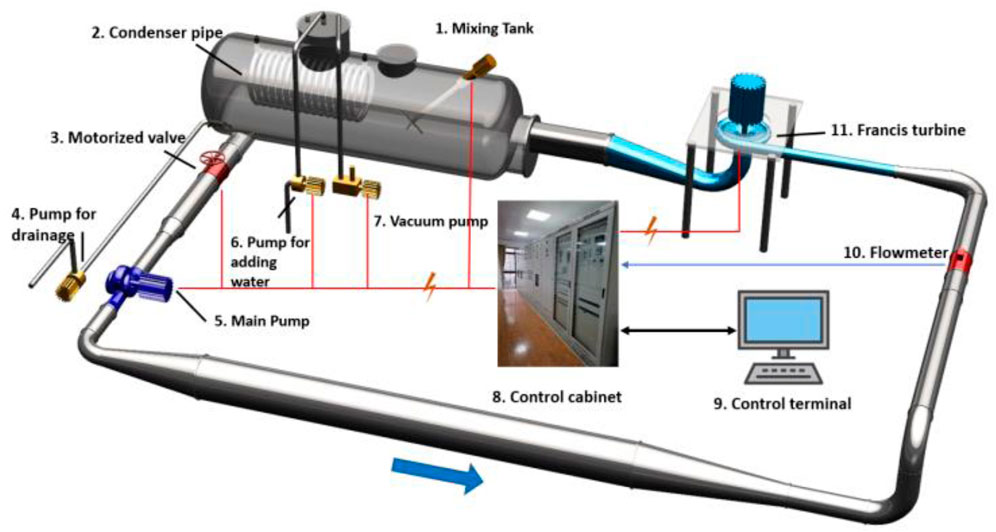
Figure 13. Schematic experimental setup at Hydropower Research Centre for Himalayan Region, Wuhan University (Poudel et al., 2024).
3.6 High-velocity test rigs
High-velocity test rigs were developed for testing specimens with varying curvature geometry to replicate the flow hitting a Pelton turbine bucket (Guo et al., 2020). The specimen material was aluminum with varying curvatures. Artificial silica sand (coarse sand) with a size of 256 mm and Baskarp-15 foundry sand (66% free quartz, fine sand) with a size of 174 mm were the erosive particles used. The findings of the study were presented by analyzing the erosion rate for curved specimens. Based on the visual analysis of the degraded particles, it was concluded that the bulk of the coarse grains felt closer to the splitter, while the fine grains were seen to fall farther from it. Moreover, a decrease in the erosion rate was noted for finer particles, as shown by the weight loss per hitting particle. This was ascribed to the smaller particles’ reduced impact energy as well as the potential that some of the finer particles were able to glide without coming into contact with the surface. Another noteworthy observation was that the erosion rate, expressed in milligrams per kilogram, increased as the curved radius of the specimens increased (Ge et al., 2023). Figure 14 depicts the schematic diagram of the high-speed test rig.
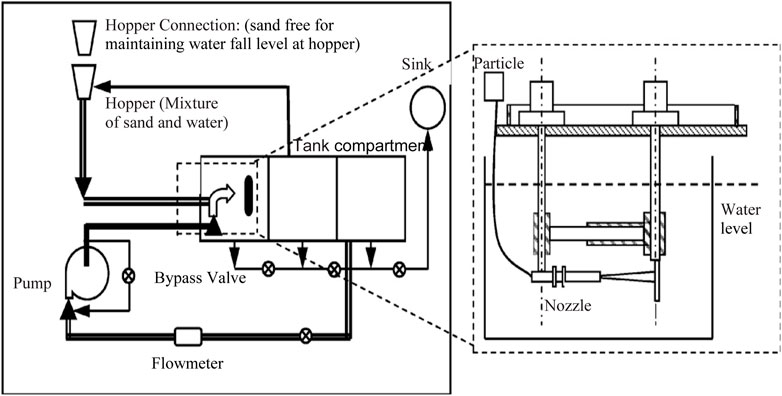
Figure 14. Experimental arrangement of high-speed test rig (Thapa, 2004a).
The Pelton turbine performance and erosion test equipment was designed to monitor Pelton turbine system performance in real-world hydropower plant scenarios. The test equipment may measure the turbine’s sand erosion rate in addition to its performance. The three primary categories of test rig components are hydro-rig components, electrical components, and measuring and controlling devices. Supplementary Figure S6 shows the Pelton turbine erosion test facility. The hydro-rig components include a reservoir tank, pump, surge tank, penstock pipe and feeding unit, turbine, drive system, tail race, and settling basin. The electrical components include an induction generator controller (IGC). The measuring and controlling devices include two pressure gauges (liquid-filled and vacuum), a rotary torque transducer, and an ultrasonic flowmeter (UFM) (Thapa, 2004a). The efficiency loss was correlated with the change in splitter thickness after erosion. The correlation showed that there was a 1% loss in efficiency with a 1-mm change in splitter width. The efficiency of the turbine was also correlated with respect to mass loss only using concentration and operating hours (Bajracharya et al., 2007a).
The effects of various factors on erosion under actual conditions have been investigated experimentally. Brass was used to create erosion quickly in the turbine buckets. Three sides of the tank were encircled by a cooling water jacket to keep the water temperature steady. Correlations between the size and concentration of silt particles and jet velocity, two important parameters, and the wear rate of Pelton turbine buckets have been established based on experiments collected for various parameters (Ge et al., 2023; Bajracharya et al., 2007). Figure 15 shows the schematic diagram of the Pelton turbine hydro-abrasive test facility.
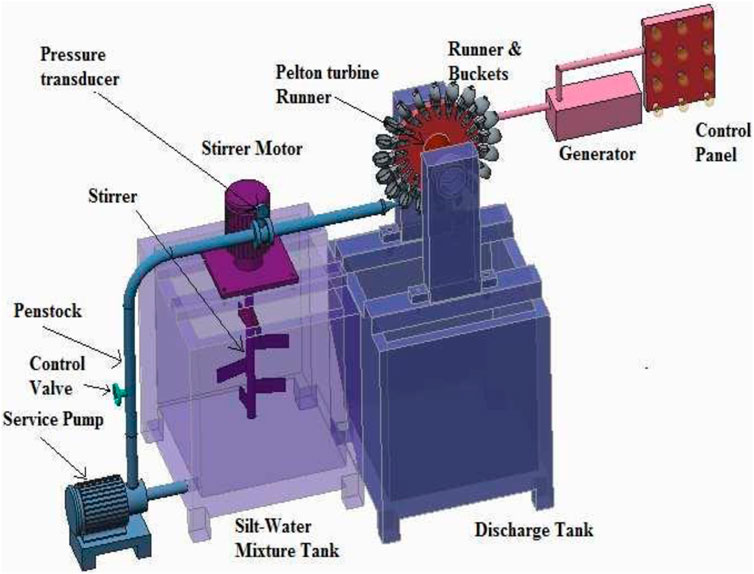
Figure 15. Schematic diagram of the Pelton turbine hydro-abrasive test setup (Thakur et al., 2017a).
A consistent rise in the rate of erosive wear with time is indicated by normalized wear, which is defined as weight loss/initial bucket weight and increases approximately linearly with running time. This wear rate fluctuates greatly when comparing different particle sizes and concentrations, yet it stays constant for a given concentration and particle size. The erosive wear rate also increases with higher concentrations, although the rate is not consistent across different size ranges. The normalized erosive wear shows a rising trend as the particle size increases, especially at higher concentrations, especially at 10,000 ppm. This pattern is also shown when comparing the mean particle size (D50) for different concentrations. This finding aligns well with previous studies in the field. Investigating normalized wear per unit discharge versus jet velocity for a fixed size and concentration reveals that the erosive wear rate follows a power law relationship with respect to jet velocity, expressed as
A consistent rise in the rate of erosive wear with time is indicated by normalized wear, which is defined as weight loss/initial bucket weight and increases approximately linearly with running time. This wear rate fluctuates greatly when comparing different particle sizes and concentrations, yet it stays constant for a given concentration and particle size. The erosive wear rate also increases with higher concentrations, although the rate is not consistent across different size ranges. The normalized erosive wear shows a rising trend as the particle size increases, especially at higher concentrations, especially at 10,000 ppm. This pattern is also shown when comparing the mean particle size (D50) for different concentrations. This finding aligns well with previous studies in the field. Investigating normalized wear per unit discharge versus jet velocity for a fixed size and concentration reveals that the erosive wear rate follows a power law relationship with respect to jet velocity, expressed as
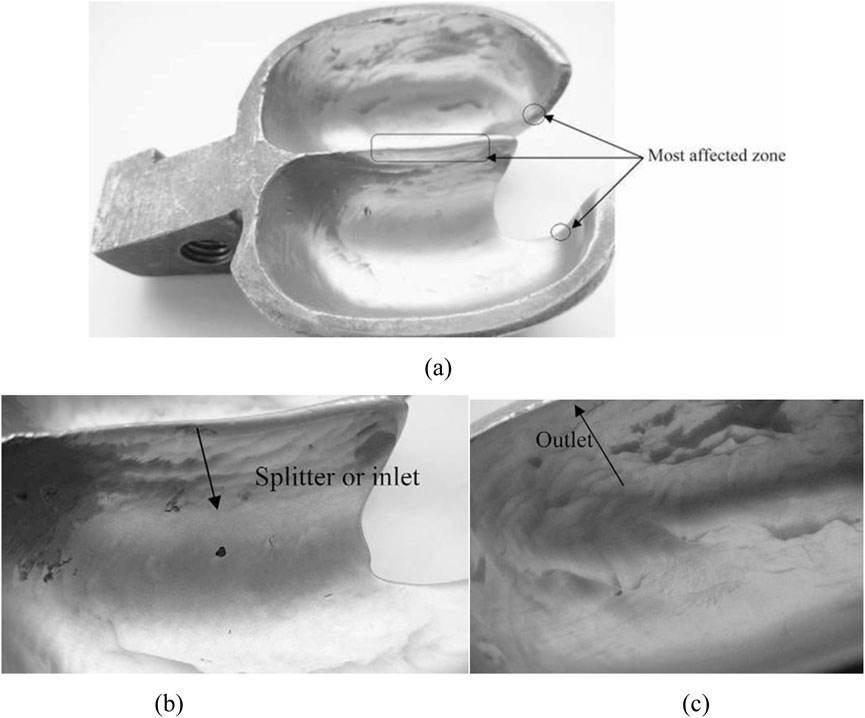
Figure 16. (A) Pelton bucket surface after experiments, (B) magnified view of a splitter, and (C) Pelton turbine bucket’s outlet edge showing the flow direction (Padhy and Saini, 2009).
Padhy and Saini (2012) studied the impact of Pelton bucket mass loss on turbine output and efficiency. The operating parameters (flow velocity, operating time) and sediment parameters (silt size and concentration) were studied to develop the correlation with efficiency loss using the experimental data. The bucket shape alteration was also responsible for further efficiency loss. The efficiency loss trend shows the initial high rate of efficiency loss with a slowly decreasing trend that became asymptotic over a prolonged period of turbine operation. The study also explored the impact of sediment shape and size on turbine erosion, utilizing experimental and computational analyses. Utilizing fast Fourier transform (FFT), the research identifies particle shapes and numbers that will further help quantify their impact on turbine materials. Digital image processing and regression analysis were used to characterize their effects. Results showed that irregularly shaped particles of smaller size caused higher erosion rates than larger ones of the same shape. The study reveals a gradient of erosion capacity of sediment from upstream to downstream locations, with higher erosion in the higher altitudes and lower erosion in the lower altitudes. The study also noted that abundantly available shapes of sediment have a greater impact. Elongated particles are profuse in rivers and have the highest effect on erosion among all other particle shapes (Poudel et al., 2012). Two main erosion mechanisms are dominant in the erosion of a Pelton turbine: cutting/abrasive and surface fatigue/erosive wear. The cutting erosion mechanism is dominant for the outlet and splitter vicinity regions. The surface fatigue and plastic deformation erosion mechanism is dominant for the splitter. The erosive wear mechanism is dominant for bucket depth regions (Padhy and Saini, 2012). The bucket depth is the most eroded region. Abgottspon et al. (2013) performed a wear study on the Pelton turbine bucket, splitter, and cutout regions before and after the increment of suspended sediment concentrations during peak seasons. The study showed the importance of accurate measurement and monitoring of two main sediment parameters, suspended sediment concentration and particle size distribution, to understand how progressive erosion degrades turbine efficiency. The results will be significant for the design, operation, and maintenance optimizations of the reference hydropower. The study performed suspended sediment monitoring (SSM) using different types of monitoring devices that are based on different operating physical principles. The devices are turbidimeters (in-line and submerged), acoustic discharge measurement (ADM), and a laser diffractometer. The turbidimeters had a problem with signal drift due to particles blocking optics. Turbidimeters with self-cleaning systems or optics that are not in contact with sediment-laden flow (free-falling jet type) are suggested. Laser diffractometers measure both suspended sediment concentration and particle size distribution, and for the flows with variable particle sizes, laser diffractometers measure suspended sediment concentrations more accurately than turbidimeters and ADM devices because these devices are based on particle size-dependent calibration.
3.7 Special test rigs
3.7.1 Integrated test rig
An erosion test system for hydraulic machinery (ETS-HM) was developed by Lu et al. (2014) that was capable of performing an erosion study incorporating the synergetic effect of cavitation and sand erosion. The test system comprises three different test modes, as shown in Supplementary Table S3. The venturi-section water tunnel rig and rotating disk test can measure both the cavitation and sand erosion, whereas the rotating disk with nozzle injector is only capable of measuring the sand abrasion, that is, without cavitation. The test system used programming logic control (PLC) to automatically control the pumps, valves, and sensors. The test system is also composed of high-technology measurements and instrument tools. The eroded sample’s weight loss was evaluated using a high-precision analytical electronic balance, and the eroded volume was calculated by integrating the erosion depth and using a 3D auto surface profiler to produce the eroded surface’s shape. The test system provided insights into the estimation of cavitation and sediment erosion in a Francis turbine. The schematic diagram of the integrated coalesced test facility for ETS-HM is shown in Figure 17. Another integrated test rig used for validating the sand erosion models consists of a specialized pipeline setup equipped with an elbow section where multiphase flow can be simulated. It includes mechanisms for controlling and varying flow rates, pressure, and sand concentration. The rig is instrumented with sensors to measure erosion rates and particle velocities, allowing for accurate data collection and analysis (Kang and Liu, 2020).
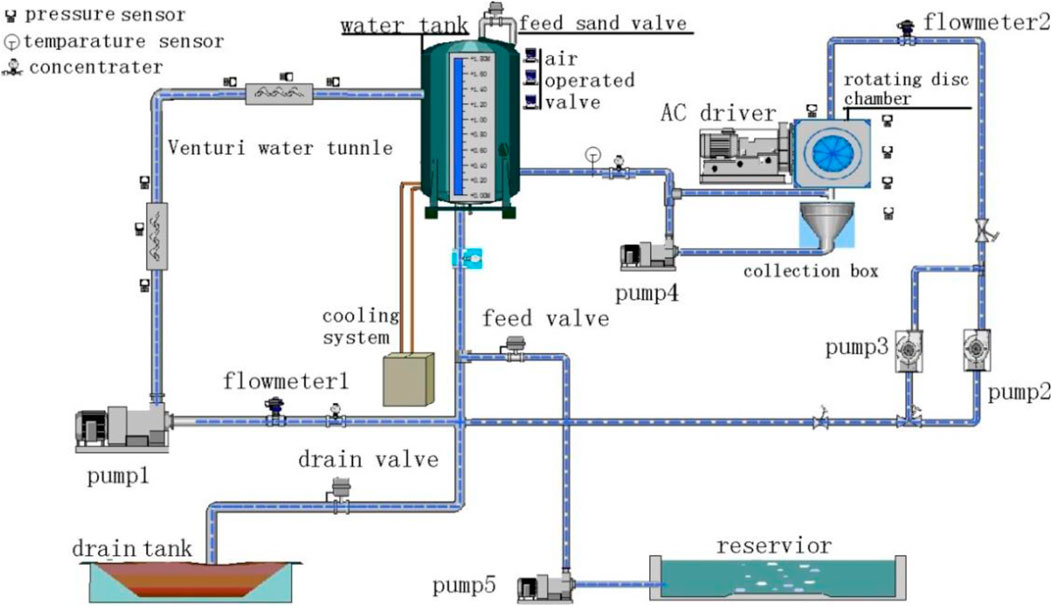
Figure 17. Arrangement of an integrated coalesced test facility for ETS-HM (Lu et al., 2014).
3.7.2 High-temperature erosion test rig
The high-temperature erosion test rig is a sophisticated apparatus designed to assess the erosive wear of materials under controlled, high-temperature situations. It featured independent temperature control for impact particles, air, and test pieces, allowing precise regulation up to 900°C. The setup included a chamber that prevents oxidation of test pieces, ensuring consistent testing conditions. Particles are heated and accelerated by hot air to impact the test specimens, which can be adjusted to impact angles from 0° to 90°. The design enabled accurate and reproducible measurements of erosion rates, making it particularly effective for evaluating the wear resistance of materials like S50C steel, SK3, and high V–Cr–Ni stainless spheroidal carbides cast iron (SCI-VCrNi) at elevated temperatures (Shimizu et al., 2009). Figure 18A, B shows the schematic and picture of the high-temperature erosion test rig.
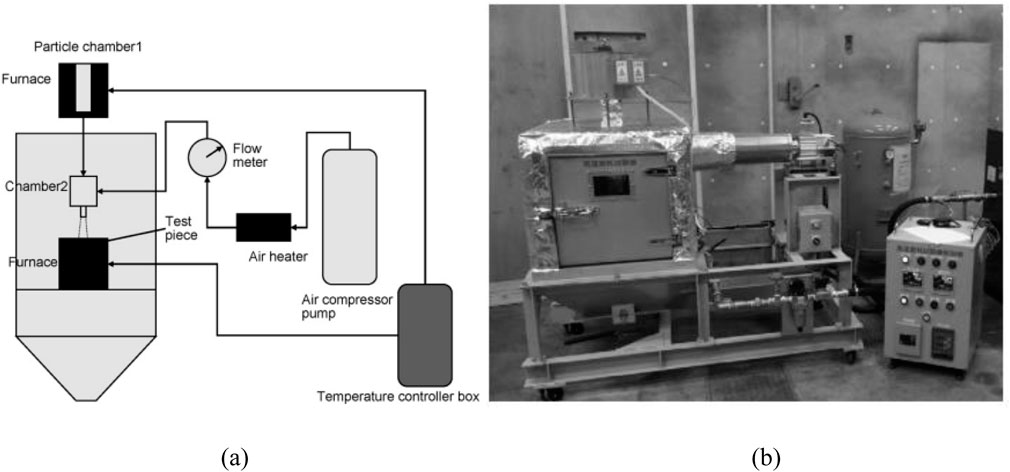
Figure 18. (A) Schematic diagram of high-temperature erosion test setup. (B) High-temperature erosion setup (Shimizu et al., 2009).
3.7.3 Slurry erosion test loop rig
The slurry erosion test loop rig (Wu et al., 2011) consisted of two primary experimental flow loops designed to simulate different erosion conditions. The slurry flow test loop featured a 3000-L agitated slurry holding tank, a Warman 3 × 2 slurry pump, and an Emerson magnetic flowmeter. It employed silica sand particles with a median diameter of approximately 200 μm, mixed with tap water at a 7% concentration, and recirculated through a pipe with an internal diameter of 53 mm at velocities ranging from 0 to 10 m/s. The air/solids flow test loop, on the other hand, used a Robushi E106 75 kW blower to recirculate sand or glass particles with diameters of 50–500 μm at a maximum velocity of 80 m/s. The test pipe sections in this loop had a minimal diameter of 100 mm. A mixing tank with an agitator was employed to study erosion on rotating impellers, utilizing sands or glass particles with diameters ranging from 100 µm to 200 µm. This setup allowed for comprehensive testing of erosion patterns across different flow regimes and equipment configurations.
4 Erosion models
The erosion models are mathematical equations that show the relationship between erosion rate and influencing factors, and they are developed based on the data collected through controlled experiments. The related parameters are systematically varied in the laboratory setting to observe the corresponding erosion effects. The resulting data are then analyzed using statistical approaches to formulate predictive equations that describe erosion behavior under specific conditions. Erosion is then defined based on mass loss per unit mass of material, mass loss per unit area and time, volume eroded, thickness loss with time, etc. These models are essential tools for erosion prediction of similar turbines with insights into designing, optimizing, and maintaining hydraulic components, ensuring their efficiency, reliability, and longevity. The types of experimental setups vary for the purpose of the study and working principle of the turbines. Most of the previously designed test rigs are based on simplified assumptions and cannot replicate the operating conditions and erosion mechanism occurring in actual hydropower plants. Thus, the current erosion models have not been found to reliably or accurately predict erosion. The subtopics below explain the various erosion models developed based on the types of experimental setups for erosion study on materials and Francis and Pelton turbine components.
4.1 Erosion models based on experiments in jet tester rigs
In a jet tester rig, erosive conditions are introduced by directing a high-speed jet of abrasive particles suspended in fluid at a target material. In this setup, key variables such as particle velocity, particle size, impact angle, and the properties of both the abrasive material and the target surface can be measured and controlled. Neilson and Gilchrist (1967) used aluminum, glass, and polymer as the base and target materials to study erosion in a jet tester rig. The abrasive particles were alumina in an air jet with angle of attack, particle velocity, and concentration as the control variables. The erosion equation from the experiment with erosion rate being calculated as the mass loss per unit time of abrasive particles impacting the target. Elkholy (1983) conducted an erosion study on cast iron with silica as the erodent in water. The control variables were volume concentration, mass concentration, and diameter of particles, along with angle of attack and particle velocity. The derived erosion equation is calculated as mass per unit mass of abrasive materials, and the equation also depends upon the hardness of base materials and erodent along with the concentration, diameter of particles, angle of attack, and particle velocity. Wiederhorn and Hockey (1983) used five different test materials, namely, sintered alumina, sapphire, silicon, sintered magnesium oxide, and fused silica. Carborundum grains in the air were used as the erodent in the experiment. The control variables in the experiment were the particle concentration, particle velocity, size of the particle, and the impact angle of the jet. The derived equation is in terms of the volume loss of the base material depending upon the toughness, hardness, and brittleness of materials along with the size of the particle and angle of attack of the jet. Turenne et al. (1989) studied the erosion properties of aluminum and glass when exposed to silica in water. The control variable was the concentration of the particles in water. The erosion rate equation is in terms of the weight loss of the base material per unit gram. Haugen et al. (1995) tested alumina, zirconia, yttria zirconia, carborundum, and titanium diboride materials using silica and alumina as erodents and oil and gas as solvents. The control variables in the experiment were the mass of the particle, particle velocity, and the impact angle of the jet. The erosion rate equation was calculated as the weight loss of the base material per unit kilogram. Yan et al. (2020) conducted an experiment on an alpha-beta titanium alloy having a strong specific strength and resistance to corrosion. The erodent used was quartz in an air jet. The control variables in the experiment mainly were the particle concentration, particle velocity, size of the particle, and the jet impact angle. The erosion rate was calculated as milligrams per gram. The details about the tested specimen, erodent, and erosion model equation derived from the experiments are listed in Table 2.
4.2 Erosion models based on experiments in pot tester rigs
The pot tester rig consists of a cylindrical vessel filled with a slurry of abrasive particles and fluid. The speed of the impeller, the concentration of abrasive particles, and the properties of the fluid are controlled to mimic different erosion conditions in a pot tester rig. Tsai et al. (1981) experimented on A-53 mild steel, 304, and 316 stainless steels with coal and carborundum particles as the erodent in kerosene. The resulting equation derived from the experiment gives erosive wear rate per unit area, which depends upon the concentration of eroding particles, diameter of eroding particles, properties of base materials, and velocity of eroding particles. Gupta et al. (1995) studied the erosive properties of brass and mild steel when exposed to erosion due to copper in water. The erosion equation for both the materials derived from the experiment gives erosion in terms of erosive wear per unit time, and the wear rate depended on the concentration by weight of particles, particle diameter, and flow velocity. Clark and Wong (1995) used different materials to test erosion properties with carborundum and aluminum in diesel. The erosion rate equation from the experiment is the sum of cutting erosion and deformation. Patil et al. (2011) subjected silica particles in water to a pot tester rig to study the wear in aluminum. The erosion equation gives the erosion rate, which depends upon the impact angle along with the concentration by weight of the particles, flow velocity, and diameter of the particle. More et al. (2014) used AISI steel and SS304L as base materials, which were subjected to erosion by quartz and water mixture in a pot tester. The hardness of the erosive particles, flow velocity, impact angle, diameter of the erodent particles, and particle concentration by weight all affect the erosion rate, which is determined by the erosion equation. Tarodiya and Gandhi (2019) used 304L steel, gray cast iron, and high chromium white cast iron as the testing materials. Silica and iron oxide particles in water were used as the mixture in the pot. The erosion rate derived from the experiment depended upon the impact angle, velocity of the impacting particles, and diameter of the particles. The details about the tested specimen, erodent, and erosion model equation derived from the experiments are listed in Table 3.
4.3 Erosion models based on experiments in Francis turbine test rigs
In the Francis turbine test rig, erosion is induced with a test setup similar to that of a hydropower plant. Even though Finnie, Tabakoff, and Grant's erosion model and Oka's erosion model are not derived from the experiments in a Francis turbine test rig, these erosion models have been found to accurately predict the erosion rates in the Francis turbine. Finnie (1960a) conducted experiments on various ductile and brittle materials when exposed to alumina and silicon carbide in air or water. The erosion is predicted in terms of the volume of materials eroded, which depends upon the mass of the particles, flow velocity, impact angle, shape factor, and the diameter of the ring crack. The model described by Grant and Tabakoff (1973) predicted erosion by studying wear in aluminum alloy when exposed to alumina particles in water. The erosion rate equation derived is in terms of the velocity of particles, the angle of impingement, and the angle of maximum erosion. Bardal's erosion model equation describes a general form of erosion equation, which gives erosion in mm/year and depends upon material properties, particle concentration, flow velocity, and impact angle (Bardal, 1985). The Oka erosion model used different materials to predict the wear when subjected to silica and silicon carbide in water and air (Oka et al., 1993). The erosion rate is in terms of particle density, fluid velocity, particle velocity, hardness of particles, and the impact angle. The erosion rate equation derived by Tsuguo (1999) predicted loss of thickness per unit of time, which depends upon turbine coefficient, flow velocity, hardness, shape, and size of the erodent particles. The IEC standard (IEC, 2009) equation to predict erosion depth depends upon flow velocity, particle load, concentration, and material properties. Thapa modeled the erosion rate equation, studying the hydropower with a Francis turbine. The size, shape, and hardness of the abrasive particles all affect the expected erosion rate. The Rajkumar model measured the weight loss following erosion to estimate the erosion rate (Rajkarnikar et al., 2013). The base material subjected to wear was aluminum, with the mixture of sediment particles in water as the erodent. The Nandakumar erosion model (Huang et al., 2008) is based on the Finnie and Bitter erosion models. The experiment was done on three different materials: aluminum, copper, and SAE-1055 steel, using carborundum as the erodent in water. The derived equation depends upon the total mass of the erodent, the width of deformation due to erosion, the density of the particle, the diameter of the particle, the flow velocity, and the angle of impingement. The details about the tested specimen, erodent, and erosion model equation derived from the experiments are listed in Table 4.
4.4 Erosion models based on experiments in Pelton turbine test rigs
Most of the correlations for the erosion rate of Pelton turbine components were developed with respect to sediment characteristics (size, concentration, and mineral content), operating conditions (jet velocity, impingement angle, and operating hours), and base material properties (hardness and wear resistance coefficient). The authors have also accounted for sediment shape and hardness (Naidu, 1997b; Asthana, 1997; Tsuguo, 1999). In the past, silica sand was used mostly for erosion experiments with an air medium (Finnie, 1960b; Bitter, 1962; Neilson and Gilchrist, 1968; Hutchings, 1981). Brass and bronze were used as the base material for rapid erosion results (Bain and Bonnington, 1970; Naidu, 1997b; Padhy and Saini, 2009). The erosion models were able to predict material erosion but were still not applicable to predicting the erosion of hydraulic components. Later, river sand or quartz was used as sediment with martensitic steels as the base material, which are abundantly used material in hydraulic components. The test rigs simulating the actual condition of the Pelton turbine were developed, providing improved correlation for erosion prediction. Most of the erosion models are developed for bucket erosion. The correlation for efficiency reduction has also been developed using the erosion models (Padhy and Saini, 2009; Bajracharya et al., 2008). Liu et al. (2012) and Liu et al. (2019) have developed erosion correlations for a Pelton injector system: needle, nozzle, and buckets. Currently, erosion models are developed for various types of bucket materials: 13Cr-4Ni, 16Cr-4Ni, 16Cr-5Ni, and coated materials: 13Cr-4Ni with plasma-sprayed Cr2O3 coating and 13Cr-4Ni with a WC Co-Cr high-velocity oxygen fuel (HVOF) coating (Rai et al., 2020). The various types of erosion models developed for erosion prediction of Pelton turbine components with parameters and model descriptions are discussed in Table 5.
5 Turbine material wear
The erosion and wear of turbine components are significantly influenced by the material properties of the turbine blades and other surfaces in contact with water. Various studies have emphasized the role of material composition, hardness, and surface roughness in determining the erosion resistance of these components (Nakamoto et al., 1993; Sharma and Gandhi, 2021). Commonly used materials include alloys of stainless steel and carbon steel with composite coatings, each exhibiting distinct wear characteristics under different operational conditions. Sharma and Gandhi (2021) studied wear in CA6NM, which is a version of turbine steel used in Bhilangana Hydropower, using SEM photographs. Experimental studies on another turbine steel, CF8M steel with various HVOF sprayed coatings, have shown that WC–10Co–4Cr coatings significantly enhance erosion resistance due to their higher hardness than Al2O3+TiO2 coatings, which exhibited lower resistance owing to unmelted particles that caused spalling and higher erosion rates (Kumar Goyal et al., 2012). These coatings demonstrated distinct erosion behaviors, with WC–10Co–4Cr displaying a mixed ductile behavior, while Al2O3+TiO2 exhibited brittle erosion behavior.
Considering the wear in turbine materials, statistical processing of the obtained results can lead to better optimization of turbine design and materials. By statistical processing of test data, an optimal selection or protection of turbine materials can be made in order to prevent failures, as well as loss of flow or reduction in efficiency in turbine operation. In addition, by applying appropriate distributions, turbine maintenance can be planned to prevent sudden failures, as well as the procurement of spare parts, which is also important from a safety perspective. A research work (Panic et al., 2023) demonstrates the application of the Weibull distribution to model wear patterns in turbine blades, enabling predictive maintenance scheduling. In addition, given the very useful database obtained during the testing of both turbines on the test rig, it is very important to note that the application of some of the statistical data processing methods can contribute to better optimization and reduction of costs and resources during design. Milojević and Stojanović (2018) used the Taguchi method and artificial neural network (ANN)-based models to analyze the effects of material, load, and sliding speed on wear, and similar approaches can be applied to predict and mitigate erosion in turbines. Gajević et al. (2024) used the Taguchi, GRA, and TOPSIS methods to analyze the characteristics of aluminum. These methods can also be applied to identify optimal operating parameters like load, sliding speed, and material composition, which can help to minimize erosion, adhesive wear, and delamination in turbines. The water flow does not need to have a direct impact on the turbine bearings as they do not come in contact with water, but a review study done by Dhanola and Garg has shown that a new bearing design could help decrease the wear in turbines (Dhanola and Garg, 2020).
6 Summary and conclusion
The issue of sediment erosion in high-head flows poses significant challenges to the efficiency and longevity of turbines. It has been necessary to study the effects of erosion to predict its effect at the earliest possible stage. The investigation of sediment erosion in turbine materials through diverse experimental test rigs and analytical techniques represents a crucial endeavor in turbine engineering. The use of specialized setups such as the jet erosion test rig, rotating disc apparatus (RDA), guide vane cascade rig, Pelton turbine test rig, and Francis turbine test rig has made studies into erosion phenomena at critical turbine components possible. These experimental platforms have also enabled us to visualize and measure the wear in materials through various analyses of erosion effects. The experimental tests have helped to establish the correlation between many various variables involved in turbine erosion. This study also reveals trends in how experimental studies have evolved over time.
The prediction of erosion wear remains a difficult task influenced by factors ranging from fluid dynamics to material properties and operational conditions. Recently, there have been progresses in the study of erosion and cavitation, such as the coalesced effect erosion system study in which the joint effects of erosion and cavitation could be examined, and Francis and Pelton turbine test rigs in which the test condition could be made similar to the hydropower plants. Future research could include more variables, such as corrosion phenomena in the experimental investigation, to be more realistic and focus on enhancing erosion models through comprehensive validation against experimental data and CFD for exploring advanced materials with enhanced erosion resistance properties. In addition, future research in turbine wear could also include statistical analysis such as Taguchi and TOPSIS methods to analyze the wear in turbine materials. The relationships between turbine wear and turbine bearings could be studied. This approach could be instrumental in minimizing turbine downtime, optimizing maintenance strategies, and ensuring the sustainable operation of hydroelectric power plants. This review combines the findings from a spectrum of experimental investigations and analytical approaches, providing a resource for advancing turbine technology and mitigating the effects of sediment erosion on turbine performance and durability, ultimately reducing maintenance costs.
Author contributions
RS: data curation, formal analysis, investigation, methodology, writing–original draft, and writing–review and editing. PG: data curation, formal analysis, investigation, methodology, writing–original draft, and writing–review and editing. SC: conceptualization, methodology, project administration, resources, supervision, validation, writing–original draft, and writing–review and editing. BT: conceptualization, funding acquisition, project administration, supervision, validation, and writing–review and editing. HN: conceptualization, funding acquisition, project administration, resources, supervision, validation, and writing–review and editing. ZG: conceptualization, funding acquisition, project administration, resources, supervision, validation, and writing–review and editing. ZQ: funding acquisition, project administration, resources, supervision, and writing–review and editing.
Funding
The author(s) declare that financial support was received for the research, authorship, and/or publication of this article. This study was performed jointly at the Turbine Testing Lab, Kathmandu University, and the State Key Laboratory of Water Resources Engineering and Management, Wuhan University. The project was supported by the Visiting Scholar’s Fund provided by WRHES, China (Project No. 2021SDG01), the EnergizeNepal project (TTL-Energize and ENEP-RENP-II-23-03), and the Hydro Himalaya (NORHED-II) Project.
Conflict of interest
The authors declare that the research was conducted in the absence of any commercial or financial relationships that could be construed as a potential conflict of interest.
Generative AI statement
The author(s) declare that no Generative AI was used in the creation of this manuscript.
Publisher’s note
All claims expressed in this article are solely those of the authors and do not necessarily represent those of their affiliated organizations, or those of the publisher, the editors, and the reviewers. Any product that may be evaluated in this article, or claim that may be made by its manufacturer, is not guaranteed or endorsed by the publisher.
Supplementary material
The Supplementary Material for this article can be found online at: https://www.frontiersin.org/articles/10.3389/fmech.2024.1526120/full#supplementary-material
Abbreviations
ADM, acoustic discharge measurement; ANN, artificial neural network; CFD, computational fluid dynamics; CG, clearance gap; ETC-HM, erosion test system for hydraulic machinery; FFT, Fast Fourier transform; GRA, gray relational analysis; GV, guide vane; HP, hydropower; HVOF, high-velocity oxygen fuel; IEC, International Electrotechnical Commission; IGC, induction generator controller; NACA, National Advisory Committee for Aeronautics; NGV, needle guide vortex; PIV, particle image velocimetry; PLC, programming logic control; SSM, suspended sediment monitor; TOPSIS, technique for order of preference by similarity to ideal solution; UFM, ultrasonic flowmeter; VFD, variable frequency drive.
References
Abgottspon, A., Staubli, T., Felix, D., Albayrak, I., and Boes, R. M. (2013). Hydro-abrasive erosion of pelton buckets and suspended sediment monitoring. Available at: https://www.researchgate.net/publication/291339891.
Acharya, N., Gautam, S., Chitrakar, S., and Dahlhaug, O. G. (2022). Development of simplified model for prediction of sediment induced erosion in Francis turbine’s sidewall gaps. IOP Conf. Ser. Earth Environ. Sci. 1037, 012016. doi:10.1088/1755-1315/1037/1/012016
Adrian, R. J., and Westerweel, J. (2011). Particle image Velocimetry. Cambridge: Cambridge University Press.
Aryal, S., Chitrakar, S., Shrestha, R., and Jha, A. K. (2022). Credibility of Rotating Disc Apparatus for investigating sediment erosion in guide vanes of Francis turbines. IOP Conf. Ser. Earth Environ. Sci. 1037, 012034. doi:10.1088/1755-1315/1037/1/012034
Aslam Noon, A., and Kim, M. H. (2017). Erosion wear on Francis turbine components due to sediment flow. Wear 378–379, 126–135. doi:10.1016/j.wear.2017.02.040
Asthana, B. N. (1997). “Determination of optimal sediment size to be excluded for run-of-river project–a case study,” in Seminar on: silting problems in hydro power stations (New Delhi, India, Roorkee: WRDTC).
Bain, A., and Bonnington, S. T. (1970). The hydraulic transport of solids by pipeline. 1st ed. Oxford: Pergamon Press.
Bajracharya, T. R., Shrestha, R., and Timilsina, A. (2019). A methodology for modelling of steady state flow in pelton turbine injectors. J. Inst. Eng. 15, 246–255. doi:10.3126/jie.v15i2.27674
Bajracharya, T. R., Poudel, S., Joshi, C. B., Saini, R. P., and Dahlhaug, O. G. (2007). Correlation between sand led erosion of pelton buckets and efficiency losses in high head hydropower schemes. Available at: https://www.researchgate.net/publication/296195175.
Bajracharya, T. R., Acharya, B., Joshi, C. B., Saini, R. P., and Dahlhaug, O. G. (2008). Sand erosion of Pelton turbine nozzles and buckets: a case study of Chilime Hydropower Plant. Wear 264 (3–4), 177–184. doi:10.1016/j.wear.2007.02.021
Bajracharya, T. R., Pachhain, A. K., Sapkota, A., and Timilsina, A. B. (2020). International Research Journal of Modernization in Engineering Technology and Science 2 (7). Available at: www.irjmets.com.
Bajracharya, T., Poudel, S., Joshi, C. B., Saini, R. P., and Dahlhaug, O. G. (2008). Correlation study on sand led erosion of buckets and efficiency losses in high head power plants. Vienna. Available at: https://www.researchgate.net/publication/298768075.
Bajracharya, T. R., Sapkota, D., Thapa, R., Poudel, S., Joshi, C. B., Saini, R. P., et al. (2006). “Correlation study on sand led erosion of buckets and efficiency losses in high head power plants,” in Proceedings of First National Conference on Renewable Energy Technology for Rural Development 12-14th October Kathmandu, Nepal.
Bansal, Dr. R. K. (2010). A textbook of fluid mechanics and hydraulic machines. Delhi: Laxmi Publications Pvt. Ltd.
Bazanini, G., Bressan, J. D., Klemz, M. A., Tenente, R., and Joao, A. (2008). Cavitation erosion wear of metallic specimens using the new compact rotating disk device.
Bitter, J. G. A. (1962). A study of erosion phenomena. Wear 6, 169–190. doi:10.1016/0043-1648(63)90073-5
Boes, R. M., Real-time monitoring of suspended sediment concentration and particle size distribution in the headwater way of a high-head hydropower plant. 2009.
Brekke, H. (2002). Abrasive erosion and corrosion of hydraulic machinery. London: Imperial College Press.
Brekke, H. (2002). “Design of hydraulic machinery working in sand laden water,” in Abrasive erosion and corrosion of hydraulic machinery, vol. 2. Editors C. G. Duan, and V. Y. Karelin (London: Imperial College Press), 155–181.
Burstein, G. T., and Sasaki, K. (2000). Effect of impact angle on the slurry erosion-corrosion of 304L stainless steel. Available at: www.elsevier.comrlocaterwear.
Burwell, J.Jr. (1957). Survey of possible wear mechanisms. 2nd ed. New York, NY: Wear 1 (2), 119–141. doi:10.1016/0043-1648(57)90005-4
Chhetry, B., and Rana, K. (2015). Effect of sand erosion on turbine components: a case study of kali gandaki ‘A’ hydroelectric project (144 MW), Nepal.
Chitrakar, S. (2018). “Secondary flow and sediment erosion in francis turbines,”. Doctoral Thesis (Trondhein: Norwegian University of Science and Technology).
Chitrakar, S., Neopane, H. P., and Dahlhaug, O. G. (2016). “Study of the simultaneous effects of secondary flow and sediment erosion,” in Francis turbines (Elsevier Ltd.). doi:10.1016/j.renene.2016.06.007
Chitrakar, S., Neopane, H. P., and Dahlhaug, O. G. (2017b). Particle image velocimetry investigation of the leakage flow through clearance gaps in cambered hydrofoils. J. Fluids Eng. 139 (9), 1–9. doi:10.1115/1.4036269
Chitrakar, S., Neopane, H. P., and Dahlhaug, O. G. (2018). “A review on sediment erosion challenges in hydraulic turbines,” in Sedimentation engineering (InTech). doi:10.5772/intechopen.70468
Chitrakar, S., Neopane, H. P., and Dahlhaug, O. G. (2019). The numerical and experimental investigation of erosion induced leakage flow through guide vanes of Francis turbine. IOP Conf. Ser. Earth Environ. Sci. 240, 072002. doi:10.1088/1755-1315/240/7/072002
Chitrakar, S., Thapa, B. S., Dahlhaug, O. G., and Neopane, H. P. (2017a). Numerical and experimental study of the leakage flow in guide vanes with different hydrofoils. J. Comput. Des. Eng. 4 (3), 218–230. doi:10.1016/j.jcde.2017.02.004
Chongji, Z., Yexiang, X., Wei, Z., Yangyang, Y., Lei, C., and Zhengwei, W. (2014). Pelton turbine Needle erosion prediction based on 3D three-phase flow simulation. IOP Conf. Ser. Earth Environ. Sci. 22, 052019. doi:10.1088/1755-1315/22/5/052019
Clark, H. M., and Wong, K. K. (1995). Wear Impact angle, particle energy and mass loss in erosion by dilute slurries.
Dahlhaug, O. G., Skare, P., Mossing, V., and Gutierrez, A. (2010). Erosion resistant coatings for Francis runners and guidevanes. Int. J. Hydropower and Dams 2, 109–112.
De Bree, S. E. M., Rosenbrand, W. F., and de Gee, A. W. J. (1982). “On the erosion resistance in water-sand mixtures of steels for application in slurry pipelines,” in Hydraulic transport of solids in pipes (Johannesburg: BRHA Fluid Eng).
Dhanola, A., and Garg, H. C. (2020). Tribological challenges and advancements in wind turbine bearings: a review. Elsevier Ltd. doi:10.1016/j.engfailanal.2020.104885
Divo Bressan, J., Antunes Klemz, M., and Bazanini, G. (2014). Cavitation erosion damage of metallic materials in rotating disk testing.
Ekanger, J. V. (2011) “Morphing skins to improve local flow behavior in a hydroturbine context,”. Master of Sciencein Energy and Environment submitted on June 2011, Norwegian University of Science and Technology, Department of Energy and Process Engineering.
Finnie, I. (1960a). Erosion of surfaces by solid particles. Wear 3, 87–103. doi:10.1016/0043-1648(60)90055-7
Gajević, S., Marković, A., Milojević, S., Ašonja, A., Ivanović, L., and Stojanović, B. (2024). Multi-objective optimization of tribological characteristics for aluminum composite using Taguchi grey and TOPSIS approaches. Lubricants 12 (5), 171. doi:10.3390/lubricants12050171
Gandhi, B. K., Singh, S. N., and Seshadri, V. (1999). Study of the parametric dependence of erosion wear for the parallel flow of solid-liquid mixtures. Available at: www.elsevier.com/locate/triboint.
Ge, X., Sun, J., Chu, D., Liu, J., Zhou, Y., Zhang, H., et al. (2023). Sediment erosion on Pelton turbines: a review. Springer. doi:10.1186/s10033-023-00880-y
Ge, X., Sun, J., Zhou, Y., Cai, J., Zhang, H., Zhang, L., et al. (2021). Experimental and numerical studies on opening and velocity influence on sediment erosion of pelton turbine buckets. Renew. Energy 173, 1040–1056. doi:10.1016/j.renene.2021.04.072
Goyal, D. K., Singh, H., Kumar, H., and Sahni, V. (2012). Slurry erosion behavior of HVOF sprayed WC-10Co-4Cr and Al2O3+13TiO2. Wear 289, 46–67. doi:10.1016/j.wear.2012.04.016
Grant, G., and Tabakoff, W. (1973). An experimental investigation of the erosive characteristics of 2024 aluminum alloy. Ohio: Cincinnati.
Grant, I. (1997). Particle image velocimetry: a review. Proc. Inst. Mech. Eng. C J. Mech. Eng. Sci. 211 (1), 55–76. doi:10.1243/0954406971521665
Guo, B., Xiao, Y., Rai, A. K., Liang, Q., and Liu, J. (2021). Analysis of the air-water-sediment flow behavior in Pelton buckets using a Eulerian-Lagrangian approach. Energy 218, 119522. doi:10.1016/j.energy.2020.119522
Guo, B., Xiao, Y., Rai, A. K., Zhang, J., and Liang, Q. (2020). Sediment-laden flow and erosion modeling in a Pelton turbine injector. Renew. Energy 162, 30–42. doi:10.1016/j.renene.2020.08.032
Gupta, R., Singh, S. N., and Sehadri, V. (1995). Prediction of uneven wear in a slurry pipeline on the basis of measurements in a pot tester.
Haugen, K., Ronold, A., and Sandberg, R. (1995). Sand erosion of wear-resistant materials: erosion in choke valves. Wear 186-187, 179–188. doi:10.1016/0043-1648(95)07158-x
Huang, C., Chiovelli, S., Minev, P., Luo, J., and Nandakumar, K. (2008). A comprehensive phenomenological model for erosion of materials in jet flow. Powder Technol. 187 (3), 273–279. doi:10.1016/j.powtec.2008.03.003
Hutchings, I. M. (1981). A model for the erosion of metals by spherical particles at normal incidence. Sequoia S. A: Elsevier.
Kang, M. W., Park, N., and Suh, S. H. (2016). “Numerical study on sediment erosion of francis turbine with different operating conditions and sediment inflow rates,” in Procedia engineering (Elsevier Ltd), 457–464. doi:10.1016/j.proeng.2016.08.389
Kang, R., and Liu, H. (2020). An integrated model of predicting sand erosion in elbows for multiphase flows. Powder Technol. 366, 508–519. doi:10.1016/j.powtec.2020.02.072
Kapali, A., Chitrakar, S., Shrestha, O., Neopane, H. P., and Thapa, B. S. (2019). A review on experimental study of sediment erosion in hydraulic turbines at laboratory conditions. J. Phys. Conf. Ser. 1266, 012016. doi:10.1088/1742-6596/1266/1/012016
Karthik, S., and Amarendra, H. J. (2019). “Development of slurry jet erosion test rig - an aid to investigate erosion resistance of materials,” in Materials today: proceedings (Elsevier Ltd), 4426–4430. doi:10.1016/j.matpr.2020.09.674
Kaunda, C. S., Kimambo, C. Z., and Nielsen, T. K. (2014). A technical discussion on microhydropower technology and its turbines. Elsevier Ltd. doi:10.1016/j.rser.2014.04.035
Kayastha, A., Thapa, B. S., Thapa, B., and Lee, Y. H. (2020). Experimental investigation for R&D in sediment laden pico hydraulic francis turbine. Renew. Energy 155, 889–898. doi:10.1016/j.renene.2020.03.116
Koirala, R., Neopane, H. P., Zhu, B., and Thapa, B. (2019). Effect of sediment erosion on flow around guide vanes of Francis turbine. Renew. Energy 136, 1022–1027. doi:10.1016/j.renene.2019.01.045
Kumar, P., and Saini, R. P. (2010). Study of cavitation in hydro turbines-A review. Renew. Sustain. Energy Rev. 14, 374–383. doi:10.1016/j.rser.2009.07.024
Kumar, R., and Singal, S. K. (2015). “Operation and maintenance problems in hydro turbine material in small hydro power plant,” in Materials today: proceedings (Elsevier Ltd), 2323–2331. doi:10.1016/j.matpr.2015.07.284
Kumar Goyal, D., Singh, H., Kumar, H., and Sahni, V. (2012). Slurry erosion behaviour of HVOF sprayed WC-10Co-4Cr and Al 2O 3+13TiO 2 coatings on a turbine steel. Wear 289, 46–57. doi:10.1016/j.wear.2012.04.016
Leguizamón, S., Jahanbakhsh, E., Alimirzazadeh, S., Maertens, A., and Avellan, F. (2019). Multiscale simulation of the hydroabrasive erosion of a pelton bucket: bridging scales to improve the accuracy. Int. J. Turbomach. Propuls. Power 4 (2), 9. doi:10.3390/ijtpp4020009
Lin, M. C., Chang, L. S., Lin, H. C., Yang, C. H., and Lin, K. M. (2006). A study of high-speed slurry erosion of NiCrBSi thermal-sprayed coating. Surf. Coat. Technol. 201 (6), 3193–3198. doi:10.1016/j.surfcoat.2006.06.040
Liu, J., Lu, L., and Zhu, L. (2012). Experiment study on sediment erosion of Pelton turbine flow passage component material. IOP Conf. Ser. Earth Environ. Sci. 15, 032055. doi:10.1088/1755-1315/15/3/032055
Liu, J., Yu, J., and Jiang, C. (2019). Evaluation on sediment erosion of Pelton turbine flow passage component. IOP Conf. Ser. Earth Environ. Sci. 240, 022027. doi:10.1088/1755-1315/240/2/022027
Lu, L., Liu, J., Zhang, J. G., Zhu, L., Xu, H. Q., Meng, X. C., et al. (2014). An experiment system for testing synergetic erosion caused by sand abrasion and cavitation. IOP Conf. Ser. Earth Environ. Sci. 22, 052017. doi:10.1088/1755-1315/22/5/052017
Meng ’, H. C., and Ludema, K. C. (1995). Wear models and predictive equations: their form and content. Am Arbor, MI: ELSEVIER Wear.
Messa, G. V., Mandelli, S., and Malavasi, S. (2019). Hydro-abrasive erosion in Pelton turbine injectors: a numerical study. Renew. Energy 130, 474–488. doi:10.1016/j.renene.2018.06.064
Milojević, S., Savić, S., Mitrović, S., Marić, D., Krstić, B., Stojanović, B., et al. (2023). Solving the problem of friction and wear in auxiliary devices of internal combustion engines on the example of reciprocating air compressor for vehicles. Teh. Vjesn. 30 (1), 122–130. doi:10.17559/TV-20220414105757
Milojević, S., and Stojanović, B. (2018). Determination of tribological properties of aluminum cylinder by application of Taguchi method and ANN-based model. J. Braz. Soc. Mech. Sci. Eng. 40 (12), 571. doi:10.1007/s40430-018-1495-8
Mirza Umar, B., Wang, Z., Chitrakar, S., Thapa, B., Huang, X., Poudel, R., et al. (2024). Experimental erosion flow pattern study of pelton runner buckets using a non-recirculating test rig. Energies (Basel) 17 (16), 4006. doi:10.3390/en17164006
More, S. R., Nandre, B. D., and Desale, G. R. (2014). Development of pot tester to simulate the erosion wear due to solid-liquid mixture. Int. J. Res. Sci. Dev. 2 (1). Available at: www.ijrsd.org.
Morin, G. P., Lavé, J., France-Lanord, C., Rigaudier, T., Gajurel, A. P., and Sinha, R. (2018). Annual sediment transport dynamics in the narayani basin, Central Nepal: assessing the impacts of erosion processes in the annual sediment budget. J. Geophys Res. Earth Surf. 123 (10), 2341–2376. doi:10.1029/2017JF004460
Naidu, B. S. K. (1997a). Addressing the problems of silt erosion at hydro plants. Int. J. Hydropower Dams 4 (3), 72–77.
Nakamoto, K., Shiotani, K., Makimoto, M., and Saito, M. (1993). Development of colored stainless steel sheets by ceramics coating. ISIJ Int. 33 (9), 968–975. doi:10.2355/isijinternational.33.968
Neilson, J., and Gilchrist, A. (1968). Erosion by a stream of solid particles. Wear 11, 111–122. doi:10.1016/0043-1648(68)90591-7
Neilson, J. H., and Gilchrist, A. (1967). Erosion by a stream of solid particles. Wear 2, 111–122. doi:10.1016/0043-1648(68)90591-7
Neopane, H. P., Chitrakar, S., and Dahlhaug, O. G. (2019). Role of Turbine Testing Lab for overcoming the challenges related to hydropower development in Nepal. IOP Conf. Ser. Earth Environ. Sci. 240, 042012. doi:10.1088/1755-1315/240/4/042012
Niu, L., Yan, J., and Gao, D. (2020). Research on corrosion and defects of hydraulic metal structures. IOP Conf. Ser. Earth Environ. Sci. 455, 012027. doi:10.1088/1755-1315/455/1/012027
Noon, A. A., and Kim, M. H. (2021). Sediment and cavitation erosion in Francis turbines—review of latest experimental and numerical techniques. Basel, Switzerland: MDPI AG. doi:10.3390/en14061516
Ojala, N., Valtonen, K., Kivikytö-Reponen, P., Vuorinen, P., and Kuokkala, V.-T. (2015). High speed slurry-pot erosion wear testing with large abrasive particles high speed slurry-pot erosion wear testing with large abrasive particles. TRIBOLOGIA - Finnish J. Tribol. 1.
Oka, Y. I., Matsumura, M., and Kawabata, T. (1993). Relationship between surface hardness and erosion damage caused by solid particle impact. Wear 162-164, 688–695. doi:10.1016/0043-1648(93)90067-v
Padhy, M. K., and Saini, R. P. (2009). Effect of size and concentration of silt particles on erosion of Pelton turbine buckets. Energy 34, 1477–1483. doi:10.1016/j.energy.2009.06.015
Padhy, M. K., and Saini, R. P. (2012). Study of silt erosion mechanism in Pelton turbine buckets. Energy 39 (1), 286–293. doi:10.1016/j.energy.2012.01.015
Panic, S., Petrovic, V., Draskovic, S., Kontrec, N., and Milojevic, S. (2023). Performance analysis of hybrid fso/rf communication system with receive diversity in the presence of chi-square/gamma turbulence and rician fading. Bull. D. Serikbayev EKTU, 304–312. doi:10.51885/1561-4212_2023_4_304
Patil, M. S., Patil, M. S., Jahagirdar, R. S., and Jahagirdar, R. S. (2011). “Study of the parameters affecting erosion wear of ductile material in solid-liquid mixture,” in Proceedings of the world congress on engineering (London: WCE), 1–5.
Poudel, L., Thapa, B., Shrestha, B. P., Thapa, B. S., Shrestha, K. P., and Shrestha, N. K. (2012). Computational and experimental study of effects of sediment shape on erosion of hydraulic turbines. IOP Conf. Ser. Earth Environ. Sci. 15, 032054. doi:10.1088/1755-1315/15/3/032054
Poudel, R., Shi, J., Zhao, Z., Qian, Z., Guo, Z., Chitrakar, S., et al. (2024). Experimental study of the effects on performance of Francis turbine due to sediments in flow. J. Phys. Conf. Ser. 2752, 012207. doi:10.1088/1742-6596/2752/1/012207
Predescu, C., Berbecaru, A. C., Coman, G., Sohaciu, M. G., Predescu, A. M., Matei, E., et al. (2019). Corrosion resistance evaluation of some stainless stee ls used in manufacture of hydraulic turbine runner blades. Rev. Chim. 70, 2491–2496. doi:10.37358/rc.19.7.7367
Rai, A. K., Kumar, A., and Staubli, T. (2020). Effect of concentration and size of sediments on hydro-abrasive erosion of Pelton turbine. Renew. Energy 145, 893–902. doi:10.1016/j.renene.2019.06.012
Rajkarnikar, B., Neopane, H. P., and Thapa, B. S. (2013). Development of rotating disc apparatus for test of sediment-induced erosion in francis runner blades. Wear 306 (1–2), 119–125. doi:10.1016/j.wear.2013.07.011
Rashed, M. K., Abdulbari, H. A., Salleh, M. A. M., and Ismail, M. H. S. (2016). Rotating disk apparatus: types, developments and future applications. Mod. Appl. Sci. 10 (8), 198. doi:10.5539/mas.v10n8p198
Santa, J. F., Espitia, L. A., Blanco, J. A., Romo, S. A., and Toro, A. (2009). Slurry and cavitation erosion resistance of thermal spray coatings. Wear 267 (1–4), 160–167. doi:10.1016/j.wear.2009.01.018
Sharma, S., and Gandhi, B. K. (2020). Erosion wear behavior of martensitic stainless steel under the hydro-abrasive condition of hydropower plants. J. Mater Eng. Perform. 29 (11), 7544–7554. doi:10.1007/s11665-020-05238-2
Sharma, S., and Gandhi, B. K. (2021). Experimental investigation of sediment erosion of turbine steel used in Bhilangana-III power-plant. IOP Conf. Ser. Earth Environ. Sci. 774, 012108. doi:10.1088/1755-1315/774/1/012108
Shima, A., Tomaru, H., Ihara, A., and Miura, N. (1992). Cavitation damage study with a rotating disk at the high peripheral velocities. J. Hydraulic Res. 30 (4), 521–538. doi:10.1080/00221689209498898
Shimizu, K., Naruse, T., Xinba, Y., Kimura, K., Minami, K., and Matsumoto, H. (2009). Erosive wear properties of high V-Cr-Ni stainless spheroidal carbides cast iron at high temperature. Wear 267 (1–4), 104–109. doi:10.1016/j.wear.2008.12.086
Shrestha, O., Kapali, A., Thapa, B., Neopane, H. P., and Lee, Y.-H., “Rotating disc apparatus (RDA) for estimation of erosion in micro crossflow hydro turbines.”2021.
Stachowiak, G. W., and Batchelor, A. W. (2006). Engineering tribology. 3rd ed. Butterworth – Heinemann, Elsevier.
Tarodiya, R., and Gandhi, B. K. (2019). Experimental investigation on slurry erosion behavior of 304L steel, grey cast iron, and high chromium white cast iron. J. Tribol. 141 (9). doi:10.1115/1.4043903
Thapa, B. S. (2016). “Effects of sediment erosion in guide vanes of Francis turbines,”. Doctoral thesis (Trondheim: Norwegian University of Science and Technology).
Thakur, R., Khurana, S., Thakur, R., Kumar, A., Nadda, R., and Sethi, M. (2017a). Experimental study and optimizing erosive wear rate parameters using A novel entropy vikor approach in A pelton turbine buckets. Int. J. Mech. Eng. Technol. (IJMET) 8 (6), 27–43. Available at: http://www.iaeme.com/IJMET/index.asp27.
Thakur, R., Kumar, A., Khurana, S., and Sethi, M. (2017b). Correlation development for erosive wear rate on pelton turbine buckets. Int. J. Mech. Prod. Eng. Res. Dev. 7 (3), 259–274. doi:10.24247/ijmperdjun201727
Thapa, B., Chaudhary, P., Dahlhaug, O. G., and Upadhyay, P. (2007). “Study of combined effect of sand erosion and cavitation in hydraulic turbines,” in International conference on small hydropower-hydro Sri Lanka (Sri Lanka).
Thapa, B., Shrestha, R., Dhakal, P., and Thapa, B. S. (2005). Sediment in Nepalese hydropower projects. J. Aquat. Ecosyst. Health Manage 8 (3), 251258.
Thapa, B., Thapa, B. S., Dahlhaug, O. G., and Shrestha, K. P. (2012b). “Accelerated testing for resistance to sand erosion in hydraulic turbines,” in International conference on water resources and renewable energy development in asia, Thailand.
Thapa, B. S., Dahlhaug, O. G., and Thapa, B. (2017). Effects of sediment erosion in guide vanes of Francis turbine. Wear 390–391, 104–112. doi:10.1016/j.wear.2017.07.012
Thapa, B. S., Dahlhaug, O. G., and Thapa, B. (2018). Flow measurements around guide vanes of Francis turbine: a PIV approach. Renew. Energy 126, 177–188. doi:10.1016/j.renene.2018.03.042
Thapa, B. S., Thapa, B., and Dahlhaug, O. G. (2012a). Empirical modelling of sediment erosion in Francis turbines. Energy 41 (1), 386–391. doi:10.1016/j.energy.2012.02.066
Thapa, B. S., Trivedi, C., and Dahlhaug, O. G. (2016). Design and development of guide vane cascade for a low speed number Francis turbine. J. Hydrodynamics 28 (4), 676–689. doi:10.1016/S1001-6058(16)60648-0
Tsai, W., Humphrey, J. A. C., Cornet, I., and V Levy, A. (1981). Experimental measurement of accelerated erosion in a slurry pot tester. Elsevier Sequoia $.A.
Tsuguo, N. (1999). “Estimation of repair cycle of turbine due to abrasion caused by suspended sand and determination of desilting basin capacity,” in Proceedings of international seminar on sediment handling technique (Kathmandu: NHA).
Turenne, S., Fiset, M., and Masounave, J. (1989). The effect of sand concentration on the erosion of materials by a slurry jet. J. Wear 133, 95–106. doi:10.1016/0043-1648(89)90116-6
Veerabhadra Rao, P., Syamala Rao, B., and Lakshmana Rao, N. (1980). Erosion and cavity characteristics in rotating components. J. Test. Eval. 8 (3), 127–142. doi:10.1520/jte10609j
Vivekananda, P. (1983). “Mechanism of cavitation damage influence of stacking fault energy on erosion and erosion resistance of steels and coatings,”. PhD Thesis (Bangalore, India: Indian Institute of Science).
Winkler, K. (2014). Hydro-abrasive erosion: problems and solutions. IOP Conf. Ser. Earth Environ. Sci. 22, 052022. doi:10.1088/1755-1315/22/5/052022
Wiederhorn, S. M., and Hockey, B. J., “Effect of material parameters on the erosion resistance of brittle materials,” 1983.
William, J. S. (1987). Ball mill and hub test methods for slurry erosion evaluation of materials. Middletown, Ohio: Armco, Inc., 5–16. doi:10.1520/STP19411S
Wood, R. J. K. (1999). The sand erosion performance of coatings. Mater Des. 20, 179–191. doi:10.1016/s0261-3069(99)00024-2
Wood, R. J. K., and Wheeler, D. W. (1998). Design and performance of a high velocity air–sand jet impingement erosion facility. Wear 220, 95–112. doi:10.1016/s0043-1648(98)00196-3
Wu, J., Graham, L., Lester, D., Wong, C., Kilpatrick, T., Smith, S., et al. (2011). An effective modeling tool for studying erosion. Wear 270 (9–10), 598–605. doi:10.1016/j.wear.2011.01.016
Yan, C., Chen, W., Zhao, Z., and Liu, L. (2020). A probability prediction model of erosion rate for Ti-6Al-4V on high-speed sand erosion. Powder Technol. 364, 373–381. doi:10.1016/j.powtec.2020.01.058
Zhang, H. M., and Zhang, L. X. (2014). Numerical investigation of sediment-laden flow in a high-head francis turbine runner. Adv. Mater. Res. 860-863, 1542–1546. doi:10.4028/www.scientific.net/AMR.860-863.1542
Zhang, J., Richardson, M. O. W., Wilcox, G. D., Min, J., and Wang ’, X. (1996). WEAR Assessment of resistance of non-metallic coatings to silt abrasion and cavitation erosion in a rotating disk test rig.
Keywords: Francis turbine, Pelton turbine, sediment erosion in turbine, experimental test setups, erosion models, material wear
Citation: Shrestha R, Gurung P, Chitrakar S, Thapa B, Neopane HP, Guo Z and Qian Z (2024) Review on experimental investigation of sediment erosion in hydraulic turbines. Front. Mech. Eng. 10:1526120. doi: 10.3389/fmech.2024.1526120
Received: 11 November 2024; Accepted: 28 November 2024;
Published: 20 December 2024.
Edited by:
Emanuel Willert, Technical University of Berlin, GermanyReviewed by:
Saša Milojević, University of Kragujevac Faculty of Engineering, SerbiaPaweł Tomczyk, Wroclaw University of Environmental and Life Sciences, Poland
Copyright © 2024 Shrestha, Gurung, Chitrakar, Thapa, Neopane, Guo and Qian. This is an open-access article distributed under the terms of the Creative Commons Attribution License (CC BY). The use, distribution or reproduction in other forums is permitted, provided the original author(s) and the copyright owner(s) are credited and that the original publication in this journal is cited, in accordance with accepted academic practice. No use, distribution or reproduction is permitted which does not comply with these terms.
*Correspondence: Sailesh Chitrakar, c2FpbGVzaEBrdS5lZHUubnA=; Hari Prasad Neopane, aGFyaUBrdS5lZHUubnA=
 Rakish Shrestha
 Prithivi Gurung
 Sailesh Chitrakar
 Bhola Thapa2
 Hari Prasad Neopane
 Zhongdong Qian