- College of Mechanical and Electrical Engineering, Ningbo Polytechnic, Ningbo, China
Background: User reviews of online shopping platforms can truly reflect users’ feelings about the use of products. They have the advantages of large sample size, wide range and uniform distribution, and can help optimize the perceptual model of product design.
Methods: The web crawler crawls user comments, and TFIDF-SP quantifies them. The principal component analysis method selects the perceptual evaluation index, the morphological analysis method disassembles the product into several main structures, and the BP neural network constructs the perceptual optimization model.
Results: Taking the paint tray as an example, according to the trained BP neural network, the shape factor combination with the highest perceptual evaluation value is predicted. The experimental results verify the accuracy of the model.
Conclusion: The model based on BP neural network has the ability to quickly and accurately combine the best form factors, improves the design efficiency of product design perceptual optimization, improves the rationality of product design, and provides a new idea for consumer demand market-oriented product design.
1 Introduction
Online shopping is a popular shopping channel at present. According to the (Internet power digital consumption development blue book) released by China Internet Network Information Center shows: the Internet continues to play an active role in promoting the development of new consumption patterns, driving the formation of new consumption hotspots, and promoting the rise of new consumer groups. Major Internet shopping platforms encourage users to publish product use evaluations. The characteristics of these evaluations mainly include commercial value, product characteristics, content diversity, emotional impact, authenticity and credibility. They can feedback users ' subjective feelings about products. The sample range is wide and evenly distributed. These have unique value for product design research. How to obtain useful information is a hot and difficult point for scholars at home and abroad.
In order to obtain the products that users are interested in, Hu and Liu (2004a) used WordNet to identify the sentiment polarity of reviews, and analyzed the user reviews corresponding to the sentiment feature data. This method has certain guiding significance for obtaining the products that users are interested in, but it pays less attention to the features when processing the online review feature data, and the extracted dimension is small. Jin et al. (2016) extracted representative opinions from product online reviews based on clustering ideas. Although this method can extract and analyze the information of user opinions from reviews, the amount of data is small and it is easy to cause under-fitting. Qi et al. (2016) established a filtering model of valuable reviews from the perspective of designers, and used the KANO model to analyze user opinions to improve products. Although this method has obtained the strategy of improving the product, it ignores the different preferences of different types of market segmentation, and the user preference analysis needs to be improved. Many scholars are committed to the research of emotional computing and effectiveness of online reviews, but the research on the application of online reviews in the field of product design is rare.
Stone and Choi (2013) collected 7,000 Twitter data related to smartphones by keyword search, and statistically analyzed users' preference for smartphone attributes. Das et al. (2014) used the REST method to obtain Twitter data and conducted a detailed analysis of Samsung Galaxy products. Ray and Chakrabarti (2017) analyzed the comprehensive evaluation results of smartphones based on Twitter data and visualized them. Park and Lee (2011) collected customer opinions from the customer center website and transformed them into customer needs through text mining technology. According to the co-occurrence rules between product features and evaluation words, Hu and Liu (2004b) proposed a frequent pattern feature extraction method based on association rules. This method uses part-of-speech tagging tools to extract nouns and noun phrases in online reviews, filters product features according to the frequency of occurrence, and uses association rules to extract adjectives similar to product features as evaluation words. Aiming at the problem that different users have different expressions of product features, Jin et al. (2016) introduced WordNet dictionary to identify synonyms of product features on the basis of frequent pattern feature extraction. According to the grammatical rule relationship between product features and evaluation words, Zhuang et al. (2006) proposed a dependency-based “feature-view” pair extraction method, which is realized by identifying the available dependency structure from the training set. According to the probability of product feature words, Chen et al. (Chen et al., 2015) proposed a product feature acquisition method based on Dirichlet topic model. On the basis of Dirichlet’s topic model, Ma et al. (2013) extended the product features by using a synonym dictionary. For products with a small number of features, Zhang et al. (2010) used a manually defined method to manually extract product features from the official product introduction. Zhang et al. (2015) used Word2Vec to cluster similar product features on the basis of manually defining product features. Jin et al. (2016) obtained the comparison results of the characteristics of competitive products and visualized them by focusing on the comparative views in online reviews of e-commerce platforms. Zhang et al. (2012) proposed a dictionary-based feature extraction algorithm and applied it to negative reviews to extract the shortcomings of different brands of products, providing guidance for enterprise product improvement.
Through the review and analysis of the current situation of product innovation design based on text big data, it can be seen that domestic and foreign scholars have conducted more research on product feature extraction and sentiment analysis in online reviews, but less online reviews and kansei engineering are combined for product innovation design.
In modern design, the results of users’ perceptual cognition of products can be transformed into design information and form design specifications. Under the guidance of these design specifications, designers can design products that meet the perceptual needs of users, thereby enhancing the competitiveness of products. Therefore, the construction of product perceptual design optimization model based on online shopping evaluation provides a reference value for product design oriented by consumer demand market.
This experiment integrates web crawler and natural language processing technology to extract consumers’ emotional image of products in kansei engineering research. Combined with the research of user perceptual cognitive measurement method and design application in kansei engineering, a perceptual optimization model of product design based on BP neural network is proposed.
This paper introduces the BP neural network prediction model, constructs the mapping relationship between product design elements and user satisfaction, trains and learns the model, and forms the final neural network model to predict the user satisfaction score of the new product design scheme into the market and avoid the design risk. The purpose has the following advantages:
(1) For designers, through a large number of data analysis, deep mining of user needs, and extraction of design elements can help designers quickly locate design directions and product pain points, and design products that are more in line with user needs.
(2) For enterprises: on the one hand, it emphasizes considerable and scientific receipt collection, data analysis and processing methods, and big data mining information, so as to realize efficient and comprehensive acquisition of product data in the process of product design and development, and solve the problems of incomplete data information collection, difficult data collection, invalid data and long design cycle in the process of traditional product design. On the other hand, a product prediction model is established to select the optimal solution in a more scientific way. In the market environment with fierce competition and short product iteration cycle, the combination of the two can save time cost, quickly target the market, shorten the product development cycle, improve product user satisfaction, and then improve product sales and achieve greater economic benefits of enterprises.
(3) For the research of innovative design methodology: the design method of “data-driven” + “model-driven” provides an important theory and support for the application and development of the interdisciplinary field of neural network, data-driven and product design. It provides more ideas for product innovative design methods, which is conducive to promoting the research of the new generation of intelligent product innovative design methods and promoting the research and development of product perceptual design methods.
2 Literature review
In view of the research content, this experiment uses “big data, kansei engineering, neural networks, product design” as the subject vocabulary, and conducts literature search on platforms such as “China National Knowledge Infrastructure” and “Web of Science.” It can be seen that in the field of neural network-assisted data-driven product perceptual design, many experts at home and abroad have also conducted research and application.
Salehan, Mohammad et al. used the sentiment mining method of big data analysis to predict the performance of online consumer reviews (Salehan and Kim, 2016); Ma et al. designed product architecture using predictable, data-driven product cluster design methods to capture trends in customer preferences and predict uncertainties in modeling (Jungmok and Harrison, 2016); Shao et al. (2020). proposed a simulation data-driven design method that combines dynamic simulation data mining with design optimization; Song and Luo (2017) proposed an iterative and heuristic method to comprehensively search patents to explore new design opportunities, which is helpful for patent data-driven design; by establishing a mathematical model, Georgiou et al. (2016) combined high adaptability, data-driven and multi-attribute value methods into product specifications and conceptual design, and developed an objective data-driven method to select the final conceptual design. It provides an optimized product for the market, reduces the overall development cost, and achieves customer satisfaction; Cano and Morisio (2019) have developed a data-driven neural network architecture for sentiment analysis.
2.1 Kansei engineering
Japanese scholar Professor Mitsuo Nagamachi began to study kansei engineering from the beginning of 1970, and published the first paper on kansei engineering in 1974 (Yan et al., 2008). Compared with traditional engineering, the most different research of kansei engineering lies in the study of users “sensibility.” Professor Mitsuo Nagamachi believes that sensibility is a kind of personal subjective impression obtained from a certain artificial product or environment by using vision, hearing, feeling, smell, taste, recognition and balance (Nagamachi, 1995). Therefore, kansei engineering is also known as “sensory engineering” or “emotional usability.” Kansei engineering quantifies all kinds of human sensibility by means of engineering. And find out the high-element function relationship between the perceptual quantity and the physical quantities in engineering, transform the user's perceptual demand for the product into the design elements of the product, and accurately complete the personalized design of the product according to the consumer's demand for the product image.
Kansei engineering includes four aspects: perceptual word collection, perceptual word selection, perceptual evaluation and mapping model. It is a bridge connecting user experience and design elements, and has been widely used in the field of product design. For the selection of perceptual words, Djatna and Kurniati (2015) proposed the TF-IDF method based on the frequency of perceptual words. Shieh and Yeh (2013) first clustered the collected perceptual words, and then selected the central word of the cluster as the final perceptual word. Razza and Paschoarelli (2015) pointed out that there is a correlation between user experience and product design elements, and proposed the use of kansei engineering to measure the strength of the correlation between the two. Djatna et al. (2015) used the principal component analysis method to obtain the perceptual words that best represent the Parisian culture, and obtained the design elements of aromatherapy products according to the Relief algorithm. Then, based on the fuzzy quantitative theory Class I, a model of customers with different personalities was established. On the basis of establishing the relationship between customer emotions and product design elements, aromatherapy products that can meet the needs of customers with different personalities and have Balinese cultural characteristics were developed. Tama et al. (2015) used kansei engineering and KANO model to design ceramic souvenirs that meet the needs of tourists. Shergian and Immawan (2015) used kansei engineering to design an alarm clock that meets the psychological needs of users. The above research has obtained the design that meets the needs of users by constructing the relationship model between user experience and product design elements. The research of kansei engineering in the world is booming. For example, the Institute of Ergonomics at the University of Nottingham in the United Kingdom is the earliest institution in Europe to study kansei engineering. Porsche Motor Company in Germany, Ford Motor Company in the United States, and Hyundai Motor Company in South Korea all benefit from the application research of kansei engineering. After years of development, a variety of effective and empirical research methods have been formed in the data collection and analysis of kansei engineering. The research mainly focuses on the following four areas:
(1) In the aspect of user intention acquisition and analysis method, Tsutsumi applied genetic algorithm to evaluate the aesthetics and economy of modeling design, applied neural network algorithm to calculate the perceptual evaluation obtained from questionnaire survey, applied finite element method to calculate stress to obtain economic evaluation, and finally applied fuzzy theory to calculate comprehensive satisfaction (Tsutsumi and Sasaki, 2008). Ogawa applied ontology engineering method to share perceptual concepts, transformed perceptual concepts into perceptual concept interpretation styles and modeled them, and constructed a perceptual concept sharing support system (Ogawa et al., 2009). Jindo applied the semantic difference method to study the user's perceptual image of the product and its relationship with the design elements, and established a knowledge base after multivariate analysis and quantification (Jindo et al., 1995).
(2) In the study of the correlation between perceptual demand and design elements, Lai applied the grey relational analysis model to analyze the mapping between product modeling elements and product perceptual image, and established the design knowledge base of kansei engineering system by using the methods of grey prediction and quantification theory (Lai et al., 2005).
(3) In the aspect of user preference research, Yan obtained the perceptual data of the product through the semantic difference method and the semantic variable, obtained the perceptual curve on the basis of the semantic score, and used the priority score clustering method to obtain the satisfaction of the product evaluation, and studied the user's image needs and personality preferences (Yan et al., 2008).
(4) In terms of modeling optimization and R & D prediction: Tsai et al.in order to meet the needs of product modeling design, used characteristic parameters to construct a three-dimensional model, and proposed a modeling evolutionary design method based on genetic algorithm (Hsiao and Tsai, 2005); Roy used network survey to analyze users ' perceptual image of products, and predicted the perceptual image value of new products based on the survey results (Roy et al., 2009).
2.2 Common technology of kansei engineering
The subjective evaluation method mainly adopts the form of questionnaire or customer interview. The commonly used methods are semantic difference method (Osgood, 1952), customer interview method (Chou, 2016), focus group interview method (Kim et al., 2019) and questionnaire survey method (Nur et al., 2017). For example, Trujillo et al., through the combination of semantic differential method and focus group interview method, identified the emotion and emotional factors behind the user evaluation space (Trujillo et al., 2017). Kim et al. found the perceptual attributes of satisfaction with ballpoint pens through the user’s rating of the use of ballpoint pens, combined with the house of quality (Kim et al., 2020). However, the subjective survey method and the interview method have the problems of long time, high cost and uncertain evaluation of perceptual vocabulary (Guo et al., 2020; Wang et al., 2019).
The biological signal measurement method speculates the user’s perception information by measuring and collecting various human physiological signals. The commonly used methods include eye tracking measurement (Qu and Guo, 2019), infrared spectroscopy and functional magnetic resonance imaging (Shi et al., 2019). For example, Guo et al. (2020) conducted research on semantic conflicts and visual stimulation materials through the N400 of related potentials, effectively identified perceptual words, and evaluated product design features. Shi et al. (2019) obtained the brain perceptual response data set through functional magnetic resonance imaging and proposed a perceptual modeling method. Although measuring biological signals can accurately measure user perception, this method has problems such as small sample size, few subjects, high cost, and longtime consumption.
In recent years, online shopping has brought about a sharp increase in online user reviews. Through the collection and analysis of user perceptual cognitive data through computer science, user perception acquisition under text mining has become a research hotspot. The commonly used methods are computer algorithms such as natural language learning and convolutional neural network. For example, Su et al. (2020) proposed a CNN-based product kansei label architecture; Jiao and Qu (2019) proposed a perceptual knowledge extraction method based on NLP; Martinez obtained knowledge for sensory evaluation through five senses: vision, taste, touch, smell and hearing, and proposed a sensory evaluation model based on linguistic decision analysis by using linguistic binary representation model (Herrera and Martinez, 2000; Martinez, 2007). The biggest advantage of this method is that it can extract more comprehensive user perceptual cognition from a large number of sample data.
In addition to measuring the user’s perceptual cognition, designers also need to transform the measurement results into design information and apply it to product design. The main method is to map the extraction of perceptual features to the physical attributes of the product. Tsai et al. (2007) established a correlation model between product color scheme and user emotional image through grey theory, neural network and genetic algorithm, and developed a computer-aided product color design system. Xue et al. (2020) proposed a comprehensive decision-making system based on perceptual optimization of product image design through the fuzzy logic sub-model in grey relational analysis (Xue et al., 2020). The correlation between these perceptual cognition and design methods can provide designers with effective design guidance and make the design more in line with user expectations.
Lai et al. (2019); Lai et al. (2022) proposed a method of kansei engineering design using user-generated big data. This method extracts consumers’ demand for product functional parameters from the perspective of e-commerce platform shopping comments by mining the comments of Internet users, especially in the application of new energy vehicle appearance design and smartphone configuration. Based on Transformer’s key phrase generation technology, Harth et al. (2023) established the relationship between original consumer data and technical requirements, design requirements and functional requirements, and used e-commerce consumer reviews as data sources. Transformer automatically generates product requirements. More researchers have introduced multimodal data to analyze user experience and capture user needs. Zhang et al. (2023) proposed a demand analysis idea based on the attention and emotion distribution of online reviews (importance Carnot analysis), and proposed a service optimization model covering three levels of supply chain, operation management and consumer experience from the application level. Guo et al. (2021) proposed a data-driven method to solve the user-oriented sentiment assessment method to assist the designer’s decision-making. Based on product data, Wang et al. (2018) paid attention to the construction of product emotional archives, so as to understand the gap between consumers “emotional response and manufacturers” intention, and generate ideal design schemes for each product.
2.3 BP neural network
Artificial neural network is a system that processes information by imitating the mechanism and function of biological neural network. As a kind of artificial neural network, BP neural network is usually used to establish the mapping relationship between product design elements and user’s perceptual image information in the process of using kansei engineering to design products, which can accurately transform user’s perceptual needs into product physical characteristics.
Yan and Chen (2016) took the robot head shape design as an example, and used the perceptual image combined with the BP neural network principle to construct the relationship model between the consumer perceptual image and the robot head shape elements. The validity and overall performance of the model were verified by sample test and SIM function. Mingyuan (2016) studied the modeling evaluation of XCMG excavator by using BP neural network model, which provided a systematic method for its modeling design and brand gene continuation. Yang et al. (2019) studied the perceptual image of shared car body styling features through BP neural network, calculated and analyzed the bionic design level of car body styling features by using neural network, obtained representative sample features, and carried out subsequent design transformation research. Based on the combination of text mining and neural network, Pu et al. (2017) of Southwest Jiaotong University constructed a perceptual image modeling design method for high-speed trains. Through text mining and sample morphological decomposition, the establishment of perceptual image evaluation matrix and morphological element deconstruction matrix of high-speed train was completed respectively. The relationship between perceptual image and morphological elements was established by BP neural network principle, and then the characteristic elements of the original sample were arranged and combined to generate different alternatives. To a certain extent, it simulates the designer’s thinking process in the modeling design process, and also explores the diversified methods for the modeling design of rail transit and attempts through computer-aided design. Huang (2020) analyzed the characteristics of user groups and industry attributes of miners’ safety helmets, and used BP neural network model to establish the matching relationship between design elements and users’ perceptual needs, that is, perceptual image mapping model. Then, the hierarchical weight analysis of each modeling element was carried out by the analytic hierarchy process. Finally, the design of the helmet was optimized by the model.
Through the above-mentioned specific application and decision-making ideas of BP neural network in the field of industrial design research, it can be concluded that BP neural network can effectively reflect the relationship between initial input data and target output data due to its nonlinear calculation characteristics. Therefore, it can be used to construct the mapping model relationship between product modeling feature elements and user perceptual images in the process of industrial product design. It is about to make a more accurate quantitative correlation between the product form design elements and the user’s perceptual image, so as to grasp the direction of product form design relatively accurately.
In the field of kansei engineering research, in order to ensure that the information and data analyzed by kansei evaluation have certain accuracy and relevance, many scholars have begun to try to use genetic algorithm and BP neural network to deal with the related problems of kansei evaluation parameters. The disadvantage of genetic algorithm is that the coding requirements are high when the research target is coded. Once the coding method is inaccurate and non-standard, the deviation of data processing will occur. Secondly, the operation efficiency of genetic algorithm is relatively low compared with other algorithms, which is prone to premature convergence. In this study, because the output of perceptual evaluation has a large degree of uncertainty, it will not only increase the difficulty of coding, but also lead to the problem of convergence in the process of population selection and iteration. At the same time, genetic algorithm not only ensures the validity and accuracy of higher data, but also requires higher accuracy of coding. If there is a problem, the results will be very different. The core algorithm of BP neural network is self-learning training through error feedback. It can learn and store a large number of input and output nonlinear mapping relationships, and can approximate any continuous function with minimal accuracy in a global nonlinear approximation way. It not only conforms to people’s nonlinear perceptual thinking mode, but also can deal with and complete complex nonlinear problems. Therefore, BP neural network has been widely used in the field of product optimization design by virtue of its own advantages.
In the process of product modeling design, the relationship between consumers’ perceptual cognition and product modeling design elements is a black box relationship model. Therefore, the nonlinear information processing technology of BP neural network can be used to construct the correlation model between perceptual image and modeling elements, and the nonlinear relationship between them can be established. The emotional evaluation of consumers and the design elements of products can be mapped, so that the modeling design of products is more in line with the perceptual needs of consumers.
Considering the characteristics of BP neural network, such as simple structure, easy operation and stable running state, this paper finally chooses BP neural network to construct neural network mapping model. The common implementation platforms for BP neural network model construction are Matlab and Python. Considering the advantages of Matlab toolbox in stability, maturity, ease of use, and integrated development environment, this paper finally uses MATLAB high-level language program to realize the training and construction of BP neural network model on Matlab platform.
2.4 Summary
In the past, kansei engineering often ended in the construction of a correlation prediction model between consumer emotional image and product design elements. As for the actual product design and evaluation verification of the constructed correlation model, almost no relevant scholars have followed up and deepened research. Although scholars at home and abroad have done a lot of research on user opinions in online review data, few studies have combined online reviews with kansei engineering. This experiment integrates web crawler and natural language processing technology to extract consumers’ emotional image of products in kansei engineering research. Combined with the research on the measurement method and design application of users’ perceptual cognition in kansei engineering, a perceptual optimization model of product design based on BP neural network is proposed. Taking the design of paint tray as an example to verify its effectiveness, it can alleviate the problems of excessive subjectivity, poor real-time performance and less data in traditional product design methods to a certain extent.
3 Perceptual optimization model construction of product design based on BP neural network
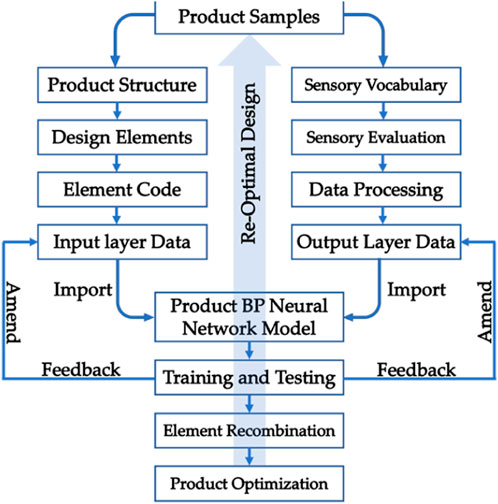
The research process is shown in Figure 1. Firstly, with the help of web crawler, the user’s perceptual evaluation of the online shopping platform is collected, and the evaluation text is processed by deduplication and synonym replacement. The principal component analysis is used to screen the perceptual evaluation index as the evaluation scale. Secondly, TFIDF-SP algorithm is used to extract the weight of perceptual evaluation index. The morphological analysis method is used to deconstruct the sample product, extract the representative elements, establish the design element morphological module space, encode each element module and construct the morphological factor coding matrix. The perceptual evaluation index weight and the morphological factor coding matrix are normalized to obtain the model training set. Finally, BP neural network training is carried out to establish the mapping relationship between perceptual evaluation and morphological factors, and the perceptual optimization model of product design is constructed.
3.1 Data processing
3.1.1 Evaluative text
From the perspective of production enterprises, product user reviews contain a large number of users’ subjective evaluations of product experience, which helps enterprises gain in-depth insights into consumer needs. Using user reviews as a data source to insight into user needs and guide or verify design methods, mainly through the massive user review data for opinion mining, fully understand the user’s experience of the product, so as to help designers understand user needs and provide accurate guidance for product optimization. For example, Saura and Palos-Sanchez (Ramon et al., 2018) conducted sentiment analysis and research on the user review data of hotels in Barcelona, and extracted positive, neutral and negative environmental design factors that affect the user’s all-round experience, so as to help hotels improve their service experience. In the study of sound image of electric razor, the multidimensional scaling method and cluster analysis were used to compress the samples into 34 representative samples and 3 groups of representative keywords. Then, the semantic difference method was used to evaluate the user’s emotional evaluation value (Lin et al., 2022).
Compared with the traditional demand research method, using network user reviews as data sources to obtain user demand data for products has the advantages of rich data volume, strong immediacy, and fast update speed. In addition, because the content of online reviews comes from consumers’ active sharing rather than passive Q & A, it can more truly reflect users’ needs.
The web crawler technology can automatically browse the information in the network according to certain rules. The crawled information will be saved in the local database by the crawler program for later analysis. The basic steps are shown in Figure 2.
1) Initiate a request. The crawler first needs to send an HTTP request to the target website to obtain the content of the web page, and can use the library in Python, such as urllib or request, to send the request.
2) Parsing web pages. After obtaining the content of the web page, the crawler needs to parse the web page and extract the required data. You can use libraries in Python, such as BeautifulSoup or lxml, to parse web pages in HTML or XML format.
3) Data extraction. According to the need, the crawler can extract the required data from the parsed web page by means of selector or regular expression. The library XPath in Python can be used for data extraction.
4) Data storage. The crawler can store the extracted data into a local file or database for subsequent processing and analysis. You can use libraries in Python, such as csv or MySQLdb, for data storage.
This experiment studies the relationship between product design elements and user satisfaction. In order to make the sample products representative, the principles of selecting sample products in this chapter are: (1) including high-end and low-end products; (2) Including domestic and foreign products; (3) The level of the parameters should be fully considered, the overall balance; (4) After meeting other requirements, the best-selling products are preferred to ensure that the sample products have sufficient amount of comment data.
In order to obtain information effectively, according to the actual situation, this experiment adopts the following methods to overcome the website to prevent automatic collection. (1) Construct a reasonable HTTP request header. The website will check the attribute information passed by the HTTP request header to the network server. Therefore, it is necessary to set the User-Agent attribute, Accept-Language attribute, etc. as content that is not easily suspected. For the website that will test Referer, it is necessary to add Headers and copy the browser’s UserAgent and Referer information to Headers. (2) Set the cookie. Websites that use cookies to identify and disable access can be accessed by disabling cookies or by storing a cookie on multiple pages. (3) Reduce the access frequency. Too high access frequency will attract the attention of the website and it is easy to be identified. Therefore, it can be avoided by reducing the access frequency. This frequency reduction method actually refers to the use of proxy IP instead of not visiting. (4) Note the implied input field values. The failure of the crawler is partly due to the fact that the website hides some elements that are not visible to the user in the HTML form, and these hidden characters happen to be the detection points of the website. Therefore, is _ displayed in Selenium can be used to detect whether hidden fields are visible, thus avoiding being blocked.
Multiple links were imported, and the user evaluation data of online reviews were crawled. After 2 h and 49 min, a total of more than 15 000 comments were crawled.
The user’s comments include four parts: the user’s comment content, the store’s reply, the additional comment content, and the store’s additional reply. Considering that the comments often contain false comments, repetitive malicious comments, etc., when crawling information, in addition to crawling the content of the text comment section, the comment sample number, comment time, and comment ID and other information are added to assist in identifying and filtering the text comment data.
Product review data is unstructured text data, which needs to be preprocessed for subsequent analysis.
3.1.1.1 Data cleansing
Due to the fact that some consumers choose to copy others’ comments in order to quickly obtain relevant rewards, there is a phenomenon of repeated text in the obtained text. Therefore, in order to ensure the uniqueness of the comment text and reduce the impact of repeated comments, it is necessary to delete the repeated comments on the text. In addition, some data with fewer words or only containing symbols, pictures and other data that cannot reflect valuable information also need to be cleaned up, and the repeated words of mechanical compression need to be deleted.
3.1.1.2 Participle clause
The comment data is composed of several words. The word segmentation process is the process of dividing the word sequence into individual words. Accurate word segmentation can increase the accuracy of subsequent data processing results. Common Chinese word segmentation tools include Jieba, SnowNLP, PkuSeg, THULAC and HanLP. This experiment uses Jieba word segmentation tool.
3.1.1.3 Part-of-speech tagging
The part of speech of a word is used to provide an abstract representation of the word, and the part of speech of the word in the sentence indicates the role played by the word. Part-of-speech tagging is a basic module in natural language processing. Part-of-speech tagging of text content is convenient for syntactic analysis and information extraction. The jieba. posseg module in Jieba is used for POS tagging.
3.1.1.4 Remove stop words
The mining of important information mainly depends on meaningful words. Meaningless words will increase the subsequent workload and reduce the accuracy of the mining results. In this experiment, such meaningless words are called stop words. Therefore, in order to facilitate the follow-up work, these stop words need to be deleted.
3.1.2 Emotional image adjective
After completing the sample cleaning, according to the actual situation of the web crawler grabbing comments, the results are analyzed by principal component analysis. According to the cumulative factor contribution rate and the rotated component matrix, the representative perceptual image adjectives are specifically determined as the perceptual evaluation index, which is prepared for the next use of TFIDF-SP algorithm to calculate the weight of each sample.
TFIDF algorithm is an important algorithm for feature word analysis in vector space model. IDF belongs to the inverse document frequency. As the number of documents continues to increase, the parameter also continues to decrease. Using this feature word cannot achieve the goal of accurately distinguishing document categories. TF is the word frequency. With the increase of the frequency of the feature word, the corresponding weight is also larger. It can be judged that the feature word achieves stronger document discrimination performance at this time. The following is the TFIDF calculation formula:
In Formula 1, t is the frequency of the word t in the mth document, N is the number of all documents, and n is the number of documents containing the word t. The TFIDF algorithm is used to efficiently filter the words in the uniform state, but it is also necessary to note that this algorithm has a large defect to overcome. When calculating the contribution, only the influence of the frequency of the feature words is analyzed, and the position and part of speech of the feature words are not studied. Under different part of speech and position conditions, there are also obvious differences in the meaning of the actual expression of the feature words. Among them, nouns and verbs can obtain stronger thematic expression than adjectives, and achieve more accurate expression effect on documents. When words appear in the title area, they can obtain more important meaning than the text area.
Aiming at the defects of TFIDF algorithm, this paper designs an improved TFIDF- SP algorithm. Through the weight coefficient, the part of speech and position are comprehensively analyzed and the composite weight is established. The feature weighting is calculated and combined with the TFIDF method to distinguish the importance of feature words in different parts of the document. The corresponding calculation formula is given below:
In Formula 2,
3.1.3 Form factor coding matrix
The product samples are deconstructed by morphological analysis method, the key modeling elements are summarized, and the possible morphological factors of each modeling element are listed, and the coding matrix of product morphological factors is constructed (Equation 3).
Among them,
Before the neural network prediction, it is necessary to complete the data normalization processing, so as to eliminate the magnitude difference between the different characteristic data of the input and output layers, and reasonably solve the problem of large network prediction error caused by the large magnitude difference. The min-max normalization method is used to normalize the input and output layer indicators, and the expression is as follows (Equation 4):
The normalization function of this experiment uses the MATLAB function mapminmax, the method is as follows:
%input_train, output_train are training input and output data respectively [inputn, inputps] = mapminmax(input_train); [outputn, outputps] = mapminmax(output_train);
Input _ train and output _ train are training input and output raw data. Inputn and outputn are normalized data. Inputps and outputps are the structures obtained after data normalization. They contain information such as maximum value, minimum value and average value of data, which can be used for test data normalization. The test data normalization procedure is as follows:
inputn_test = mapminmax(‘apply’, input_test, inputps);
Input _ test is the predicted input data, and inputn _ test is the normalized predicted data. “apply” means that the input _ test is normalized according to the value of inputps.
3.2 Model building
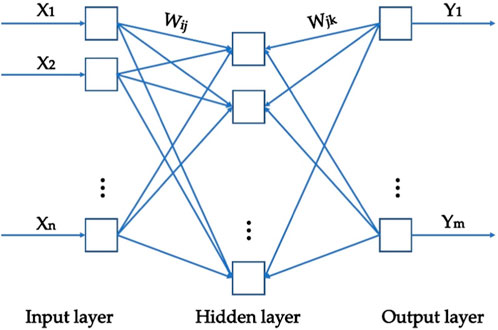
The mapping relationship between multidimensional data is constructed, and the BP neural network model shown in Figure 3 is selected.
The structure of BP neural network is generally composed of input layer, output layer and hidden layer. The sample deconstruction and the image description vocabulary score determine the number of units in the input and output layers of the BP neural network. At this time, the BP neural network can be regarded as a nonlinear function. The input value and the output value are the independent variables and the dependent variables of the function, respectively.
Before this prediction, BP neural network should be trained first. Through training, the network has associative memory and predictive ability, including the following steps:
Step 1: Network initialization. According to the system input and output sequence (X, Y), the number of network input layer nodes
Step 2: Hidden layer output calculation. According to the input variable
Step 3: Output layer output calculation. According to the hidden layer output
Step 4: Error calculation. According to the network prediction output
Step 5: Weight update. According to the network prediction error
Step 6: Threshold update. According to the network prediction error
Step 7: Determine whether the algorithm iteration is over. If it is not over, return step 2.
The algorithm flow chart is shown in Figure 4.
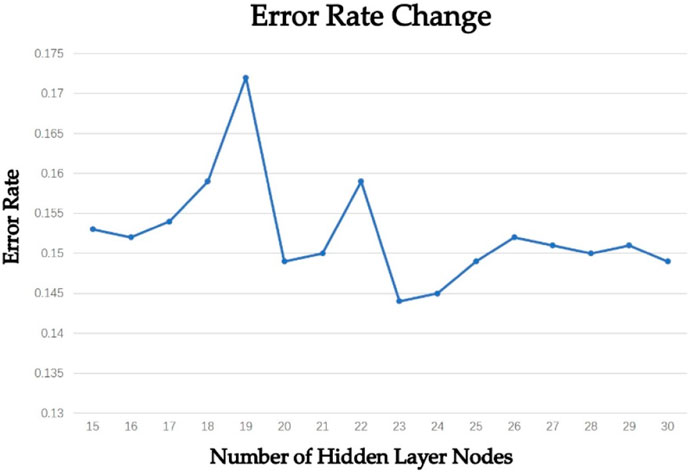
Before the test, the number of neuron nodes in the hidden layer needs to be set. The number of nodes is too small, the network cannot learn well, the number of training needs to be increased, and the accuracy of training is also affected. The number of nodes is too many, the training time increases, and the network is easy to over-fit, which has an adverse effect on the prediction accuracy of the network. In this paper, the number of neuron nodes in the hidden layer is set to refer to the number of units in the normal hidden layer, with reference to the following formulas (Equations 13–15):
3.3 Model prediction
According to the coding matrix of product modeling elements, all the morphological factors appearing in it are arranged and combined to obtain all possible morphological factor combinations. The combination of these morphological factors is input into the completed user perceptual evaluation model, and the corresponding perceptual evaluation index prediction value is output. The combination with the highest predicted value of each perceptual evaluation index is selected as the optimal combination of morphological factors.
4 Verification and discussion
4.1 Product sample and text acquisition
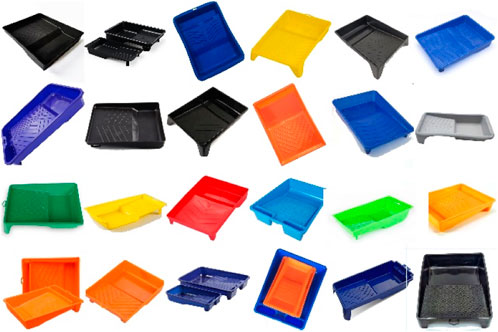
This experiment takes the paint tray as the research object. This paper selects products with a significant difference in the shape of an online shopping platform and more than 15,000 recent effective user comments. With the help of Python web crawler code, the evaluation text and photos are captured, and a total of 24 product samples that meet the standards are obtained (Figure 6).
4.2 Quantification of product perceptual image adjectives
According to the processing results of the TFIDF-SP algorithm, combined with the actual situation of the user’s comment content, in the collected 92 groups of image evaluations, the KJ method and the Delphi method were used to screen out eight groups of highly expressive perceptual word pairs. They are: convenient-inconvenient, ugly-beautiful, traditional-fashionable, rigid-curved, complex-simple, stagnant-smooth, suitable-unsuitable, thick-thin. SPSS software was used to analyze the results.
4.2.1 Data reliability analysis
For the reliability analysis of the data, this paper uses the data statistical analysis software SPSS to verify the stability and consistency of the questionnaire data. The principle of SPSS reliability analysis is to test the same object several times. The purpose of reliability analysis is to verify the rationality of the design of the questionnaire. If the design of the questionnaire is reasonable and reliable, the results of multiple tests should have a small gap and high stability. The main purpose of the consistency test is to verify whether the questions of the questionnaire design can clearly reflect the subject. The higher the consistency, the higher the reliability, the smaller the measurement error, and the higher the reliability. SPSS reliability analysis usually uses the value of Cronbach’s α coefficient reliability to reflect the reliability of the questionnaire. The value of Cronbach’s α is in the range of 0–1. Generally speaking, the closer the value of Cronbach’s α is to 1, the better the reliability of the questionnaire is. When the reliability is less than 0.3, the reliability of the questionnaire is not credible; in the range of 0.3–0.4, the questionnaire is a preliminary study, barely credible; a little believable in the 0.4–0.5 range; in the range of 0.5–0.7, the data is credible; in the range of 0.7–0.9, the data is very credible; when the reliability is greater than 0.9, the data has high reliability. After sorting out the questionnaire data, this experiment uses SPSS data statistical software to test the reliability of the questionnaire data. The comprehensive Cronbach’s α value is within the range of 0.7–0.9, which meets the reliability requirements, and the data reliability is relatively high (Table 1).
4.2.2 Data validity analysis
Validity analysis is usually evaluated from two aspects. On the one hand, it is content validity. Content validity mainly analyzes whether the questionnaire data fits the theme and whether there is good independence between variables. On the other hand, it is structural validity, which analyzes the logic of variables and the rationality of the structure. In the validity analysis stage, this experiment uses SPSS software to evaluate the validity of the questionnaire. Usually, the data should first pass the content validity test to determine whether the questionnaire data can pass the validity test, and then carry out the structural validity test in the next stage.
Content validity test: KMO and Barlett’s sphericity test were performed on the data, and the results are shown in Table 2. The results show that the KMO value was 0.728, which was greater than 0.5; The significance of the Barlett’s sphericity test was 0, less than 0.01, indicating that there is a strong correlation between variables, and the correlation matrix is not a unit matrix. The test results show that the data is suitable for principal component analysis.
4.2.3 Quantification of image adjectives
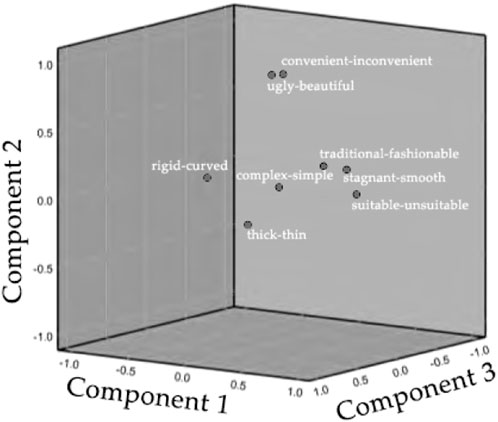
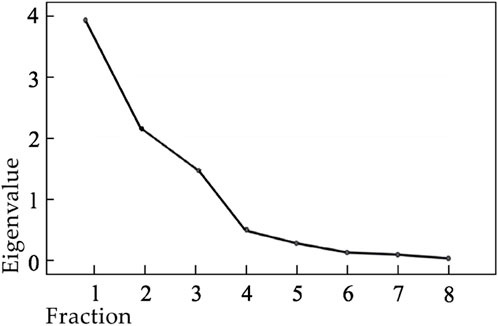
According to the scatter load diagram (Figure 7), gravel diagram (Figure 8) and the cumulative factor contribution rate, the factors can be divided into three categories.
The rotated component matrix is shown in Table 3. According to the rotated component matrix, the perceptual adjectives with the largest load of each component factor are selected as the perceptual evaluation index, which are “suitable-unsuitable”, “convenient-inconvenient”, “thick-thin”, respectively. The selected perceptual evaluation index can represent the remaining perceptual adjectives of the component. Summarizing its meaning, “suitable-un suitable” reflects the overall satisfaction of the product and is summarized as a comprehensive index; “convenient-inconvenient” refers to the experience of product use, which is summarized as an operational indicator; “thick-thin” reflects the reliability of the product and is summarized as a reliability index.
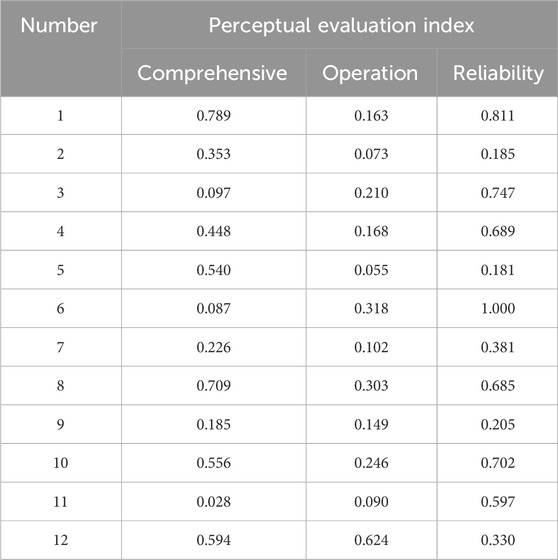
According to the principles shown in Formulas 1–3, the Python program is used to calculate the TFIDF-SP weight of each sample’s perceptual evaluation index as the training set of the neural network output. The weight data of each sample’s perceptual evaluation index is shown in Table 4.
4.3 Product form factor extraction
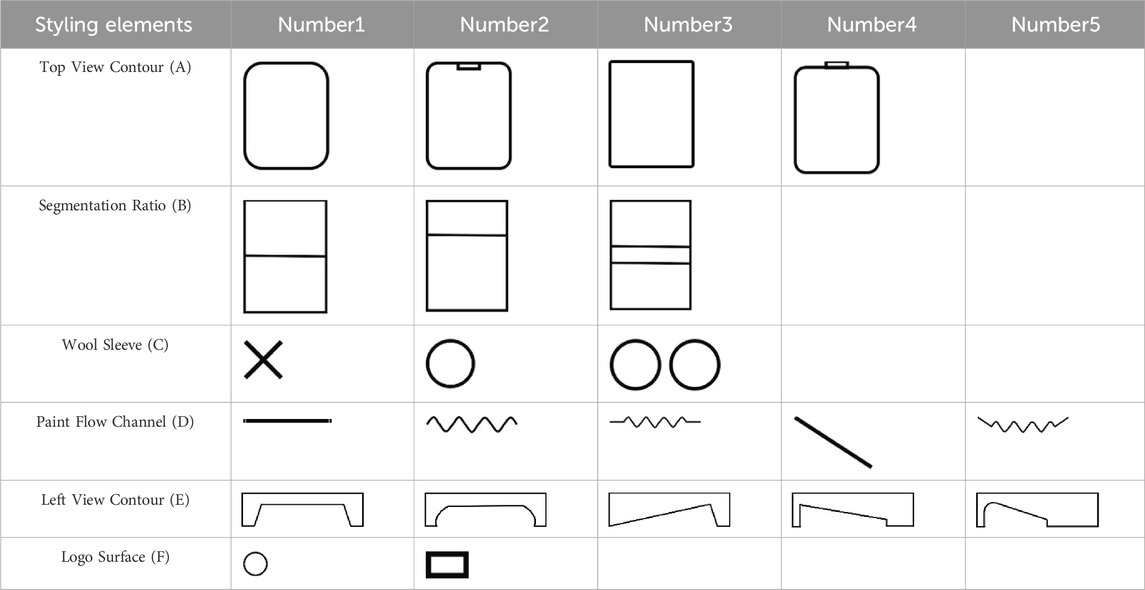
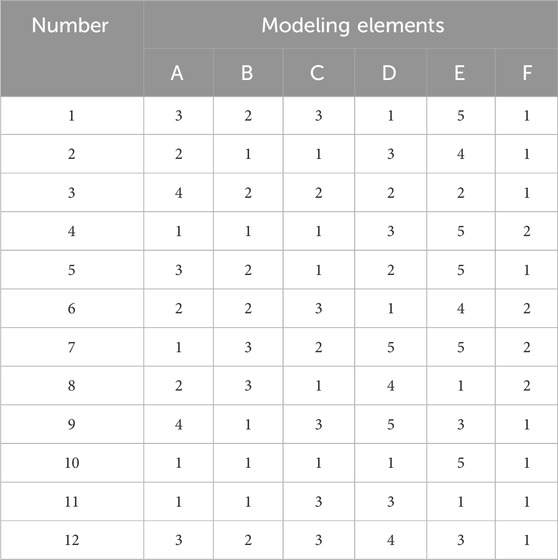
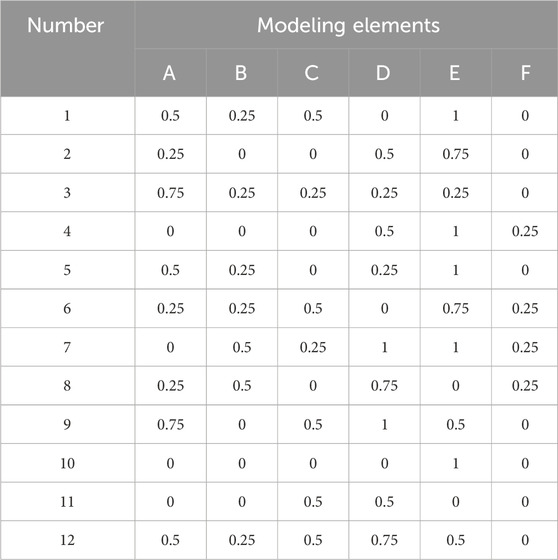
The target product is structured by morphological analysis method, the key modeling elements of the sample are summarized and the possible morphological factors of each modeling element are listed. The top view contour, segmentation ratio, wool sleeve, paint flow channel, left view contour and LOGO surface of the paint tray are summarized and coded according to A-F. The sub-item morphological factors are numbered with discrete data 1–5 as the training set of neural network input. The specific coding method is shown in Table 5, and the coding matrix of some sample shape factors is shown in Table 6.
The TFIDF-SP weight data of the perceptual evaluation index and the sample shape factor coding matrix are normalized by min-max, and mapped to the 0–1 interval to obtain the final sample for neural network training. The normalized results of perceptual evaluation index and sample shape factor coding are shown in Table 7 and Table 8 respectively.
4.4 Product model construction
The Matlab software is used to construct the user’s perceptual evaluation model and predict the values in the perceptual evaluation of the combination of morphological factors. The learning rate is 0.001, and the number of hidden layer neurons is determined according to Formulas 13–15. L1 regularization is used to prevent over-fitting during training. The regularization term is set to 0.005, the number of learning times is limited to 20,000 times, and the target error is 0.001.
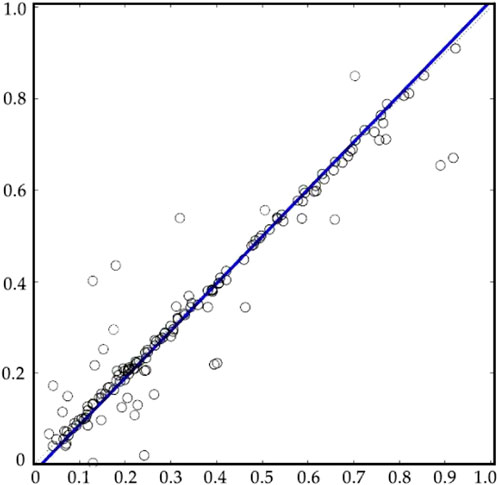
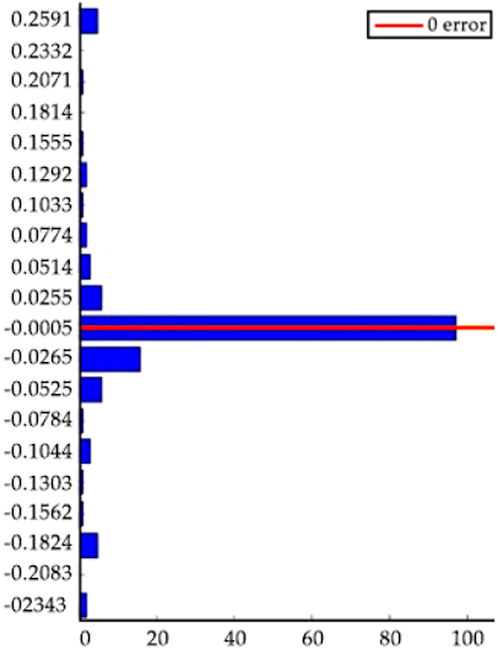
18 groups of data were randomly selected from 24 groups of samples normalized perceptual evaluation index data to train BP neural network, 3 groups of data were used as model verification data, and 3 groups of data were used as test data. The mean square error and the coefficient of determination are used as the evaluation criteria of the model constructed by the neural network. The regression diagram and error histogram of the user’s perceptual evaluation model are shown in Figures 9, 10, and the quality meets the requirements.
4.5 Product forecast and production
According to the perceptual evaluation index obtained from the combination of all morphological factors, the higher prediction results are shown in Table 9.
In order to emphasize the attractiveness of product form factors to consumers, this experiment selects the highest combination of each index. The results showed that the highest morphological factor combination of the comprehensive index was (A4, B2, C1, D5, E5, F2), and the predicted value was 3.417. The combination of morphological factors with the highest predicted value of operation index was (A1, B3, C1, D2, E2, F1), and the predicted value was 1.431. The highest morphological factor combination of the predicted value of the reliability index is (A4, B2, C3, D4, E4, F2), and the predicted value is 3.133. According to the combination of morphological factors predicted by the user evaluation model, the design scheme is made, as shown in Figure 11.
Highest comprehensive index is reflected in the optimization design of size, flow channel and other details. The Highest operation index is reflected in the provision of two paint storage areas for easy operation. The Highest reliability index is reflected in the provision of two roll brush storage areas, and the handheld area conforms to ergonomics.
4.6 Product solution validation
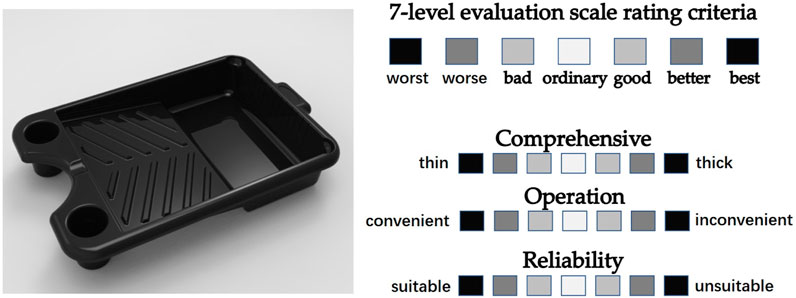
In order to verify the accuracy of the model prediction results constructed by BP neural network based on the user’s perceptual evaluation of online shopping platform, a Likert 7-lever scale is established for the selected three perceptual evaluation indexes, and the measurement is gradually enhanced, as shown in Figure 12.
The test samples are composed of the highest combination scheme of each index prediction score and 17 samples randomly selected. In order to ensure the accuracy of the questionnaire results, all the pictures were grayed and the background, brand LOGO were removed. A total of 60 respondents were interviewed, including 20 teachers and students majoring in design, 10 consumers with online shopping experience and 30 anonymous respondents on the Internet. 56 valid questionnaires were recovered, and the recovery rate was 93.3%. The Pearson correlation coefficient between the sample perceptual evaluation index and the questionnaire results is calculated. The calculation formula is as follows (Equation 16):
The calculation results show that the correlation coefficient between the questionnaire results and the model prediction values is between 0.65 and 0.79. It shows that there is a strong correlation between the two, which reflects that the prediction results of the user perceptual evaluation model based on BP neural network have a guiding role in product design.
5 Conclusion
5.1 Conclusions of the study
Using the web crawler combined with the TFIDF-SP algorithm to obtain the perceptual evaluation index data of the online shopping platform users for the product. The principal component analysis method was used to screen and summarize the results into three perceptual evaluation indexes of synthesis, operation and reliability, which were used as the evaluation scale of product form factor combination. Using morphological analysis method, the product sample is disassembled into six modeling elements. Based on BP neural network, the mapping relationship between the two is constructed, and the user perceptual evaluation model of paint tray modeling design is established. In the combination of all the morphological factors formed, the optimal combination of morphological factors under three perceptual evaluation indexes is determined, and the corresponding design scheme is obtained. The Pearson correlation coefficient between the questionnaire survey and the model prediction results is between 0.65 and 0.79, which verifies the accuracy of the prediction results.
5.2 Future research directions
Due to the limitation of space, this paper does not involve factors such as color, material and size that may affect users “perceptual evaluation, nor does it conduct in-depth analysis of the impact of users” false evaluation and other behaviors. In the later work, the method of eliminating the factors affecting the experimental results will be studied to further improve the accuracy of the results and the design reference value.
Data availability statement
The raw data supporting the conclusions of this article will be made available by the authors, without undue reservation.
Author contributions
LY: Writing–original draft, Writing–review & editing.
Funding
The author(s) declare that no financial support was received for the research, authorship, and/or publication of this article.
Conflict of interest
The author declares that the research was conducted in the absence of any commercial or financial relationships that could be construed as a potential conflict of interest.
Generative AI statement
The author(s) declare that no Generative AI was used in the creation of this manuscript.
Publisher’s note
All claims expressed in this article are solely those of the authors and do not necessarily represent those of their affiliated organizations, or those of the publisher, the editors and the reviewers. Any product that may be evaluated in this article, or claim that may be made by its manufacturer, is not guaranteed or endorsed by the publisher.
References
Cano, Erion, and Morisio, Maurizio (2019). A data-driven neural network architecture for sentiment analysis. Data Technol. Appl. 53 (1), 2–19. doi:10.1108/dta-03-2018-0017
Chen, K., Kou, G., Shang, J., and Chen, Y. (2015). Visualizing market structure through online product reviews: integrate topic modeling, TOPSIS, and multi-dimensional scaling approaches. Electron. Commer. Res. Appl. 14 (1), 58–74. doi:10.1016/j.elerap.2014.11.004
Chou, J. R. (2016). A kansei evaluation approach based on the technique of computing with words. Adv. Eng. Inf. 30 (1), 1–15. doi:10.1016/j.aei.2015.11.001
Das, T. K., Acharjya, D. P., and Patra, M. R. (2014). “Opinion mining about a product by analyzing public tweets in Twitter,” in 2014 international conference on computer communication and informatics, 1–4.
Djatna, T., and Kurniati, W. D. (2015). A system analysis and design for packaging design of powder shaped fresheners based on Kansei engineering. Procedia Manuf. 4, 115–123. doi:10.1016/j.promfg.2015.11.021
Djatna, T., Wrasiati, L. P., and Santosa, I. B. D. Y. (2015). Balinese aromatherapy product development based on Kansei Engineering and customer personality type. Procedia Manuf. 4, 176–183. doi:10.1016/j.promfg.2015.11.029
Georgiou, Aris, Haritos, George, Fowler, Moyra, and Imani, Y. (2016). Attribute and technology value mapping for conceptual product design phase. J. Mech. Eng. Sci. 230 (11), 1745–1756. doi:10.1177/0954406215585595
Guo, Fu, Qu, Q., Nagamachi, M., and Duffy, V. G. (2020). A proposal of the event-related potential method to effectively identify kansei words for assessing product design features in kansei engineering research. Int. J. Industrial Ergonomics 76, 102940. doi:10.1016/j.ergon.2020.102940
Guo, F., Hu, M., Duffy, V. G., Shao, H., and Ren, Z. (2021). Kansei evaluation for group of users: a data-driven approach using dominance-based rough sets. Adv. Eng. Inf. 47, 101241. doi:10.1016/j.aei.2020.101241
Harth, P., Jähde, O., Schneider, S., Horn, N., and Buchkremer, R. (2023). From data to human-readable requirements: advancing requirements elicitation through language-transformer-enhanced opportunity mining. Algorithms 16 (9), 403. doi:10.3390/a16090403
Herrera, F., and Martinez, L. (2000). A 2-tuple fuzzy linguistic representation model for computing with words. IEEE Trans. Fuzzy Syst. 8 (6), 746–752. doi:10.1109/91.890332
Hsiao, S. W., and Tsai, H. C. (2005). Applying a hybrid approach based on fuzzy neural network and genetic algorithm to product form design. Int. J. Industrial Ergonomics 35 (5), 411–428. doi:10.1016/j.ergon.2004.10.007
Hu, M., and Liu, B. (2004a). Mining opinion features in customer reviews. Am. Assoc. Artif. Intell. 69 (4735), 755–760.
Hu, M., and Liu, B. (2004b). “Mining and summarizing customer reviews,” in Proceedings of the tenth ACM SIGKDD international conference on Knowledge discovery and datamining, 168–177.
Huang, T. (2020). Innovative design of mine safety helmet products based on perceptual image evaluation [ D ]. Xuzhou: China University of Mining and Technology.
Jiao, Y., and Qu, Q. (2019). A proposal for kansei knowledge extraction method based on natural language processing technology and online product reviews. Comput. Industry 108, 1–11. doi:10.1016/j.compind.2019.02.011
Jin, J., Ji, P., and Gu, R. (2016). Identifying comparative customer requirements from product online reviews for competitor analysis. Eng. Appl. Artif. Intell. 49, 61–73. doi:10.1016/j.engappai.2015.12.005
Jindo, T., Hirasago, K., and Nagamachi, M. (1995). Development of a design support system for office chairs using 3-D graphics. Int. J. Industrial Ergonomics 15 (1), 49–62. doi:10.1016/0169-8141(94)00056-9
Jungmok, M. A., and Harrison, K. I. M. (2016). Product family architecture design with predictive, data driven product family design method. Res. Eng. Des. 27 (1), 5–21. doi:10.1007/s00163-015-0201-4
Kim, K., Proctor, R. W., and Salvendy, G. (2020). Emotional factors and physical properties of ballpoint pens that affect user satisfaction: implications for pen and stylus design. Appl. Ergon. 85, 103067. doi:10.1016/j.apergo.2020.103067
Kim, W., Taehoon, K., Iisun, R., and Yun, M. H. (2019). Mining affective experience for a kansei design study on a recliner. Appl. Ergon. 74, 145–153. doi:10.1016/j.apergo.2018.08.014
Lai, H. H., Lina, Y. C., and Yeh, C. H. (2005). Form design of product image using grey relational analysis and neural network models. Int. J. Industrial Ergonomics 32 (10), 2689–2711. doi:10.1016/j.cor.2004.03.021
Lai, X., Zhang, Q., Chen, Q., Huang, Y., Mao, N., and Liu, J. (2019). The analytics of product-design requirements using dynamic internet data: application to Chinese smartphone market. Int. J. Prod. Res. 57 (18), 5660–5684. doi:10.1080/00207543.2018.1541200
Lai, X., Zhang, S., Mao, N., Liu, J., and Chen, Q. (2022). Kansei engineering for new energy vehicle exterior design: an internet big data mining approach. Comput. & Industrial Eng. 165, 107913. doi:10.1016/j.cie.2021.107913
Lin, Z., Woo, J., Luo, F., and Chen, Y. (2022). Research on sound imagery of electric shavers based on kansei engineering and multiple artificial neural networks. Appl. Sci. 12, 10329. doi:10.3390/app122010329
Ma, B., Zhang, D., Yan, Z., and Kim, T. (2013). An LDA and synonym lexicon based approach to product feature extraction from online consumer product reviews. J. Electron. Commer. Res. 14 (4), 304.
Martinez, L. (2007). Sensory evaluation based on linguistic decision analysis. Int. J. Approx. Reason. 44 (2), 148–164. doi:10.1016/j.ijar.2006.07.006
Mingyuan, D. (2016). Evaluation of modeling design of XCMG excavator based on BP neural network. Xuzhou: China University of Mining and Technology.
Nagamachi, M. (1995). Kansei engineering: a new ergonomic consumer-oriented technology for product development. Int. J. Industrial Ergonomics 15 (1), 3–11. doi:10.1016/0169-8141(94)00052-5
Nur, R. C., Widyo, L. P., and Nagamachi, M. (2017). Factor analysis of kansei words for female batik clothes using three stages research: looking, touching, and wearing. Adv. Sci. Lett. 23 (1), 100–103. doi:10.1166/asl.2017.7169
Ogawa, T., Nagai, Y., and Ikeda, M. (2009). An ontological approach to designers idea explanation style: towards supporting the sharing of Kansei-ideas in textile design. Adv. Eng. Inf. 23 (2), 157–164. doi:10.1016/j.aei.2008.10.001
Osgood, CHARLES E. (1952). The nature and measurement of meaning. Psychol. Bull. 49 (3), 197–237. doi:10.1037/h0055737
Park, Y., and Lee, S. (2011). How to design and utilize online customer center to support new product concept generation. Expert Syst. Appl. 38 (8), 10638–10647. doi:10.1016/j.eswa.2011.02.125
Pu, J., Yanlai, L., and Liu, Z. (2017). Image modeling design of high-speed train based on text mining and neural network [ J ]. Mech. Des. 34 (09), 101–105.
Qi, J., Zhang, Z., Jeon, S., and Zhou, Y. (2016). Mining customer requirements from online reviews: a product improvement perspective. Inf. & Manag. 53 (8), 951–963. doi:10.1016/j.im.2016.06.002
Qu, Q., and Guo, F. (2019). Can eye movements be effectively measured to assess product design? Gender differences should be considered. Int. J. Industrial Ergonomics 72, 281–289. doi:10.1016/j.ergon.2019.06.006
Ramon, SAURA J., Pedro, PALOS SANCHEZ, and Angel, RIOS M. M. (2018). Attitudes expressed in online comments about environmental factors in the tourism sector: an exploratory study. Int. J. Environ. Res. Public Health 15 (3), 553. doi:10.3390/ijerph15030553
Ray, P., and Chakrabarti, A. (2017). Twitter sentiment analysis for product review using lexicon method. Int. Conf. Data Manag. Anal. Innovation, 211–216. doi:10.1109/icdmai.2017.8073512
Razza, B., and Paschoarelli, L. C. (2015). Affective perception of disposable razors: a kansei engineering approach. Procedia Manuf. 3, 6228–6236. doi:10.1016/j.promfg.2015.07.750
Roy, R., Goatman, M., and Khangura, K. (2009). User-centric design and Kansei engineering. CIRP J. Manuf. Sci. Technol. 1 (3), 172–178. doi:10.1016/j.cirpj.2008.10.007
Salehan, Mohammad, and Kim, Dan (2016). Predicting the performance of online consumer reviews: a sentiment mining approach to big data analytics. Decis. Support Syst. 81 (1), 30–40. doi:10.1016/j.dss.2015.10.006
Shao, Y., Zhu, H., Wang, R., Liu, Y., and Liu, Y. (2020). A simulation data-driven design approach for rapid product optimization. J. Comput. Inf. Sci. Eng. 20 (2), 1–12. doi:10.1115/1.4045527
Shergian, A., and Immawan, T. (2015). Design of innovative alarm clock made from bamboo with kansei engineering approach. Agric. Agric. Sci. Procedia 3, 184–188. doi:10.1016/j.aaspro.2015.01.036
Shieh, M. D., and Yeh, Y. E. (2013). Developing a design support system for the exterior form of running shoes using partial least squares and neural networks. Comput. &Industrial Eng. 65 (4), 704–718. doi:10.1016/j.cie.2013.05.008
Shi, F., Dey, N., Ashour, A. S., Sifaki-Pistolla, D., and Sherratt, R. S. (2019). Meta-kansei modeling with valence-arousal fMRI dataset of brain. Cogn. Comput. 11 (2), 227–240. doi:10.1007/s12559-018-9614-5
Song, B., and Luo, J. (2017). Mining patent precedents for data-driven design: the case of spherical rolling robots. J. Mech. Des. 139 (11), 111420. doi:10.1115/1.4037613
Stone, T. M., and Choi, S.-K. (2013). “Consumer preference estimation from Twitter classification: validation and uncertainty analysis,” in Proceedings of the 19th International conference on engineering design, 457–466.
Su, Z., Yu, S., Chu, J., Zhai, Q., Gong, J., and Fan, H. (2020). A novel architecture: using convolutional neural networks for kansei attributes automatic evaluation and labeling. Adv. Eng. Inf. 44, 101055. doi:10.1016/j.aei.2020.101055
Tama, I. P., Azlia, W., and Hardiningtyas, D. (2015). Development of customer oriented product design using Kansei engineering and Kano model: case study of ceramic souvenir. Procedia Manuf. 4, 328–335. doi:10.1016/j.promfg.2015.11.048
Trujillo, H., Antoni, M. I., and Millán, C. L. (2017). User evaluation of neonatology ward design. HERD 10 (2), 23–48. doi:10.1177/1937586716641275
Tsai, H. C., Hung, C. Y., and Hung, F. K. (2007). Computer aided product color design with artificial intelligence. Computer-aided Des. Appl. 4 (1-4), 557–564. doi:10.1080/16864360.2007.10738575
Tsutsumi, K., and Sasaki, K. (2008). Study on shape creation of building S roof by evaluating aesthetic sensibility. Math. Comput. Simul. 77 (5/6), 487–498. doi:10.1016/j.matcom.2007.11.022
Wang, W. M., Li, Z., Liu, L., Tian, Z. G., and Tsui, E. (2018). Mining of affective responses and affective intentions of products from unstructured text. J. Eng. Des. 29 (7), 404–429. doi:10.1080/09544828.2018.1448054
Wang, W. M., Wang, J. W., Li, Z., Tian, Z., and Tsui, E. (2019). Multiple affective attribute classification of online customer product reviews: a heuristic deep learning method for supporting kansei engineering. Eng. Appl. Artif. Intell. 85, 33–45. doi:10.1016/j.engappai.2019.05.015
Xue, L., Yi, X., and Zhang, Y. (2020). Research on optimized product image design integrated decision system based on kansei engineering. Appl. Sci. 10 (4), 1198. doi:10.3390/app10041198
Yan, H., Huynh, V. H., Murai, T., and Nakamori, Y. (2008). Kansei evaluation based on prioritized multi-attribute fuzzy target-oriented decision analysis. Inf. Ences Int. J. 178 (21), 4080–4093. doi:10.1016/j.ins.2008.06.023
Yan, Z., and Chen, G. (2016). Research on head shape design of service robot based on perceptual engineering and BP neural network. Pack. Eng. 37 (14), 63–67. doi:10.19554/j.cnki.1001-3563.2016.14.015
Yang, H., Jia, R., and Ying, Z. Analysis of bionic design characteristics of shared car based on BP neural network Mech. Des., 2019,36 (08): 125–129.
Zhang, D., Xu, H., Su, Z., and Xu, Y. (2015). Chinese comments sentiment classification based onword2vec and SVMperf. Expert Syst. Appl. 42 (4), 1857–1863. doi:10.1016/j.eswa.2014.09.011
Zhang, K., Narayanan, R., and Choudhary, A. N. (2010). Voice of the customers: mining online customer reviews for product feature-based ranking. WOSN 10, 11.
Zhang, W., Xu, H., and Wan, W. (2012). Weakness Finder: find product weakness from Chinese reviews by using aspects based sentiment analysis. Expert Syst. Appl. 39 (11), 10283–10291. doi:10.1016/j.eswa.2012.02.166
Zhang, D., Shen, Z., and Li, Y. (2023). Requirement analysis and service optimization of multiple category fresh products in online retailing using importance-Kano analysis. J. Retail. Consumer Serv. 72, 103253. doi:10.1016/j.jretconser.2022.103253
Keywords: kansei engineering, BP neural network, algorithm model, product design optimization, paint tray
Citation: Yong L (2024) Product perceptual design optimization model based on BP neural network. Front. Mech. Eng. 10:1503182. doi: 10.3389/fmech.2024.1503182
Received: 28 September 2024; Accepted: 11 November 2024;
Published: 26 November 2024.
Edited by:
Qingjin Peng, University of Manitoba, CanadaReviewed by:
Jing Guo, Tianjin University of Finance and Economics, ChinaKang Wang, Tianjin University of Commerce, China
Jinpu Zhang, Hebei Vocational University of Technology and Engineering, China
Copyright © 2024 Yong. This is an open-access article distributed under the terms of the Creative Commons Attribution License (CC BY). The use, distribution or reproduction in other forums is permitted, provided the original author(s) and the copyright owner(s) are credited and that the original publication in this journal is cited, in accordance with accepted academic practice. No use, distribution or reproduction is permitted which does not comply with these terms.
*Correspondence: Lei Yong, MTAwMTUzMkBuYnB0LmVkdS5jbg==
 Lei Yong