- 1Department of Mechanical Engineering, Saitama University, Saitama, Japan
- 2Department of Engineering, Faculty of Natural, Mathematical and Engineering Sciences, King’s College London, London, United Kingdom
- 3Department of Mechanical Engineering, Imperial College London, London, United Kingdom
- 4Faculty of Environment and Information Sciences, Yokohama National University, Yokohama, Japan
Friction-induced vibration in the wiper system of passenger cars not only causes impaired visibility as a result of uneven water film distribution on the windscreen surface, but also leads to noise problems by transmitting vibrations as sound to the passengers. In this study, a novel experimental apparatus was developed to simulate the wiper system, enabling the change in normal support stiffness and the precise adjustment of the yaw angles of a shortened rubber blade and its flexible base relative to the drive direction of a glass plate. The use of fluorescence observation provided a significant advantage, enabling precise measurements of the position of the rubber blade tip and the water film thickness in the contact area of the rubber blade and the glass plate during operation. In conjunction with this, an accelerometer and a gap sensor were employed to measure the normal and tangential motions of the support structures, respectively. This comprehensive setup allows for precise control of blade support conditions, and provides accurate measurement for motions of rubber blade and support structures, making it a powerful tool for investigating friction-induced vibration in the wiper system. The experimental results clearly demonstrated the effectiveness of applying large yaw angles to both the rubber blade and the flexible base in suppressing friction-induced vibration, resulting in smooth motion at any drive speed. These findings have the potential to improve wiper performances under actual operating conditions.
1 Introduction
The wiper system of vehicles is designed to maintain clear visibility for drivers by moving a rubber blade pressed against a windshield with a wiper arm in reciprocating motions. During these wiping motions, the friction between the rubber blade and the windshield can cause a self-excited vibration known as friction-induced vibration. If the rubber blade forms an uneven water sheet failing to sweep water drops, the refraction of light hinders clear view (Kitayama et al., 2012). Friction-induced vibraion can also result in noise problems if the sound of the vibration is transmitted to passengers (Wang et al., 2023). This problem is particularly pronounced in electric vehicles, where the lower levels of interior sound and vibration compared to those in internal combustion engine vehicles make friction-induced vibration and noise more noticeable (Farfan-Cabrera, 2019; Li and Xu, 2023). Therefore, research on suppressing friction-induced vibration contributes not only to traffic safety by maintaining clear visibility but also to user comfort by reducing noise.
To suppress the friction-induced vibration in the wiper system, it is crucial to understand the vibration mechanism in detail. The types of vibration in the wiper system can be categorized as follows (Goto et al., 2001; Reddyhoff et al., 2015): (1) high-frequency vibration, called squeal noise, around 1 kHz, generated at the rubber blade (Goto et al., 2001; Reddyhoff et al., 2015; Le Rouzic et al., 2013; Min et al., 2014; Unno et al., 2017). (2) low-frequency vibration, referred to as chattering, less than 100 Hz, generated in the wiper system including support parts of the rubber blade such as the wiper arm (Suzuki and Yasuda, 1998; Lancioni et al., 2016). (3) impact sound and vibration, called reversal noise, caused by the tip of the rubber blade hitting the glass surface when the wiper changes direction. Regarding (1) and (2), the velocity-weakening friction, which appears in the mixed lubrication regime of the Stribeck curve, is known to cause friction-induced vibration (Reddyhoff et al., 2015; Le Rouzic et al., 2013; Suzuki and Yasuda, 1998). Specifically for squeal noise, the mechanism has been demonstrated theoretically (Goto et al., 2001), experimentally (Reddyhoff et al., 2015; Le Rouzic et al., 2013; Min et al., 2014), and numerically (Unno et al., 2017), showing that the vibrational modes of the rubber blade are excited by the instability caused by the velocity-weakening friction. This phenomenon is independent of the characteristics of the support structure in the wiper system. Several studies have investigated the relationship between friction behavior and noise in terms of the surface roughness, coating treatment, blade material, and wear status (Wang et al., 2023). On the other hand, for chattering, the behavior of the rubber blade tip in friction-induced vibration and the influence of the support structure of the rubber blade are not sufficiently understood to design the wiper system without any vibration and noise problems in advance. In an actual wiper system, not only the velocity conditions but also the yaw support angles of the rubber blade and the deformation direction and stiffness of the wiper arm depend on the position along the rubber blade, complicating the understanding of the phenomenon. It has been demonstrated that the application of a leaf spring support with a yaw angle misalignment between the support deformation direction and the drive velocity can suppress the friction-induced vibration of a tribometer, which is considered a single-degree-of-freedom vibrating system (Kado et al., 2013). In addition, direct observations of water-lubricated elastomer/glass contacts are effective in understanding the mechanism of the velocity-weakening friction (Deleau et al., 2009; Dalzin et al., 2016). Fluorescence observation can be applied to examine the motion of objects with rough surfaces like rubber (Fowell et al., 2014; Vlădescu et al., 2019).
In this study, to understand the influence of the adjustments on yaw angles and support stiffness of the rubber blade on chattering vibration in the wiper system, a custom-made apparatus simulating a wiper system was developed. This apparatus included yaw angle adjustments and support structures in the tangential and normal directions for a short piece of a commercial rubber blade. In addition, to examine the relationship between the motions of the support structure and the rubber blade tip, the in-plane behavior of the rubber blade tip and the distance between the rubber blade tip and glass surface under water lubrication were measured using fluorescence observation. The findings of this study are expected to contribute not only to advancing the fundamental understanding of vibration mechanisms but also to provide insights for the design of quieter and more effective wiper systems.
2 Experimental details
2.1 Apparatus
The experimental apparatus was designed to simulate the interaction between the rubber blade and glass surface of a wiper system, reproducing the dynamic conditions and frictional behavior observed in practical use. The experimental apparatus allows for precise control of normal load, drive velocity, and yaw angles, enabling detailed study of friction-induced vibration. Figures 1, 2 show a photograph and a schematic diagram of the experimental apparatus, which consists of drive and driven parts that simulate the wiper system, along with an optical setup for monitoring the motion of the rubber blade. A glass plate (material: borosilicate glass, diameter: 50 mm, thickness: 5 mm, and arithmetic average roughness: 4 nm) and a short piece of a commercial rubber blade (made by DENSO WIPER SYSTEMS, INC., model number: AS70GN, width: 10 mm, and arithmetic average roughness: 1 µm) were placed in the drive and driven parts respectively, forming a line contact. In the drive part, the glass plate was mounted on a motorized linear stage (KS101-30R, SURUGA SEIKI, JAPAN) via a holder and a loading mechanism to drive at a constant drive speed V. The loading mechanism employed a lever mechanism with a coil spring, including a load cell (stiffness: 2.4 kN/mm, LMB-A-50N, Kyowa Electronic Instruments, JAPAN) above the coil spring to monitor the normal load. The normal load was applied to the contact by the restoring force generated by deforming the coil spring. The coil spring could be replaced with one of three coil springs with different stiffness values (K = 4, 10, and 60 N/mm). This change would adjust the natural frequency of the loading mechanism to fL = 18, 26, and 40 Hz, respectively. To monitor the Z-axis motion of the loading mechanism including the glass plate during the sliding test with the rubber blade, an accelerometer (frequency range: 1 Hz–10 kHz, NP-3211, Ono Sokki, JAPAN) was placed on the opposite surface of the glass plate from the contact. In the driven part, the rubber blade was mounted on a base plate supported by parallel leaf springs (stiffness k: 4 N/mm), where the natural frequency of the base structure of the rubber blade was fB = 29 Hz. The displacement xbase of the base plate was measured by a gap sensor (resolution: 0.4 µm, EX-614V, KEYENCE, JAPAN). A manual Z-axis stage was placed right under the parallel leaf springs to adjust the height position of the rubber blade tip. A manual rotational stage was placed under the parallel leaf springs to adjust the yaw angle φ1 between the direction of drive velocity V and the direction of the deformation xbase of the parallel leaf springs. Another manual rotational stage was placed between the rubber blade and the base plate to adjust the yaw angle φ2 between the direction of drive velocity V and the direction of the deformation of the rubber blade.
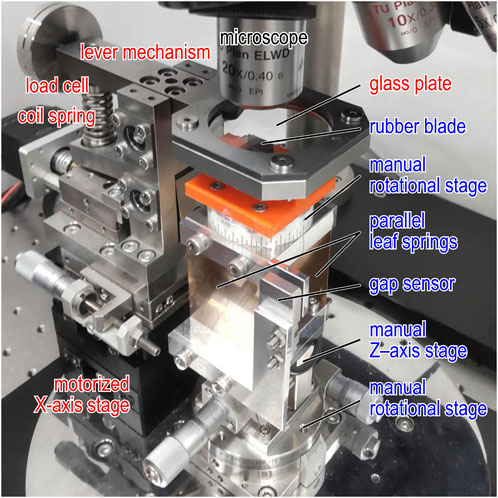
Figure 1. Photograph of experimental apparatus; red words: components in drive part; blue words: components in driven part.
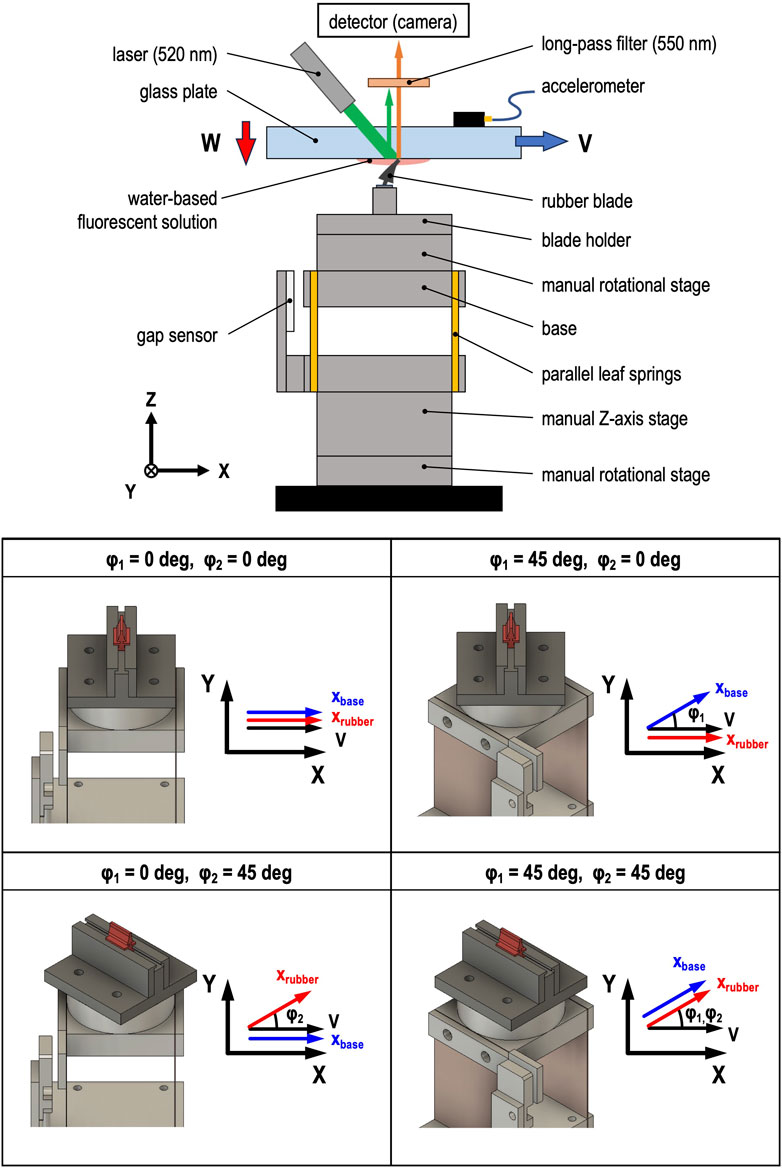
Figure 2. Schematic diagram of experimental apparatus; upper diagram: side view of experimental apparatus; lower diagram: configurations of driven part with different yaw angles (φ1 and φ2).
Fluorescence observation of the contact between the glass plate and rubber blade was performed to measure the water film thickness and the position of the rubber blade tip using the optical setup consisting of a laser (wavelength: 520 nm), microscope, and an intensified CMOS camera (ORCA-Flash4.0 V3, HAMAMATSU PHOTONICS, JAPAN). A fluorescent solution was prepared by adding Rhodamine-B (concentration: 0.3 mol/m3) to pure water, and this solution was used as a lubricant in the contact. The laser beam was directed at the contact area lubricated with the water-based fluorescent solution. The emitted light (wavelength: 570–590 nm) was captured using the camera at a frame rate of 200 fps (exposure time: 1/frame rate) through the microscope equipped with a 5x objective lens and long-pass filter (cut-off wavelength: 550 nm) in the optical path. The resolution of the captured images was 500 × 500 px; the pixel size was 1.28 µm/px; the gradation was 65,536 levels of gray. A manual XY-axis linear stage was mounted at the bottom of the microscope to adjust the camera’s view to the contact area.
2.2 Procedure
The glass plate was cleaned with acetone and hexane for 5 min each using an ultrasonic cleaner, dried with hot air from a blower, and installed into the holder of the drive part. The accelerometer was fixed to the glass plate with solid glue. The rubber blade was wiped by an ethanol-moistened paper towel and then installed onto the base plate via the blade holder. Each yaw angle (φ1 and φ2) was adjusted to be 0, 15, 30, or 45 degrees using the manual rotational stages, as shown in Figure 2. The contact between the glass plate and rubber blade was made while keeping the glass plate horizontal using the loading mechanism in the drive part and the manual Z-axis stage in the driven part. The water-based fluorescent solution of 100 mm3 was injected around the contact. After driving the glass 10 mm at V = 20 mm/s, the normal load W was adjusted to be 0.17 N while maintaining the glass plate horizontal and the rubber blade bent with static friction. The microscope position was adjusted using the manual XY-axis linear stage to observe the contact with the camera. The laser beam was then directed at the contact. When the glass was moved 20 mm at V = 5, 10, 15, and 20 mm/s, the displacement xbase of the base plate and the acceleration az of the glass plate were measured at sampling frequencies of 1,000 Hz and 51.2 kHz, respectively. A signal of 1 V for 0.05 s was used as a trigger to synchronize the start timing of recording xbase and az and capturing the fluorescence intensity images. The ambient temperature and relative humidity during the experiments were 25°C and 20%–40%, respectively.
3 Results and discussion
3.1 Calibration of water film thickness under contact between glass plate and rubber blade
Figure 3 illustrates the calibration of film thickness measurements for the water-based fluorescent solution using the images captured by the camera. To calibrate the intensity of the captured images to the water film thickness, a shim film (material: stainless steel) with known thickness hs of 5, 10, and 15 µm was placed between the glass plate and rubber blade, creating three distinct contact situations: contact via the shim film, contact via the fluorescent water, and direct contact of the glass plate and rubber blade, as shown in Figure 3A. In Figure 3B, green, red, and blue plots represent the fluorescence intensity values measured with shim films of different thicknesses (5, 10, and 15 μm, respectively). Each color plot showed that the fluorescence intensity was maximum at the end of the shim film (position: 0 µm) and decreased with increasing distance from the shim film. The water film thickness at the position where the fluorescence intensity was the maximum was assumed to be equal to the thickness of the shim film. The minimum value of the fluorescence intensity was assumed to indicate the water film thickness of zero. The relationship between the water film thickness and the fluorescence intensity measured at the position of zero using each shim is shown in Figure 3C. The solid back line represents a fitting line with the equation: h = a (I–b), where h is the water film thickness, I is the intensity measured by fluorescence observation, and a and b are fitting parameters. The fitting line shown in Figure 3C has parameters a = 1.15 and b = 102.5 (determined by the least squares method, R2: 0.95).
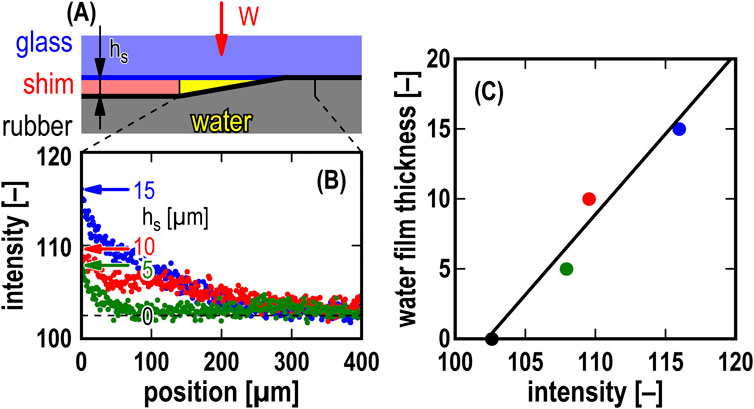
Figure 3. Calibration of film thickness measurement; (A) schematic of the contact of glass plate and rubber blade with constant-thickness shim (hs = 5, 10, 15 µm) and water-based fluorescent solution; (B) fluorescence intensity measured under the contact; (C) water film thickness versus fluorescence intensity measured at position of zero.
3.2 Typical vibration observed in simulated wiper system
Figure 4 illustrates a typical result of fluorescence observation for the sliding contact of the glass and rubber blade at K = 10 N/mm, φ1 = φ2 = 0 deg, and V = 5 mm/s, where t = 0.065 s in Figure 5. In the fluorescence intensity image with a grayscale range of 0–500 shown in Figure 4A, the intensity decreased as it approached X = 2.04 mm but did not change significantly along the Y-axis direction. The black line in Figure 4B represents the mean values of the film thickness h of water, calculated from the intensity averaged from Y = −0.32 to 0.32 mm. The red and blue lines represent the mean values of h plus and minus standard deviation (STD), respectively, also calculated from Y = −0.32 to 0.32 mm. The variation of h with X shows the tip-corner shape of the rubber blade and the minimum value hmin of the water film thickness, which is 2.3 μm at X = 2.04 mm. The position where the minimum film thickness hmin was observed is defined as xrubber. Considering the STD value shown by the blue line, the value of h at X = 2.04 mm was almost zero, implying that the lubrication regime in the experiment was mixed lubrication.
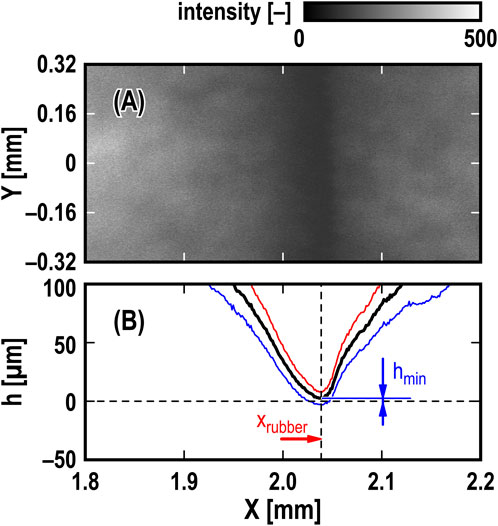
Figure 4. Typical result of fluorescence observation for sliding contact of glass plate and rubber blade; (A) snapshot of fluorescence observation; (B) cross-section of h versus X; bold black line: h converted from average intensity of snapshot from Y = −0.32 to 0.32 mm, red line: h + STD, blue line: h – STD; K = 10 N/mm, φ1 = φ2 = 0 deg, and V = 5 mm/s; t = 0.065 s in Figure 5.
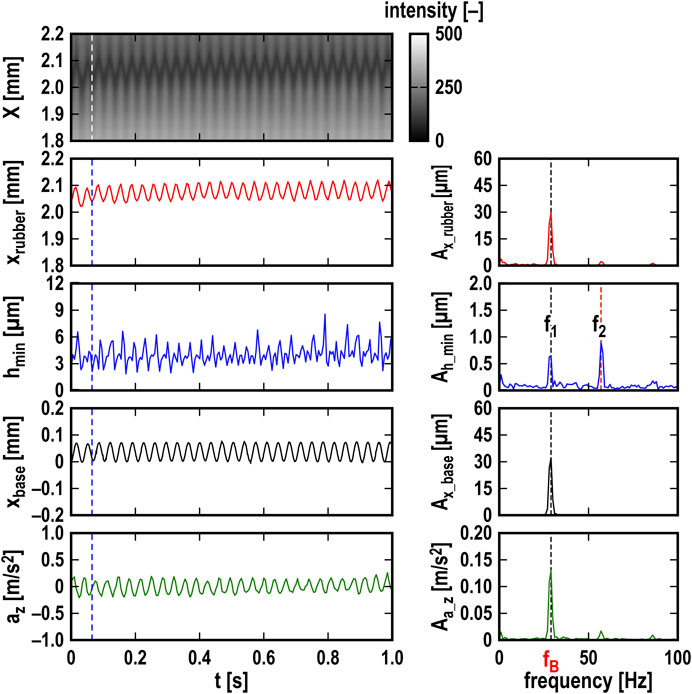
Figure 5. Temporal changes and FFT analyses of fluorescence intensity, hmin, xrubber, xbase, and az; K = 10 N/mm, φ1 = φ2 = 0 deg, and V = 5 mm/s; white and blue dashed lines indicate t = 0.065 s (snapshot in Figure 4); fB = 29 Hz.
Figure 5 illustrates temporal changes in fluorescence intensity, xrubber, hmin, xbase, and az as a typical experimental result at K = 10 N/mm, φ1 = φ2 = 0 deg, and V = 5 mm/s, where the values from the last one second of the four-second sliding time in the test were extracted. A low-pass filter (cut-off frequency: 200 Hz) was applied to the temporal change in az. In addition, the spectra shown in the right-hand side column of Figure 5 were obtained using the fast Fourier transform (FFT) method applied to the temporal changes in xrubber, hmin, xbase, and az shown in the left-hand side column of Figure 5. The values of xrubber and hmin were obtained from the fluorescence image at the top of the left-hand side column in Figure 5, which was made by combining the intensity profiles averaged in the Y-axis direction from each snapshot. xbase is the displacement of the base, which was connected to parallel leaf springs. az is the acceleration of the glass plate with the lever in the loading mechanism. xrubber, xbase, and az showed steady waveforms of 29 Hz, which matched the natural frequency of the base (fB = 29 Hz), as shown in the spectra, where their amplitudes were 30 μm, 32 μm, 0.13 m/s2, respectively. On the other hand, the waveform of hmin contained two components of f1 = 29 Hz and f2 = 57 Hz. The first-order frequency f1 was the same as fB = 29 Hz, and the second-order frequency f2 was approximately twice fB. The amplitude Ah_min at f1 was 0.63 µm and that at f2 was 0.88 µm.
Figure 6 shows the cross-sections of hmin, xbase, and z versus xrubber at K = 10 N/mm, φ1 = φ2 = 0 deg, and V = 5 mm/s, where the values were extracted at t = 0.065–0.100 s as shown in Figure 5. z is the Z-axis displacement of the glass plate, calculated by dividing az by – (2πf)2, assuming az to be a harmonic vibration, where f = 29 Hz as shown in Figure 5. The open plot represents the start point of the period (t = 0.065 s). Regarding the cross-section of hmin versus xrubber in Figure 6A, the values of hmin at the top and bottom end points of xrubber were the minima of 2 µm in one stroke. The value of hmin at the center of the backward stroke of xrubber was 6 μm, larger than that at the center of the forward stroke, which was 4 µm. This result suggests that the in-plane motion of the rubber blade tip generated a hydrodynamic effect, such as the wedge effect, increasing the film thickness of water in the middle of the forward and backward strokes where the velocity of the rubber blade tip reached two local maxima in one stroke, causing the 2fB component in hmin. On the other hand, the cross-section of xbase versus xrubber shown in Figure 6B displayed a positively inclined elliptical orbit. As the value of xrubber increased, the value of xbase also increased, but with a lag relative to the change in xrubber. This result suggests that the motion of the rubber blade tip is the origin of the vibration. In addition, the cross-sections of z versus xrubber in Figure 6C showed a horizontal elliptical orbit. The difference between the cross-sections of z versus xrubber and hmin versus xrubber indicates that the change in hmin was in the Z-axis direction but did not affect the Z-axis motion of the lever in the loading system.
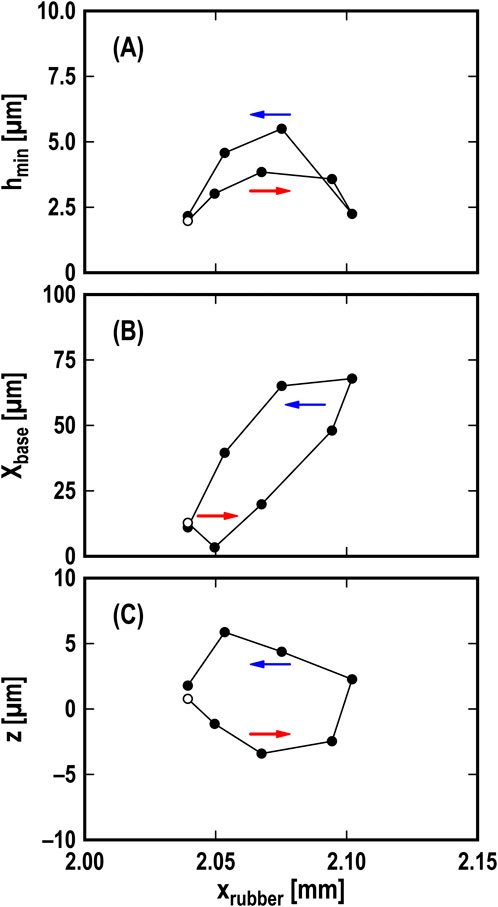
Figure 6. Cross-sections of (A) hmin versus xrubber, (B) xbase versus xrubber, and (C) z versus xrubber; K = 10 N/mm, φ1 = φ2 = 0 deg, and V = 5 mm/s; open plot: start point of period (t = 0.065 s); arrows: direction of time progress.
3.3 Influence of drive speed on friction-induced vibration
Figure 7 illustrates the effect of drive speed on the amplitude and frequency of xrubber, hmin, xbase, and az at K = 10 N/mm and φ1 = φ2 = 0 deg. The amplitude and frequency were extracted at a predominant frequency in each spectrum, calculated using the FFT method for the temporal change in xrubber, hmin, xbase, and az for 1.0 s, as shown in Figure 5. Ax_rubber, Ah_min, Ax_base, and Aa_z represent the amplitude of xrubber, hmin, xbase, and az, respectively. The diameter of circles in Figure 7 represents the amplitude. The thresholds for extracting the predominant components in the spectrum were Ax_rubber = 5 μm, Ah_min = 0.25 µm, Ax_base = 5 μm, and Aa_z = 0.025 m/s2. For xrubber, xbase, and az, the frequency of the vibration was consistent with fB = 29 Hz, as shown in Figure 5, and did not change with increasing drive speed V. On the other hand, the values of Ax_rubber, Ax_base, and Aa_z increased with increasing V. The tendencies for the vibration frequency to correspond to the natural frequency derived from the supporting structure, rather than the natural frequency of the rubber blade alone, and for the amplitude to increase with drive speed are consistent with the results of Suzuki et al.‘s research (Suzuki and Yasuda, 1998). Regarding hmin, there are three predominant frequencies: f1, f2, and f3. The first-order frequency f1 = 29 Hz was the same as fB = 29 Hz, the second-order frequency f2 = 57 Hz, as also shown in Figure 5, was approximately 2 × fB, and the third-order frequency f3 = 85 Hz was close to 3 × fB. The values of f1, f2, and f3 did not change with increasing V. In contrast, the values of Ah_min at f2 = 57 Hz increased with increasing V, but those at f1 = 29 Hz and f3 = 85 Hz did not increase significantly with increasing V. Note that the second-order frequency was not the natural frequency of the system’s second mode, but could have been caused by the speed-dependent hydrodynamic effect.
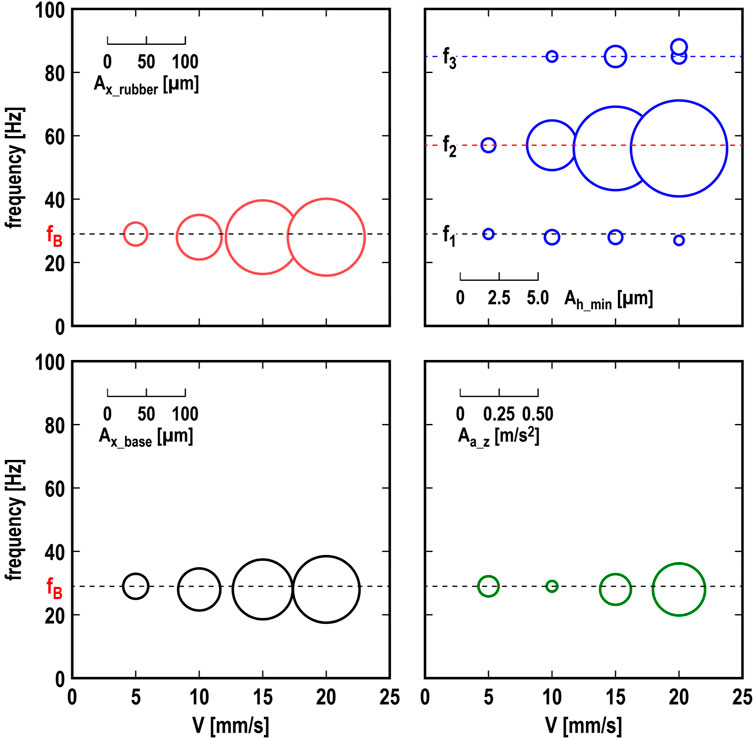
Figure 7. Effect of drive speed V on amplitude and frequency of xrubber, hmin, xbase, and az; K = 10 N/mm; φ1 = φ2 = 0 deg.
Figure 8 illustrates the comparison between the maximum speed of the rubber blade tip and the drive speed. The maximum speed of the rubber blade tip was calculated with Ax_rubber · ω, where ω was obtained from 2π f1. The plot of Ax_rubber · ω at each V was along the dashed line, which shows Ax_rubber · ω = V. This result implies that the amplitude Ax_rubber of vibration was saturated when the maximum speed Ax_rubber · ω of the rubber blade tip reached the drive speed V.
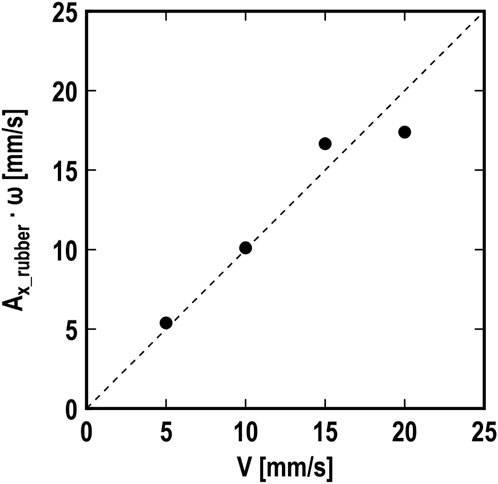
Figure 8. Maximum speed Ax_rubber · ω of rubber blade tip versus drive speed V; K = 10 N/mm; φ1 = φ2 = 0 deg; dashed line: Ax_rubber · ω = V.
3.4 Effect of yaw support angles and system stiffness on friction-induced vibration
Figure 9 illustrates the effect of the yaw support angles (φ1 and/or φ2) and stiffness K of the loading system at V = 5 mm/s on the amplitude and frequency of the rubber blade’s vibration xrubber, which were extracted with thresholds of Ax_rubber = 5 µm. The diameter of circles in Figure 9 represents the amplitude. Figures 9B, E, H show the effect of the yaw support angles (φ1 and/or φ2) at K = 10 N/mm, where the value of Ax_rubber at φ1 = φ2 = 0 was extracted from that shown at V = 5 mm/s in Figure 7. Increasing only φ1 (φ2 = 0) or φ2 (φ1 = 0) at K = 10 N/mm as shown in Figures 9B, E, the values of Ax_rubber around 29 Hz did not significantly change. On the other hand, increasing the value of φ1 = φ2 at K = 10 N/mm as shown in Figure 9H, the value of Ax_rubber decreased and at φ1 = φ2 = 45 deg was lower than the threshold of Ax_rubber = 5 µm. When the stiffness K of the loading system was 4 N/mm, which made the situation fB > fL, the frequency of the vibration shifted from fB to around fL with increasing only φ1 (Figure 9A) or both φ1 and φ2 (Figure 9G). When K = 60 N/mm, which made the situation of fB < fL in Figures 9C, F, I, the frequency of the vibration did not change with increasing φ1 and/or φ2. Ax_rubber decreased with increasing the value of only φ1 (Figure 9C) or both φ1 and φ2 (Figure 9I), and disappeared at φ1 = φ2 > 30 deg.
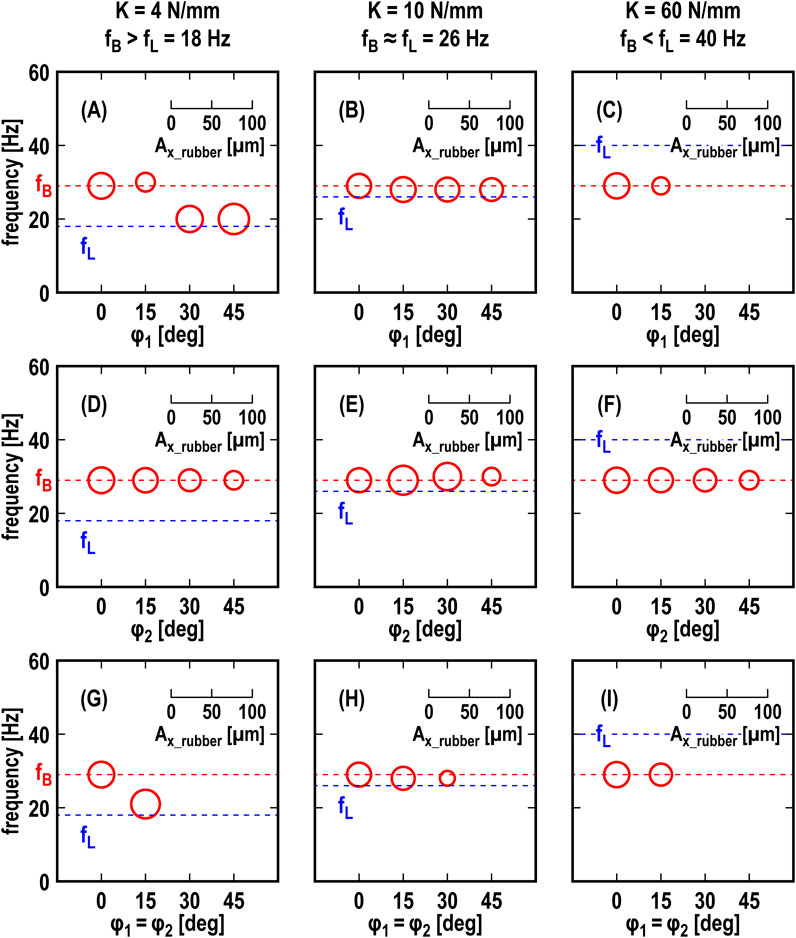
Figure 9. Effect of φ1 and/or φ2 on amplitude Ax_rubber and frequency F of rubber blade tip V = 5 mm/s; top row (A–C): effect of φ1 (φ2 = 0), middle row (D–F): effect of φ2 (φ1 = 0), bottom row (G–I): effect of φ1 = φ2; left column (A,D,G) : K = 4 N/mm (fB = 29 Hz > fL = 18 Hz), center column (B,E,H): K = 10 N/mm (fB ≈ fL = 26 Hz), right column (C,F,I) : K = 60 N/mm (fB < fL = 40 Hz).
Figure 10 illustrates the effect of the yaw support angles (φ1 and/or φ2), the stiffness K of the loading system, and the drive speed V on the maximum amplitude Ax_r_max of the rubber blade’s vibration xrubber, which included the maximum amplitude at a different frequency as shown in Figures 9A, G. Increasing the value of φ1 = φ2 in Figures 10G–I, the value of Ax_r_max decreased under any drive speed and stiffness conditions. When the stiffness of the loading system was relatively high (K = 60 N/mm), the value of Ax_r_max decreased with increasing only φ1 (φ2 = 0) in Figure 10C. These results suggest that the yaw support angles in a wiper system could work as the yaw angular misalignment effect (Kado et al., 2013; Nakano et al., 2013-01; Tadokoro et al., 2021), which provides a positive damping effect generated by rotating the friction force vector and suppress the friction-induced vibration. For an actual wiper system in which the wiping motion is in an arc, a parallel misalignment between the drive rotational axis and the driven torsional axis (Tadokoro et al., 2018) could be effective in adding the yaw angular misalignment effect.
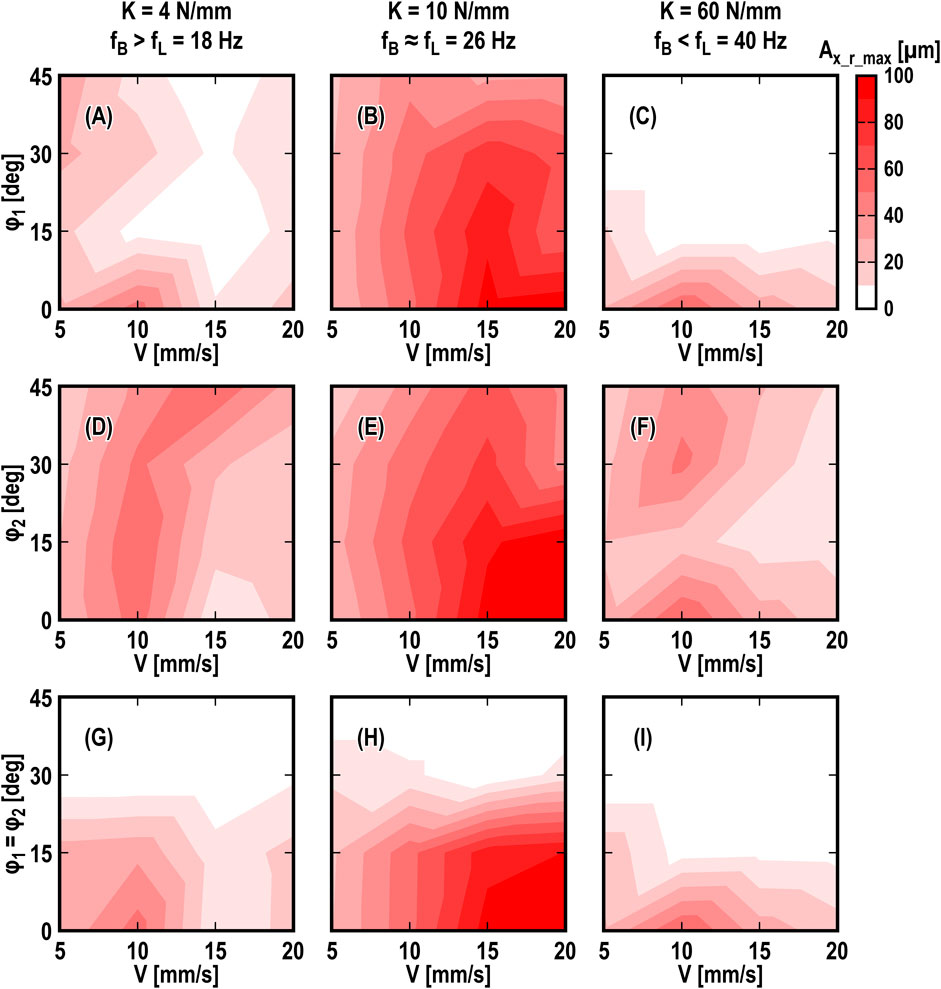
Figure 10. Effect of φ1, φ2, and V on Ax_r_max; top row (A–C) : effect of φ1 (φ2 = 0), middle row (D–F) : effect of φ2 (φ1 = 0), bottom row (G–I): effect of φ1 = φ2; left column (A,D,G) : K = 4 N/mm (fB = 29 Hz > fL = 18 Hz), center column (B,E,H): K = 10 N/mm (fB ≈ fL = 26 Hz), right column (C,F,I): K = 60 N/mm (fB < fL = 40 Hz).
3.5 Effect of drive speed and yaw support angles on water film thickness and friction coefficient
Figure 11 illustrates the effect of drive speed V on the friction coefficient µ and average value hmin_mean of hmin. Black and red plots represent the values at φ1 = φ2 = 0 and 45 deg, respectively. The friction coefficient in Figure 11A was calculated using the following Equation 1 (Kado et al., 2013):
where xbase_mean is the time-averaged value of xbase. The friction coefficient at φ1 = φ2 = 0 and 45 deg showed the velocity-weakening property, with black and red lines representing the fitting lines with the following Equation 2:
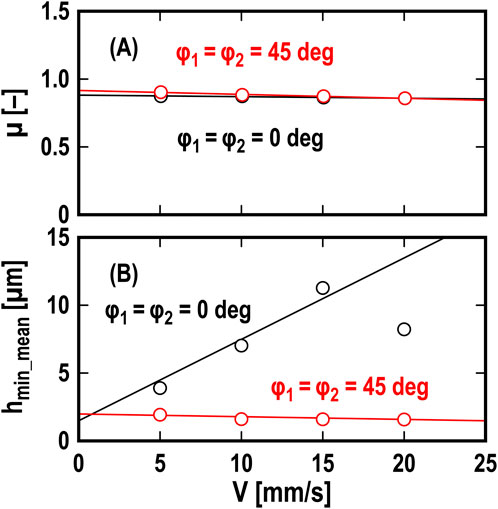
Figure 11. Effect of drive speed V on (A) µ and (B) hmin_mean; black plots: φ1 = φ2 = 0 deg and red plots: φ1 = φ2 = 45 deg.
The black line corresponds to αµ = −0.001 and βµ = 0.88 (R2: 0.92), and the red line corresponds to αµ = −0.003 and βµ = 0.92 (R2: 0.99). The slope of the fitting lines at φ1 = φ2 = 0 deg was slightly lower than that at φ1 = φ2 = 45 deg. In Figure 11B, hmin_mean is the time-averaged value of hmin. At φ1 = φ2 = 0 deg, hmin_mean increased with increasing the drive speed V, where the fitting line was adjusted with the following Equation 3:
The black line corresponds to αh = 0.6 and βh = 1.5 (R2: 0.42). On the other hand, at φ1 = φ2 = 45 deg, hmin_mean slightly decreased with increasing V; the red line corresponds to αh = −0.02 and βh = 2.0 (R2: 0.58). These results show that the time-averaging value of hmin did not significantly affect the change in the friction coefficient. Also, note that friction-induced vibration causes measurement errors in the friction coefficient (Kado et al., 2013). Therefore, to fully understand the details of the friction-induced vibration in the wiper system, further verifications through numerical approaches are also needed.
4 Conclusions
To examine the effects of the yaw support angles and support stiffness in the wiper system on the friction-induced vibration, concurrent measurements were conducted on the tangential displacement of the translational support base and the normal acceleration of the loading mechanism, as well as fluorescence observation to measure the water film thickness and the rubber blade tip position. The main conclusions derived from the results are summarized as follows:
(1) Friction-induced vibration appears as both in-plane vibration at the natural frequency fB of the base translationally supporting the wiper blade and out-of-plane vibration at 2 × fB of the wiper blade tip, which is attributed to fluctuations in the water film thickness.
(2) Higher drive speeds lead to increased vibration amplitude, particularly when the natural frequency fL of the loading mechanism is close to fB.
(3) Friction-induced vibration is suppressed by applying large yaw angles to both the rubber blade and tangential support structure at any drive speed.
(4) At sufficiently high stiffness of the loading mechanism, suppressing friction-induced vibration requires only the addition of the yaw angle of the tangential support structure.
These findings provide valuable insights for improving wiper performances under practical operating conditions. However, further research is necessary to investigate the behavior of different wiper materials under varying environmental conditions, such as temperature, humidity, and wear over extended periods. Further studies should also incorporate numerical simulations and physical models to predict wiper behavior across diverse practical applications.
Data availability statement
The original contributions presented in the study are included in the article/supplementary material, further inquiries can be directed to the corresponding author.
Author contributions
CT: Conceptualization, Data curation, Formal Analysis, Funding acquisition, Investigation, Methodology, Project administration, Resources, Software, Supervision, Validation, Visualization, Writing–original draft, Writing–review and editing. HK: Data curation, Formal Analysis, Investigation, Methodology, Writing–original draft, Writing–review and editing. MS: Formal Analysis, Methodology, Validation, Writing–review and editing, Writing–original draft. TN: Conceptualization, Formal Analysis, Methodology, Resources, Supervision, Writing–review and editing, Writing–original draft. S-CV: Conceptualization, Methodology, Supervision, Visualization, Writing–review and editing, Writing–original draft. TR: Conceptualization, Methodology, Supervision, Writing–review and editing, Writing–original draft. KN: Conceptualization, Resources, Supervision, Writing–review and editing, Writing–original draft.
Funding
The author(s) declare that financial support was received for the research, authorship, and/or publication of this article. This work was partially supported by JSPS KAKENHI Grant Number JP 22KK0236.
Conflict of interest
The authors declare that the research was conducted in the absence of any commercial or financial relationships that could be construed as a potential conflict of interest.
The author(s) declared that they were an editorial board member of Frontiers, at the time of submission. This had no impact on the peer review process and the final decision.
Publisher’s note
All claims expressed in this article are solely those of the authors and do not necessarily represent those of their affiliated organizations, or those of the publisher, the editors and the reviewers. Any product that may be evaluated in this article, or claim that may be made by its manufacturer, is not guaranteed or endorsed by the publisher.
References
Dalzin, F., Le Bot, A., Perret-Liaudet, J., and Mazuyer, D. (2016). Tribological origin of squeal noise in lubricated elastomer-glass contact. J. Sound Vib. 372, 211–222. doi:10.1016/j.jsv.2016.01.019
Deleau, F., Mazuyer, D., and Koenen, A. (2009). Sliding friction at elastomer/glass contact: influence of the wetting conditions and instability analysis. Tribol. Int. 42, 149–159. doi:10.1016/j.triboint.2008.04.012
Farfan-Cabrera, L. I. (2019). Tribology of electric vehicles: a review of critical components, current state and future improvement trends. Tribol. Int. 138, 473–486. doi:10.1016/j.triboint.2019.06.029
Fowell, M. T., Myant, C., Spikes, H. A., and Kadiric, A. (2014). A study of lubricant film thickness in compliant contacts of elastomeric seal materials using a laser induced fluorescence technique. Tribol. Int. 80, 76–89. doi:10.1016/j.triboint.2014.05.028
Goto, S., Takahashi, H., and Oya, T. (2001). Clarification of the mechanism of wiper blade rubber squeal noise generation. JSAE Rev. 22, 57–62. doi:10.1016/s0389-4304(00)00095-3
Kado, N., Tadokoro, C., and Nakano, K. (2013). Measurement error of kinetic friction coefficient generated by frictional vibration. Trans. Jpn. Soc. Mech. Eng. Ser. C 79, 2635–2643. doi:10.1299/kikaic.79.2635
Kitayama, T., Kawasumi, M., Yamasaki, H., Nakano, T., Yamamoto, S., Yamada, M., et al. (2012). Method for evaluating performance of wipers based on visibility. IEICE Trans. Electron. 95, 1716–1723. doi:10.1587/transele.e95.c.1716
Lancioni, G., Lenci, S., and Galvanetto, U. (2016). Dynamics of windscreen wiper blades: squeal noise, reversal noise and chattering. J. Non-Linear Mech. 80, 132–143. doi:10.1016/j.ijnonlinmec.2015.10.003
Le Rouzic, J., Le Bot, A., Perret-Liaudet, J., Guibert, M., Rusanov, A., Douminge, L., et al. (2013). Friction-induced vibration by stribeck’s law: application to wiper blade squeal noise. Tribol. Lett. 49, 563–572. doi:10.1007/s11249-012-0100-z
Li, Y., and Xu, J. (2023). Dynamic characteristics and generation mechanism of windscreen frameless wiper blade oscillations. Nonlinear Dyn. 111, 3053–3079. doi:10.1007/s11071-022-08030-0
Min, D., Jeong, S., Yoo, H. H., Kang, H., and Park, J. (2014). Experimental investigation of vehicle wiper blade’s squeal noise generation due to windscreen waviness. Tribol. Int. 80, 191–197. doi:10.1016/j.triboint.2014.06.024
Nakano, K., Tadokoro, C., and Kado, N. (2013-01-2069), (2013). Yawing angular misalignment provides positive damping to suppress frictional vibration: basic applicability to disc brake systems. SAE Int. J. Passeng. Cars-Mechanical Syst. 6, 1493–1498. doi:10.4271/2013-01-2069
Reddyhoff, T., Dobre, O., Le Rouzic, J., Gotzen, N. A., Parton, H., and Dini, D. (2015). Friction induced vibration in windscreen wiper contacts. J. Vib. Acoust. 137, 041009. doi:10.1115/1.4029987
Suzuki, R., and Yasuda, K. (1998). Analysis of chatter vibration in an automotive wiper assembly. JSME Int. J. Ser. C Mech. Syst. Mach. Elem. Manuf. 41, 616–620. doi:10.1299/jsmec.41.616
Tadokoro, C., Aso, Y., Nagamine, T., and Nakano, K. (2021). Anti-vibration and traction control of rotary sliding systems by orthogonal rotation providing transverse sliding. Tribol. Int. 159, 106992. doi:10.1016/j.triboint.2021.106992
Tadokoro, C., Nagamine, T., and Nakano, K. (2018). Stabilizing effect arising from parallel misalignment in circular sliding contact. Tribol. Int. 120, 16–22. doi:10.1016/j.triboint.2017.12.003
Unno, M., Shibata, A., Yabuno, H., Yanagisawa, D., and Nakano, T. (2017). Analysis of the behavior of a wiper blade around the reversal in consideration of dynamic and static friction. J. Sound Vib. 393, 76–91. doi:10.1016/j.jsv.2017.01.018
Vlădescu, S. C., Putignano, C., Marx, N., Keppens, T., Reddyhoff, T., and Dini, D. (2019). The percolation of liquid through a compliant seal– an experimental and theoretical study. J. Fluids Eng. 141, 031101. doi:10.1115/1.4041120
Keywords: wiper, soft material, friction, vibration, fluorescence observation
Citation: Tadokoro C, Kobayashi H, Sueda M, Nagamine T, Vlădescu S-C, Reddyhoff T and Nakano K (2024) Controlling windscreen wiper vibration through yaw angle adjustments: a study of dynamic contact behavior using fluorescence observation. Front. Mech. Eng. 10:1471045. doi: 10.3389/fmech.2024.1471045
Received: 26 July 2024; Accepted: 09 October 2024;
Published: 07 November 2024.
Edited by:
Antonio Papangelo, Politecnico di Bari, ItalyReviewed by:
Liran Ma, Tsinghua University, ChinaIakov A. Lyashenko, Technical University of Berlin, Germany
Saša Milojević, University of Kragujevac Faculty of Engineering, Serbia
Copyright © 2024 Tadokoro, Kobayashi, Sueda, Nagamine, Vlădescu, Reddyhoff and Nakano. This is an open-access article distributed under the terms of the Creative Commons Attribution License (CC BY). The use, distribution or reproduction in other forums is permitted, provided the original author(s) and the copyright owner(s) are credited and that the original publication in this journal is cited, in accordance with accepted academic practice. No use, distribution or reproduction is permitted which does not comply with these terms.
*Correspondence: Chiharu Tadokoro, dGFkb2tvcm9AbWFpbC5zYWl0YW1hLXUuYWMuanA=
 Chiharu Tadokoro
 Hiroaki Kobayashi1
 Miwa Sueda
 Sorin-Cristian Vlădescu
 Tom Reddyhoff
 Ken Nakano