- Institute for Product Development and Machine Elements, Technical University of Darmstadt, Darmstadt, Germany
Industry 4.0 drives the demand for cost-efficient and reliable process data and condition monitoring. Therefore, visualizing the state of tribological contacts becomes important, as they are regularly found in the center of many applications. Utilizing rolling element bearings as sensors and monitoring their health by the electrical impedance method are promising approaches as it allows, e.g., load sensing and detection of bearing failures. The impedance cannot be measured directly, but there are various methods available. This paper discusses advantages and disadvantages and suggests the AC Wheatstone bridge as a reliable way of measuring impedances with low phase angles at sampling rates in the kHz range. The corresponding equations are introduced, a simulation built, an uncertainty mode and effects analysis carried out and sample measurement results of real rolling elements shown. It can be demonstrated that the AC Wheatstone bridge meets the proposed requirements for sensory utilization and condition monitoring when the bearing is operated in the hydrodynamic regime.
1 Introduction
1.1 Impedance measurement of rolling bearings
Rolling bearings are central components in many machines. Because of their crucial role in leading process forces into the machine structure, bearing failures cause nearly 20% of all machine breakdowns (Harris and Kotzalas, 2007; Schaeffler Technologies AG and Co. KG, 2000; Becker-Dombrowsky and Kirchner, 2024). With the arising e-mobility, another bearing fault type gets into the focus of research, namely, surface damages based on harmful electric bearing currents (Harder et al., 2022a). In both cases, the electric impedance can give information about the bearing condition.
To avoid unexpected system faults of machines, a precise knowledge about the mechanical and electrical bearing loads as well as health conditions is essential. Martin et al. (2022) showed that measuring the bearing impedance allows to detect damages in the runway surfaces like pittings. Becker-Dombrowsky et al. (2023) used the data generated by Martin et al. and investigated it in time and frequency domain. Three different phases in rolling bearing lifetime were identified and the end of bearings’ life could be detected. So, impedance based condition monitoring of rolling element bearings is possible. The gauging principle is based on the description of the electrical behavior of the rolling contact, which is regarded in the next section.
1.2 Electrical behavior of rolling contacts
Depending on the lubrication film thickness, three different electrical equivalent models can be described. In case of dry friction, a direct metallic contact between rolling elements and runways exists. The observed electrical behavior is equivalent to an ohmic resistance. With increasing lubrication film thickness, an elasto hydrodynamic lubrication (EHL) contact is built between the rolling elements and the runways. Now, the equivalent circuit can be extended by a capacitor in parallel connection. The capacitor is the Hertz’ian contact zone, which is formed by the bearing loads (Prashad, 1988; Muetze, 2003; Gemeinder, 2016; Schneider et al., 2022a; b). If the lubrication film thickness is insufficient, breakdown voltages like in electrical discharge machining (EDM) machines harm the surfaces of the contact partners. The reason is, that the electric field strength in the Hertz’ian area is high enough to overbear the dielectric strength in the EHL contact, so a harmful current can be transmitted through the lubrication gap. When a sufficient lubrication film separates the contact partners completely, the EHL contact zone can be modeled as the described parallel connection of ohmic resistance and capacitor, in which the capacitive part prevails (Prashad, 1988; Muetze, 2003; Gemeinder, 2016; Schneider et al., 2022a; b). The rolling bearing impedance is a result of the impedance of the single rolling element contact to the runway. These single contacts are connected in parallel. The single contact itself is modeled as a serial connection of two plate capacitors, each in parallel connection to an ohmic resistance. Knowing the electrical properties of rolling element bearings enables their usage as sensors or their usage as condition monitoring device. To do so, the impedance has to be measured during the operation of the bearing. In the next section, impedance measurement approaches will be presented.
1.3 Impedance measurement methods
Currently, impedance measurement is used for lubrication film thickness observation (Barz, 1996). Martin et al. could show the possibilities of using the electric bearing properties for condition monitoring. They were able to observe the pitting growth after initial damage in the rolling bearing raceways and to gauge the damage dimensions (Martin et al., 2022). Becker-Dombrowsky et al. expanded the analysis of Martin et al. in the time and frequency domain to enlarge the amount of data using feature engineering techniques (Becker-Dombrowsky et al., 2023). They are able to distinguish three rolling bearing operational time phases and to detect bearings end of life (Becker-Dombrowsky et al., 2023). The impedance measurement can also be used to identify the load condition in the bearing (Schirra et al., 2018). So, the rolling bearing becomes an active element in the measurement circle. When the impedance is used to explain harmful electric conditions in the rolling contact, it is a reacting or passive element. For both approaches, the Hertz’ian contact area has to be calculated according to Equation 1 (Prashad, 1988):
where
1.3.1 Charging curve detection
This measurement method is used for lubrication film thickness detection. It utilizes direct current as a carrier signal. To get the impedance of the EHL contact, the known current is let through the bearing. Then the time is measured until a defined voltage level is reached. With this information, the capacitance and the impedance can be calculated. The capacitance is proportional to the time (Barz, 1996).
1.3.2 Current and voltage measurement
This gauging method is based on the Ohm’s law for the alternating current (AC) circuit. By measuring the bearing voltage over the time and the current through the bearing, the impedance can be calculated (Keysight Technologies, 2020). It is applicable for measurement frequencies between 10 kHz and 100 MHz. Its accuracy depends on the voltage and current measurement systems, which is defined by the working frequency of the gauging device (Keysight Technologies, 2020). The measurement errors can be corrected or minimized, when the inner ohmic resistance of the device is lower than the measured impedance. So, this method is mainly used for detecting higher impedances (Plaßmann and Schulz, 2016).
1.3.3 Voltage comparison
The voltage comparison is able to minimize measurement errors, because it is based on a voltage divider. That means, it needs a known reference impedance
The equivalent circuit is shown in Figure 1A. The advantage of this method is, that systematic errors will be minimized (Lerch, 2016). But the inner resistance of the voltage gauging device has to be higher than the observed impedance. If it is not possible to realize this, the reference impedance has to be in the same range as the observed impedance to reduce measurement errors.
1.3.4 Measurement bridge
Measurement bridges are able to use direct and alternating current as carrier signal. They need three known reference impedances to detect the unknown fourth impedance. The generator voltage and the bridge voltage are measured using an oscilloscope or equivalent device (Lerch, 2016). The unknown impedance is calculated by transforming Equation 3 for the searched impedance (Lerch, 2016):
An equivalent circuit of a measurement bridge is shown in Figure 1B. The inner resistance of the measurement device and the resistance of the wires can lead to errors, which has to be considered. The main advantage of this measurement principle is its robustness against environmental influences (Plaßmann and Schulz, 2016) and its sensitivity (Mitvalsky, 1964). According to the measurement task, an AC Wheatstone bridge can be configured in different ways (Cone, 1920). Another variant is the balanced AC Wheatstone bridge, where a reference impedance is tuned until the bridge voltage is zero
1.3.5 Comparison of measurement methods
In this subsection, the suitability of the single impedance measurement methods for the single contact measurement and the rolling bearing operational time observation will be discussed. The charging curve detection can lead to currents when metallic contacts occur. Thus, a constant signal during the operational time will not be possible. So, the charging curve detection is not suitable for the aim of this paper. The current and voltage measurement method needs a lower inner ohmic resistance of the measurement devices than the observed impedance to reduce measurement errors. The inner resistance of the used oscilloscope is higher than one mega ohm. The rolling bearing impedance for a carrier signal of 20 kHz is about several kilo ohms, which means it is lower than the inner resistance. So this method is not applicable for this case. The voltage comparison method has been used to detect rolling bearing damages by Martin et al. (2022). The bearing seat isolation of the test rig chamber was used as a reference impedance, which can be influenced by the environment and the tests themselves. The carrier signal was about 2.5 MHz. This reference impedance can not be adapted to the expected rolling bearing impedance, so a possible measurement error can not be reduced. An external reference impedance could be adapted and avoid measurement errors. This would be able with a measurement bridge. Because of its robustness against environmental influences, an alternating voltage measurement bridge is more suitable for the single contact and operational time observation. So the measurement bridge is chosen as a new impedance measurement approach. It will be compared to the voltage comparison method in this paper as state of the art in the next sections. In general, the electrical parameters have to be chosen carefully, because all kinds of currents might be harmful to the bearing when the current density in the contact zone is to high (Muetze, 2003; Harder et al., 2022b). In this research, the current density is low enough to avoid harmful currents.
1.4 Contributions of this paper
In this paper, the approach of the AC Wheatstone bridge is investigated and refined for rolling bearing applications. The necessary equations to calculate the complex impedance from the measurement while taking the loading effect into account are derived. Furthermore, the procedure to retrieve the reference impedances from measurements on the assembled AC bridge are presented. An uncertainty mode and effects analysis (UMEA) systematically exposes uncertainties of the method. A simulation is used to gain information of the influence of noise and the frequency response of the method. Lastly, two examplary use cases of impedance measurement of rolling bearings are presented to show the usability of the measurement method for the intended use case.
2 Materials and methods
2.1 Alternating voltage measurement bridge function
In the following, the AC Wheatstone bridge as described in Section 1.3.4; Figure 1B is enhanced. To take the loading effect of the differential oscilloscope probe measuring
The generator voltage phase is defined as
Subsequently, a first order low pass filter at
Finally, the parallel capacitance
2.1.1 Measurement uncertainty
The impedances
Using the trust-region dogleg algorithm implemented as fsolve in Matlab, all
The impedance
2.2 Uncertainty consideration
The UMEA methodology is used for the analysis of uncertainties in the context of product development. It is divided into five steps, which are briefly described below. Figure 2 schematically shows the procedure for this methodology.
The first step is an environment and target analysis, in which the systems to be considered are defined by means of system boundaries and differentiated from other systems (Engelhardt, 2012). Interfaces to other systems are named and their influences on the system under consideration are taken into account. This is followed by the identification of uncertainties, in which these are named, and their causes are investigated. For this, system models are necessary in order to be able to describe the influences sufficiently precisely (Engelhardt, 2012). Then the uncertainty effects are determined, which is followed by the penultimate step of the UMEA methodology, the uncertainty evaluation. Based on this, a final decision is made regarding the countermeasures to be applied (Engelhardt, 2012).
First, the investigated system is described. On the basis of this description, the necessary system boundaries are defined and the disturbance, input, output and secondary variables acting on it are identified. The definitions of these quantities given below follow that of Mathias and are briefly presented here (Mathias, 2016).
As can be seen from the definitions, disturbance variables and secondary variables have largely the same effect and can therefore be regarded as equivalent (Mathias, 2016). Thus, no distinction is made between them in the identification of disturbances by means of lists.
2.3 Simulation model
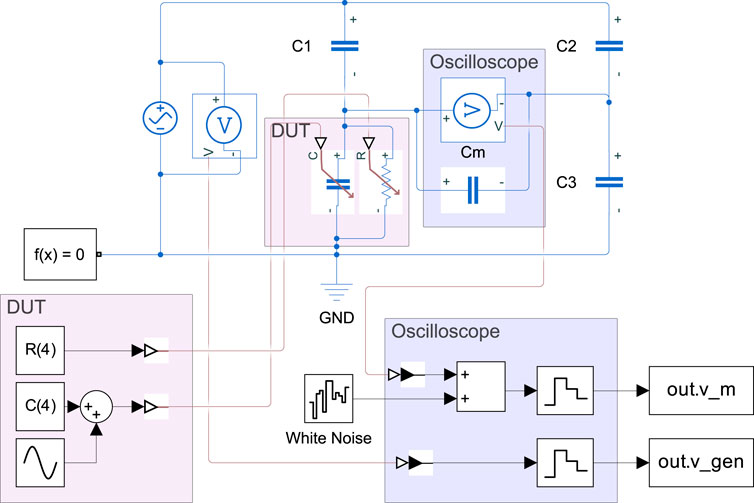
A Matlab Simulink model was developed to investigate the behavior of the AC Wheatstone bridge in ideal conditions. Figure 3 shows the diagram of the model. The parallel connection of a variable capacitor and a resistor simulates the DUT. The impedances
2.4 Application tests
2.4.1 Rolling bearing test rig
The rolling bearing test rig has four test chambers which can be operated independently. Four rolling element bearings are run in a single chamber. All bearings are loaded radially and in addition, two bearings can be loaded axially if necessary. Each chamber is equipped with an own recirculating oil lubrication system, so oil lubrication besides grease lubrication can be investigated. For test observation, axial and radial vibration sensors and four temperature sensors are located at the chamber. In addition, the motor speed and torque is monitored to enlarge the system information spectrum. Figure 4 shows a cross-section of one chamber. The two rolling bearings in the center induce the radial loads to the two outer bearings. The outer bearings can be loaded axially by the hydraulic actuator on the left side. The radial load induction is also realized by a hydraulic actuator above the chamber.
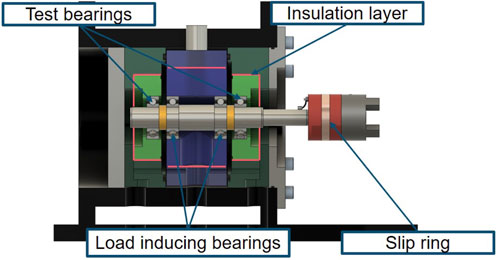
Figure 4. Cross section of one rolling bearing test rig chamber. According to (Becker-Dombrowsky et al., 2024)
To avoid parasitic currents and other disturbing factors based on electric phenomena, the steel bearing seats are surrounded by a 50 mm thick isolation layer made from fiber glass. For the electrically investigated bearings, the isolation is over-bridged using contact pins. The shaft is contacted by a slip ring.
2.4.2 Single contact test
An application of the impedance measurement method described is testing single steel ball bearings. Therefore, a ceramic ball of a hybrid bearing is replaced by a steel ball of the same diameter, as first described by Jabłonka et al. (2018). Thus, the impedance of a single ball can be measured. Some test results as well as the calculation of the changed mechanical behavior due to different elasticities and thermal expansion coefficients of steel and ceramic, is described in Puchtler et al. (2023a). For small load angles
2.4.3 Fatigue tests
To investigate the applicability of the new measurement approach, fatigue tests were run at the test rig described in Section 2.4.1. Two different rolling bearing types are used, deep groove ball bearings (6205) and angular deep groove ball bearings (7205). Both bearing types have the same dimensions. All bearings are loaded by a resulting load ratio of
3 Results and discussion
3.1 UMEA
In this section, the predominant disturbance variables are identified. For this purpose, system boundaries are defined first and then the disturbance variables acting on the respective system are determined. These are evaluated in accordance with the methodology described in Section 2.2. This is followed by an explanation of possible solutions for dealing with the disturbance variables.
3.1.1 Disturbance identification
The analyzed system consists of the measuring system for determining the impedance of the test bearings, which includes the signal lines and the oscilloscope. It also includes the connection contacts of the bearing seats and the associated measuring leads. In addition, the lines of the carrier signal, which is generated by a signal generator, and the signal generator itself are counted as part of the system. The measurement system mentioned here must be distinguished from the systems installed in the test bench for test bench operation.
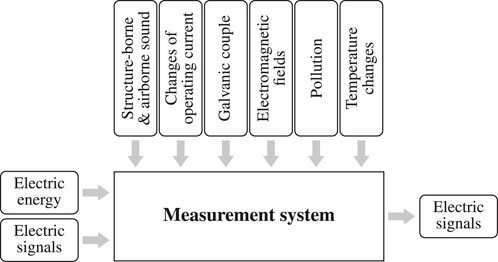
The measuring system for impedance measurement considered in this paper uses an AC voltage as a carrier signal, from whose changes conclusions are drawn about the states of the test bearings. Thus, this electrical signal represents an input variable for the measuring system. In order to operate the measuring system, components such as the oscilloscope require electrical energy, which therefore also represents an input variable. The measuring system perceives the changes in the impedance, whereby it generates electrical signals as an output variable, which are further processed by software after analog-to-digital conversion. The identified disturbance factors are displayed in Figure 5.
The determination of external disturbances is based on the use of checklists. The identified disturbance variables are now presented here and their effects will be evaluated.
3.1.1.1 Material-bound waves
Neighboring test stands and test setups as well as test chambers can result in the transmission of sound waves. These occur in the form of structure-borne sound when they are transmitted via the foundation to the test stand and thus the test station. Furthermore, structure-borne sound can be transmitted to the test chamber through the base plate on which the motor and test chamber are mounted. In addition, structure-borne noise is transmitted between the test stations by the test stand frame. Another possibility is transmission as airborne sound directly to the test station and test chamber. The sound can cause vibrations that can be reflected in the measurement signal.
3.1.1.2 Electricity and magnetism
In the systems of the test station, the test chamber and the measuring system, electrical operating currents are present during normal operation, as are current changes and fluctuating electrical voltages. Since all measurement methods in question use a carrier signal in the form of an electrical voltage, this can be affected by changes in current, normal operating currents and voltage changes. A greater interference potential results from unequal charge levels. This can result in unintended current flows that affect the measurements as such. Grounding problems are also assigned to this area. Galvanic coupling of the signal generator used and the test stand may occur due to a ground loop. This occurs when the respective housings are grounded via the protective contacts of their mains connections because of the protection against contact. As a result, interference currents are induced, which can directly influence the carrier signal and therefore also the measurement. Since electric motors are used to generate the speeds required for the tests, electromagnetic fields can also occur which affect the measuring system. Likewise, influences by neighboring test stands, which work with stronger electromagnetic fields, are possible. In order to be able to make more detailed statements on this, field measurements must be carried out in the test hall.
3.1.1.3 Motion-based phenomena
Because the test rig is located in the Earth’s gravitational field, Newtonian gravity is present for all systems. However, this has no direct effect on the measurements and affects all systems equally. Thus, gravity is not considered further as a disturbance variable.
3.1.1.4 Foreign solids and liquids
Due to dusts in the ambient air, deposits of these may occur on the system under consideration. The same applies to greases and oils. Since the measuring system is not encapsulated from the environment, it is subject to the humidity of the environment. All the factors mentioned have an equal effect on the system, and their effect on the measurement must be questioned. Nevertheless, there is a risk of measurement system failure due to ingress of foreign matter such as dust particles into the measurement equipment. However, these problems are usually solved on the manufacturer’s side, so they will not be discussed in detail here. In the case of slip ring contacting, contamination up to the formation of an oxide layer can occur. These can influence the measurement signal.
3.1.1.5 Thermodynamics
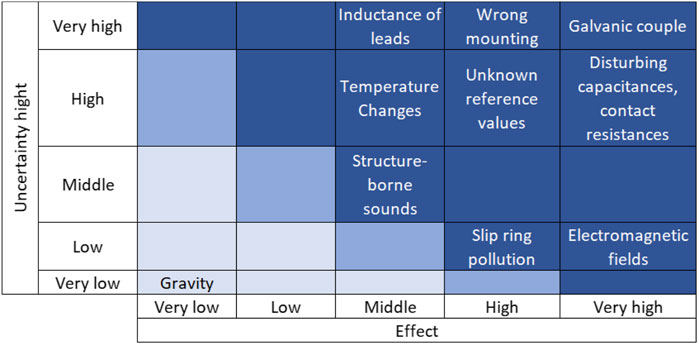
Due to the environment and the operation of the test stand itself, the phenomena of heat dissipation and heat supply occur. These can result in changes in resistance, which can lead to falsification of measurement results. The following Figure 6 summarizes the findings with regard to the disturbance variables acting on the measurement system.
3.1.2 Disturbance evaluation
Structure-borne and airborne noise have a medium uncertainty level and a medium effect, since they reach the measurement point over longer distances or components with damping material properties lie in between. A direct influence on the measurements cannot be excluded. The impact is classified as medium, since vibrations due to structure-borne and airborne noise are part of the operating conditions of bearings. Since the slip ring is directly in the signal flow, the effects due to contamination on the measurement signal are high. However, the uncertainty level is low because contaminants are removed by rotation as a result of operation. Electromagnetic fields are able to induce currents (Schwab and Kürner, 2007), so their effects are classified as very high. However, since there are distances through air between the sources and the measurement system, the uncertainty level is considered low. Changes in temperature can result in changes in resistance, which directly influence the electrical behavior of the measuring section (Mühl, 2020). Therefore, they have a medium effect on the measurement quality, whereas the uncertainty level is to be classified as high. The reason for this is the non-enclosed environment of the test stand and the measuring system, whereby changes in the environmental influences have a direct effect on the systems. Unknown or not fully known reference variables are to be classified as high in amount and impact. Since they are directly included in the evaluation, all uncertainties associated with them are therefore also included in the result. Interference capacitance and contact resistances have a direct effect on the electrical path and can thus cause undefined current flows that directly influence the electrical behavior. Therefore, their effects on the measurement are very high. Due to the test chamber design, their uncertainty level is considered high. Line inductance and the associated line resistances occur in almost all test leads, and their uncertainty level must therefore be classified as very high. Their effects are not negligible because they conduct the electrical signals to the evaluation equipment. Incorrect mounting of bearings has to be classified high in its effect, because it may cause changed operating conditions, which do not correspond to the rule. In case of insufficient mounting skills and knowledge, their uncertainty level is very high. As the previous evaluations make clear, uncertainties acting directly in or on the signal flow are to be considered very high in their effects. Therefore, undefined current flows, grounding problems and also damaged or insufficient insulation are extremely critical in their effect. They allow for changes in the electrical operating behavior, making the models on which the measurement is based only partially or no longer reflect the behavior. Since undefined current flows as a result of several factors and a grounding problem are given by the current technical status of the test chamber, its uncertainty level is very high. This also applies in the case of insulation, if damage is present. Figure 7 summarizes the results of the evaluation.
3.1.3 Disturbance handling
In the following, only disturbance variables that have been classified as critical or no longer acceptable according to the Zurich hazard analysis method are considered with regard to their controllability. In order to find approaches for dealing with the disturbance variables, Mathias’ catalog of principles is used at this point (Mathias, 2016). Priority is given to the elimination of the disturbance variable or its influence, since an influence on the measurement can thus be excluded and consideration in the evaluation is no longer necessary.
3.1.3.1 Material-bound waves
Structure-borne sound waves due to adjacent test equipment can be reduced or suppressed by decoupling the rolling bearing test rig from the ground (Mathias, 2016). This is already done. The extent to which the effects on measurement were prevented cannot be assessed at this point.
3.1.3.2 Electricity and magnetism
To reduce the influence of electromagnetic fields, it is recommended to shield the electrical conductors of the measuring system or to use shielded cables (Mathias, 2016). Currently, bayonet nut connector (BNC) cables are mainly used as measuring lines. They are a form of coaxial cable and are suitable for the low-loss transmission of high-frequency signals (Rossmann, 2018). However, they exhibit parasitic effects which cannot be neglected (Schwab and Kürner, 2007). Therefore, these must be taken into account in the evaluation of the impedance signals. Another problem with coaxial cables is the effect they have on ground loops (Schwab and Kürner, 2007). Therefore, appropriate countermeasures must be taken. In order to reduce the influence of ground loops, a separate housing grounding of the test chamber is provided for the endurance tests. This is not grounded via a mains connection, but connected to a grounding bar subsequently installed in the test field. In this way, interference currents from the enclosure are to be discharged directly via the building ground and only have a minor effect on the carrier signal. The effect of this consideration will be checked in the course of this paper in later tests.
3.1.3.3 Thermodynamics
All three systems considered are subject to the same climatic conditions. Therefore, the influences on the impedance measurement caused by temperature changes are to be taken into account and compensated by the measurement and evaluation procedure. Measuring bridges generally have the advantage that they can compensate for disturbing influences such as temperature changes and also have a high measuring sensitivity (Mühl, 2020). In addition, the compensation of the resistances of the BNC lines is provided in the evaluation algorithm.
3.2 Simulation tests
In the following, results retrieved from the Matlab/Simulink simulation model of the AC Wheatstone bridge as introduced in Section 2.3 are presented.
3.2.1 Frequency influence
First, the frequency range in which capacitance changes can be measured reliably is investigated. Figure 8 shows simulation results of the Matlab/Simulink model described in Section 2.3. The capacitance was sinusoidally varied with a mean value of 500 pF, an amplitude of 400 pF and a varied frequency of 10 … 500 Hz as depicted on the
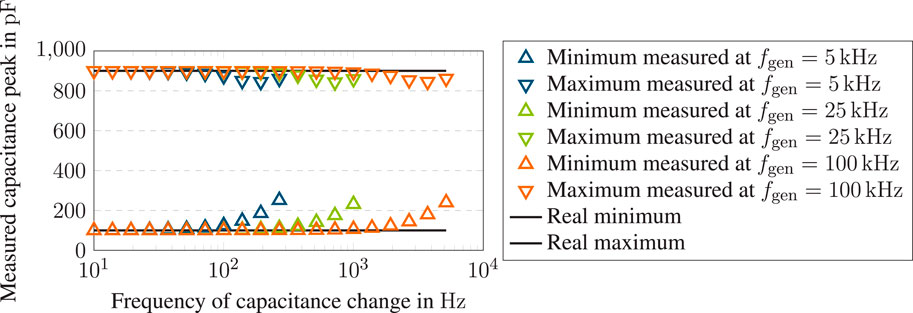
Figure 8. Simulation results of a sinusoidal changing capacitance
Thus, a limit frequency can be derived for a maximum error of 5% at
3.2.2 Noise influence
Then, a white noise signal was added to the measured bridge voltage

Figure 9. Simulation results of the AC Wheatstone bridge with additional white noise on the measured bridge voltage with a generator frequency of
For comparison, a simulation model of the voltage comparison method, Figure 1A, was developed. The Simulink model, Figure 3, was adapted to the corresponding circuit, using a 7.5 kΩ reference resistor to achieve the same balance impedance at fm = 25 kHz as C1 for the AC bridge circuit. The evaluation procedure of the simulation results is mostly analog to the one described in Section 2.1. Firstly, the voltage ratio
It can be seen that for all signal-to-noise ratios, the AC Wheatstone bridge shows a smaller deviation from the true value than the voltage comparison method. Similarly, the standard deviation of the results is smaller for the newly proposed method.
3.3 Single contact test
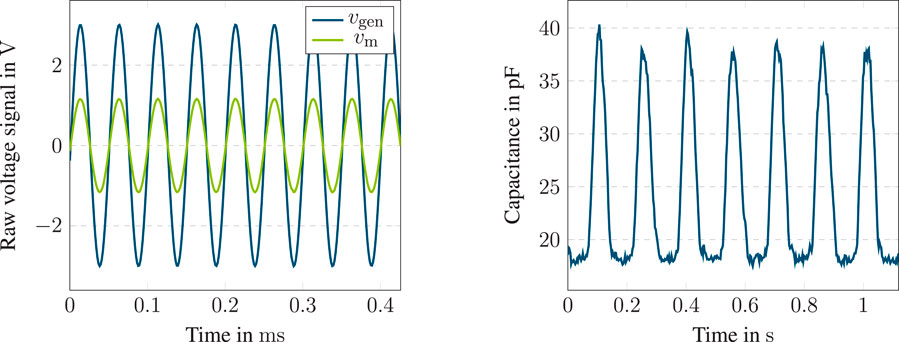
Measuring a single steel ball deep groove ball bearing (6205) with the alternating voltage measurement bridge under load results in two voltage signals, which are depicted in Figure 10A. The voltage signal
Using the proposed methods of Section 2.1 the capacitance signal over time can be calculated from the raw
Separating each rotation of the ball bearing, an averaged capacitance signal can be extracted for different load conditions. In Figure 11 multiple averaged capacitance measurements are depicted with varying radial force
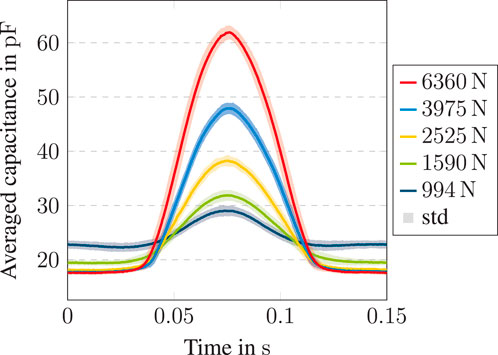
Figure 11. Averaged capacitance measurements of single steel ball bearing at
Similar results are present using a calculation model, which mathematically describes the geometrical correlation of the ball bearing components and lubricant. Good agreement of calculated and measured results indicates that the simulation model (Section 2.3) used to extract the capacitance of the system is accurate and reliable. Due to mathematical boundaries, only the hydrodynamic regime with oil lubrication can be considered (Puchtler et al., 2023b).
3.4 Fatigue tests
Investigations of the data generated by using the alternating current measurement bridge show that three different phases can be identified in bearings’ operating life in the frequency domain. According to Martin et al., a run-in phase, a normal operation phase and a failure phase can be detected, which ensures the usage of the new measurement approach Martin et al. (2022). In time domain, the real part of the impedance data of Martin et al. is negative Martin et al. (2022). In contrast, the real part of the signals generated with this measurement approach is not negative. That makes sense, because a negative real part would implicate an energy gain in the system, which is physically implausible. In general, the measured signals have a high repeatability in their absolute value under the same operating conditions. The bearings for these test were operated under a load ratio
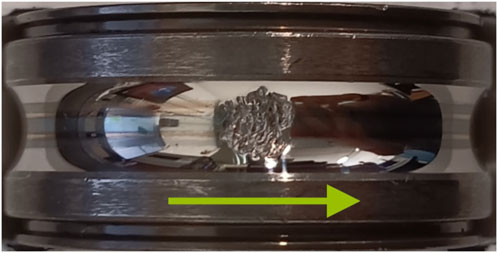
Figure 12. Pitting damage at the inner ring of bearing A, bearing type 6205, radial load
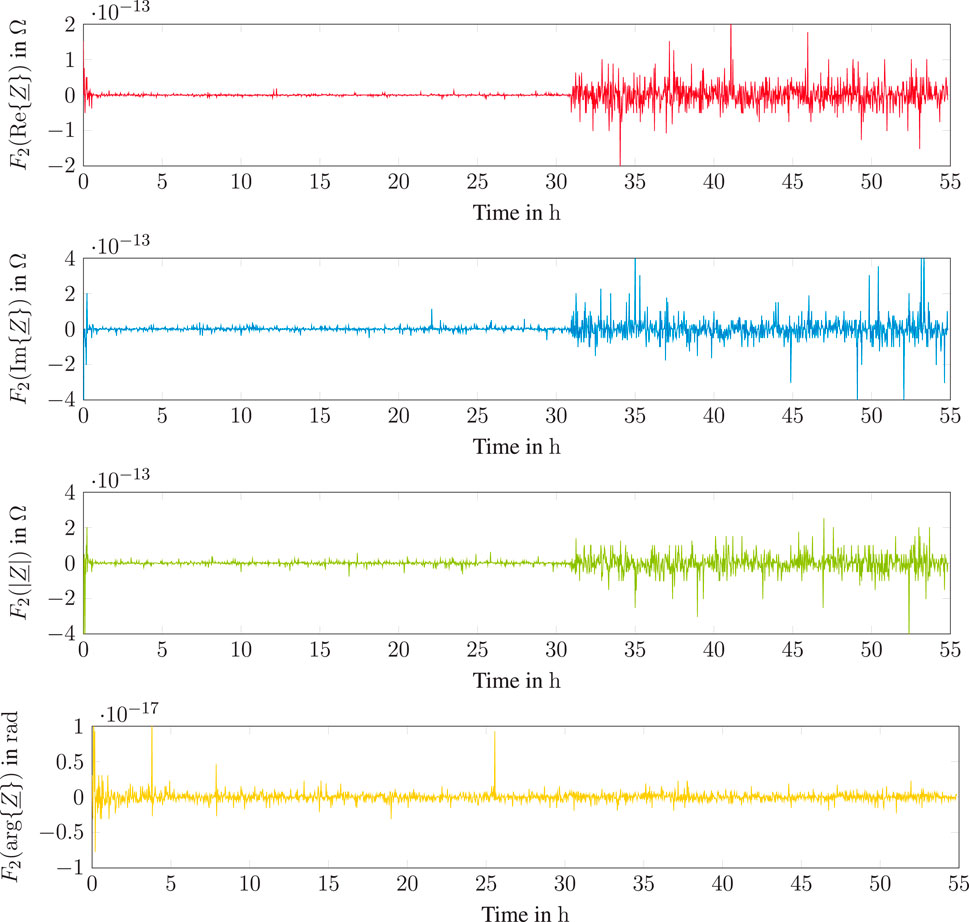
Figure 13. Frequency feature
Figure 12 shows the pitting damage after the bearing test rig was stopped by the internal vibration observation. The pitting was not detected sufficiently enough by the internal vibration observation system of the test bench, which can be seen in its dimensions.
Investigating the electrical impedance signals of the fatigue test with the pitting damage shown in Figure 12 in time and frequency domain increases the information density for condition monitoring. It is essential to detect the damage phase and to differentiate between run-in phase and damage phase. As described by Martin et al. (2022) and Becker-Dombrowsky et al. (2023), the run-in phase is dominant in the pure impedance signal over the operational time. Therefore, different approaches are used to optimize the signal. To do so, the impedance signal is transformed into frequency domain and different features have been calculated and plotted over the operational time to identify significant signal changes. Figure 13 shows exemplary the behavior of the frequency feature
The feature signals of real part, imaginary part and absolute value behave different for run-in phase, normal condition phase and damage phase. Due to a higher number of metallic contacts in the run-in phase, the phase angle tends temporary to zero and back again to
4 Conclusion
In this paper, a visualization technique for rolling bearings, the impedance measurement, was improved. A suitable measurement principle was identified and developed to measure the impedance of rolling element bearings at a several kHz sampling rate and high disturbance resilience, confirming the axpectations and assumptions initially made. First, different impedance measurement principles were introduced and an UMEA was carried out for the most promising approach, the unbalanced AC Wheatstone bridge. A simulation model was developed to study disturbance on the measurement and to investigate the edge frequency up to which a frequency domain analysis of the measured impedance is meaningful. To estimate the latter, an equation was derived. Then, the measurement bridge was physically built and tested in two practical applications. Firstly, measuring the impedance of single steel ball bearings to measure the contact capacitance of a single ball in a radial deep groove ball bearing. Secondly, the impedance of a normal radial deep groove ball bearing was measured over its lifetime in an accelerated fatigue test. In both tests, the AC Wheatstone bridge delivered low-noise and high-frequency impedance signals and therefore proofed suitable for its application in measuring rolling bearing’s impedance. This enables the visualization of rolling contact characteristics in a broad range of fields. Wherever a shaft can be electrically accessed with a slip ring and the bearing seat can be isolated, the bearing’s impedance can be measured, independent of the application. In future research, remaining useful life models will be developed for better exploitation with reduced maintenance costs at the same time. Additionally, the impedance can be used to retrieve valuable process information, like the applied load.
Data availability statement
The raw data supporting the conclusions of this article will be made available by the authors, without undue reservation.
Author contributions
SP: Conceptualization, Data curation, Formal Analysis, Investigation, Methodology, Software, Validation, Visualization, Writing–original draft, Writing–review and editing. JK: Data curation, Formal Analysis, Investigation, Validation, Visualization, Writing–original draft, Writing–review and editing. FB-D: Conceptualization, Data curation, Formal Analysis, Investigation, Methodology, Validation, Writing–original draft, Writing–review and editing. EK: Funding acquisition, Resources, Supervision, Writing–review and editing.
Funding
The author(s) declare that no financial support was received for the research, authorship, and/or publication of this article.
Conflict of interest
The authors declare that the research was conducted in the absence of any commercial or financial relationships that could be construed as a potential conflict of interest.
The handling editor HO is currently organizing a Research Topic with the author FB-D.
Publisher’s note
All claims expressed in this article are solely those of the authors and do not necessarily represent those of their affiliated organizations, or those of the publisher, the editors and the reviewers. Any product that may be evaluated in this article, or claim that may be made by its manufacturer, is not guaranteed or endorsed by the publisher.
Abbreviations
AC, alternating current; BNC, bayonet nut connector; DUT, device under test; EDM, electrical discharge machining; EHL, elasto hydrodynamic lubrication; SNR, signal-to-noise ratio; UMEA, uncertainty mode and effects analysis.
References
Alessio, S. M. (2016). Digital signal processing and spectral analysis for scientists. Cham: Springer International Publishing.
Barz, M. (1996). Die schmierfilmbildung in fettgeschmierten schnellaufenden spindellagern. Hannover: Gottfried Wilhelm Leibniz Universität Hannover. Dissertation.
Becker-Dombrowsky, F. M., and Kirchner, E. (2024). Electrical impedance based condition monitoring of machine elements – a systematic review. Front. Mech. Eng. 10. doi:10.3389/fmech.2024.1412137
Becker-Dombrowsky, F. M., Koplin, Q. S., and Kirchner, E. (2023). Individual feature selection of rolling bearing impedance signals for early failure detection. Lubricants 11, 304. doi:10.3390/lubricants11070304
Becker-Dombrowsky, F. M., Schink, J., Frischmuth, J., and Kirchner, E. (2024). Investigation of the electrical impedance signal behavior in rolling element bearings as a new approach for damage detection. Machines 12, 487. doi:10.3390/machines12070487
Chattopadhyay, S., Banerjee, M., and Pal, S. (2012). Modified ac whetstone bridge network for accurate measurement of pressure using strain gauge type pressure sensor. Sensors and Transducers 136, 25–34.
Cone, D. I. (1920). Bridge methods for alternating-current measurements. J. Am. Inst. Electr. Eng. 39, 640–647. doi:10.1109/joaiee.1920.6591779
Engelhardt, R. A. (2012). Uncertainty Mode and Effects Analysis – heuristische Methodik zur Analyse und Beurteilung von Unsicherheiten in technischen Systemen des Maschinenbaus. Technische Universität Darmstadt. Dissertation.
Gemeinder, Y. (2016). Lagerimpedanz und Lagerschädigung bei Stromdurchgang in umrichtergespeisten elektrischen Maschinen. Technische Universität Darmstadt. Dissertation.
Gupta, N., Patel, S., and Hmurick, L. V. (2020). “Using an un-balanced ac whetstone bridge to measure capacitance and inductance,” in 2020 international Conference on computational performance evaluation (ComPE) (IEEE), 266–268.
Harder, A., Zaiat, A., Becker-Dombrowsky, F. M., Puchtler, S., and Kirchner, E. (2022a). Investigation of the voltage-induced damage progression on the raceway surfaces of thrust ball bearings. Machines 10, 832. doi:10.3390/machines10100832
Harder, A., Zaiat, A., Becker-Dombrowsky, F. M., Puchtler, S., and Kirchner, E. (2022b). Investigation of the voltage-induced damage progression on the raceway surfaces of thrust ball bearings. Machines 10, 832. doi:10.3390/machines10100832
Harris, T. A., and Kotzalas, M. N. (2007). Essential concepts of bearing technology, vol. 1 of Rolling bearing analysis/Tedric A. Harris Michael N. Kotzalas. fifth edition edn. Boca Raton, London, New York: CRC Press.
Jabłonka, K., Glovnea, R., and Bongaerts, J. (2018). Quantitative measurements of film thickness in a radially loaded deep-groove ball bearing. Tribol. Int. 119, 239–249. doi:10.1016/j.triboint.2017.11.001
Keysight Technologies (2020). Impedance measurement handbook: a guide to measurement Technology and techniques. 6. edn.
Martin, G., Becker, F. M., and Kirchner, E. (2022). A novel method for diagnosing rolling bearing surface damage by electric impedance analysis. Tribol. Int. 170, 107503. doi:10.1016/j.triboint.2022.107503
Maruyama, T., Radzi, F., Sato, T., Iwase, S., Maeda, M., and Nakano, K. (2023). Lubrication condition monitoring in ehd line contacts of thrust needle roller bearing using the electrical impedance method. Lubricants 11, 223. doi:10.3390/lubricants11050223
Mathias, J. (2016). Auf dem Weg zu robusten Lösungen - Modelle und Methoden zur Beherrschung von Unsicherheit in den frühen Phasen der Produktentwicklung. Technische Universität Darmstadt. Dissertation.
Mitvalsky, V. (1964). The maximum sensitivity of the unbalanced wheatstone bridge. J. Sci. Instrum. 41, 454–457. doi:10.1088/0950-7671/41/7/310
Muetze, A. (2003). Bearing currents in inverter-fed AC-motors. Technische Universität Darmstadt. Dissertation.
Mühl, T. (2020). Elektrische messtechnik: grundlagen, messverfahren, anwendungen. Wiesbaden: Springer Vieweg.
Plaßmann, W., and Schulz, D. (2016). Handbuch Elektrotechnik: Grundlagen und Anwendungen für Elektrotechniker. Wiesbaden: Springer Vieweg, 7. , neu bearbeitete auflage edn.
Prashad, H. (1988). Theoretical evaluation of impedance, capacitance and charge accumulation on roller bearings operated under electrical fields. Wear 125, 223–239. doi:10.1016/0043-1648(88)90115-9
Puchtler, S., Maier, R., Kuhn, M., and Burkhardt, Y. (2023a). “Der initiale elektrische Durchschlag: Einflüsse und Auswirkungen,” in Gleit-und Wälzlagerungen 2023 (Düsseldorf: VDI Verlag GmbH), VDI-Berichte. 21–29.
Puchtler, S., Schirra, T., Kirchner, E., Späck-Leigsnering, Y., and de Gersem, H. (2022). Capacitance calculation of unloaded rolling elements – comparison of analytical and numerical methods. Tribol. Int. 176, 107882. doi:10.1016/j.triboint.2022.107882
Puchtler, S., van der Kuip, J., and Kirchner, E. (2023b). Analyzing ball bearing capacitance using single steel ball bearings. Tribol. Lett. 71, 38. doi:10.1007/s11249-023-01706-7
Rossmann, A. (2018). Strukturbildung und Simulation Technischer Systeme: Band 2, Teil 2: Elektrische und Mechanische Dynamik. Berlin, Heidelberg: Springer Berlin/Heidelberg.
Rybski, R., Kaczmarek, J., and Kontorski, K. (2015). Impedance comparison using unbalanced bridge with digital sine wave voltage sources. IEEE Trans. Instrum. Meas. 64, 3380–3386. doi:10.1109/tim.2015.2444255
Schaeffler Technologies AG and Co (2000). Wälzlagerschäden: Schadenserkennung und Begutachtung gelaufener Wälzlager.
Schirra, T., Martin, G., Neu, M., and Kirchner, E. (2019) “Feasibility study of impedance analysis for measuring rolling bearing loads (Nashville),” in 74th STLE annual meeting.
Schirra, T., Martin, G., Vogel, S., and Kirchner, E. (2018). “Ball bearings as sensors for systematical combination of load and failure monitoring,” in Design 2018. Editors D. Marjanović, M. Štorga, S. Škec, N. Bojčetić, and N. Pavković (Glasgow, UK: Zagreb: Fac. of Mechanical Engineering and Naval Architecture Univ), 3011–3022. doi:10.21278/idc.2018.0306
Schneider, V., Bader, N., Liu, H., and Poll, G. (2022a). Method for in situ film thickness measurement of ball bearings under combined loading using capacitance measurements. Tribol. Int. 171, 107524. doi:10.1016/j.triboint.2022.107524
Schneider, V., Behrendt, C., Höltje, P., Cornel, D., Becker-Dombrowsky, F. M., Puchtler, S., et al. (2022b). Electrical bearing damage, A problem in the nano- and macro-range. Lubricants 10, 194. doi:10.3390/lubricants10080194
Schwab, A. J., and Kürner, W. (2007) Elektromagnetische Verträglichkeit; mit 15 Tabellen, 5. Berlin: Springer.
Keywords: bearing, impedance, measurement, visualization, condition monitoring
Citation: Puchtler S, van der Kuip J, Becker-Dombrowsky FM and Kirchner E (2024) Impedance measurement of rolling bearings using an unbalanced AC wheatstone bridge. Front. Mech. Eng. 10:1456618. doi: 10.3389/fmech.2024.1456618
Received: 28 June 2024; Accepted: 17 October 2024;
Published: 05 November 2024.
Edited by:
Hikaru Okubo, Yokohama National University, JapanReviewed by:
Shouhei Kawada, Kansai University, JapanSatoshi Momozono, Tokyo Institute of Technology, Japan
Copyright © 2024 Puchtler, van der Kuip, Becker-Dombrowsky and Kirchner. This is an open-access article distributed under the terms of the Creative Commons Attribution License (CC BY). The use, distribution or reproduction in other forums is permitted, provided the original author(s) and the copyright owner(s) are credited and that the original publication in this journal is cited, in accordance with accepted academic practice. No use, distribution or reproduction is permitted which does not comply with these terms.
*Correspondence: Steffen Puchtler, b2ZmaWNlQHBtZC50dS1kYXJtc3RhZHQuZGU=
 Steffen Puchtler
 Julius van der Kuip
 Florian Michael Becker-Dombrowsky
 Eckhard Kirchner

