 Marcin Gołaszewski
 Patryk Fiszer
 Bartosz Powałka
- Institute of Manufacturing Technology, Facility of Mechanical Engineering and Mechatronics, West Pomeranian University of Technology in Szczecin, Szczecin, Poland
A leading trend in modern industry is hybrid manufacturing methods. The intention is to integrate additive and subtractive methods into a single machine. In such a process, it is difficult to evaluate the quality of the manufactured component between successive processes. A solution that would make it possible to determine the quality of a component produced by incremental technologies on the basis of forces recorded in a machining process is not yet available. In the present study, an attempt was made to reconstruct the surface of the machined workpiece solely on the basis of recorded forces during the groove micromilling process. A workpiece with a known surface geometry in the form of a sinuous wave was machined. The geometry of the workpiece corresponded to a structure typical of the selective laser sintering method for metallic powders. A process conducted with two different axial cutting depths was considered. The reconstructed surface profiles were evaluated by comparative analysis with the real machined surface.
1 Introduction
Hybrid manufacturing is the combination of different manufacturing techniques. Numerous papers have been published presenting hybrid technologies that combine incremental and subtractive techniques. At the moment, such works dominate the hybrid technology development space, which is particularly evident in publications of Krimpenis and Noeas (2022), Greco et al. (2022) and Bambach et al. (2020). There are also appearing works that focus on other types of hybrid technologies. Different subtractive techniques are also being combined, including traditional cavity techniques and laser beam processing technologies as described this Sahu et al. (2022) as well as Lorenz et al. (2015).
The most common hybrid technologies are those combining machining and selective metallic powder sintering technology. The use of WAAM technology has been increasing in recent years. On the one hand, it is characterized by significantly higher productivity than SLM technology, but it does not provide such high dimensional and shape accuracy, as referred to by Altıparmak et al. (2021). In addition, there are studies reporting the combination of laser cladding technology with subtractive technologies. Such a solution makes it possible to improve the properties of only the surface of the product, without the need to manufacture a full part using the additive technology. Such manufacturing technologies have been described by González-Barrio et al. (2022) as well as Kerschbaumer and Georg (2004).
The materials used in hybrid technologies are mainly determined by the possibilities of additive manufacturing. It is necessary to use materials with properties that allow use, for example, in SLM technology. The largest material groups used in hybrid technologies are aluminum alloys and titanium alloys. This is dictated by the main use of these technologies in the aerospace industry. Hybrid technology combining SLM and subtractive machining allows the manufacture of lightweight, hollow components with high dimensional and shape accuracy. Many authors refer to this type of manufacturing in the context of lightweight but robust components of machine parts, for example, Buchanan and Gardner (2019), Gao et al. (2023) or Olakanmi et al. (2015).
However, in any hybrid process, one quality control problem arises. The first technology, whether incremental or subtractive, is the less accurate technology. Only the second process is most often used to achieve the required dimensional and form accuracy. The extent of manufacturing inaccuracies and possible defects in the fabrication of the semi-finished product will affect the second process, which by definition is a high-precision operation. These inaccuracies will therefore have a clear impact on the precision machining process itself and, consequently, on the accuracy of the finished product. This is why quality control of the semi-finished product by the first process is so important. The importance of quality control in hybrid manufacturing was also noted by the authors of the publication Sebbe et al. (2022) and Luo and Yi (2018).
The impact of inaccuracies and manufacturing defects is clearly visible in the micromilling process. Dimensional and shape inaccuracies in the 3D printing process from metallic powders reach values as heigh as the axial depth of cut in the micromilling process. Moreover, the SLM surface roughness themselves often reach the level of several hundred micrometers. Such high variability in the depth of the micro-cutting process leads to large differences in tool deflection. Furthermore, micro-cutting tools are particularly susceptible to any variations in cutting force due to their size and resulting low rigidity. In addition, defects described by Galy et al. (2018) such as unmelted grains or porosity further compromise the achievable accuracy in the micro-cutting process. This is a clear example showing that the evaluation of semi-product quality in hybrid micromachining is a necessary element.
With the development of hybrid technologies, the aim is to enclose the entire process within a single machine. Such measures dramatically shorten production processes allowing cost reductions. As already outlined between the two technologies, quality control is necessary in hybrid manufacturing. It is possible to add further measuring modules so that quality control can take place within a single machine. Removing a component between processes leads to a loss of machining bases and is a time-consuming process, which has been noted by Sommer et al. (2021). The aim should be to close the whole process at one machine.
Modelling of the machining process is a research domain that has been developed over the years. One branch of this research field is the modelling of machined surfaces. Zeroudi and Fontaine (2012) presented a model based on Z-map algorithms to model the surface after milling with a ball-end tool. The modelling of micromachining is most often implemented by adding a component responsible for the influence of the ploughing phenomenon to the classical force model. Rubeo and Schmitz (2016) presented a physical approach in their work, where this influence was introduced as a function of the thickness of the cut layer. Afazov et al. (2010), on the other hand, proposed a model that introduces the influence of ploughing based on mathematically adjusted relationships. Currently, geometric models focusing on the representation of the milled surface take into account elastic recovery. A model of this type was presented by Lu et al. (2018).
Using a correctly constructed model, it is possible to analyze the forces that lead to the reconstruction of the machined surface. Krüger and Denkena (2013) presented a paper in which they not only make a roughness prediction based on measured forces, but also evaluate tool runout A full surface reconstruction including process dynamics was presented by Denkena et al. (2012). The reconstructed surface was machined with a 10 mm diameter tool. However, surface profiles were reconstructed by Muñoz-Escalona and Maropoulos (2015) for a wide set of feed values, depth of cut and cutting edge geometry parameters. The research was conducted for a 32 mm diameter tool. The current work does not focus on the issue of surface reconstruction in terms of micro-cutting.
This paper presents the results of a preliminary study to evaluate the geometric structure of the surface based on the recorded forces in the groove micromilling process. The machined surface was in the form of a sinusoidal wave with a structure corresponding to the sintering process of metallic powders (SLM). A workpiece made of aluminum alloy 2017 was machined. The presented method can be used to evaluate the quality of parts manufactured by incremental methods during the micromachining process. In micromachining, changes in depth can result from inaccuracies in the manufacture of the component, dimension and shape errors, or technological defects resulting from incremental technologies. Furthermore, the method allows monitoring of the process itself by controlling the axial depth of cut.
The presented work is remarkable for its use of a micro-cutting model in the profile reconstruction method. A tool with a diameter of 0.5 mm was used. At the same time, the method presented makes it possible to use the classic cutting model by minimizing the influence of the ploughing phenomenon. A surface is machined that mimics the geometry characteristic of the additive manufacturing process. The machined surface dynamics and their amplitude are typical of the SLM method. The presented model can be adapted in hybrid manufacturing processes.
2 Materials and methods
2.1 Profile reconstruction
In both micro and macro machining, the values of the recorded cutting forces depend on the value of the machined layer area. The machined layer area is dictated by three parameters. The first factor is the cutting edge geometry. The feed per tooth is another parameter that determines the machined layer area. Both cutting edge geometry and feed per tooth are constant throughout the machining process. The third geometric factor that has an impact on the recorded forces is the axial depth of cut. The variation of the axial depth of cut is dictated by the tool trajectory on the one hand, but the geometry of the work surface on the other. The tool trajectory is controlled by the machining program. The only geometrical factor determining the values of the recorded cutting forces in milling, which cannot be directly influenced, is therefore the geometry of the workpiece surface.
Currently published geometrical models of the milling process are used to predict cutting forces and the structure of the machined surface. They are based on the field area of the cutting layer. Therefore, with a validated model, a function can be created. This function assigns the machining layer field a value for the recorded cutting force. Unfortunately, this relationship cannot be constructed in such a simple way for micro machining. In micromachining, the minimum thickness of the machined layer plays a key role. In areas where the minimal layer thickness is not exceeded, no chips are formed (Figure 1). The force values coming from such an area are disproportionately high. It is therefore necessary to adopt a machining model that distinguishes between these two areas (Equation 1). The area in which decohesion of the workpiece material takes place is denoted As, while the area of ploughing is denoted An. The area An is defined by the value of the minimum thickness of the machined layer. The value of the An area is determined where condition of minimal uncut chip thickness is not met (Equation 2).
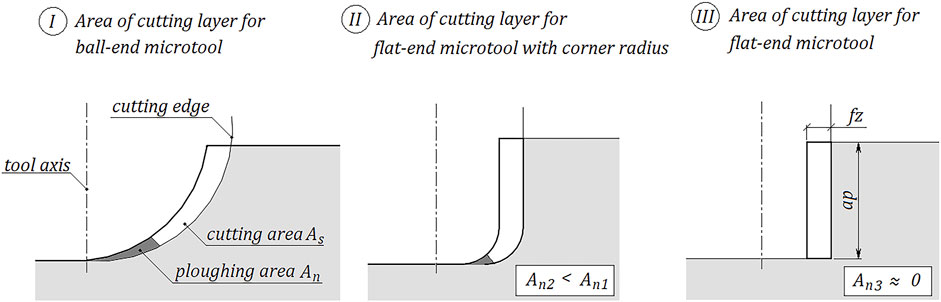
Figure 1. Recognition of the cross-section of the cutting layer for different tool types.
In the literature, additional cutting speed-based relationships are used to model the micromachining process. It is not necessary to include the cutting speed in the formula in this case, because a specific condition is considered with a fixed cutting speed, feed per tooth and nominal axial depth of cut. For such fixed parameters, it is easy to determine the values of the material constants and thus the force values as a function of the machined layer area.
The angular position of the cutting edge at which the thickness of the cutting layer is highest corresponds to the axis of the machined groove. The thickness in this position is equal to the feed per tooth. When tool tip radius equals zero, the cross-section of the machined layer takes the shape of a rectangle with height ap and width fz. When relation (Equation 3) is met, it should be assumed that the chip is formed along the whole length of the cutting edge line (An ≈ 0), and therefore the dominant field of plastic deformation is reduced to zero. In this case, the problem can be simplified to the classical Formula 4.
It has already been established that, during stabilized machining with a constant nominal depth of cut and constant machining parameters, the value of the recorded force from a geometrical point of view depends solely on the geometrical structure of the machined surface. A distinction must therefore be made between the value of the nominal depth of cut apn and the actual depth of cut apr (Figure 2). The tool trajectory is based on the nominal value. The value of the actual depth of cut, on the other hand, determines the height of the cross-section of the machined layer at the considered moment. Formula 4 can therefore be written in the form (5). Transforming this Formula 5 yields the relation (6). This function assigns the value of the recorded force to the value of the actual depth of cut at a given moment.
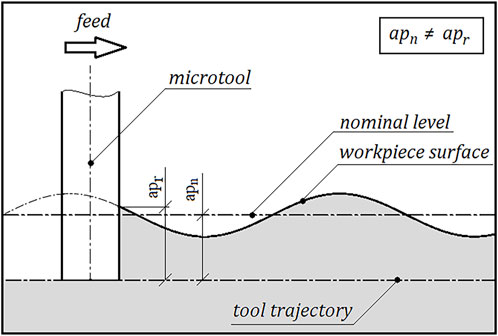
Figure 2. Nominal and real depth of cut.
In order to use the formula given by Formula 6, it is first necessary to determine the value of the cutting force at the angular position of the tool, where the thickness of the cut layer is highest. Given that the cutting forces assume the greatest values for the largest value of the machining layer thickness, this problem can be reduced to determining the signal envelope. The values of the recorded forces are then determined from the signal envelope. The signal envelope is based on the resultant force waveform. The resultant force is determined from the forces recorded in the axes during the machining process (Equation 7).
The envelope of the signal is determined using the Hilbert transform. The Hilbert transform consists of a π/2 phase shift of the signal and, consequently, an exchange of the real part of the signal with the imaginary part. First, the Fourier transform Y(ω) of the force signal (Equation 8) is determined. A notation is adopted in which the force signal in time is denoted as y (Equation 9). Next, the vector h(i) (Equation 10) is constructed, where the length of the vector y has been denoted as n. The elementary product of Y(ω) and h(i) is then determined (Equation 11) and the inverse Fourier transform is performed (Equation 12). The envelope E is finally determined by calculating the signal modulus HS (Equation 13).
The values of the force at time t are determined from the envelope thus constructed. Subsequently, the values of the envelope of the resultant forces at the ends of sections of length Δt are determined. Δt is the time segment in which one of the cutting edges is in the position corresponding to the axis of the milled groove (Equation 14). The number of cutting edges is denoted by z, while the tool rotation period is denoted by T. The solution based on the envelope of the recorded signal makes it possible to eliminate the error resulting from the mismatch between the angular position of the cutting edge and the corresponding moment t of the actual force waveform. However, this method only allows the surface profile to be determined in the direction of the feed in the groove axis.
By knowing the value of the resultant force at time t, the value of the actual depth of cut can be determined using Formula 6. On the basis of the determined depths apr(t), the profile of the machined surface in the location of the axis of the milled groove can be constructed (Figure 3). The determined depths are located in the tool feed axis X with a distance corresponding to the feed per tooth (Equation 15).
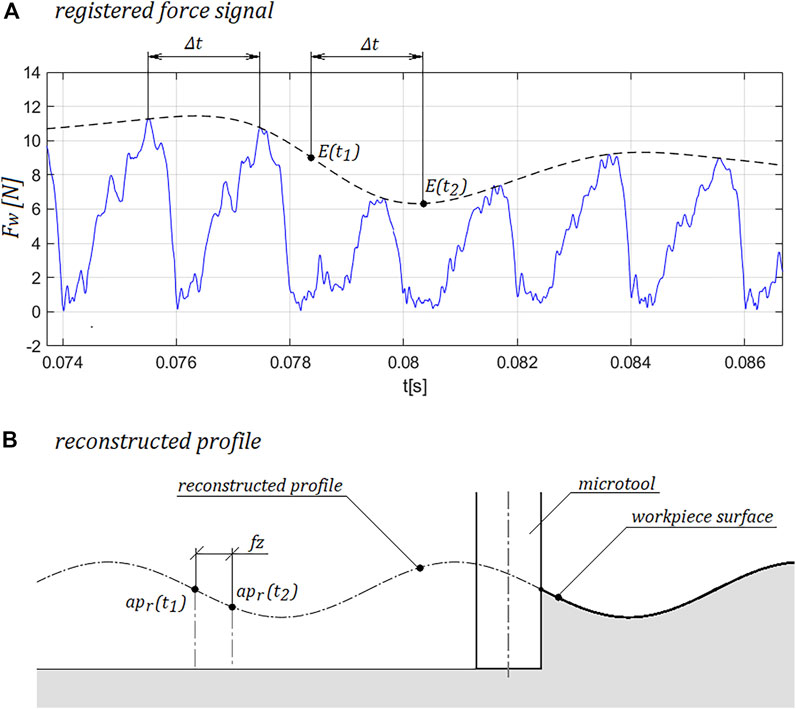
Figure 3. Method of reconstructing the profile (A) Recorded signal (B) Reconstructed profile.
2.2 sinusoidal surface
In order to validate the method described in the previous paragraph, a surface with a known geometry must be produced. It was decided to produce a surface with a sinusoidal wave geometry. Such a surface mimics the surface typical of the selective sintering of metallic powders process (SLM). The sinusoidal wave mimics the surface structure created by the laser spot versing in the additive method. Such a surface is characterized by variation in one direction, which corresponds to the profile reconstruction method. The profile forming the surface was expressed by Equation 16, where the wave amplitude was taken to be Asin = 20 μm and the wave period Ts = 640 μm. The sinusoidal wave was milled in a workpiece made of aluminum alloy Al 2017.
The sinusoidal surface was produced using a 1 mm diameter ball tool. The tool used was JMB542010G1B.0Z2-SIRA. The surface was machined with parameters values listed in the Table 1. The assumed value of Ts is the smallest value of the period of a sine wave with an Asin amplitude that can be produced with a 1 mm diameter tool. The sine wave was produced in a field of 6.08 mm × 3.00 mm, which allowed to reach a 9.5 period of the sine wave.

Table 1. Set of machining parameters for sinusoidal surface machining.
The resulting surface was scanned using a Mitutoyo Quick Vision interferometer with a resolution in XY plane of 0.2 μm and in optical axis of 0.002 μm. An unpolluted area of 1.25 mm × 0.35 mm dimensions was extracted from the larger scanned region. The scan consisted of 14 stitched fields of 246 μm × 246 μm with an overlap level of 20%. The surface scan was compared with a reference sinusoidal surface. The maximum deviation of the actual surface from the reference surface was 6.14 μm. The mean square deviation of the surface thus produced took on a value of 1.59 μm (Figure 4). Taking into account the small deviation values, in the following work the machined surface is treated as a sinusoidal surface.
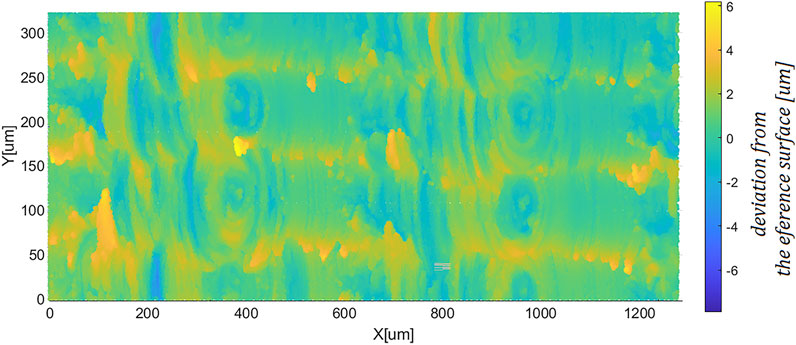
Figure 4. Deviation of the machined sinusoidal surface from the reference surface.
3 Experiment
For the controlled reconstruction of the surface profile, the groove was machined with a nominal depth of cut apn = 100 μm. A Kyocera 2FESM005-010-04 micro milling cutter with radius R = 250 μm was used. The tip of the tool was not rounded. The set of parameters for the machining of the microgroove is shown in the Table 2. The forces were measured using a Kistler MiniDyn Type 9256C connected in system with a Kistler 5070 amplifier at a frequency of 204.8 kHz. The proportionality factor of the force value to the axial depth of cut was determined from the forces recorded when cutting a groove with a constant depth of cut of ap = 100 μm. The determined value of the material constant was ks = 0.0115N/μm 2.

Table 2. Set of machining parameters for microgroove machining.
4 Result
The Figure 5 shows the recorded forces in the X-axis (feed axis), Y-axis and the resultant force in the XY plane. The envelope of the signal is plotted on the resultant force waveform, and the location of the minimum and maximum force values is marked. The marked locations correspond to the peak and valley of the milled waveform. The maximum and minimum values of the determined envelope of the recorded resultant force are summarized in the Table 3.
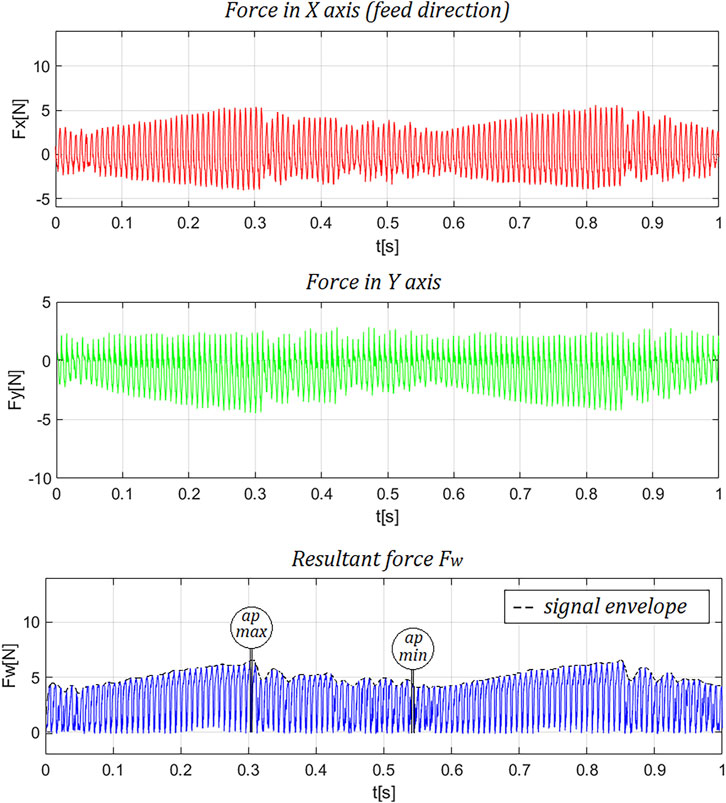
Figure 5. Recorded components of cutting force in the X and Y axis and resultant cutting force.
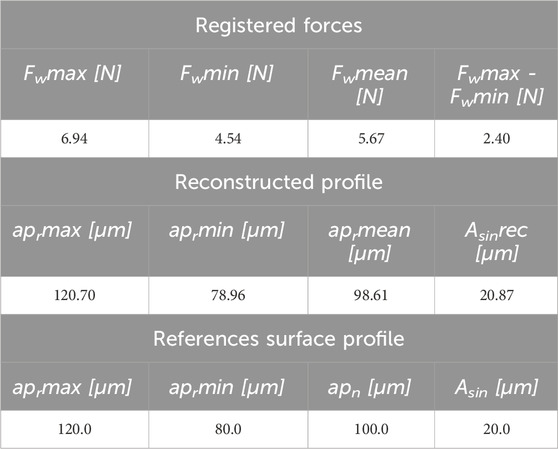
Table 3. Characteristic values of the recorded forces with values of the real depth of cut.
On the basis of the recorded signal of the resultant cutting force in the XY plane, the profile of the machined surface was reconstructed as described in paragraph 2. The values of the actual depth of cut corresponding to the determined minimum and maximum force values were collected in the Table 3. The value of the amplitude of the reconstructed sinusoidal profile was determined from Formula 17. The reconstructed profile is shown in Figure 6.
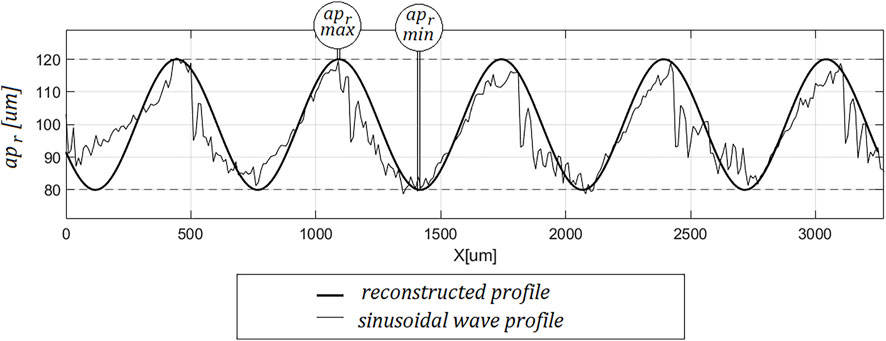
Figure 6. Reconstructed profile with reference surface profile.
The determined values of aprmax and aprmin correspond to the actual depth of cut resulting from the nominal depth of cut and the amplitude of the sine wave (Equation 18, 19). The average value of the actual depth of cut, determined from the resultant force, is equal to the nominal depth of cut. The value of the amplitude of the reconstructed profile is also similar to that of the reference surface. In addition, the coefficient of determination R2 of the reconstructed profile with that of the reference surface was determined (Equation 20).
5 Conclusion
Analysing the set of determined values of the actual depth of cut at the characteristic points and the value of the coefficient of determination R2, it should be concluded that the reconstructed profile corresponds with the profile of the surface of the workpiece preparation. This concordance concerns not only the shape of the profile, but also the height parameters of the profile. The method described can therefore be used to evaluate the quality of the machined surface based solely on the forces recorded during the process.
At the same time, it should be noted that the presented method is based on a basic force model, so it is not possible to apply the described method to machining with tools of other geometries. In addition, the method can only be used in its current form for surface reconstruction for microgroove machining. The presented method is not yet suitable for determining the roughness parameters of a reconstructed surface, as numerous factors are not taken into account in this form, such as the dynamics of the cutting process or static deflection.
This paper presents a method for reconstructing the profile of a machined surface from recorded forces during micromilling of grooves. The presented method shows huge potential in the monitoring of the micromilling process. Systems based on the presented method may have applications in quality control of hybrid processes at the subtractive machining stage. The presented method can be adapted to other hybrid technologies including WAAM technology and macro-scale machining. In the following work, the model results will be complemented by a quantitative analysis of the method, as this approach is particularly important for the practical application of the presented concept. Future work should be also carried out in the direction of surface reconstruction of the workpiece material to detect material defects and dimensional and shape inaccuracies.
Data availability statement
The raw data supporting the conclusions of this article will be made available by the authors, without undue reservation.
Author contributions
MG: Conceptualization, Data curation, Formal Analysis, Funding acquisition, Investigation, Methodology, Project administration, Resources, Software, Supervision, Validation, Visualization, Writing–original draft, Writing–review and editing. PF: Methodology, Formal Analysis, Software, Writing–review and editing. BP: Conceptualization, Data curation, Formal Analysis, Funding acquisition, Investigation, Methodology, Project administration, Resources, Software, Supervision, Validation, Visualization, Writing–original draft, Writing–review and editing.
Funding
The author(s) declare that no financial support was received for the research, authorship, and/or publication of this article.
Conflict of interest
The authors declare that the research was conducted in the absence of any commercial or financial relationships that could be construed as a potential conflict of interest.
Publisher’s note
All claims expressed in this article are solely those of the authors and do not necessarily represent those of their affiliated organizations, or those of the publisher, the editors and the reviewers. Any product that may be evaluated in this article, or claim that may be made by its manufacturer, is not guaranteed or endorsed by the publisher.
References
Afazov, S. M., Ratchev, S. M., and Segal, J. (2010). Modelling and simulation of micro-milling cutting forces. J. Mater. Process. Technol. 210 (15), 2154–2162. doi:10.1016/j.jmatprotec.2010.07.033
Altıparmak, S. C., Yardley, V. A., Shi, Z., and Lin, J. (2021). Challenges in additive manufacturing of high-strength aluminium alloys and current developments in hybrid additive manufacturing. Int. J. Lightweight Mater. Manuf. 4 (2), 246–261. doi:10.1016/j.ijlmm.2020.12.004
Bambach, M., Sizova, I., Sydow, B., Hemes, S., and Meiners, F. (2020). Hybrid manufacturing of components from Ti-6Al-4V by metal forming and wire-arc additive manufacturing. J. Mater. Process. Technol. 282 (August), 116689. doi:10.1016/j.jmatprotec.2020.116689
Buchanan, C., and Gardner, L. (2019). Metal 3D printing in construction: a review of methods, research, applications, opportunities and challenges. Eng. Struct. 180 (February), 332–348. doi:10.1016/j.engstruct.2018.11.045
Denkena, B., Krüger, M., Bachrathy, D., and Stepan, G. (2012). Model based reconstruction of milled surface topography from measured cutting forces. Int. J. Mach. Tools Manuf. 54–55 (March), 25–33. doi:10.1016/j.ijmachtools.2011.12.007
Galy, C., Le Guen, E., Lacoste, E., and Arvieu, C. (2018). Main defects observed in aluminum alloy parts produced by SLM: from causes to consequences. Addit. Manuf. 22 (August), 165–175. doi:10.1016/j.addma.2018.05.005
Gao, B., Zhao, H., Peng, L., and Sun, Z. (2023). A review of research progress in selective laser melting (SLM). Micromachines 14 (1), 57. doi:10.3390/mi14010057
González-Barrio, H., Calleja-Ochoa, A., Norberto López de Lacalle, L., and Lamikiz, A. (2022). Hybrid manufacturing of complex components: full methodology including laser metal deposition (LMD) module development, cladding geometry estimation and case study validation. Mech. Syst. Signal Process. 179 (November), 109337. doi:10.1016/j.ymssp.2022.109337
Greco, S., Schmidt, M., Klauer, K., Kirsch, B., and Aurich, J. C. (2022). Hybrid manufacturing: influence of material properties during micro milling of different additively manufactured AISI 316L. Prod. Eng. 16 (6), 797–809. doi:10.1007/s11740-022-01139-6
Kerschbaumer, M., and Ernst, G. (2004). ICALEO 2004: 23rd International Congress on Laser Materials Processing and Laser Microfabrication. San Francisco, CA, United States: AIP Publishing. https://pubs.aip.org/liacp/icaleo/proceedings-abstract/ICALEO2004/2004/1710/1001025
Krimpenis, A. A., and Noeas, G. D. (2022). Application of hybrid manufacturing processes in microfabrication. J. Manuf. Process. 80 (August), 328–346. doi:10.1016/j.jmapro.2022.06.009
Krüger, M., and Denkena, B. (2013). Model-based identification of tool runout in end milling and estimation of surface roughness from measured cutting forces. Int. J. Adv. Manuf. Technol. 65 (5), 1067–1080. doi:10.1007/s00170-012-4240-y
Lorenz, K. A., Jones, J. B., Wimpenny, D. I., and Jackson, M. R. (2015). A review of hybrid manufacturing. Available at: https://hdl.handle.net/2152/89311.
Lu, X., Hu, X., Jia, Z., Liu, M., Gao, S., Qu, C., et al. (2018). Model for the prediction of 3D surface topography and surface roughness in micro-milling inconel 718. Int. J. Adv. Manuf. Technol. 94 (5), 2043–2056. doi:10.1007/s00170-017-1001-y
Muñoz-Escalona, P., and Maropoulos, P. G. (2015). A geometrical model for surface roughness prediction when face milling Al 7075-t7351 with square insert tools. J. Manuf. Syst. 36 (July), 216–223. doi:10.1016/j.jmsy.2014.06.011
Olakanmi, E. O., Cochrane, R. F., and Dalgarno, K. W. (2015). A review on selective laser sintering/melting (SLS/SLM) of aluminium alloy powders: processing, microstructure, and properties. Prog. Mater. Sci. 74 (October), 401–477. doi:10.1016/j.pmatsci.2015.03.002
Rubeo, M. A., and Schmitz, T. L. (2016). Milling force modeling: a comparison of two approaches. Procedia Manuf. 5, 90–105. doi:10.1016/j.promfg.2016.08.010
Sahu, A. K., Malhotra, J., and Jha, S. (2022). Laser-based hybrid micromachining processes: a review. Opt. & Laser Technol. 146 (February), 107554. doi:10.1016/j.optlastec.2021.107554
Sebbe, N. P. V., Fernandes, F., Sousa, V. F. C., and Francisco, J. G. S. (2022). Hybrid manufacturing processes used in the production of complex parts: a comprehensive review. Metals 12 (11), 1874. doi:10.3390/met12111874
Sommer, D., Götzendorfer, B., Esen, C., and Hellmann, R. (2021). Design rules for hybrid additive manufacturing combining selective laser melting and micromilling. Materials 14 (19), 5753. doi:10.3390/ma14195753
Keywords: micromilling, groove micromilling, microgroove, hybrid manufacturing, profile reconstruction, micromilling forces
Citation: Gołaszewski M, Fiszer P and Powałka B (2024) Method for profile reconstruction of the workpiece surface during groove micromilling. Front. Mech. Eng. 10:1456050. doi: 10.3389/fmech.2024.1456050
Received: 27 June 2024; Accepted: 12 August 2024;
Published: 26 August 2024.
Edited by:
Andreas Archenti, Royal Institute of Technology, SwedenReviewed by:
Robert Tomkowski, Royal Institute of Technology, SwedenWitold Habrat, Rzeszów University of Technology, Poland
Copyright © 2024 Gołaszewski, Fiszer and Powałka. This is an open-access article distributed under the terms of the Creative Commons Attribution License (CC BY). The use, distribution or reproduction in other forums is permitted, provided the original author(s) and the copyright owner(s) are credited and that the original publication in this journal is cited, in accordance with accepted academic practice. No use, distribution or reproduction is permitted which does not comply with these terms.
*Correspondence: Marcin Gołaszewski, bWFyY2luLmdvbGFzemV3c2tpQHp1dC5lZHUucGw=