 I. Renreng1
 F. Djamaluddin
- 1Department of Mechanical Engineering, Faculty of Engineering, Hasanuddin University, Gowa, Indonesia
- 2Department of Mechanical, Aerospace and Civil Engineering, The University of Manchester, Manchester, United Kingdom
To increase the energy-absorbing capability of frontal collision management systems and improve vehicle crash safety, foam-filled crash boxes should be optimized. On the basis of a double tubular construction, a novel foam-filled crash box with a different design is developed. The energy absorption capacity, initial peak force, and deformation modes of the original and improved crash boxes were examined using impact models. As opposed to the full-filling design, it is demonstrated that the filling design may utilize less foam while increasing specific energy absorption. The stability of continuing deformation after the first buckling is determined by the foam-filled crash box. For the foam-filled crash box, a better-optimized design technique is suggested using the Taguchi method and principal component analysis (PCA). Compression tests are used to validate the design concept. Therefore, the optimal design technique of the crash box is suitable and practical for the crashworthiness design of crash boxes, considering the combined effect of significant indicators for electric vehicles.
1 Introduction
Due to the increase in vehicle use, energy scarcity and environmental pollution are now serious issues that must be resolved. Pure electric vehicles (PEVs) have become one of the top priorities in the global vehicle industry as new energy vehicles. Sadly, the low-distance coverage has always been a significant barrier to PEV growth. Energy consumption may be decreased and the limited mileage of PEVs can be improved with a lightweight design. However, one challenging technical issue in lightweight design is ensuring the vehicle’s structural crashworthiness. Numerous academics have conducted in-depth studies in order to achieve a lightweight design without compromising the safety performance of vehicles, which is beneficial to the growth of the automotive industry and is well-suited to the present development trend (Zhang et al., 2007; Zhu et al., 2013; Baroutaji et al., 2017; Fang et al., 2017; Sun et al., 2017).
Since thin-walled tubes can significantly absorb impact energy by plastic deformation (DiPaolo and Tom, 2006) and retain a relatively constant load through progressive folding (Renreng et al., 2020) under axial compression, they are frequently utilized as energy-absorbing components in crash boxes (Figure 1). The optimization of the material characteristics (Hsu and Jones, 2004), cross-section configuration [such as square, circular (Abramowicz and Jones, 1986), or polygonal (Mamalis et al., 1991; Abbasi et al., 2015)], and wall thickness (Lu et al., 2018) of thin-walled columns has been the subject of several research studies. Thin-walled tubes have also undergone various improvement techniques, such as foam-filling (Onsalung et al., 2014), multi-cell structures (Zhang and Zhang, 2014; Djamaluddin, 2023), or nesting (Wang et al., 2018), to improve their crashworthiness. Aluminum foam has been widely used as a filler in thin-walled constructions for crashworthiness and protection purposes (Baroutaji et al., 2017). It is a cellular material with outstanding compressive energy-absorption capabilities and is lightweight (Zhang et al., 2021), improving the targeted energy absorption (Djamaluddin and Mat, 2021). However, the aluminum foam-filling system is too expensive, so manufacturers avoid using it. In order to reduce material costs, a partial filling-based design technique is required (Djamaluddin, 2019).
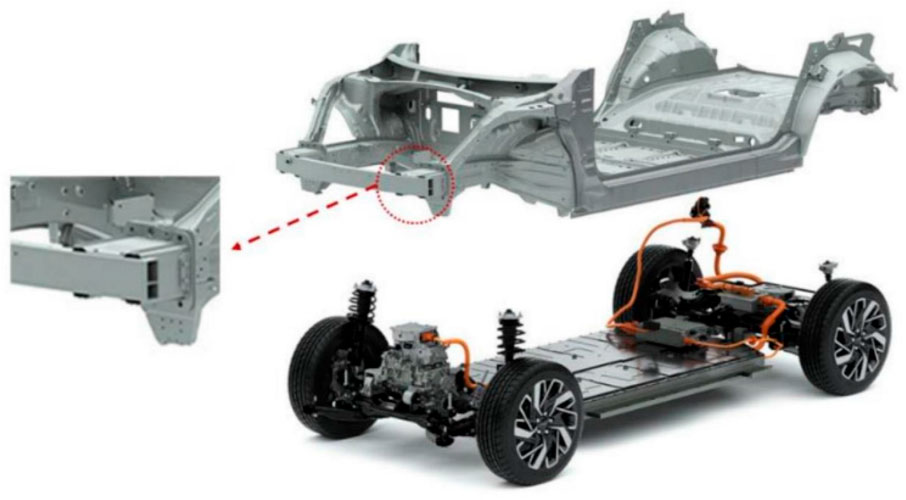
Figure 1. Schematic of the frontal crash management system in an electric vehicle.
The remainder of this paper is structured as follows: the specifics of the finite element simulations and experimental validation research are presented in Section 2. The problem description for the optimization of the crash box filled with foam under axial and oblique impact loading choices is given in Section 3. The mathematical overview of Taguchi models and principal component analysis (PCA) as the optimization technique used in this study are discussed in Section 4. Section 5 presents the optimization findings, and Section 6 offers some final suggestions.
2 Materials and methods
The wide tubes used in this investigation were constructed from aluminum alloy 5754. The tensile testing of coupons produced the material attributes used in this investigation. The test was conducted on samples using an Instron 5800R test apparatus. The samples were examined under quasi-static conditions at a 2 mm/min speed (Figure 2). The stress–strain results (Figure 2) from the static test on the tested specimen’s stress–strain curve are shown in Table 1.
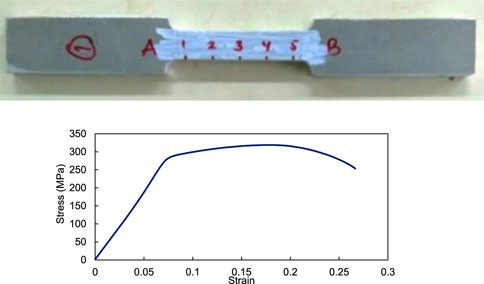
Figure 2. Specimen test and tensile test results (stress–strain curve) of A 6061 T6.

Table 1. Mechanical properties of A6061 T6.
Based on the results of the pressure test, Figure 3 provides the specifications of the aluminum foam material used (Table 1). As shown in the Table 2, the mass density of the aluminum foam was measured at a value of 197.8 kg/m3 for Young’s modulus and 50 MPa for Poisson’s ratio values, respectively.
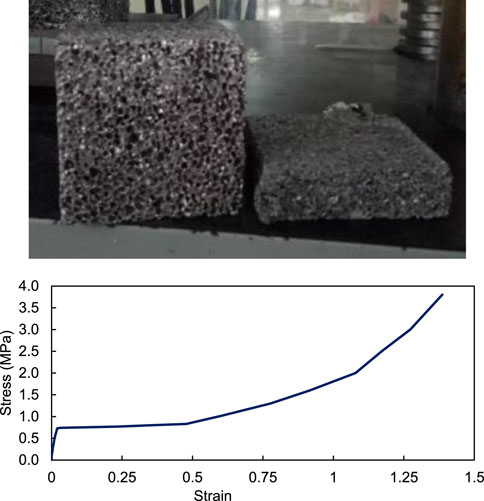
Figure 3. Specimen test and compress test results (stress–strain curve) of aluminum foam.

Table 2. Mechanical properties of aluminum foam.
The design used in this study is derived from a model of a real car. As shown in Figure 1, crash boxes are located in the frontal system, which is at the front end of the vehicle chassis. A front bumper containing a thin wall, two front rails with a thin wall, and two crash boxes make up the frontal system. The two sides of the front bumper’s bow-shaped crash boxes are welded together. Each crash box’s rear end is attached to the front of the front rail using a rear-end plate. The front rail is fastened to the plate, which is welded to the crash box. The primary factors in the crash box design are protective capacity, weight, and material cost. The main protection purpose of the crash boxes is to decrease the body’s invasion of the region behind the crash boxes and the deformation of the rear components after a frontal accident. The ability to carry weight and the order of the components in the frontal system determine the protective capability of the crash boxes. The weight shall be transferred sequentially via the primary load-carrying transmission from the front bumper, crash boxes, and front rails to the front floor beam during a frontal impact. As it directly impacts the load situation and deformation mode of each structural component, this is a significant reference for determining the design variables and reactions (Ahmad and Thambiratnam, 2009). The commercial crash box employed in this investigation is a thin-walled tube construction made by Hyundai for an electric car. According to Figure 4, the crash box’s cross-section is wide and rectangular, measuring 168 mm × 120 mm. The crash box’s inside is filled with aluminum foam to increase its ability to carry loads.

Figure 4. Crash boxes cross-section.
This study examines six different crash box foam-filling designs, as shown in Figure 5. The full-filled single and different designs of foam filling structure of the crash box are performed.. Foam filler is placed between the inner and outer tubes. Foam blocks have a spacing of 168 mm on the long side and 120 mm on the short. Despite having different cross sections, these six specimens have the same volume and mass, namely, 667.53 g and 958.22 cm3. The amount of foam in a crash box is an important aspect that needs careful consideration because the material’s expensive cost has limited appeal. In comparison, the single filling may lower the quantity of foam in the crash box, as shown in Figure 6.
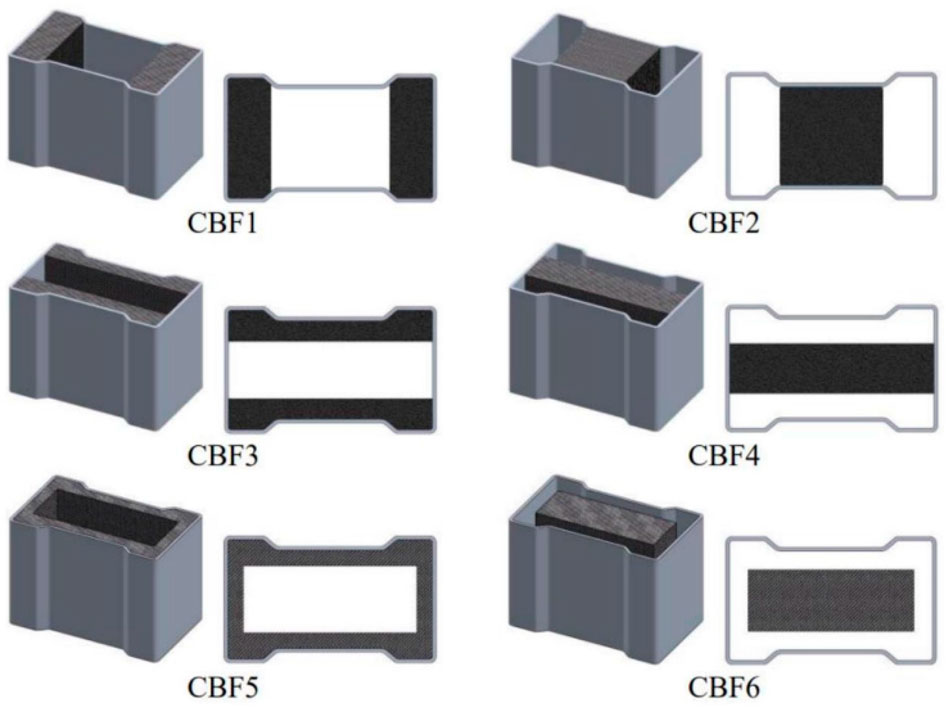
Figure 5. Six different types of foam-filled crash boxes cross-section.
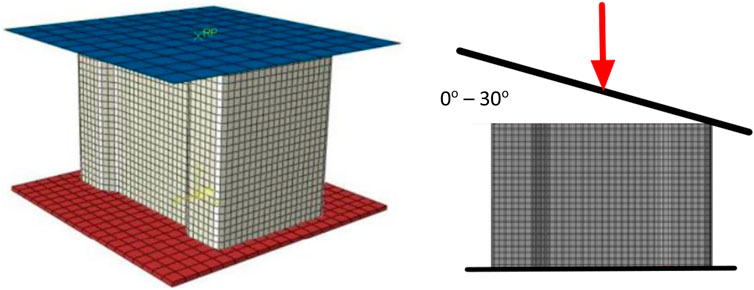
Figure 6. Compression test using finite element models.
The study’s suggested model is wide tubes under oblique impact. The specimens were simulated using a nonlinear finite element. The tubes were modeled as a quad element with increased hourglass and explicit S4R shell elements with four nodes on each side. A 5-mm element size was selected. General contact surfaces with a coefficient of friction of 0.2 were used to simulate the interaction between all elements of the structure (Tarlochan et al., 2013). The rigid bodies of both the rigid plates were modeled. As illustrated in Figure 4, the top plate (striker) was allowed to move in the transitional displacement in the direction of the impact loading, while the bottom plate was limited and fixed to move in all directions. The National Traffic Safety Administration (NHTSA) selected the striker’s speed from the New vehicle Assessment Program (NCAP), which was modeled at 56 km/h. The striker’s mass was 275 kg or 25% of the small vehicle. It was expected that the double tube specimens, which would be employed as an energy absorber, would absorb 50% of the impact energy (Andrews et al., 2001).
2.1 Optimization design for crashworthiness
The Taguchi optimization method is one of the experimental design methods to determine the optimal variation in a system. This method was developed based on orthogonal array (OA) data, where the number of factors and the level of a dataset are determined first. The data from this method are in the form of the signal-to-noise ratio (SN ratio), which is the ratio of the average output parameter (signal) to the standard deviation of the output (noise). A high SN ratio value indicates that the system is optimal because it has small noise. In other words, the SN ratio is an objective optimization function that can provide information on the optimum yield of a system (Hanssen et al., 2000).
The characteristics of the SN ratio generally consist of three criteria, namely, larger-the-better (LB), smaller-the-better (SB), and nominally-the-best (NB) (Equations 1–5).
2.1.1 Larger-the-better
Here, n represents the number of repetitions, and yi represents the observed data. This equation is applied for the desired data characteristics and compared to other output data.
2.1.2 Smaller-the-better
This equation is applied if the desired data characteristics are minimal compared to other output data or if smaller values are preferred.
2.1.3 Nominal-the-best
Here,
The Taguchi method optimization process can only be applied to systems that have only one type of output. For this reason, a multi-response optimization method is needed to convert multi-response problems (MRPs) into single-response data, called the multi-response performance index (MRPI). PCA is a method that can also solve multiple-response data problems. These compound data are converted into single data without reducing the information contained in the compound data. The PCA method views each compound response data as an equation of a line in an orthogonal coordinate system where the number of dimensions depends on the number of multiple-response data. Then, this method transforms the line components into a new coordinate system.
For data that have different characters, before the transformation is carried out, the normalization process must be carried out first. This normalization is divided into two types of character data:
a. Smaller-the-better (SB)
where
b. Larger-the-better (LB)
where
3 Result and discussion
3.1 Validation of the finite element model
Figure 7 shows the comparison of the experimental model with the simulated full foam-filled crash box. It can be seen from the figure that the dimensions of the simulated and experimental specimens are built identically so that the test results can be compared precisely.

Figure 7. Top view of the specimens: (A) simulation and (B) experiment. Isometric view of the specimens: (C) simulation and (D) experiment.
In the comparison, the shape of the specimen deformation is observed. The shape of the deformation can be used as an initial validation of the simulation. Figure 8 shows the comparison of the deformation of the specimens in the simulation and experiment. The shape of the deformation is compared at a distance of 30 mm, where, at this distance, resistance effects have not occurred in both the simulations and experiments.
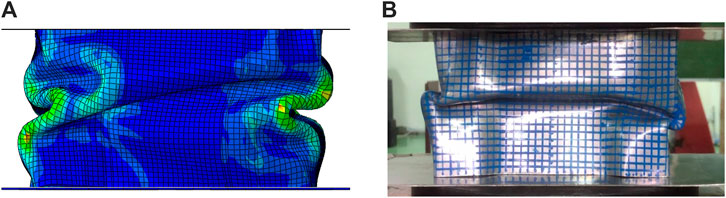
Figure 8. Comparison of the (A) simulation and (B) experimental deformations.
Figure 8 shows that the specimen folds that arise during the simulation and experimental processes are in the same location. Creases occur on the front surface and the side surface of the specimen. As for the von Mises stress contour, there is a maximum stress, whose value is still below the ultimate yield stress, which experimentally proves that the specimen is not damaged during the compression test.
Figure 9 shows the comparison of the full foam-filled crash box for simulation and experimental results. It presents a comparison of the force-to-displacement curves for the results of the quasi-static test experiments. It can be seen from the two results that each graph has a peak at the beginning of the emphasis and then decreases.
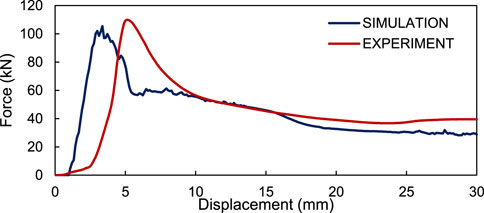
Figure 9. Comparison of force–displacement curves between the simulated and experimental data.
Table 3 provides the difference percentage (DP) of the parameter values based on the simulations and experiment results. DP can be obtained by calculating the ratio between the absolute difference between the simulation and experimental data. Thus, the simulation data can represent the experimental data. Therefore, the simulation data can be optimized to obtain the best cross-sectional design for absorbing energy under axial and oblique impacts.
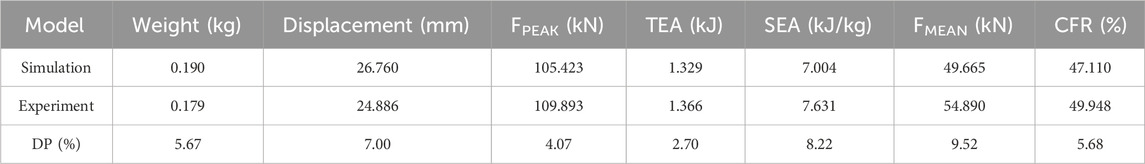
Table 3. Crashworthiness parameters from the simulation and experiment results.
3.2 Crashworthiness performances
3.2.1 Comparison between full foam-filled and empty crash boxes
The addition of aluminum foam as a filler for crash box components also increases the ability to absorb energy. As shown in Figure 10, CBHOL is a crash box without filler, while CBFF is a crash box fully filled with aluminum foam. As seen on the stress contour, the CBHOL surface has a wider maximum stress area than the CBFF surface. This indicates that the presence of foam on CBFF can reduce the maximum stress on the surface so that the CB is not easily damaged.
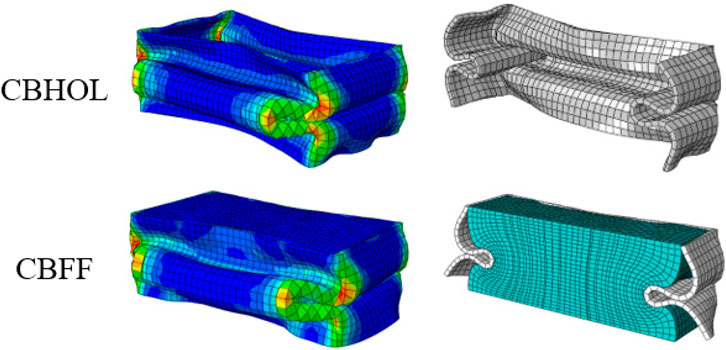
Figure 10. Comparison of deformations between CBHOL and CBFF.
Figure 11 shows that the force–displacement curve of the CBFF model is higher than that of the CBHOL model. The peak load of CBFF is 86.24 kN, while that of CBHOL is worth 77.72 kN. The peak load distance is also different, i.e., 4.20 mm for CBFF and 3.12 mm for CBHOL. The curve also shows that the reaction force remains stable at a displacement of 10 mm–50 mm. However, it starts to increase at a displacement of 51 mm for CBHOL and 55 mm for CBFF. This rising curve marks the end of the energy absorption phase, which is attributed to the resistance effect of the stationary base of the specimen. It appears that CBFF has a longer plateau and more energy absorption than CBHOL.
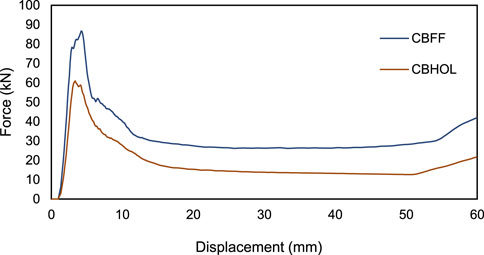
Figure 11. Comparison of force–displacement curves for empty and foam-filled crash boxes.
3.2.2 Comparison between six new designs of foam-filled crash boxes
Figure 12A shows that each specimen has a different deformation when subjected to loading. The shape of the deformation is one of the factors affecting energy absorption. Figure 11 shows the deformation of the specimen under axial loading (0°). Figure 11 shows that the maximum stress is observed at the bend at the CB angle. When the observed maximum stress exceeds the ultimate yield stress value, the part will fracture. However, if the maximum stress is still below the ultimate yield stress value, then the specimen will not fracture.
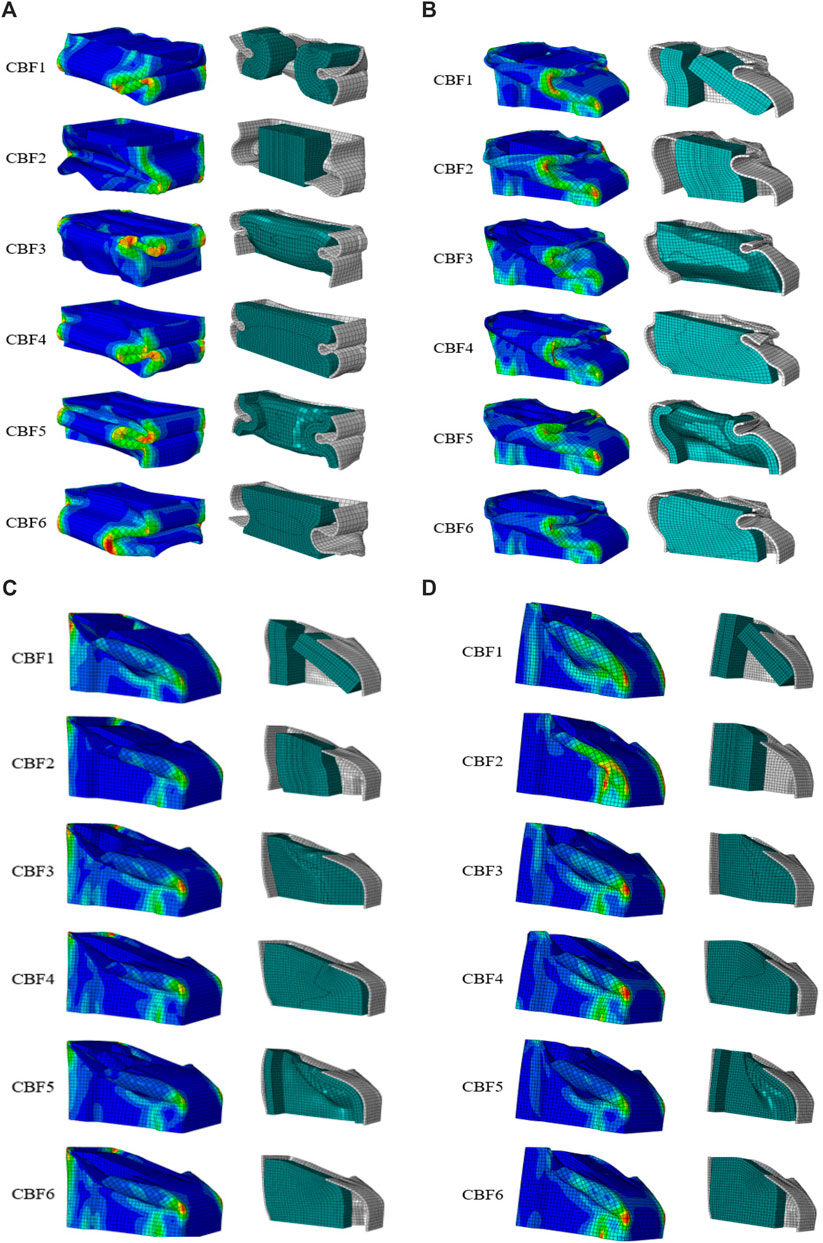
Figure 12. Deformation mode of six different foam-filled crash boxes under (A) 0°, (B) 10°, (C) 20°, and (D) 30°.
Figure 12B shows the deformation of the specimen at 10°, where the deformation of the aluminum wall does not appear to be much different in each specimen. However, when observed in cross-sectional sections, the deformation of aluminum foam appears to different from one another. This difference causes variations in the energy absorption ability of each specimen. Figures 12C, D show the deformation of the specimen at 20° and 30°, where the deformation modes of the aluminum wall do not appear to be differ between specimens. However, when observed in cross-sectional sections, the deformation of aluminum foam differs among specimens. This difference causes variations in the energy absorption capacity of each specimen.
Figure 13A shows that the force–displacement curves of all the specimens appear similar at the start of the quasi-static stress. However, at a distance of 36 mm, CBF2 and CBF6 specimens experienced a decrease in reaction force, which indicated that the energy absorption at that distance was reduced. However, the force curve for the CBF5 specimen appears to have increased earlier than that of the other specimens. This indicates that the absorption of energy that occurs in CBF5 has been completed, and the increase in the force curve is caused by the resistance effect of the base component of the specimen. Meanwhile, Figure 13B shows the force–displacement curve at an angle of 10o. As shown in the figure, the peak load height of each specimen has begun to vary. CBF3, CBF4, and CBF5 occupy the highest position, followed by CBF1, CBF6, and CBF2. It can be seen that after reaching the peak load, CBF1 experienced a drastic decrease in the force curve, which indicates a decrease in the absorption capacity of the specimen. The second peak was observed at a distance of 33 mm in all specimens. This peak occurs because the impactor has suppressed the entire cross-section of the specimen. After the second peak, there is a decrease in the force curve again, which indicates that energy absorption is occurring again. At this emphasis, CBF3 and CBF4 specimens generally have a higher curvature than the other specimens. Furthermore, Figure 13C shows a variation across all specimens on the 20o force–displacement curve. The first variation occurred in the peak load of each specimen, where CBF3 and CBF5 had the highest peak load, followed by CBF4, CBF1, CBF6, and CBF2. In the energy absorption process, the curve experiences insignificant increases and decreases. However, in general, the CBF4 specimen has a higher force curve than the other specimens. The increase in the force curve again occurs at a distance of 50 mm, which indicates that in some specimens, the absorption of energy has stopped.
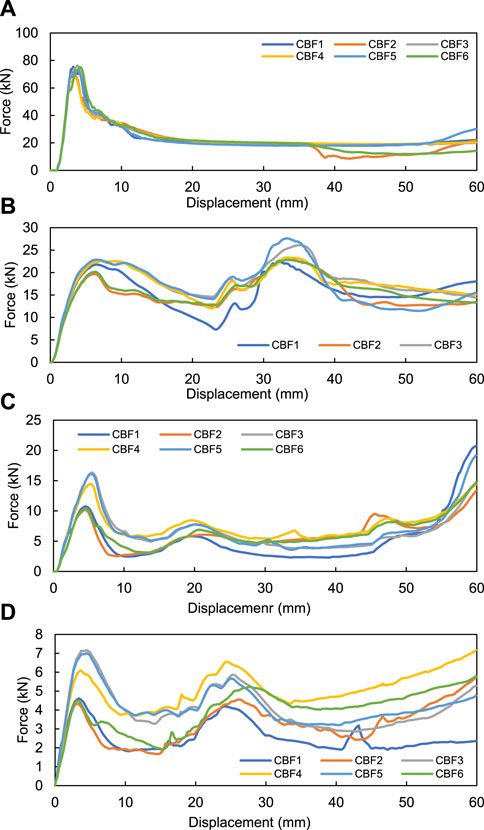
Figure 13. Comparison of force–displacement curves (A) 0°, (B) 10°, (C) 20°, and (D) 30°.
Finally, Figure 13D shows the force–displacement curve at 30° compression. Peak load variations occur at this suppression, where the highest peak load is for CBF3, followed by CBF5, CBF4, CBF1, CBF6, and CBF2. A second peak load was also observed at this suppression. The peak occurs due to the buckling process, where a temporary resistance effect is generated by the CB structure and then decreases as the structure deforms. In general, the CBF4 specimen has a high force–displacement curve in this loading test.
The results for each specimen model with each loading angle variation are shown in Figure 14. In general, the total energy absorption decreases as the pressure angle increases. This indicates that the ability to absorb the energy of the specimen decreases as the angle of loading increases.
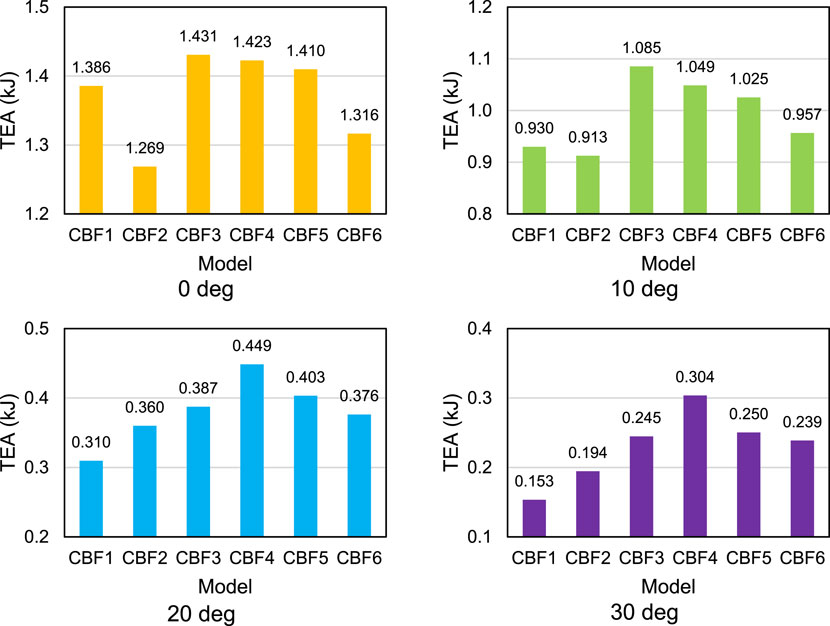
Figure 14. TEA comparison result at each loading angle.
The sequence of TEA specimens at angles of 20° and 30° did not change, where CBF4 had the highest TEA at the two angle variations, with values of 0.449 kJ at 20° and 0.304 kJ at 30°. It was followed by CBF5 (0.403 kJ and 0.250 kJ) and CBF3 (0.387 kJ and 0.245 kJ) specimens. The last three specimens were CBF6 (0.376 kJ and 0.239 kJ), CBF2 (0.360 kJ and 0.194 kJ), and CBF1 (0.310 kJ and 0.153 kJ). In this parameter, the higher the TEA value of the specimen, the higher the energy absorbed by the component. The specimen with the highest TEA at an angle of 0o is CBF2, at an angle of 10o is CBF3, at an angle of 20o is CBF4, and at an angle of 30o is CBF4.
Figure 15 shows the summary of the SEA values of each specimen with varying loading angles. In this parameter, the higher the SEA value, the better the ability to absorb impact energy. The SEA value is affected by the cross-sectional shape of the specimen, so the SEA value for each specimen is different. In general, the SEA of the specimen decreases when the loading angle increases. At an angle of 0°, CBF3 has the highest value (4,287 kJ/kg), followed by CBF4 (4,262 kJ/kg), CBF5 (4,224 kJ/kg), CBF1 (4,152 kJ/kg), and CBF6 (3,945 kJ/kg), while CBF2 has the lowest SEA in this variation with a value of 3,801 kJ/kg. For an angle of 10°, CBF3 has the highest SEA, i.e., 4,231 kJ/kg, followed by CBF4 with a value of 4,088 kJ/kg and CBF5 with a value of 3,997 kJ/kg. Meanwhile, CBF6, CBF1, and CBF2 specimens had a TEA value of 3,729 kJ/kg, 3,626 kJ/kg, and 3,558 kJ/kg, respectively. The SEA sequence of the specimens at angles of 20° and 30° did not change, where CBF4 had the highest SEA at the two angle variations, i.e., 2,423 kJ/kg at 20° and 2,010 kJ/kg at 30°. It was followed by CBF5 (2,178 kJ/kg and 1,636 kJ/kg) and CBF3 (2,093 kJ/kg and 1,607 kJ/kg). The last three specimens were CBF6 (2,033 kJ/kg and 1,625 kJ/kg), CBF2 (1,945 kJ/kg and 1,325 kJ/kg), and CBF1 (1,673 kJ/kg and 0,978 kJ/kg).
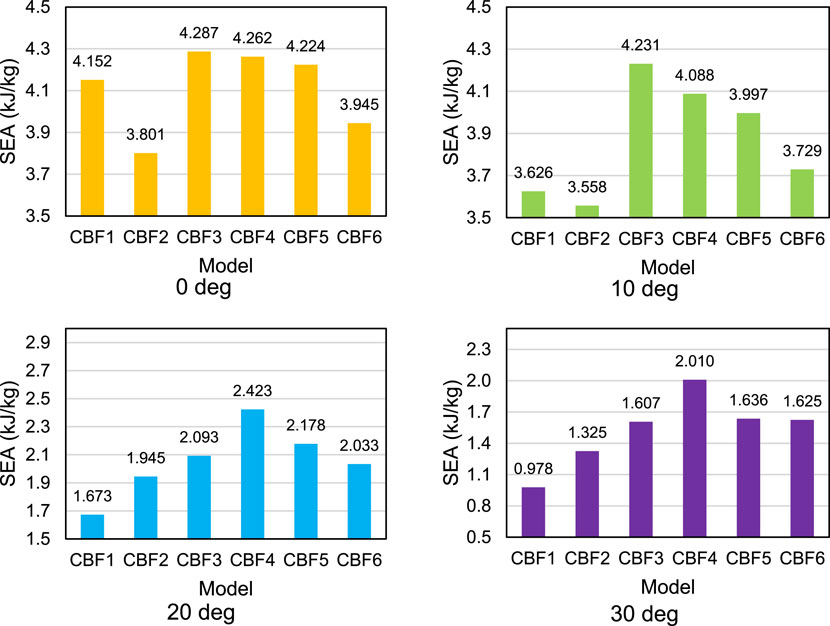
Figure 15. SEA comparison at each loading angle.
3.3 Optimization process
The optimization process is divided into two parts. The first optimization is carried out at axial loading or 0o angle, while the second optimization is carried out at oblique loading, i.e., at the loading angles of 10o, 20o, and 30o. At this stage, the optimal CB design at oblique loading with angles of 10o, 20o, and 30o will be obtained. The Taguchi method was applied to construct an OA oblique-loading design. MRPI for oblique suppression can be obtained. The MRPI slant loading data are then processed using the SN ratio method with larger-the-better characteristics. This SN ratio value indicates the optimal cross-sectional design for absorbing the suppression energy. Figure 16 shows the graph of the SN ratio for two types of variations, namely, the cross-sectional design and the loading angle. It is known that the SN ratio is directly proportional to the mean and inversely proportional to the standard deviation. The CBF4 specimen is designed to have a higher average crashworthiness parameter value than other specimens. This indicates that for each suppression angle, CBF4 still has a high crashworthiness parameter compared to other specimens. In addition to the average crashworthiness parameter, the CBF4 specimen also has a smaller standard deviation than the other specimens. With these results, the energy absorption ability of CBF4 remained high even though it was loaded at different angles.
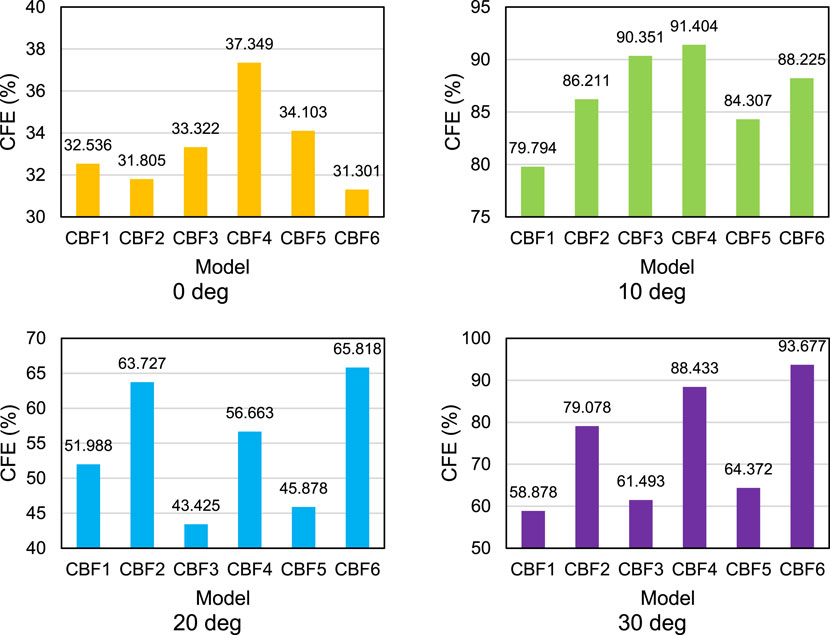
Figure 16. CFE comparison at each loading angle.
Based on the understanding of the SN ratio, the optimal design is the design that has the highest average and the lowest standard deviation. As shown in Figure 17, the highest SN ratio is of the CBF4 specimen, with a value of −6.995, followed by CBF6 with a value of −7.354, CBF5 with a value of −7.839, CBF4 with a value of −7.942, CBF2 with a value of −7.981, and, finally, CBF1 with a value of −9.256. In the cross-sectional variation, it appears that CBF4 has the highest SN ratio value, which indicates that this cross-sectional model has the best absorption capability for all angles of emphasis. There are two factors contributing to the high CBF4 SN ratio, namely, the high MRPI value for all crashworthiness parameters and the MRPI standard deviation, which is not that big compared to other cross-section models.

Figure 17. SN value of the oblique loading ratio in various models.
4 Conclusion
Based on the research that has been conducted in identifying the application of aluminum foam in the crash box structure of electric car frames, the following conclusions are obtained:
Based on the simulation results, it is known that even though the crash box specimens have the same mass and volume, the absorption of axillary and oblique loading energy on each specimen is different. This difference is caused by variations in the cross-section of aluminum foam as a crash box filler. Differences in energy absorption were also observed at variations in loading angles, where with the increase of the loading angle, the crashworthiness parameter of each specimen decreased. Based on a comparison of the results of the quasi-static simulation with the pressure test experiment, the percentage difference in the crashworthiness parameter data was obtained, which was still below 10%. TEA is 2.70%, SEA is 8.22%, and CFE is 5.68%. This indicates that the results of the simulation data obtained can represent the results of experimental tests.
The CBF4 specimen demonstrates the best capability under axial and oblique loading using Taguchi. Therefore, it can be recommended as a new crash box design for pure electric vehicles.
Data availability statement
The raw data supporting the conclusions of this article will be made available by the authors, without undue reservation.
Author contributions
IR: investigation and writing–original draft. FD: writing–original draft and writing–review and editing. MM: writing–original draft and writing–review and editing. QL: software and writing–review and editing.
Funding
The author(s) declare that no financial support was received for the research, authorship, and/or publication of this article.
Conflict of interest
The authors declare that the research was conducted in the absence of any commercial or financial relationships that could be construed as a potential conflict of interest.
Publisher’s note
All claims expressed in this article are solely those of the authors and do not necessarily represent those of their affiliated organizations, or those of the publisher, the editors, and the reviewers. Any product that may be evaluated in this article, or claim that may be made by its manufacturer, is not guaranteed or endorsed by the publisher.
References
Abbasi, M., Reddy, S., Ghafari-Nazari, A., and Fard, M. (2015). Multiobjective crashworthiness optimization of multi-cornered thin-walled sheet metal members. Thin-Walled Struct. 89, 31–41. doi:10.1016/j.tws.2014.12.009
Abramowicz, W., and Jones, N. (1986). Dynamic progressive buckling of circular and square tubes. Int. J. Impact Eng. 4, 243–270. doi:10.1016/0734-743x(86)90017-5
Ahmad, Z., and Thambiratnam, D. P. (2009). Dynamic computer simulation and energy absorption of foam-filled conical tubes under axial impact loading. Comput. Struct. 87 (3–4), 186–197. doi:10.1016/j.compstruc.2008.10.003
Andrews, E. W., Gioux, G., Onck, P., and Gibson, L. J. (2001). Size effects in ductile cellular solids. Part II: experimental results. Int. J. Mech. Sci. 43, 701–713. doi:10.1016/s0020-7403(00)00043-6
Baroutaji, A., Sajjia, M., and Olabi, A. G. (2017). On the crashworthiness performance of thinwalled energy absorbers: recent advances and future developments. Thin-Walled Struct. 118, 137–163. doi:10.1016/j.tws.2017.05.018
DiPaolo, B. P., and Tom, J. G. (2006). A study on an axial crush configuration response of thin wall, steel box components: the quasi-static experiments. Int. J. Solids Struct. 43, 7752–7775. doi:10.1016/j.ijsolstr.2006.03.028
Djamaluddin, F. (2019). Review deformation and optimisation crashworthiness method for foam filled structures. Lat. Am. J. Solids Struct. 213. doi:10.1590/1679-78255702
Djamaluddin, F. (2023). Crash behavior and optimization of double tubes with different cross section. Int. J. crashworthiness 28, 280–287. doi:10.1080/13588265.2022.2075098
Djamaluddin, F., and Mat, F. (2021). Optimization and crush characteristic of foam-filled fender subjected to transverse loads. Ocean. Eng. 242, 110085. doi:10.1016/j.oceaneng.2021.110085
Fang, J., Sun, G., Qiu, N., Kim, N. H., and Li, Q. (2017). On design optimization for structural crashworthiness and its state of the art. Struct. Multidiscip. Optim. 55 (3), 1091–1119. doi:10.1007/s00158-016-1579-y
Hanssen, A. G., Langseth, M., and Hopperstad, O. S. (2000). Static and dynamic crushing of square aluminium extrusions with aluminium foam filler. Int. J. Impact Eng. 24 (4), 347–383. doi:10.1016/s0734-743x(99)00169-4
Hsu, S. S., and Jones, N. (2004). Quasi-static and dynamic axial crushing of thin-walled circular stainless steel, mild steel and aluminium alloy tubes. Int. J. Crashworthiness 9, 195–217. doi:10.1533/ijcr.2004.0282
Lu, R., Gao, W., Hu, X., Liu, W., Li, Y., and Liu, X. (2018). Crushing analysis and crashworthiness optimization of tailor rolled tubes with variation of thickness and material properties. Int. J. Mech. Sci. 136, 67–84. doi:10.1016/j.ijmecsci.2017.12.020
Mamalis, A. G., Manolakos, D. E., Baldoukas, A. K., and Viegelahn, G. L. (1991). Energy dissipation and associated failure modes when axially loading polygonal thin-walled cylinders. Thin-Walled Struct. 12, 17–34. doi:10.1016/0263-8231(91)90024-d
Onsalung, N., Thinvongpituk, C., and Pianthong, K. (2014). Impact response of circular aluminum tube filled with polyurethane foam. Mater. Trans. 55, 207–215. doi:10.2320/matertrans.m2013293
Renreng, I., Djamaluddin, F., and Furqani, F. (2020). Energy absorption analysis of aluminum filled foam tube under axial load using finite element method with cross section variations. IOP Conf. Ser. Mater. Sci. Eng. 875, 012060. doi:10.1088/1757-899x/875/1/012060
Sun, G., Pang, T., Fang, J., Li, G., and Li, Q. (2017). Parameterization of criss-cross configurations for multiobjective crashworthiness optimization. Int. J. Mech. Sci. 124–125, 145–157. doi:10.1016/j.ijmecsci.2017.02.027
Tarlochan, F., Samer, F., Hamouda, A. M. S., Ramesh, S., and Khalid, K. (2013). Design of thin-wall structures for energy absorption applications: enhancement of crashworthiness due to axial and oblique impact forces. Thin-Walled Struct. 71, 7–17. doi:10.1016/j.tws.2013.04.003
Wang, J., Zhang, Y., He, N., and Wang, C. H. (2018). Crashworthiness behavior of koch fractal structures. Mater. Des. 144, 229–244. doi:10.1016/j.matdes.2018.02.035
Zhang, X., and Zhang, H. (2014). Axial crushing of circular multi-cell columns. Int. J. Impact Eng. 65, 110–125. doi:10.1016/j.ijimpeng.2013.12.002
Zhang, Y., Wang, G., Zhang, Y., Ye, J., Zeng, T., Zhao, K., et al. (2021). Crashworthiness design of car threshold based on aluminium foam sandwich structure. Int. J. Crashworthiness 27 (4), 1167–1178. doi:10.1080/13588265.2021.1914978
Zhang, Y., Zhu, P., and Chen, G. (2007). Lightweight design of automotive front side rail based on robust optimisation. Thin-Walled Struct. 45 (7–8), 670–676. doi:10.1016/j.tws.2007.05.007
Keywords: crash box, optimization, crashworthiness, impact, electric vehicle
Citation: Renreng I, Djamaluddin F, Mar’uf M and Li Q (2024) Optimization of crashworthiness design of foam-filled crash boxes under oblique loading for electric vehicles. Front. Mech. Eng. 10:1449476. doi: 10.3389/fmech.2024.1449476
Received: 15 June 2024; Accepted: 26 July 2024;
Published: 26 August 2024.
Edited by:
Evangelos G. Giakoumis, National Technical University of Athens, GreeceReviewed by:
Ping Liu, State Grid Jiangsu Electric Power Co., Ltd., ChinaChengxing Yang, Central South University, China
Copyright © 2024 Renreng, Djamaluddin, Mar’uf and Li. This is an open-access article distributed under the terms of the Creative Commons Attribution License (CC BY). The use, distribution or reproduction in other forums is permitted, provided the original author(s) and the copyright owner(s) are credited and that the original publication in this journal is cited, in accordance with accepted academic practice. No use, distribution or reproduction is permitted which does not comply with these terms.
*Correspondence: F. Djamaluddin, ZmF1emFubWFuXzc3QHlhaG9vLmNvbQ==