ORIGINAL RESEARCH article

Front. Mech. Eng., 22 August 2024
Sec. Turbomachinery

A model to assess the importance of runway and taxiway particles to aircraft engine compressor deterioration

Stefano Scarso
Stefano Scarso1*Stephan StaudacherStephan Staudacher1Jürgen MathesJürgen Mathes2Norman SchwarzNorman Schwarz3
  • 1Institute of Aircraft Propulsion Systems, University of Stuttgart, Stuttgart, Germany
  • 2MTU Aero Engines AG, Munich, Germany
  • 3MTU Maintenance Hannover GmbH, Langenhagen, Germany

During service, civil turbofans experience environmentally induced deterioration. Predicting this in a digital service twin model is computationally challenging due to the need to model both deterioration mechanisms and environmental conditions. For compressor erosion, a key challenge is to model particle ingestion throughout a flight mission (FM). During ground operations, these particles may be airborne or deposited on runways and taxiways. This work assesses the impact of the latter on turbofan core compressor deterioration during a mission. The airflow field in front of the engine intake is approximated using potential flow theory. Comparisons with measurements show that the predicted air velocity near the engine is underestimated since the inlet ground vortices generated from viscous effects are neglected. The forces acting on the particles are derived from the flow field. It turns out that most particles are lifted from the ground during take-off (TO). Yet only smaller particles below 50 µm are ingested into the engine intake. A deterioration model based on flat plate erosion experiments is used to compute mission severity, assuming all particles are similar to medium Arizona Road Dust. The results indicate that the engine’s distance from the ground, power setting, and the number of particles on the ground are key parameters influencing the impact of runway and taxiway particles. Considering the underestimation of the airflow field and thus the number of particles ingested, it is concluded that runway and taxiway particles play a major role in turbofan compressor deterioration.

1 Introduction

Engine maintenance constitutes a relevant part of the operating costs of airlines (International Air Transport Association). The work scope, cost, and timing of the engine maintenance actions depend, among others, on the type of engine, its distance from the ground, the way it is operated, and the environment in which it is operated. All these contribute to deterioration mechanisms such as erosion, fouling, corrosion, and abrasion, simultaneously interacting in a complex way (Saravanamuttoo, 1994; Kurz and Brun, 2000; Hamed et al., 2006). Together with a limited base of in-service data, this made the derivation of cause–effect relationships difficult for a long time. Consequently, a model-based prediction of engine maintenance type and intervals is still a challenge. Today, the increased amount of digitally available data, such as Automatic Dependent Surveillance—Broadcast (ADS-B) or Continuous Engine Operational Data (CEOD), provides additional details of individual aircraft operations. This stipulates the generation of so-called digital twins, which duplicate the real existing engine throughout its service life by a digitally created model representing its time-dependent characteristics (Klein et al., 2022). In doing so, the digital twins combine suitable analytical, numerical, and artificial intelligence models, providing useful information about the system state that is not accessible through data analysis. The requirement to predict the service life of whole fleets of engines in acceptable computational times makes computationally efficient modeling indispensable. The outcome of the digital twin used is a comparison of flight missions (FMs) in terms of their severity, i.e., the degree of hardware deterioration experienced by the engines during these missions.

The impact of the engine installation on the experienced severity is indicated in Richardson et al. (1979). In this study, it is reported that the elevated center engine of McDonnell Douglas DC-10 aircraft experiences a reduced rate of deterioration compared to the engines mounted under the wings. With the type of engine and its installation being fixed for a particular aircraft type, the severity of a flight mission will depend on its operational details and ambient conditions. Hence, the fixed installation aspects and the varying operational factors have to be discussed separately. This is demonstrated using solid particle erosion as an example for the deterioration mechanism, which has been widely investigated experimentally and numerically. Flat plate experiments provide an established source of empirical data for solid particle erosion. Dimensional analysis (Lorenz et al., 2022) shows that applying the erosion data derived from flat plate experiments to the computation of the material loss during a mission for a given combination of solid particles and engine part materials requires the following components:

1. A statistically relevant number of impacts on a flat plate surface element

2. A suitable relation of the surface setback to the particle size

3. A suitable relation of the surface elements to the particle size

4. A representative impact angle

5. A representative kinetic energy of the impacting particle.

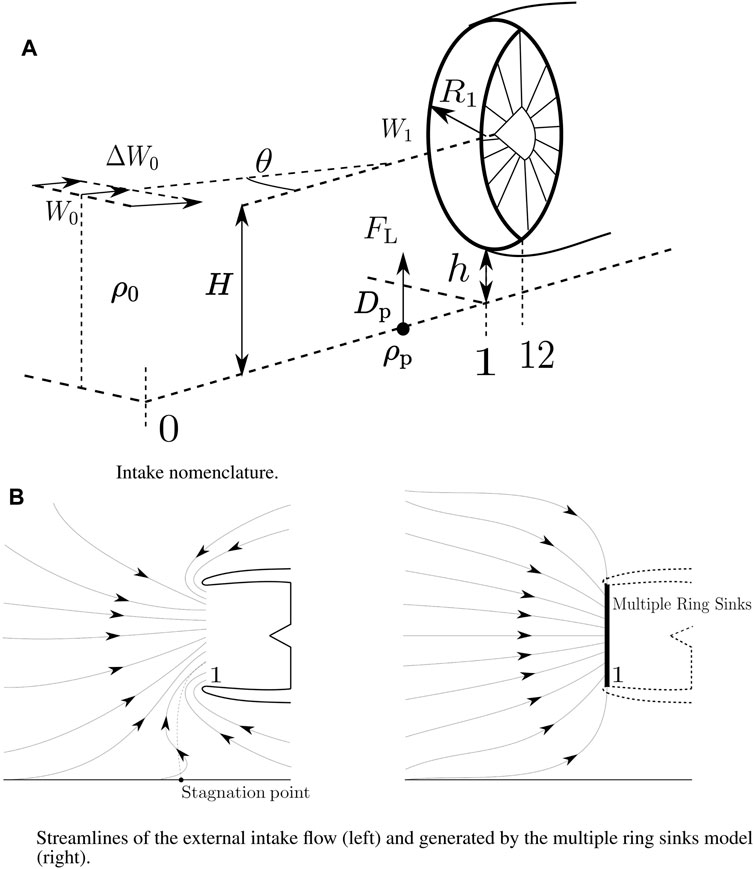
The numerical investigation of the erosion severity requires modeling three basic processes involved with solid particle erosion of turbofan engines. The first process embraces all aspects influencing the ingestion of particles by the engine. The second process is the transport of the particles in the working fluid within the engine. The third process is the impact of the particles on the gas path surfaces, including its consequences for the surface and the particles. The process of engine wear by solid particle erosion thus begins with the transport of particles from their original position in the engine’s environment into the engine’s inlet. During airborne flight segments, only particles suspended in the air can be ingested. However, during flight segments performed on the ground, both particles dissolved in the air and particles lying on airport pavements can be ingested by the engine. This leads to the question about the importance of runway and taxiway particle ingestion to aircraft engine compressor deterioration. Early experimental investigations show that the engine height above the ground, engine power setting, and atmospheric circulation are key to the formation of vortices extending from the inlet to the ground surface and that the surface structure plays a decisive role in the lifting of objects from the surface (Rodert and Garrett, 1955). The factors influencing the lifting force on an object lying on the surface have been investigated in Glenny and Pyestock (1970) based on the system shown in Figure 1A. Dimensional analysis of this system resulted in the approximate nondimensional expression shown in Equation 1.
FLρ0W12D12fW0W1,DpD1,ρpρ0,gD1W12,HD1,ΔW0D1W1.(1)

Figure 1
www.frontiersin.org

Figure 1. (A) Intake nomenclature. (B) Streamlines of the external intake flow (left) and generated by the multiple ring sink model (right).

Hence, it is postulated in Glenny and Pyestock (1970) that high-bypass ratio engines featuring large inlet diameters D1 with their installation resulting in a lower ground clearance h will be prone to lifting ground debris into the intake. The last nondimensional group in Equation 1 is the inverse of the Rossby number describing the ratio of inertial force to Coriolis force. For the engine operating point, the intake throat velocity W1 represents a characteristic velocity. The intake throat diameter D1 is the characteristic length. The ratio of the crosswind gradient ΔW0 and the strength of the crosswind W0 represents the Coriolis parameter. The experimental results in Glenny and Pyestock (1970) show that the smaller the Rossby number, the higher the risk of ingestion of particles. The experimentally based publications of Rodert and Garrett (1955); Glenny and Pyestock (1970) have been refined by distinct numerical studies. Nakayama and Jones (1996) used a high-order panel method to complement existing experimental data in order to discuss the boundaries for inlet vortex formation. It turned out that a simple correlation could be provided based on the first and fifth nondimensional groups in Equation 1. The first nondimensional group W0W1 describes the level of acceleration of the inlet mass flow caused at a given speed and power setting. The fifth nondimensional group HD1 describes the particular engine installation. RANS equations employed in MacManus and Slaby (2015) explore the parameter range associated with the nondimensional expression in Equation 1. It is shown that a particle lifted from the ground follows a ballistic trajectory, and if it gets into the inlet stream tube, it may be ingested. For a very low engine height h, objects of significant size, like a 10 kg aluminum particle, could be ingested. However, the high computational demands associated with any CFD study are not acceptable for methods to be applied in a digital twin, as introduced above (Klein et al., 2022). Hence, an effective way to replicate the complex fluid dynamic phenomena involved with the ingestion of ground particles by a taxiing engine has to be established.

2 Digital twin model

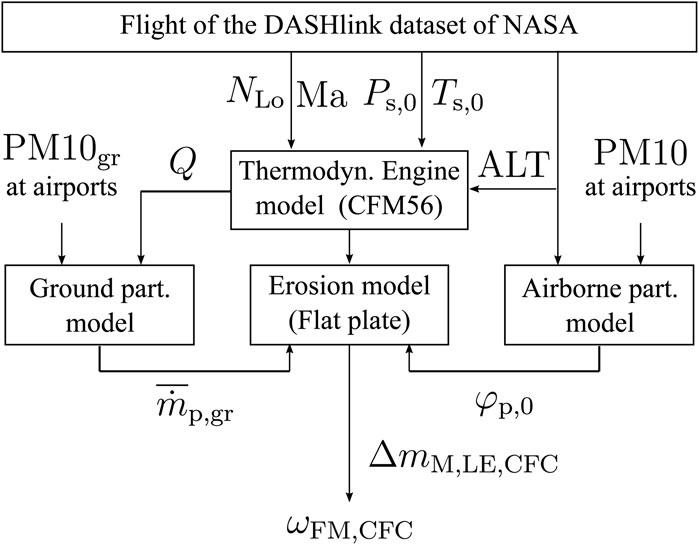
The applied fast computing engine digital twin model is documented in Brandes et al. (2021a); Scarso et al. (2022). Its general structure is shown in Figure 2. It is generated using state-of-the-art performance synthesis and compressor mean line methods. The performance synthesis model represents an engine similar to a CFM56 engine (Brandes et al., 2021b). Performance synthesis is run à priori to give a table of engine non-dimensional parameters. Similarly, the compressor mean line model is run à priori to derive a set of compressor non-dimensional inter-blade row data, including flow angles and velocities. For a given flight condition and power setting, the engine model provides all gas path parameters needed to compute the mission severity parameter of the core flow compressors. The power setting is commanded by an aircraft model at every point of the flight mission. The non-dimensional low-pressure shaft speed NLo is used as a power setting parameter. It is assumed that the aircraft carries out flight missions that are part of the DASHlink NASA dataset containing regional flight missions flown in the United States (NASA). Hence, flight Mach number (Ma), the ambient static pressure (Ps,0), the ambient static temperature (Ts,0), and the flight altitude (ALT) are taken from the DASHlink NASA dataset. This results in consistent and realistic dynamics of the flight missions with a decent representation of flight missions typical to the CFM56 type of engines (Scarso et al., 2022). Compressor leading-edge erosion is computed from erosion rate correlations gained from the Arizona Road Dust impingement test with flat plate specimens (Brandes et al., 2021b). This digital twin model computes details of blade deterioration due to solid particle erosion and provides a parameter called mission severity ωFM,CFC. This parameter is obtained by dividing the mass of metal eroded from the leading edge of the core flow compressor blades for one flight mission ΔmM,LE,FM,CFC by the mass of the complete set of new blades mM,B,CFC.

Figure 2
www.frontiersin.org

Figure 2. Scheme for the calculation of the severity parameter ωFM,CFC.

It is assumed that all solid particles ingested by the engine are like Arizona Road Dust (φp,0) in terms of particle geometry, chemistry, and size distribution. For a given volumetric airflow Q entering the engine at a given point of the flight missions, the concentration of airborne particles φp,0 defines the mass of airborne particles ingested by the engine ṁp,0. It is assumed that the concentration of airborne particles decreases exponentially with flight altitude (Hobbs, 1993). The particle concentration for take-off (TO) and climb is scaled using the particle concentration PM10 at the departure airport. The particle concentration for the descent, approach, and landing segments is scaled in an analog way using the PM10 level of the arrival airport. The particle concentration in the cruise is scaled using the average of the PM10 levels at the departure and arrival airports. The PM10 levels are taken from the United States Environmental Protection Agency (EPA). During close-to-ground operations such as taxi, take-off, and touch-down, the mass flow of airborne particles ṁp,0 is superimposed by particles ingested from the ground ṁp,gr. The concentration of the particles lying on the airport ground surfaces PM10gr is a key input to compute the amount of ingested ground particles. The according numerical model computes the ability of the intake volumetric flow Q to pick up these particles and transport them into the engine. The air velocity field around and in the engine intake defines this ability.

3 Air velocity field around and in the engine intake

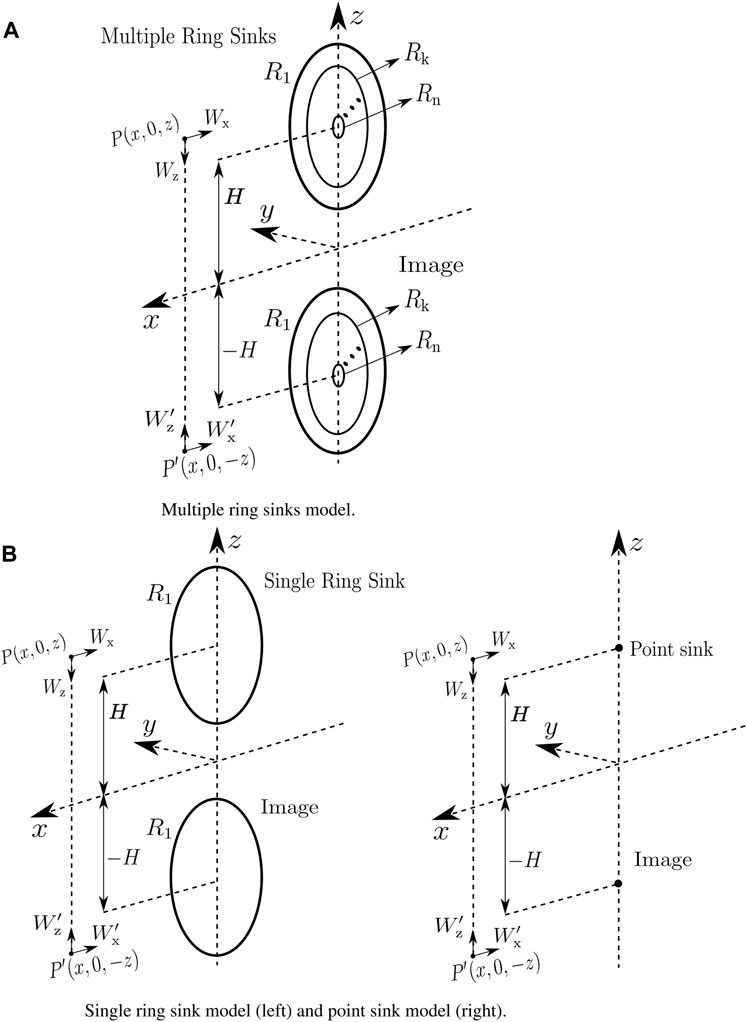
A typical streamline pattern of the external intake airflow is shown in Figure 1B. This is the result of the intake geometry, the position of the intake relative to the ground, the power setting of the engine, and a potential cross-wind. The streamline pattern is not symmetric because of the proximity to the ground and the intake/nacelle shape. It has a stagnation point on the ground with the corresponding stagnation streamline. The flow to the right-hand direction of the stagnation streamline is flowing opposite to the main intake flow direction and features high curvature at the intake lip. The flow to the left of the stagnation streamline follows the main intake flow direction and is characterized by a lower degree of curvature. The numerical computation of this flow field with high spatial resolution is not suitable in the context of digital twin modeling. Modeling the intake velocity field around the engine intake through a potential flow generated by n multiple ring sinks offers low computational effort with an appropriate spatial resolution (Hess and Smith, 1967; Hooi et al., 2015). The streamline pattern generated by such a model is shown in Figure 1B. Per definition, it is symmetric. The resulting flow pattern is free of vorticity and neither reflects the streamline curvature caused by the intake nor the backflow expected below the engine nacelle. Yet it promises adequate modeling of the flow patterns observed to the left of the stagnation streamline. As shown in Figures 1B, 3A, n multiple ring sinks are positioned at station 1, i.e., at the intake throat position. The outer radius equals the intake throat radius R1. The multiple ring sinks have an equal radial spacing RkRk1=R1/n. The radius of each kth ring sink is calculated using Equation 2. The ring indices k increase radially inward.

Rk=R1k1R1n.(2)

It is assumed that air density and axial velocity are evenly distributed at the intake throat. Hence, the volumetric air mass flow, Q, is derived using Equation 3.

Q=πR12W1.(3)

The multiple ring sinks absorb airflow from all directions. To model the flow through the intake contour, only the forward half of the absorption by the multiple ring sinks is included. With these assumptions, the volumetric mass flow satisfies Equation 4.

12k=1n2πRksk=πR12W1=Q.(4)

Since the inlet velocity W1 is considered evenly distributed at the intake, the strength of the multiple ring sinks sk assumes the constant value shown in Equation 5 across the intake throat area. This equation is derived from Equation 4.

sk=s1=2QπR1n+πR1.(5)

Figure 3
www.frontiersin.org

Figure 3. (A) Multiple ring sink model. (B) Single-ring sink model (left) and point sink model (right).

According to Hess and Smith (1967), this results in the velocity potential Φk that is contributed by the kth ring sink at the positions x and z in front of the intake throat plane. This allows computing the axial velocity Wx,k and a vertical velocity Wz,k induced by the kth ring sink as a function of the distances x and z between the point of observation and the ring sink. The ground plane is modeled using image multiple ring sinks to enforce no flow through the ground plane (Hooi et al., 2015), as shown in Figure 3A. The multiple ring sinks representative of the engine intake are centered at a height H above the ground, while the image multiple ring sinks are centered at a height H. The velocities of the flow field are calculated using the sum of each ring sink and its image sink contribution (Hooi et al., 2015), as shown in Equation 6, where Wx,k and Wz,k are the analog velocities induced from the image ring sink.

Wxx,z=k=1nWx,kx,z,H,Rk+k=1nWx,kx,z,H,RkWzx,z=k=1nWz,kx,z,H,Rk+k=1nWz,kx,z,H,Rk.(6)

The predicted and measured air velocities along the intake centerline Wi,c is reported in Figure 4A. All velocity values Wi,c are referred to as the air velocity at the intake throat W1. The velocity measurements reported by Secareanu et al. (2005) for a pipe positioned at a nondimensional height H/D1=1 above a ground plate are compared with three predictions. One prediction results from the model comprising multiple ring sinks centered at H and their image at H (see Figure 3A). The second prediction results from a model comprising a single ring sink centered at H and its image at H (see Figure 3B). The third prediction results from a point sink model comprising a point sink centered at H and its image at H, as shown in Figure 3B. It must be noted that the intake section is positioned at the nondimensional distance x/D1=0, where D1 is the intake diameter. By increasing x, the distance from the intake section increases. Figure 4A shows that the velocity Wi,c calculated with the multiple ring sink model demonstrates a good agreement with the experimental results of Secareanu et al. (2005) along the intake centerline. This could not be stated for the other two potential flow models, which are not capable of representing the flow velocities near the intake. A comparison of the ground velocities Wgr computed with the three considered potential flow models and the measurements of Colehour and Farquhar (1971) is shown in Figure 4B. This comparison is done for an intake positioned at a nondimensional height H/D1=1.25. The single-ring sink model compares well with the measurements of Colehour and Farquhar (1971) near the intake. At a distance x/D1=3, there is a good match from all the models. The observed model deviations close to the intake face are due to viscous effects, which may generate a ground vortex with vertical velocities not considered by a potential flow (Colehour and Farquhar, 1971), as shown in Figure 1B. Potentially, this may lead to an underestimation of the particle detachment. Among the three potential flow models presented, the multiple ring sink model is selected due to its better alignment with the measured velocities at the intake centerline. Indeed, the accuracy of these velocities is fundamental for calculating the trajectory of the ingested particles.
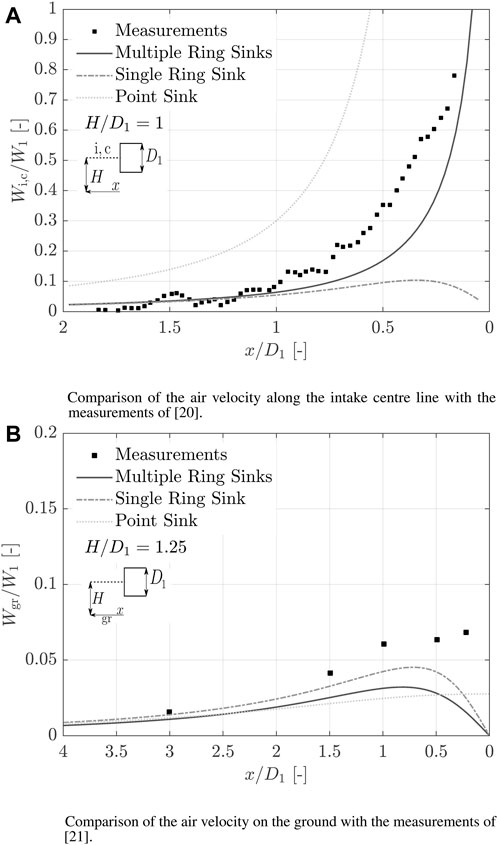
Figure 4
www.frontiersin.org

Figure 4. (A) Comparison of the air velocity along the intake center line with the measurements by Secareanu et al. (2005). (B) Comparison of the air velocity on the ground with the measurements of Colehour and Farquhar (1971).

4 Particle detachment model

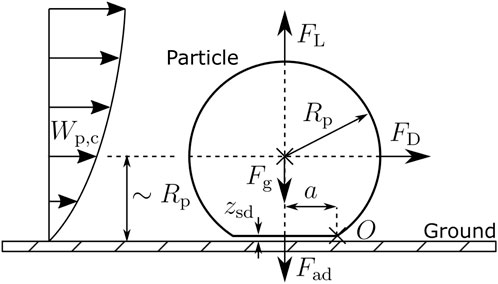
The particles lying on the ground are assumed to be Arizona Road Dust A3 in order to connect seamlessly to experimentally developed erosion models (Brandes et al., 2021b). The silica (SiO2) particles are assumed to be spherical and feature a contact surface a2π with the ground surface (Figure 5). The aerodynamic forces on an individual particle are induced by the intake flow field close to the surface, wc,p. The particles detach from the smooth surface primarily by rolling rather than lifting or sliding (Soltani and Ahmadi, 1994; Das et al., 1995). Hence, particle detachment occurs when the momentum around the point ‘O,’ generated by the lift force FL and drag force FD acting on the particle, exceeds the momentum generated by the adhesion force Fad and gravity force Fg. According to El-Batsh (2001), this results in the particle detachment criterion documented in Equation 7.

FDRP+FLaFga+Fada.(7)

The gravity force is given by Equation 8, with ρp being the particle density.

Fg=43πRp3ρpg.(8)

According to El-Batsh (2001), the drag force acting on a small spherical particle is given in Equation 9. As shown in Figure 5, the flow velocity wc,p is deduced from the flow field at the distance Rp from the ground surface.

FD=3πfwμDpCuwc,p.(9)

In Equation 9, μ represents the dynamic viscosity and Dp represents the diameter of the particles constituting the medium Arizona Road Dust. According to Soltani and Ahmadi (1994), the correction factor for the wall effect assumes a value of fw=1.7009. The Cunningham slip correction factor (CF) Cu reflects continuum effects at high Knudsen numbers Kn (Equation 10)

Cu=1+Kn1.2+0.41exp0.88Kn.(10)

The Knudsen number Kn and the free path length of the gas molecules λ are calculated using Equation 11.

Kn=2λDpλ=2μρ0π8R0T01/2.(11)

The lifting force FL is calculated using Equation 12 derived by Leighton and Acrivos (1985), assuming that the particle is immersed in a simple shear flow.

FL=0.576ρ0γ̇2Dp4.(12)

Assuming a linear velocity profile, the velocity gradient γ̇ assumes a value of γ̇=Wc,p/Rp (Rivera et al., 2013). The adhesion force, which represents the London van der Waals forces acting between the particle and the ground, is calculated using Equation 13.

Fad=34πEaDp.(13)

The surface energy per unit area, Ea, can be calculated according to Zoeteweij et al. (2009) using Equation 14.

Ea=A12πzsd2,(14)

where zsd is the separation distance and is assumed to be equal to 0.4 nm (Hinds and Zhu, 1998). The Hamaker constant A quantifies the force between two particles exposed to London van der Waals forces. Assuming an air Cushion (index ‘air’) forming between the silica particles (index ‘si’) and the asphalt ground surface (index ‘as’), the Hamaker constant A is calculated using Equation 15.

A=AasAairAsiAair.(15)

The considered values and references are reported in Table 1. The radius a of the contact area (see Figure 5) could be calculated using Equation 16 (Soltani and Ahmadi, 1994).

a=3πEaDp22Kc1/3,(16)

where the composite Young’s modulus of the asphalt surface and the silica particle is given by Equation 17

Kc=431νas2Eas+1νsi2Esi1.(17)

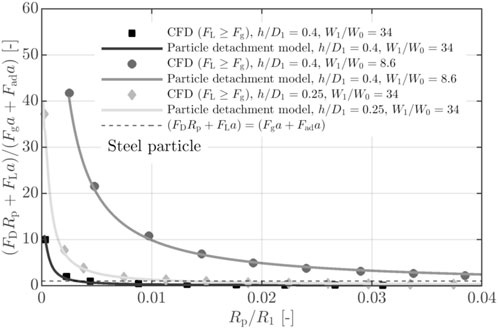
The Poisson’s ratio ν and the Young’s modulus E of each component are reported in Table 1. For large particles, the effects of the drag and adhesion forces are assumed to be negligible (MacManus and Slaby, 2015). In this case, the particle is considered detached from the ground when the lifting force FL exceeds the gravity force Fg. The results of the particle detachment model, which considers all forces and moments, are compared to the results from the CFD study (MacManus and Slaby, 2015), which considers only lift and drag forces in Figure 6. The engine is assumed to be stationary with a take-off thrust and a crosswind. For the comparison with MacManus and Slaby (2015), different crosswind speed ratios W1/W0 and nondimensional heights h/D1 are considered. The material properties and Hamaker constants applied are documented in Table 1. The good agreement shown in Figure 6 justifies the application of the multiple ring sink model in combination with the particle detachment model to understand the maximum size of the particles picked up by the intake flow from the ground surface.

Figure 5
www.frontiersin.org

Figure 5. Forces acting on the particle when lying on the ground.

Table 1
www.frontiersin.org

Table 1. Material properties.

Figure 6
www.frontiersin.org

Figure 6. Comparison of the particle detachment model with that of MacManus and Slaby (2015).

5 Particle trajectory

The trajectory of a particle picked up by the intake flow from the ground is crucial for determining whether this particle is ingested into the engine. It is assumed that the particle does not bounce after being detached from the ground and that the lifting force is constant and acting on the particle for a distance equal to its radius Rp (MacManus and Slaby, 2015). The energy conservation is used to determine the initial particle lifting velocity using Equation 18:

FLRp=Epot+Eki.(18)

From Equation 18, the amount of the initial lifting velocity perpendicular to the ground surface Vini,p is determined using Equation 19.

Vini,p=2FLRp2mpgRpmp.(19)

Once a particle is detached from the ground, its motion in a three-dimensional flow field is represented using the Boussinesq–Basset–Oseen equation. For particles of a density three or more orders of magnitude greater than the fluid density, the three-dimensional change in the velocity vector V is expressed using Equation 20 (MacManus and Slaby, 2015).

dVdt=18μρpDp2WV+g(20)

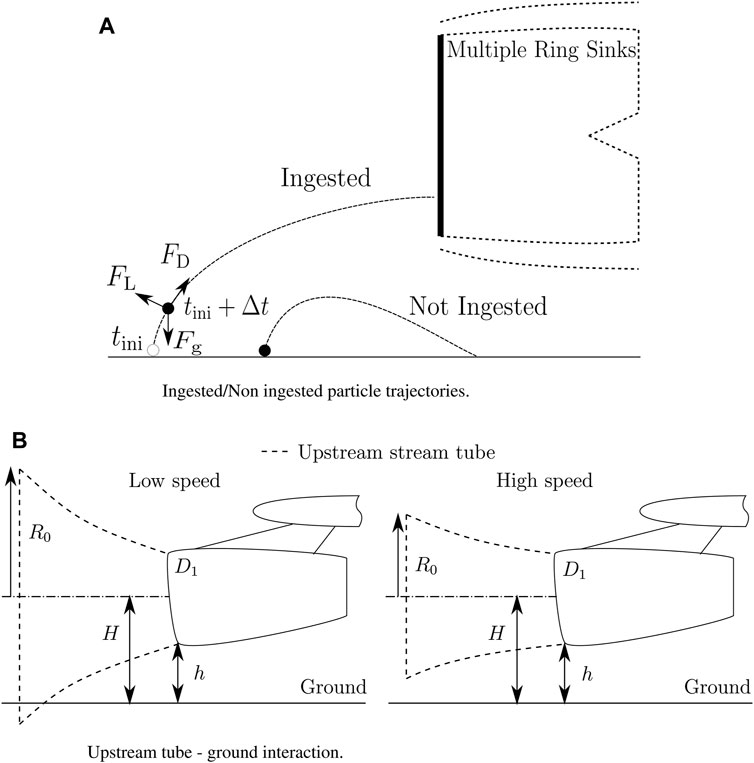
The ingestion fraction (ζ1,0) is defined as the ratio of the number of particles ingested by the turbofan to the total number of particles lifted from the ground. Particles are considered ingested if their trajectories lead to the turbofan intake, as shown in Figure 7A. In the resolution of the trajectory equation, the selection of the time step Δt=0.001 seconds yielded stable results. The ingestion fraction calculated with the multiple ring sink model is compared to the results from the CFD study presented in MacManus and Slaby (2015). An engine with a nondimensional height above the ground of h/D1 = 0.25 and a velocity ratio W1/W0=34 is assumed. In the CFD study by MacManus and Slaby (2015), the ingestion fraction of sand particles of dimension Rp/R1=0.005 is equal to 0.087. The ingestion fraction calculated with the multiple ring sink model and the particle trajectory model shown above is 0.032. Hence, the multiple ring sink model underestimates the particle ingestion fraction. This underestimation is attributed to the difference in the flow field between the multiple ring sink model and the CFD computation. As a consequence, the combination of the multiple ring sink model, particle detachment model, and particle trajectory computation is deemed to result in an underestimation of the number of particles ingested during engine ground operation.

Figure 7
www.frontiersin.org

Figure 7. (A) Ingested/non-ingested particle trajectories. (B) Upstream tube–ground interaction.

6 Amount of the runway and taxiway particles ingested

In static ground operation, the upstream stream tube of the intake flow is intersected by the ground surface, as shown in Figure 1B. With static ground operation marking the starting point tini, runway and taxiway particles are ingested as long as the upstream stream tube of the intake flow intersects the ground. The radius R0 far upstream of the intake throat is used as a criterion to mark the end of the ingestion of runway and taxiway particles. This radius decreases with increasing aircraft velocities, as shown in Figure 7B. The ingestion of runway and taxiway particles stops at the end tend when R0 becomes smaller than the height H of the engine axis. For a given volumetric flow of the engine intake Q1 and an aircraft speed of W0, the radius R0 is given by Equation 21.

R0=QπW0.(21)

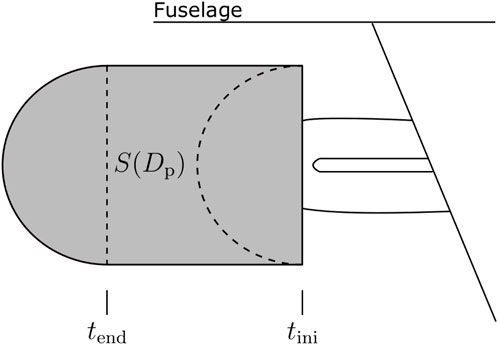
For each operating point, from the starting point tini to the end tend of the ingestion of the runway and taxiway particles, a steady-state engine performance model is run in combination with the multiple ring sink model and the models for particle detachment and their trajectories. At each point in time, this results in an area S(Dp) of particle ingestion, which itself is a function of the particle diameter Dp. Thus, the entire ground area affected by the engine intake flow depends on the route of the aircraft on the ground, as shown in Figure 8. Assuming a constant concentration C(DP) of medium Arizona Road Dust particles with diameter Dp along the entire route of the aircraft on the ground, time integration yields the intake particle mass flow according to Equation 22.

ṁ̄p,grDp=SDp×CDptendtini.(22)

Figure 8
www.frontiersin.org

Figure 8. Surface on the ground from where particles of a certain diameter are ingested.

7 Impact of the engine power setting on the maximum size of ingested particles

The maximum ingested particle size at take-off and idle power settings is investigated for a non-moving aircraft. The engine volume flow Q1 at the idle power setting is assumed to be 90 m3/s with a respective value of 370 m3/s for the take-off power setting. The nondimensional engine nacelle height h/D1 is set to 0.32. Two cases are discussed. In the first case, the multiple ring sink model is applied, as discussed above. In the second case, the full flow of the multiple ring sink model is modified using a correction factor CF=f(x/D1), which matches the multiple ring sink model to the ground velocity measurements shown in Figure 4B. The results with and without the correction factor are compared and shown in Figure 9A for take-off and in Figure 9B for idle. At take-off, for both cases, the particles of all diameters of the medium Arizona Road Dust (1.5 µmDp 118.5 µm) are detached from the ground. However, without the application of CF, only particles up to 43.5 µm in diameter are ingested into the intake, corresponding to 87% of the volume fraction of the medium Arizona Road Dust (see Figure 9A). This is explained by the fact that larger particles have higher inertia, which does not allow them to follow the airflow up to the engine intake. With the application of CF, particles up to 46.5 µm in diameter are ingested into the intake, corresponding to 89% of the volume fraction of the medium Arizona Road Dust (see Figure 9A). Hence, the ground velocity underestimation of the model has a small effect on the maximum ingested particle size at take-off. In this configuration, the ingestion fraction and the forces are evaluated and shown in Figures 9C, D, respectively. As shown in Figure 9C, when considering the CF, the ingestion fraction for very small particles (Dp= 1.5 µm) is 0.45. This indicates that 45% of the lifted particles of this size are ingested. For particles in the range 4.5 µm Dp 37.5 µm, the ingestion fraction stabilizes at approximately 0.4. Beyond this range, the ingestion fraction decreases, reaching 0 for particles larger than 46.5 µm. Despite the lifting force becoming dominant for particles larger than this size, as shown in Figure 9D, and continuing to increase for larger particles, resulting in higher initial ground velocities (see Equation 19), the particles are not ingested due to their greater inertia. When the CF is not considered, the ingestion fraction is lower. This is attributed to the lower initial velocities, which prevent the particles from reaching a sufficient height above the ground to be carried into the intake by the airflow. For particles beyond the size Dp= 43.5 µm, the ingestion fraction drops to 0. At idle, only particles larger than 15 µm are detached from the ground if no correction factor CF is applied. In this case, the momentum generated from the drag and lifting forces is not enough to detach the smaller particles from the ground. Yet all particles of the medium Arizona Road Dust are detached from the ground when the correction factor CF is applied. At idle, no runway and taxiway particles are ingested both in the cases of with and without the correction factor. This is due to the fact that the lifting force acting on the particles is small and so are the initial velocities (see Equation 19). Hence, the particles cannot reach a sufficient height above the ground to be carried by the flow entering the intake.
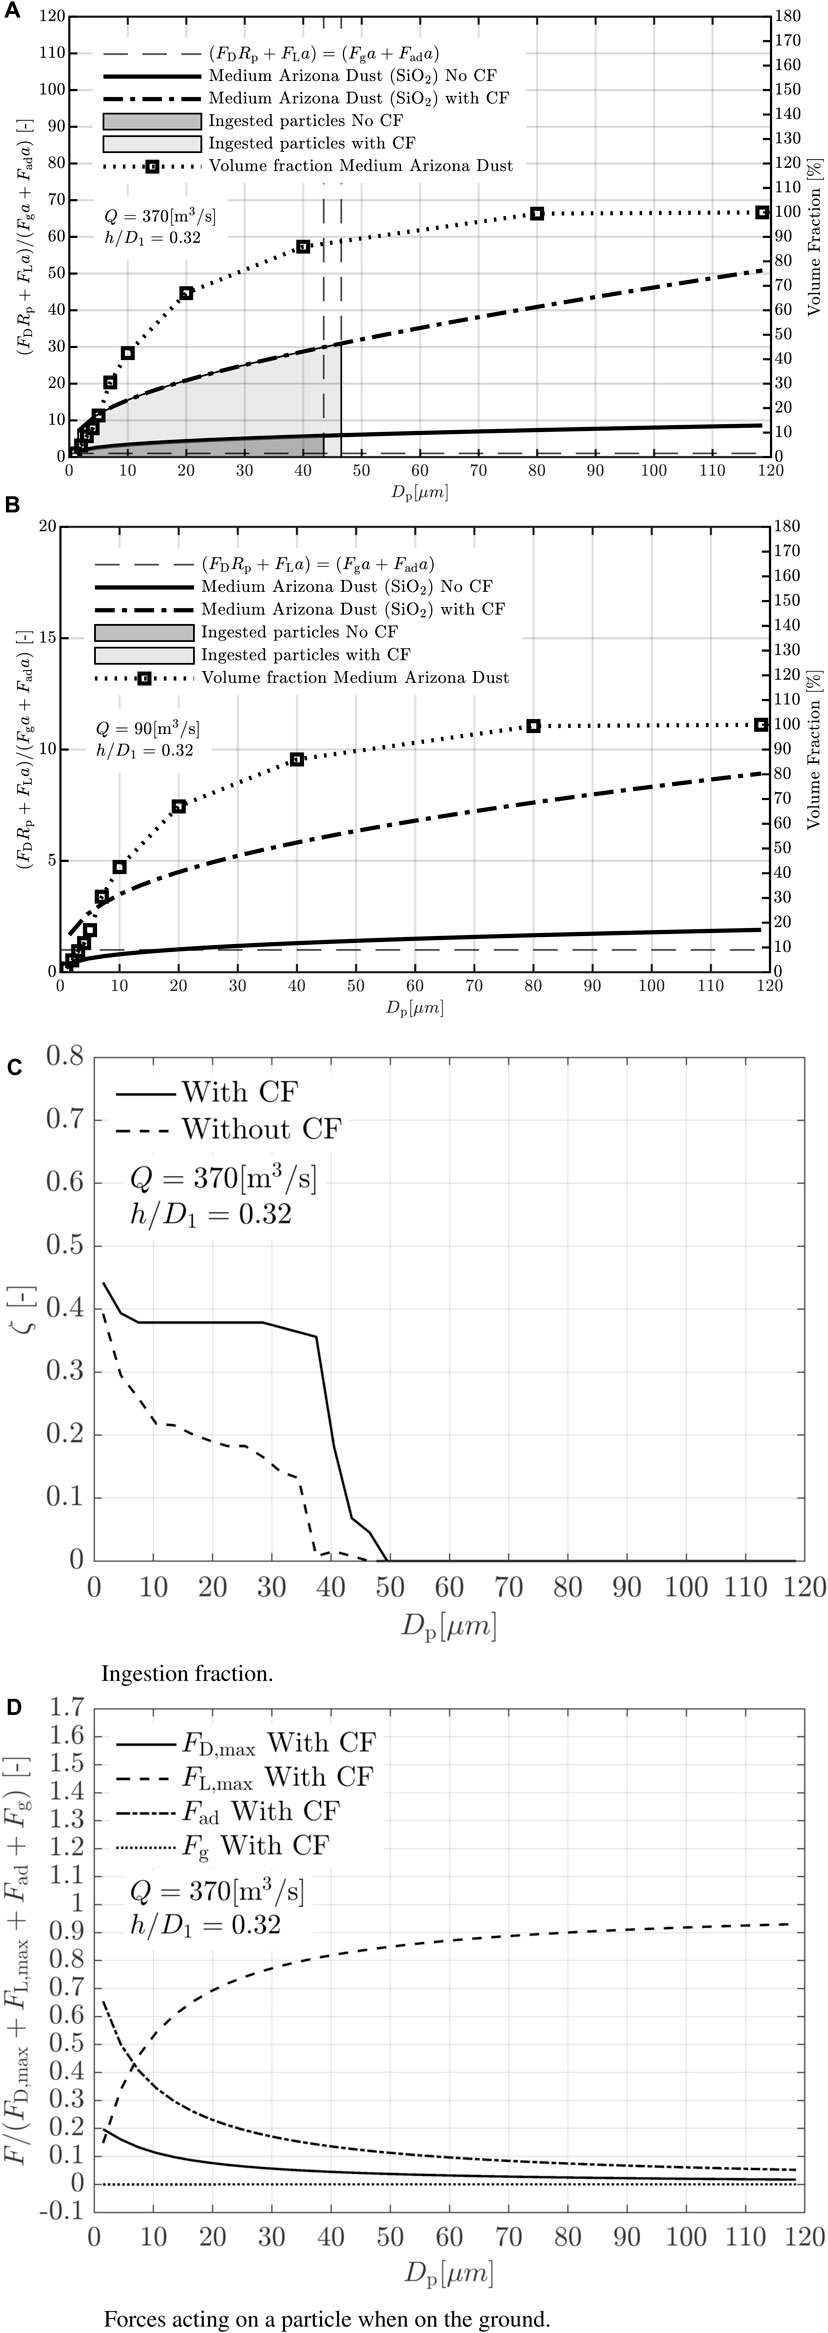
Figure 9
www.frontiersin.org

Figure 9. (A) Maximum ingested particle diameter during take-off. (B) Maximum ingested particle diameter during taxi. (C) Ingestion fraction. (D) Forces acting on a particle when on the ground.

8 Impact of engine position on the maximum ingested particle diameter

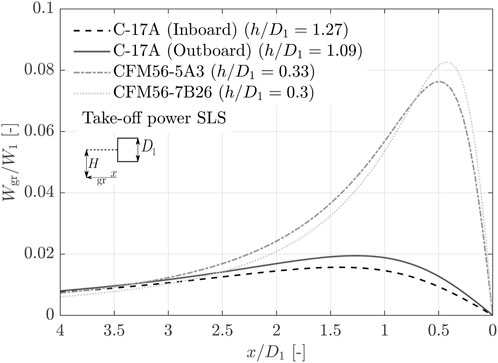
The impact of engine position on the maximum ingested ground particle size is investigated using three engines with varying heights above the ground. The analysis assumes a maximum power setting at sea level static (SLS) operation. Publicly available data for these engines and their installations are provided in Table 2. Among the engines considered, one is mounted on a high-wing aircraft configuration (F117-PW-100 mounted on the C-17A). For this engine, both inboard and outboard positions on the wing are examined. Additionally, two other engines are considered, representing a low-wing aircraft configuration: the CFM56-5A3 mounted on the A320-212 and the CFM56-7B26 mounted on the B737-700. For the high-wing aircraft engine positions, no runway and taxiway particles are ingested even if all particle sizes of the medium Arizona Road Dust are lifted up from the ground (see Table 2). This is due to the high nondimensional engine height h/D1. For the low-wing aircraft engines, in the case of the B737-700, the low engine non-dimensional height h/D1 leads particles up to 88.5 µm to be ingested. Even in this case, all particle sizes of the medium Arizona Road Dust are lifted up (see Table 2). For the A320-212, due to the slightly higher h/D1, only particles up to 37.5 µm are ingested. Hence, the maximum ingested particle diameter is strongly dependent on the nondimensional engine height. As illustrated in Figure 10, this phenomenon is attributed to the strength of the ground velocity (Wgr). The higher the engine is positioned above the ground, the weaker is the ground velocity. Consequently, particles, even if lifted, are unable to attain a sufficient height above the ground to be transported by the airflow into the intake.

Table 2
www.frontiersin.org

Table 2. Maximum ingested particle diameter for different aircraft and engine configurations.

Figure 10
www.frontiersin.org

Figure 10. Air ground velocities for different engines at different heights above the ground.

9 Impact of ground particles on the mission severity

The model described in Sections 35 is applied to a single flight mission considering different levels of ground particle concentrations C(DP) of Arizona Road Dust A3 at the departure and arrival airport. The particles lying on the ground are assumed to be evenly distributed. PM10 particle concentrations representative of several streets of European cities reveal a range from a minimum of 200µg m−2 to a maximum of 471300µg m−2 near a construction site (Amato et al., 2011). For example, PM10 particle concentrations are 200µg m−2 for new pavement, 800µg m−2 for old asphalt, and 4100µg m−2 for a roundabout in a city with a traffic frequency of 2000 vehicles per day. These examples illustrate the impact of the particle concentration C(DP) on the overall flight mission severity ωFM,CFC. This is shown in Table 3 for a nearly empty and highly loaded aircraft resulting in the corresponding engine nondimensional heights h/D1. The bigger the load of the aircraft, the lower the nondimensional height h/D1 and the higher the impact on the overall mission severity. This effect is exaggerated with increasing particle load on the runways and taxiways. Moreover, it becomes obvious that low particle concentrations on the ground only lead to a very small impact on flight mission severity, while PM10 particle concentrations of more than 800µg m−2 significantly increase flight mission severity. Hence, the impact of ground particle concentration on the individual flight segments is investigated for PM10 concentrations of 800µg m−2 and 4100µg m−2.

Table 3
www.frontiersin.org

Table 3. Flight mission severity parameter calculated for one mission with different ground particle concentrations and two different h/D1 values.

10 Impact of ground particles on flight segment severity

The severity of segments from a sample of 100 flight missions from NASA’s DASHlink dataset has been investigated. These missions, all operated by the same aircraft in 2002, occurred between various airports across the United States. The distance between departure and arrival airports is maintained at under 1,000 km (540 NM) to ensure that the severity experienced during ground operations, where ingestion of taxiway and runway particles is a concern, remains significant. Engine conditions are kept constant across all missions to prevent erosion accumulation and chord length reduction between flights. Suspended particle concentrations during the missions are calculated using the exponential altitude dependency as described in Hobbs (1993), scaled with daily PM10 levels at the departure and arrival airports to provide a realistic variation of suspended particle concentrations. Figure 11 shows the severity of each flight segment for the 100 sampled missions. All the departure and arrival airports of the selected missions are assumed to have PM10 ground particle load of either 0µg m−2, 800 μg m−2, or 4100µg m−2. Variations in segment severity among the missions can be attributed to differences in the concentrations of suspended particles encountered and the specific flight paths operated. As shown in Figure 11, in the case of no particles on the ground, the climb segment (CL) is dominant. This is consistent with the results obtained by Scarso et al. (2022) for missions of less than 1,000 km (540 NM). However, an increase in the PM10 ground particle concentration leads to an increase in the impact of the TO and taxi (TA) segment on the flight mission severity parameter ωFM,CFC. This is due to the increased amount of particles ingested during these phases. During most of the taxi time, no particles are ingested by the engine due to the low thrust level. At the end of the TA segment, the engine power setting is increased to take-off thrust level, which results in the ingestion of ground particles that impact the compressor blades and vanes with high kinetic energy. For the same reason, at very high levels of ground particle concentrations, the influence of the take-off segment on overall mission severity becomes significant.
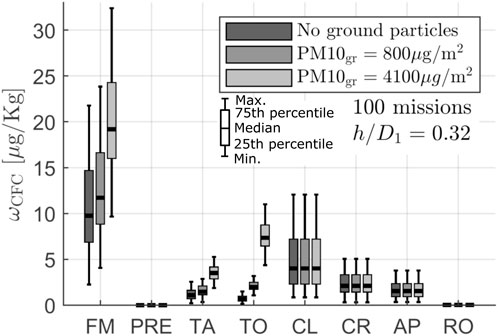
Figure 11
www.frontiersin.org

Figure 11. Impact of the flight segment on the mission severity parameter. The severity parameters calculated for the entire FM are shown on the left side.

11 Conclusion

It has been demonstrated that a simplified ingestion model of the taxiway and runway particles is suitable for investigating flight mission severity with regard to core flow compressor erosion. Its computational efficiency allows for the investigation of numerous missions in a short time, making it suitable for integration with a digital twin model. However, the model may underestimate the number of particles ingested due to its limited ability to reflect the complex inlet flow features such as ground vortices generated from viscous effects. The application of this model reveals that mission severity with regard to core compressors is affected by the ingestion of taxiway and runway particles. Key impacting factors include ground particle concentrations, engine height above the ground, and power settings. It is found that ground particles are ingested during take-off acceleration only. For very high ground particle concentrations, the influence of the take-off segment on overall mission severity becomes significant for engines operating flights traveling less than 1,000 km (540 NM). Thus, the ground particle concentration is a crucial boundary condition for understanding engine deterioration due to solid particle erosion.

Data availability statement

The datasets presented in this study can be found in online repositories. The names of the repository/repositories and accession number(s) can be found in the article/supplementary material.

Author contributions

SSc: conceptualization, investigation, methodology, validation, visualization, writing–original draft, and writing–review and editing. SSt: conceptualization and writing–review and editing. JM: writing–review and editing. NS: writing–review and editing.

Funding

The author(s) declare that financial support was received for the research, authorship, and/or publication of this article. The project on which this paper is based was funded by MTU Aero Engines Holding AG.

Acknowledgments

The authors are grateful to MTU Aero Engines for insightful assistance and for funding this research project. The authors acknowledge the American Project Discovery in Aeronautics Systems Health (DASHlink) of the National Aeronautics and Space Administration (NASA) for the allowance to use their datasets to underpin this research. The authors would also like to acknowledge the United States Environmental Protection Agency (EPA) and the website Visual crossing for their availability to provide the vital data for this research.

Conflict of interest

Author JM was employed by MTU Aero Engines AG. Author NS was employed by MTU Maintenance Hannover GmbH.

The remaining authors declare that the research was conducted in the absence of any commercial or financial relationships that could be construed as a potential conflict of interest.

Publisher’s note

All claims expressed in this article are solely those of the authors and do not necessarily represent those of their affiliated organizations, or those of the publisher, the editors, and the reviewers. Any product that may be evaluated in this article, or claim that may be made by its manufacturer, is not guaranteed or endorsed by the publisher.

References

Airbus (2024). A320 aircraft characteristics airport and maintenance planning. Available at: https://aircraft.airbus.com/en/customer-care/fleet-wide-care/airport-operations-and-aircraft-characteristics/aircraft-characteristics (Accessed March 16, 2024).

Google Scholar

Amato, F., Pandolfi, M., Moreno, T., Furger, M., Pey, J., Alastuey, A., et al. (2011). Sources and variability of inhalable road dust particles in three european cities. Elsevier Atmos. Environ. 45 (37), 6777–6787. doi:10.1016/j.atmosenv.2011.06.003

CrossRef Full Text | Google Scholar

Boeing Commercial Airplanes Airplane characteristics for airport planning. Available at: https://www.boeing.com/commercial/airports/plan-manuals (Accessed March 16, 2024).

Google Scholar

Brandes, T., Koch, C., and Staudacher, S. (2021b). Estimation of aircraft engine flight mission severity caused by erosion. J. Turbomach. 143 (11), 2021. doi:10.1115/1.4051000

CrossRef Full Text | Google Scholar

Brandes, T., Scarso, S., Koch, C., and Staudacher, S. (2021a). “Data-driven analysis of engine mission severity using non-dimensional groups,” in Proceedings of ASME Turbo Expo 2021: tirtual eonference. GT2021-58673.

CrossRef Full Text | Google Scholar

Colehour, J. L., and Farquhar, B. W. (1971). Inlet vortex. J. Aircr. 8 (1), 39–43. doi:10.2514/3.44224

CrossRef Full Text | Google Scholar

Das, S. K., Sharma, M. M., and Schechter, R. S. (1995). Adhesion and hydrodynamic removal of colloidal particles from surfaces. Part. Sci. Technol. 13 (3-4), 227–247. doi:10.1080/02726359508906680

CrossRef Full Text | Google Scholar

El-Batsh, H. (2001). Modeling particle deposition on compressor and turbine blade surfaces. Vienna: Vienna University of Technology. [Dissertation].

Google Scholar

Glenny, D. E., and Pyestock, N. G. T. E. (1970). Ingestion of debris into intakes by vortex action. Ministry of technology. London: Aeronautical research council, C.P.1114.

Google Scholar

Hamed, A., Tabakoff, W. C., and Wenglarz, R. V. (2006). Erosion and deposition in turbomachinery. J. Propuls. Power 22 (2), 350–360. doi:10.2514/1.18462

CrossRef Full Text | Google Scholar

Hess, J. L., and Smith, A. M. O. (1967). Calculation of potential flow about arbitrary bodies. Elsevier Prog. Aerosp. Sci. 8, 1–138. doi:10.1016/0376-0421(67)90003-6

CrossRef Full Text | Google Scholar

Hinds, W. C., and Zhu, Y. (1998). Aerosol technology: properties, behavior, and measurement of airborne particles. Chem. Environ. Health Saf.

Google Scholar

Hobbs, P. V. (1993). Aerosol-cloud-climate interactions. 1st ed. San Diego, California (USA): Academic Press, Inc.

Google Scholar

Hooi, C. G., Lagor, F. D., and Paley, D. A. (2015). Flow sensing, estimation and control for rotorcraft in ground effect. MT (USA): IEEE Aerospace Conference, Big Sky.

Google Scholar

International Air Transport Association Airline maintenance cost executive commentary FY2022 data. Available at: https://www.iata.org/(Accessed March 16, 2024).

Google Scholar

Klein, M., Staudacher, S., Abu-Taa, K., and Schwengler, J. (2022). Digital service twin to assess engine deterioration and remaining part life. Rotterdam, Netherlands: Proceedings of ASME Turbo Expo. GT2022-82113.

Google Scholar

Kurz, R., and Brun, K. (2000). Degradation in gas turbine systems. Munich, Germany: Proceedings of ASME Turbo Expo.

Google Scholar

Leighton, D., and Acrivos, A. (1985). The lift on a small sphere touching a plane in the presence of a simple shear flow. J. Appl. Math. Phys. (ZAMP) 36, 174–178. doi:10.1007/bf00949042

CrossRef Full Text | Google Scholar

Li, Q., Rudolph, V., and Peukert, W. (2006). London-van der Waals adhesiveness of rough particles. Elsevier Powder Technol. 161 (3), 248–255. doi:10.1016/j.powtec.2005.10.012

CrossRef Full Text | Google Scholar

Lorenz, M., Klein, M., Hartmann, J., Koch, C., and Staudacher, S. (2022). Prediction of compressor blade erosion experiments in a cascade based on flat plate specimen. Front. Im. Mech. Eng. 8. doi:10.3389/fmech.2022.925395

CrossRef Full Text | Google Scholar

Lyne, Å. L., Krivosheeva, O., and Birgisson, B. (2013). Adhesion between bitumen and aggregate: implementation of spectroscopic ellipsometry characterisation and estimation of hamaker’s constant. Mater. Struct. 46 (10), 1737–1745. doi:10.1617/s11527-012-0012-2

CrossRef Full Text | Google Scholar

MacManus, D. G., and Slaby, M. (2015). Intake ground vortex and computational modelling of foreign object ingestion. Aeronauticla J. 119 (1219), 1123–1145. doi:10.1017/s0001924000011167

CrossRef Full Text | Google Scholar

Nakayama, A., and Jones, J. R. (1996). Vortex formulation in inlet flow near a wall. Reno, Nevada (USA): AIAA 34th Aerospace Sciences Meeting and Exhibit.

Google Scholar

NASA Dashlink sample flight data. Available at: https://c3.nasa.gov/dashlink/projects/85/(Accessed March 16, 2024).

Google Scholar

Richardson, J. H., Sallee, G. P., and Smakula, F. K. (1979). “Causes of high pressure compressor deterioration in service,” in 15th Joint Propulsion jonference, pas cegas (USA: Nevada).

Google Scholar

Rivera, J. L., Sutherland, J. W., and Allen, J. S. (2013). Lift-off behavior of micro and nanoparticles in contact with a flat surface. J. Fluids Eng. 135 (10), 1–6. doi:10.1115/1.4024563

CrossRef Full Text | Google Scholar

Rodert, L. A., and Garrett, F. B. (1955). Ingestion of foreign objects into turbine engines by vortices. NACA TN: National Advisory Committee for Aeronautics.

Google Scholar

Roux, E. (2007). Turbofan and Turbojet engines: Database tandbook. Ed. Elodie Roux, Blagnac, Fr.

Google Scholar

Saravanamuttoo, H. I. H. (1994). “Erosion, corrosion and foreign object damage in gas turbines,” in AGARD-CP-558 (Rotterdam ,Netherlands: North Atlantic Treaty Organization). Technical Evaluator’s Report.

Google Scholar

Scarso, S., Staudacher, S., Keller, C., and Mathes, J. (2022). Mission severity assessment based on 1hz engine data. Rotterdam, Netherlands: Proceedings of ASME Turbo Expo. GT2022-80923.

Google Scholar

Secareanu, A., Moroianu, D., Karlsson, A., and Fuchs, L. (2005). Experimental and numerical study of ground vortex interaction in an air-intake. Reno, Nevada (USA): 43rd AIAA Aerospace Sciences Meeting and Exhibit.

Google Scholar

Soltani, M., and Ahmadi, G. (1994). On particle adhesion and removal mechanisms in turbulent flows. J. Adhesion Sci. Technol. 8 (7), 763–785. doi:10.1163/156856194x00799

CrossRef Full Text | Google Scholar

Tsai, C. J., Pui, D. Y. H., and Liu, B. Y. H. (1991). Elastic flattening and particle adhesion. Aerosol Sci. Technol. 15 (4), 239–255. doi:10.1080/02786829108959531

CrossRef Full Text | Google Scholar

United States Environmental Protection Agency (EPA) Air quality index daily values report. Available at: https://www.epa.gov/outdoor-air-quality-data/air-quality-index-daily-values-report (Accessed March 16, 2024).

Google Scholar

Vincent, B. (1973). The van der Waals attraction between colloid particles having adsorbed layers. II Calculation of interaction curves. J. Colloid Interface Sci. 42 (2), 270–285. doi:10.1016/0021-9797(73)90290-7

CrossRef Full Text | Google Scholar

Xu, L. Typical values of Young’s elastic modulus and Poisson’s ratio for pavement materials. Available at: https://www.academia.edu/15702729 (Accessed March 16, 2024).

Google Scholar

Zoeteweij, M. L., van der Donck, J. C. J., and Versluis, R. (2009). Particle removal in linear shear flow: model prediction and experimental validation. J. Adhesion Sci. Technol. 23 (6), 899–911. doi:10.1163/156856109x411247

CrossRef Full Text | Google Scholar

Nomenclature

Keywords: digital twin, erosion, compressor deterioration, runway and taxiway particles, engine deterioration, particle ingestion

Citation: Scarso S, Staudacher S, Mathes J and Schwarz N (2024) A model to assess the importance of runway and taxiway particles to aircraft engine compressor deterioration. Front. Mech. Eng. 10:1420472. doi: 10.3389/fmech.2024.1420472

Received: 20 April 2024; Accepted: 30 July 2024;
Published: 22 August 2024.

Edited by:

Zhigang Zuo, Tsinghua University, China

Reviewed by:

Zhiyi Yu, Beijing Institute of Technology, China
David John Rajendran, Cranfield University, United Kingdom

Copyright © 2024 Scarso, Staudacher, Mathes and Schwarz. This is an open-access article distributed under the terms of the Creative Commons Attribution License (CC BY). The use, distribution or reproduction in other forums is permitted, provided the original author(s) and the copyright owner(s) are credited and that the original publication in this journal is cited, in accordance with accepted academic practice. No use, distribution or reproduction is permitted which does not comply with these terms.

*Correspondence: Stefano Scarso, c3RlZmFuby5zYzk1QGdtYWlsLmNvbQ==

Disclaimer: All claims expressed in this article are solely those of the authors and do not necessarily represent those of their affiliated organizations, or those of the publisher, the editors and the reviewers. Any product that may be evaluated in this article or claim that may be made by its manufacturer is not guaranteed or endorsed by the publisher.