 Chengwang Lin
- Engineering College, Fujian Jiangxia University, Fuzhou, China
Introduction: Accurately predicting the remaining mechanical equipment is of great significance for ensuring the safe operation of the equipment and improving economic efficiency.
Methods: To accurately assess the mechanical equipment degradation, predict its remaining useful life, and ensure efficient, stable, and safe operation, a degradation and life prediction model for mechanical equipment based on multivariate stochastic processes is studied. The study innovatively predicts the remaining life of mechanical equipment using multivariate stochastic processes, and facilitates the correlation analysis between performance indicators based on the characteristics of Copula functions.
Results and discussion: The results showed that the Root Mean Squared Error value of the prediction results based on the trivariate Wiener process was 2.58, which decreased by 46.91% and 35.82% compared with the univariate and bivariate Wiener processes, respectively. The prediction value based on the trivariate gamma process was 3.49, which decreased by 44.95% and 40.54% compared with the univariate and bivariate gamma processes, respectively. In conclusion, the degradation and life prediction model with multivariate stochastic processes can effectively assess the mechanical equipment degradation and predict its remaining useful life. This provides an important reference for the maintenance and management of mechanical equipment, improving equipment efficiency and extend its service life.
1 Introduction
With rapid technological and economic growth, society has gradually entered an era of large-scale, highly complex, and sophisticated mechanical equipment (Hsu and Moses, 2022). The normal operation of these equipment is crucial for social production, and the demand for their operational reliability is increasing. Once these equipment fail, it may result in significant economic losses and safety risks. However, after the equipment is put into use, its components inevitably experience degradation, which undoubtedly brings many safety hazards (Hussain et al., 2021). The traditional approach is to stop the equipment for maintenance only when it fails, which can lead to significant economic losses for large-scale mechanical equipment (Qi et al., 2020). The current gap in research on the degradation and life prediction of mechanical equipment is that it only analyzes a single parameter that affects the mechanical equipment degradation, without comprehensively analyzing the impact of multiple parameters. It results in less than ideal accuracy in the degradation and life prediction of mechanical equipment. From the perspective of multiple parameters, this study comprehensively analyzes the impact of three or more parameters on the mechanical equipment performance degradation to achieve better prediction results. Scholars such as Bal B B used dynamic parameters for beam structure damage assessment to analyze the influence of crack depth and location on the dynamic characteristics of beams. This method combined finite element technology for analysis, which was feasible (Bal et al., 2020). Sahoo et al. constructed a novel glass epoxy composite laminated hybrid beam to improve the beam stiffness. The results showed that the added graphene in the composite material increased its stiffness (Sahoo et al., 2023). Researchers such as Parida and Jena analyzed the dynamic characteristics of modern material FGMS to solve the cracks in engineering structures. The results showed that FGM structures with initial cracks were significantly affected by the dynamic environment (Parida and Jena, 2020). Parida et al. used finite element method to model artificial femoral heads and bones to analyze the effects of different bio-materials on different walking postures. The simulation results showed that the geometric shape of the femoral head was related to the maximum stress intensity (Parida et al., 2022). The above research methods show that timely evaluating the current health status of equipment and predicting its future working status is of great significance in avoiding significant losses caused by failure. Therefore, this article is based on the method of multivariate stochastic process modeling to predict the remaining life of equipment. Therefore, a solution for ensuring the safe and stable mechanical equipment operating while reducing operating and maintenance costs has become an important problem that needs to be addressed. In response to this issue, innovative research has been conducted to construct the Degradation and Life Prediction Model (DLPM) for mechanical equipment based on multivariate stochastic processes. This model analyzes the variation characteristics of the equipment degradation process based on a single performance indicator. Additionally, the Copula function is used to analyze the correlation between performance indicators, accurately predicting the mechanical equipment’s remaining life. Therefore, in this context, this research innovatively utilizes multivariate stochastic processes to predict the remaining life of mechanical equipment and analyzing the correlation between performance indicators based on the characteristics of Copula functions. The contribution of research lies in its ability to effectively evaluate the health status of mechanical equipment and accurately predict its remaining life, providing a certain reference for predicting the remaining life of mechanical equipment. In addition, the study analyzes the degradation performance of equipment from multiple perspectives, which can consider multiple influencing factors. Therefore, it has stronger applicability. The research on mechanical equipment degradation and life prediction based on multivariate random processes aims to provide more accurate and comprehensive assessment of equipment performance and life prediction, thereby improving equipment efficiency and safety. The research content mainly includes four parts. The second part provides an overview of the current research status about equipment remaining life prediction techniques and data-driven stochastic process models both domestically and internationally. The third part designs the DLPM for mechanical equipment based on multivariate stochastic processes. The first section constructs DLPM for mechanical equipment based on univariate and bivariate stochastic processes, while the second section establishes a DLPM for mechanical equipment based on multivariate stochastic processes. The fourth part involves the simulation verification of the DLPM for mechanical equipment based on multivariate stochastic processes.
2 Related works
In recent years, fault diagnosis and remaining life prediction techniques for equipment have been widely applied in fields such as aerospace, nuclear power plants, large dams, and civil aircraft. Therefore, fault prediction and remaining life prediction techniques for equipment have gradually become a research hotspot. Many experts have conducted in-depth research on this issue, achieving significant research results. To accomplish an accurate predicting on the remaining service life of motor rolling bearings, Cheng et al. proposed a method based on the deep convolutional neural network to construct a data-driven framework. This method used a nonlinear degradation energy indicator for label training, and then extracted the original vibration degradation energy indicator of the bearing through the convolutional neural network. Experimental results showed that this method not only improved the prediction accuracy, but also had the potential for practical applications (Cheng et al., 2020). Chen and others proposed a long short-term memory network structure with automatic learning features for mechanical system health management prediction. A residual life prediction model based on an attention mechanism was designed for mechanical life prediction. This method could extract sequence features from raw sensory data and fuse automatic learning features with manual features using a feature fusion framework. Experimental results demonstrated that this method effectively improved the performance of mechanical life prediction (Chen et al., 2020). To promote the intelligence of industrial Internet of Things production, Ren and other researchers proposed a new data-driven method for predicting the remaining service life of industrial equipment by combining artificial intelligence technology with cloud-edge computing technology. The core of this method used a temporal convolutional network structure at the edge of the cloud, which could effectively obtain real-time prediction results from the edge plane. Compared with traditional prediction methods, this method not only improved the prediction accuracy but also significantly enhanced the prediction efficiency (Ren et al., 2020).
Data-driven stochastic process models play an important role in predicting the life of mechanical equipment. Mei and his colleagues proposed a method to provide low-latency computing services to users by using mobile edge computing to process computing resources and meet latency requirements. They employed parallel computing methods to perform computations simultaneously at the mobile edge and on the user’s local server. Additionally, they used stochastic process networks to deduce and analyze the latency bounds of the mobile edge computing network. The outcomes told that the solution reduced the latency of computing services (Mei et al., 2022). Adeen and Milano aimed to explore the stochastic processes between Weibull and normal distributions. They proposed an innovative method for modeling stochastic processes in power systems. This method relied on the theory of stochastic differential algebraic equations, which was applied in relevant examples of power systems. From the validation results, this method successfully revealed significant correlations between Weibull and normal distribution stochastic processes (Adeen and Milano, 2021). Radev and other researchers proposed a novel Bayesian inference method to derive the probability distribution of basic model parameters from observational data. This method relied on reversible neural networks to map parameter probability using a global estimator and implemented training through a neural network model. Experimental results demonstrated the wide applicability of this method in fields such as epidemiology and ecology (Radev et al., 2020). Xu and other scholars proposed a bivariate Wiener structure model to evaluate the reliability of permanent magnet brakes. This model uses Bayesian method to perform small sample cost analysis on the captured degradation data, and uses Monte Carlo algorithm to calculate the parameters of the permanent magnet brake. The results show that this method is feasible (Xu et al., 2024). Fang and Pan proposed a method that combines a multivariate Wiener process model with a multivariate universal path model to observe the multivariate degradation process in engineering systems. This method conducts hypothesis analysis on potential Gaussian dependency structures, and the results show that the model can accurately predict the failure probability of engineering systems (Fang and Pan, 2021). Sun et al. proposed to study the degradation performance of complex systems from two aspects: hard failure and soft failure, and constructed a nonlinear Wiener process model using time-varying copula method. The nonlinear Wiener process was used to characterize the system’s degradation behavior, and the results showed that the method was effective (Sun et al., 2021). The comparison of references is shown in Table 1.
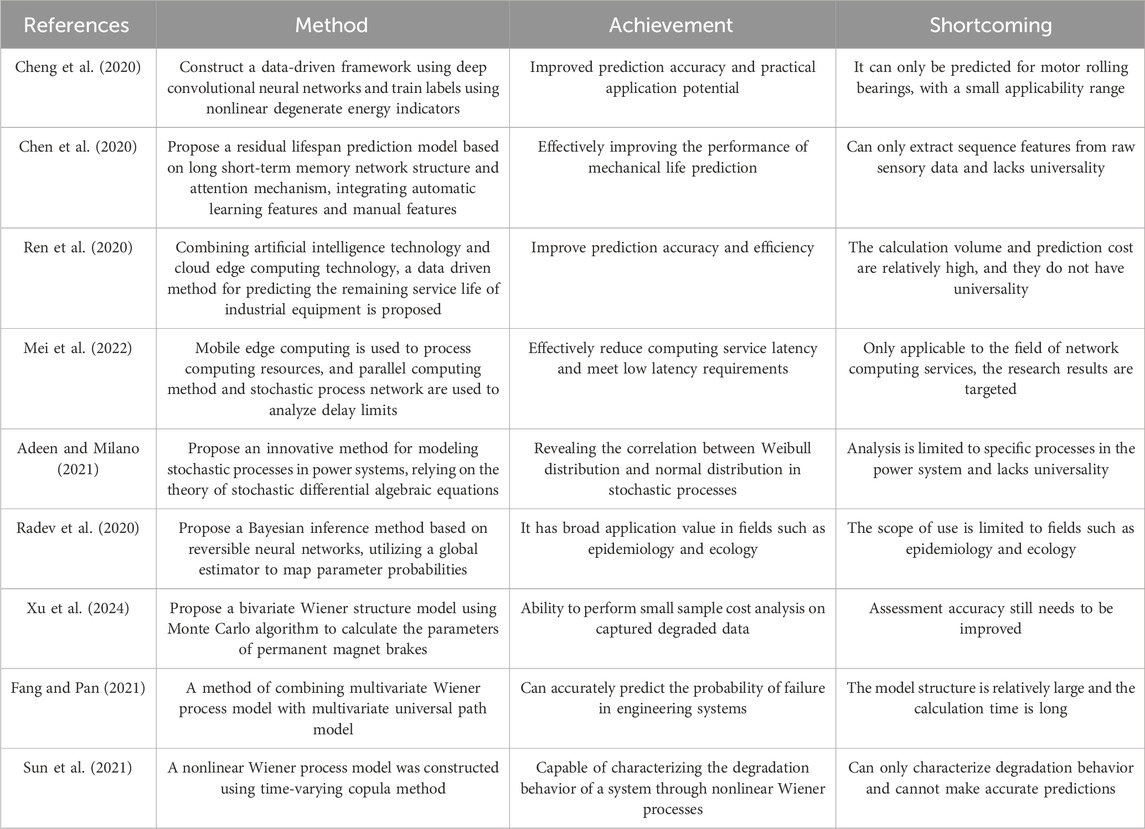
Table 1. Comparison of references.
In summary, although numerous experts and scholars have achieved rich results in the field of equipment life prediction, the research results have various limitations such as strong targeting, limited applicability, long calculation time, and insufficient evaluation accuracy. However, this study innovatively uses multivariate random models combined with Copula functions to analyze the correlation characteristics between performance indicators. This study is still relatively rare in the field of mechanical equipment degradation and life prediction, and can solve the problems of accuracy, efficiency, and universality in the above research, which has a wider application space. Therefore, this research based on multivariate stochastic processes aims to improve equipment efficiency and safety, which has important research value and application prospects.
3 Design of multivariate stochastic process models for mechanical equipment degradation and life prediction
Stochastic process models serve as the foundation and prerequisite for the subsequent research in this paper. This chapter focuses on the design of univariate, bivariate, and multivariate stochastic process models for mechanical equipment degradation and life prediction. Copula functions are utilized for describing the correlation characteristics of different performance indicators. The effectiveness of the model is validated through simulation experiments.
3.1 Construction of univariate and bivariate stochastic process models for mechanical equipment degradation and life prediction
After mechanical equipment is put into use, the performance of its components has degraded over time. This degradation phenomenon leads to changes in the working condition and material properties of the mechanical equipment, causing variations in certain key indicators (Zhongyi et al., 2020). When the accumulated degradation of the mechanical equipment reaches a certain level, it can lead to damage. If the damage accumulates to a certain extent, it can result in equipment failure or even breakdown (Wang et al., 2021). Since the mechanical degradation process is influenced by multiple factors, it can be considered as a random variation process. In order to accurately simulate the degradation and life prediction of mechanical equipment under actual operating conditions, stochastic processes are used to establish mechanical equipment degradation and life prediction model. The diagram of equipment remaining life is displayed as Figure 1.

Figure 1. Schematic diagram of the remaining lifespan of the equipment.
From Figure 1, the performance degradation process of the mechanical equipment follows a certain stochastic process. If the mechanical equipment fails at time
In Equation 1,
In Equation 2,
In Equation 3,
In Equation 4,
In Equation 5,
In Equation 6,
In Equation 7,
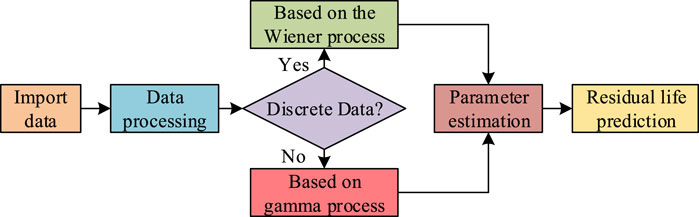
Figure 2. Process for predicting the lifespan of mechanical equipment based on stochastic processes.
As shown in Figure 2, the mechanical equipment life prediction model based on the stochastic process model can classify data into different categories. Then, based on the Wiener process model and the Gamma process model, the data is calculated to estimate the model parameters. Finally, based on the calculated parameters, the remaining life of the mechanical equipment is predicted. When using univariate stochastic processes for mechanical equipment life prediction, only the changing trend of a single performance indicator is considered. However, in reality, the degradation process of mechanical equipment is not solely determined by a single performance indicator, making it difficult to reflect the overall degradation of the equipment. It is necessary to analyze multiple performance indicators in-depth. Two performance indicators for mechanical equipment life prediction form the basis for studying the role of multiple performance indicators in mechanical equipment life prediction. Therefore, the mechanical equipment life prediction process based on bivariate stochastic processes is shown in Figure 3.
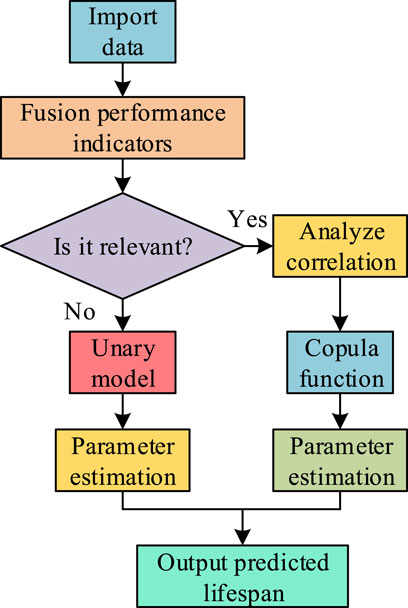
Figure 3. Process for predicting the lifespan of mechanical equipment based on binary stochastic processes.
As shown in Figure 3, assuming that there is a certain correlation between the degradation processes of the two performance indicators. To predict the lifespan of mechanical equipment more accurately, the Copula function can be introduced in the construction of the bivariate stochastic process model for mechanical equipment life prediction. It is used to describe the correlation characteristics between the performance indicators. Due to its ability to effectively correlate the joint distribution function of multiple random variables with their respective marginal distribution functions, the Copula function can analyze the correlation between different performance indicators. Copula functions are mainly divided into four types: Gaussian Copula functions, Frank Copula functions, Gumbel Copula functions, and Clayton Copula functions. Due to the potential differences in analysis results caused by different Copula functions, this study uses Akaike Information Criterion (AIC) to evaluate the applicability of each Copula function. The AIC criterion is a widely used method for evaluating the quality of model fitting. The core is that if the AIC value is low, the model has a better fitting effect on the data. Therefore, this research selects the most suitable Copula function based on the comparison of AIC values. It means that the Copula function with the smallest AIC value is considered as the optimal option. By introducing the Copula function, the degradation process of the mechanical equipment can be described more accurately. The model parameters can be updated using the stepwise estimation method to reflect the real-time performance status and degradation trend of the mechanical equipment (Smolyak, 2021). The expression for the performance indicators of the bivariate Wiener process is shown in Equation 8.
In Equation 8,
Based on Equation 9, the drift coefficient and diffusion coefficient are taken as derivatives, and the partial derivative is set to 0 to solve the equation. The estimated values of the drift coefficient and diffusion coefficient can be obtained, as shown in Equation 10.
In Equation 10,
In Equation 11,
3.2 Construction of the mechanical equipment DLPM based on multivariate stochastic process
In practical work, some complex mechanical equipment requires three or more performance indicators to accurately predict its life. Therefore, the construction of the mechanical equipment DLPM based on multivariate stochastic process is shown in Figure 4 (Jia et al., 2022).
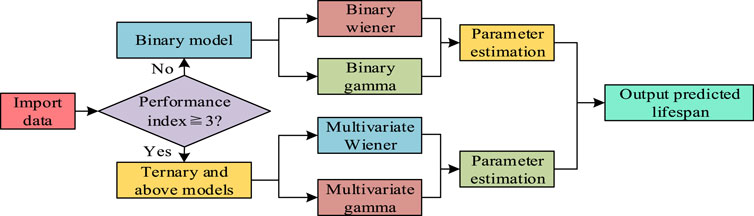
Figure 4. Mechanical equipment DLPM based on multivariate stochastic process.
In Figure 4, the mechanical equipment DLPM based on multivariate stochastic processes is an extension of the bivariate stochastic process model for mechanical equipment life prediction. This model includes the analysis of ternary and higher-order performance indicators to more accurately predict the life of mechanical equipment. When using two or more performance indicators to characterize the health status of mechanical equipment, it is necessary to consider the correlation between the performance indicators. Since the degradation process of most mechanical equipment is nonlinear, directly measuring the correlation between performance indicators is challenging. However, Copula functions, also known as linking functions, can connect the joint distribution function with their respective marginal distribution functions (Manlin et al., 2022). The most widely used Copula function is the bivariate Copula function, which can handle the correlation between two performance indicators (Chen et al., 2021). However, for the correlation between three or more performance indicators, the Vine Copula function is used. This function uses a decomposition method to transform the multivariate performance indicator problem into multiple bivariate Copula function problems. This decomposition method can be divided into two types: C-Vine and D-Vine (Mahmood and Ali, 2023). The mathematical expression of the Copula function is shown in Equation 12.
In Equation 12,
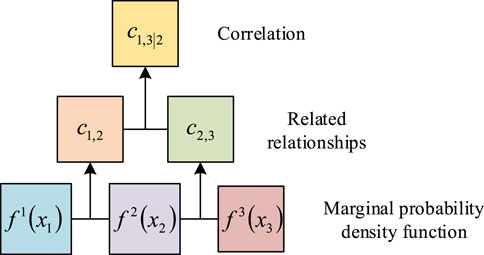
Figure 5. The decomposition process of vine copula function.
As shown in Figure 5, when dealing with three performance indicators, the decomposition process of the Vine Copula function can be divided into three layers. The first layer consists of the marginal probability density functions
In Equation 13,
In Equation 14,
In Equation 15,
In Equation 16,
In Equation 17,
In Equation 18,
In Equation 19,
4 Simulation verification of the mechanical equipment DLPM based on multivariate stochastic process
To validate the accuracy of the mechanical equipment DLPM based on multivariate stochastic processes, MATLAB simulation software is used to generate simulated data for the Wiener process and gamma process. Finally, combining the simulated data from these two processes, a comprehensive trail is practiced for evaluating the life and degradation of the mechanical equipment.
4.1 Simulation verification of the mechanical equipment DLPM based on multivariate wiener process
To validate the effectiveness of the mechanical equipment DLPM based on multivariate stochastic processes, the experimental environment is first set up, as shown in Table 2. From Table 2, the environment and memory required for the normal operation of the mechanical equipment degradation and lifespan prediction model based on multivariate stochastic processes in reality are 64 bit Ubuntu 18.04 operating system and 32 GB memory, respectively. This prediction model can effectively extend to online prediction in embedded systems. In practical applications, due to the different fault thresholds for different performance indicators of equipment, the fault thresholds for different performance indicators are usually set based on the characteristics of the equipment, working environment, and historical data. The setting of this threshold is crucial for the accuracy of life prediction. Therefore, when setting the threshold, it is necessary to fully consider the environment and working status of the equipment, and set the fault threshold based on the historical data and industry standards of the equipment to ensure the accuracy of diagnosis. When fault definitions based on different performance indicators conflict with each other, priority can be set for different performance indicators and weighted synthesis methods can be used for comprehensive consideration. The data used in the study is simulation data generated in MATLAB simulation software, with model parameters and values of 0.1 and 0.3, respectively. Generate two sets of simulated degradation increments that follow a normal distribution, with a data size of 350 samples per set. The degradation threshold of bearings is set according to physical health indicators, and the critical stage for setting the degradation rate is 40%. Bearings that exceed this condition belong to a severe degradation state. The time boundary is set to a maximum time index of 400, the initial condition for degradation state is 0% degradation rate, and the maximum degradation rate is 100%. The temperature is set to 0°C–40°C according to the boundary conditions of the industrial environment.
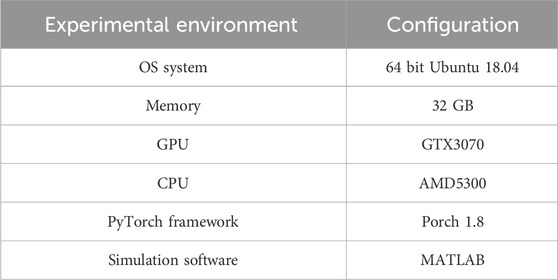
Table 2. Environment configuration.
The probability density function based on the multivariate Wiener process is shown in Figure 6. As time progressed, the distribution of the probability density function for the remaining life became narrower. This indicated that the deviation between the predicted confidence interval and the true remaining life value gradually decreased. The moment corresponding to the maximum value of the probability density function in the figure represented the predicted remaining life value of the model. It was worth noting that when the time index reached 400, the predicted values of the univariate, bivariate, and trivariate Wiener processes were almost consistent with the true remaining life value. This indicated that these predicted values were approaching the true remaining life value. This result strongly demonstrated the accuracy of the model.
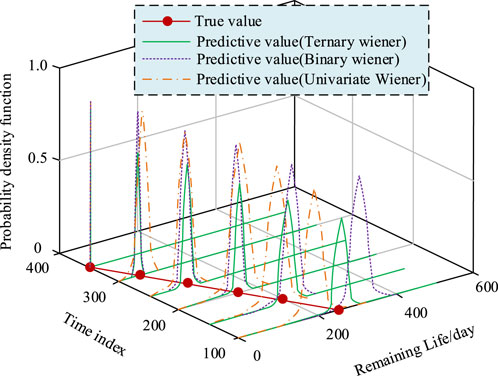
Figure 6. Probability density function.
To further validate the effectiveness of the mechanical equipment DLPM based on multivariate Wiener process, the Root Mean Square (RMS) value of the bearing vibration signal and the MEAN value of the temperature signal are analyzed through simulation, taking the bearing in the mechanical equipment as an example. The degradation trends of the trivariate Wiener process for the bearing’s performance indicators are shown in Figure 7. The horizontal vibration signal, vertical vibration signal, and temperature are the incremental degradation of bearing performance indicators. These three performance indicators of the bearing revealed the bearing degradation trend. From Figure 7A, the degradation trends of the horizontal and vertical vibration signals were consistent, with the RMS values increasing with the increase of the time index. When the time index was 350, the RMS values of the vertical and horizontal vibration signals were both 12.8, indicating that the bearing reached the failure state. From Figure 7B, the MEAN value of the temperature signal reached its highest value of 38.8°C when the time index was 350. In summary, it can be seen that with the continuous increase of measurement data, the predicted value of remaining life gradually approaches the true value. This confirmed the effectiveness and accuracy of the mechanical equipment DLPM based on multivariate Wiener process.
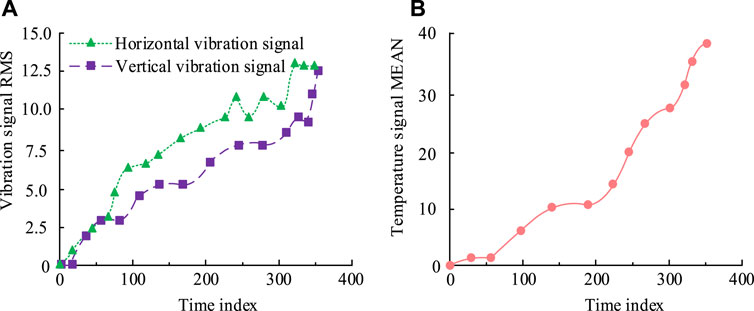
Figure 7. Performance degradation trend of ternary Wiener processes. (A) The degradation trend of horizontal and vertical signals. (B) The degradation trend of temperature signals.
4.2 Simulation verification of the mechanical equipment DLPM based on multivariate gamma process
The probability density function based on the multivariate gamma process is shown in Figure 8. As the measurement data increased, the maximum value of the probability density function gradually approached the true value. The distribution range of the predicted results also decreased. This phenomenon indicated that the predicted confidence interval was more accurate in approaching the true value of the remaining life. Specifically, as the degradation data of the mechanical equipment increased, the model was able to capture the complex correlations between various performance indicators more accurately, thereby improving the prediction accuracy. This trend reflected the reliability and accuracy of the mechanical equipment DLPM based on multivariate Gamma processes when dealing with large amounts of data.
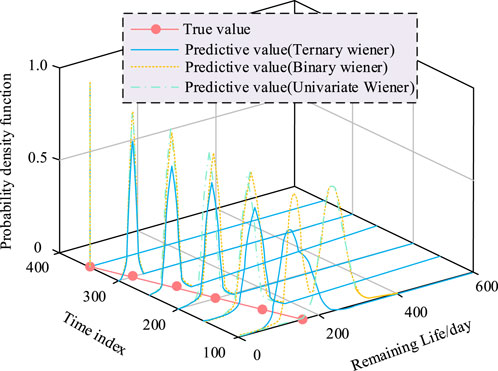
Figure 8. Probability density function based on multivariate gamma processes.
The degradation trends of the trivariate Gamma process are shown in Figure 9. In Figure 9A, in the mechanical equipment DLPM based on multivariate gamma processes, the RMS values of the horizontal and vertical vibration signals of the bearing reached 14.1 and 11.3, respectively, when the time index was 350. From Figure 9B, the MEAN values of the temperature signal also reached its maximum value of 38.5°C at the time index of 350. The above results jointly verified the effectiveness of the multivariate Gamma process model in capturing and predicting the key performance indicators of monitoring equipment such as vibration and temperature during the mechanical equipment degradation process. Overall, it can be concluded that the effectiveness of the multivariate Gamma process model in predicting the degradation and lifespan of mechanical equipment can meet practical needs.
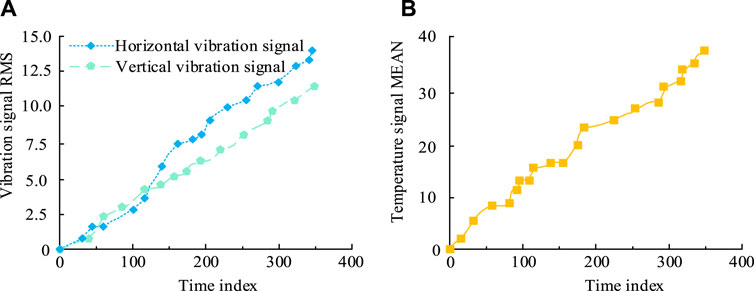
Figure 9. Performance degradation trend of ternary gamma processes. (A) The degradation trend of horizontal and vertical signals. (B) The degradation trend of temperature signals.
4.3 Comprehensive performance analysis of the mechanical equipment DLPM based on multivariate stochastic processes
To observe the prediction performance of the mechanical equipment DLPM based on multivariate stochastic processes more intuitively, the predicted results of the mechanical equipment life based on multivariate stochastic processes are plotted in Figure 10. Regardless of the type of stochastic process, both the predicted values and the true values decreased as the time index increased. Among them, when the time index was 350, the predicted values of all stochastic processes coincided completely with the true value at the remaining life of 0 days. This phenomenon indicated that as time progressed, the predicted values gradually approached and eventually equaled the true values, thus verifying the accuracy of the model. In addition, when the time index was 100, the true remaining life value was 250 days. The predicted values of the univariate, bivariate, and trivariate stochastic processes for the remaining life were 208 days, 287 days, and 282 days, respectively, with differences of 42 days, 37 days, and 32 days compared to the true value. From these data, it can be seen that the accuracy of the remaining life prediction based on the trivariate stochastic process is higher than that of the univariate and bivariate stochastic processes, further demonstrating the effectiveness and superiority of the mechanical equipment DLPM based on multivariate stochastic processes.
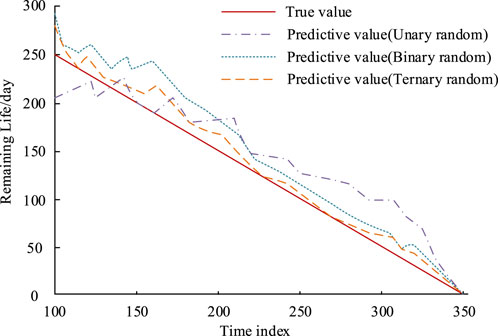
Figure 10. Prediction results of mechanical equipment life based on multivariate random processes.
The mechanical lifespan is influenced by various random factors such as working environment, maintenance, equipment quality, workload, and internal material characteristics. Therefore, it has uncertainty. A mechanical system based on the thermal generator is measured and analyzed. Further analysis is conducted using uncertainty, sensitivity, and confidence intervals. The study randomly selects 5 influencing factors for stochastic process modeling, and calculates the loss values under different factors based on different confidence levels. Based on the model parameters, sensitivity analysis is conducted using parameter sensitivity. The random influencing parameters include work environment, maintenance and upkeep, equipment quality, workload, and internal material characteristics. The sensitivity analysis weights of the random parameters based on variance are shown in Figure 11. From Figure 11, in the uncertainty analysis, the working environment had the greatest impact on the mechanical life, with an impact weight of 47.68%. In addition, the impact weights of workload and internal material characteristics were also high, reaching 28.98% and 16.96%, respectively. The remaining other influencing factors had a relatively small impact on the mechanical life.
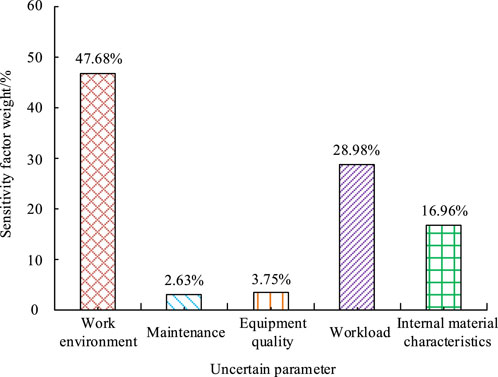
Figure 11. Weight chart for sensitivity analysis of random parameters.
To verify the effectiveness of the prediction method in practical applications, the study conducts validation analysis on the real degradation data of bearings obtained in actual experiments. The actual bearing degradation data contains a total of 351 pieces of data, including three performance indicators that can characterize the health status of the bearing, namely, horizontal vibration signal, vertical vibration signal, and temperature. The process of obtaining experimental data on bearing degradation is as follows: Firstly, select a representative mechanical equipment and ensure that it is equipped with sensors capable of measuring horizontal vibration, vertical vibration, and temperature. Common equipment includes a rolling bearing test bench. Next, install acceleration sensors in the horizontal and vertical directions of the bearings to measure vibration signals, and install temperature sensors near the bearings to measure temperature signals. Then set the bearings to operate under a certain load and speed to simulate actual working conditions. And record the operation process of the bearing from the initial state to the failure state. Finally, collect data once per second and record vibration and temperature signal data in real time. The degradation path of horizontal vibration signal is as follows: 1. Initial stage: During normal operation of the bearing, the RMS value of the horizontal vibration signal is low, the fluctuation range is small, and it shows a stable state. 2. Intermediate stage: As the bearings wear and age, the RMS value of the horizontal vibration signal gradually increases, the fluctuation range becomes larger, and a certain amplitude of fluctuation occurs. 3. Degradation stage: As the bearing approaches failure, the RMS value of the horizontal vibration signal significantly increases and fluctuates violently, reaching a high value, indicating that the bearing is about to fail.
The degradation path of vertical vibration signals is as follows: In the initial stage, the RMS value of vertical vibration signals is similar to that of horizontal vibration signals, initially low and stable. 2. Intermediate stage: As the bearing deteriorates, the RMS value of the vertical vibration signal gradually increases, and the fluctuation amplitude increases, similar to the trend of the horizontal vibration signal. 3. Degradation stage: When the bearing is approaching failure, the RMS value of the vertical vibration signal rises sharply and fluctuates violently, reaching a high value, indicating that the bearing is about to fail.
The degradation path of temperature signal is as follows: 1. Initial stage: When the bearing temperature is operating normally, the MEAN value of the temperature signal is low and the fluctuation range is small. 2. Intermediate stage: As the bearing wears and internal friction increases, the MEAN value of the temperature signal gradually increases, and the fluctuation range expands. 3. Degradation stage: When the bearing is approaching failure, the MEAN value of the temperature signal significantly increases, reaching a high value, and the temperature fluctuates violently, indicating a deterioration of lubrication conditions and an increase in friction.
A life prediction model in this real-world test set is used to predict the lifespan of bearings. The bearing life prediction results based on multivariate random processes are shown in Figure 12. From Figure 12, both the binary Wiener process and the ternary Wiener process were very close to the real data of the bearing degradation process. Among them, the prediction accuracy of the ternary Wiener process was higher than that of the binary Wiener process, but the improvement was not significant. Overall, the prediction results of this prediction model were very close to the actual degradation data of bearings. Therefore, this prediction model can objectively predict the remaining life of mechanical equipment, which is effective.
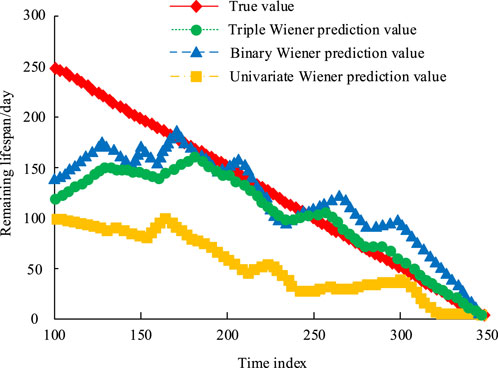
Figure 12. Comparison chart of bearing life prediction results based on multivariate random processes.
In order to further verify the performance of the method in practical applications, the real degradation process of bearings was analyzed. The relationship between bearing degradation and time is shown in Figure 13. From Figure 13, it can be seen that as the processing time of mechanical equipment increases, the degradation process of bearings shows a significant strengthening trend. Within a time index of 150, the degradation rate increased from 0% to 30%, indicating an early stage of degradation. During the time index of 150–275, the degradation rate remained around 40%, indicating a mid-term degradation. After the time index of 275, the degradation rate shows an exponential growth trend, and the degradation rate of the bearing gradually approaches 80%. This stage belongs to the severe degradation stage. In summary, it can be seen that the degradation process curve can be divided into three stages: initial, mid-term, and severe degradation, which can better reflect the degradation process and life cycle of bearings.
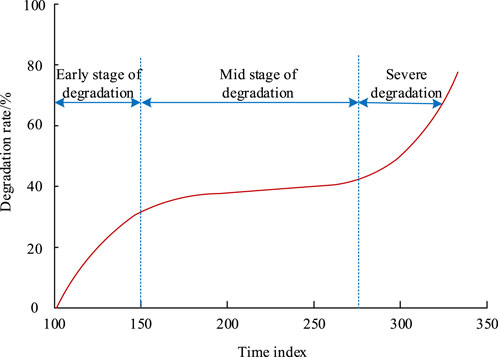
Figure 13. The relationship between bearing degradation and time transformation.
To comprehensively analyze the performance of the mechanical equipment DLPM based on Wiener and Gamma processes, the Root Mean Square Error (RMSE) is hired to analyze the predicted results of the remaining life of the mechanical equipment under different models, as Table 3. In the Wiener process-based life prediction model, the RMSE value of the trivariate Wiener process prediction results was 2.58, which was 46.91% and 35.82% lower than the univariate and bi-variate Wiener processes, respectively, indicating higher accuracy of the mechanical equipment DLPM based on the trivariate Wiener process. This is because the ternary Wiener process can better capture the complexity and uncertainty in the degradation process of mechanical equipment by introducing more random variables, thereby improving the accuracy of prediction. In the Gamma process-based life prediction model, the RMSE value of the trivariate gamma process prediction results was 3.49, which was 44.95% and 40.54% lower than the univariate and bivariate Gamma processes, it can be seen that the ternary gamma process can more accurately predict the remaining life and reduce prediction errors by simulating the degradation path of mechanical equipment in more detail. In summary, it can be seen that the mechanical equipment degradation and life prediction model based on the ternary gamma process has superior prediction performance.
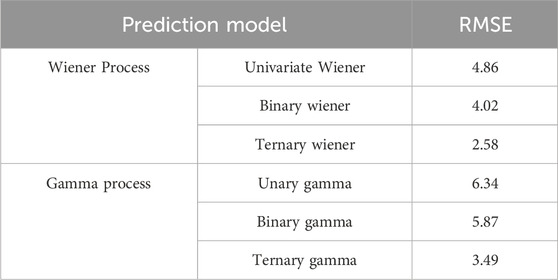
Table 3. Prediction results of residual life of mechanical equipment under different methods.
5 Discussion
In recent years, significant progress has been made in equipment failure and remaining life prediction technology in multiple fields. To accurately evaluate the performance degradation of mechanical equipment and predict its remaining service life. The study innovatively combines gamma processes and Wiener processes to construct a model based on multivariate stochastic processes. Compared with other research methods, this method has more advantages. For example, Cheng C’s research team used deep convolutional neural networks to construct a data-driven framework. The main limitation of this method is that it only utilizes convolutional neural networks to handle a single type of degraded feature, so its applicability is limited (Cheng et al., 2020). In contrast, the multivariate stochastic process model proposed in this study not only considers vibration signals, but also integrates multiple performance indicators such as temperature signals, which can more comprehensively evaluate the health status of equipment and has a wider range of applications. Meanwhile, the nonlinear Wiener process model proposed by Sun F et al. can only characterize degradation behavior and cannot make accurate predictions (Sun et al., 2021). The experimental results of this study show that in the life prediction model based on gamma processes, the RMSE value of the ternary gamma process prediction result is 3.49, which is 44.95% and 40.54% lower than that of the unary gamma and binary gamma, respectively. It can be seen that the multivariate stochastic process model in this study, through the combination of gamma process and Wiener process, can better capture the degradation law of equipment in the time dimension, thereby improving the accuracy and stability of prediction. In addition, Ren L and other researchers proposed the method of combining artificial intelligence with cloud edge computing, emphasizing the efficiency of real-time prediction, but there are still shortcomings in processing multivariate data fusion and modeling of complex degradation processes (Ren et al., 2020). The experimental results of this study show that in the mechanical equipment degradation and life prediction model of the multivariate Wiener process, when the time index is 350, the RMS values of the vertical and horizontal vibration signals both reach 12.8, and the MEAN value of the temperature signal reaches the highest value of 38.8C. The mechanical equipment degradation and life prediction model based on multivariate gamma processes has RMS values of 14.1 and 11.3 for the horizontal and vertical vibration signals of bearings at the same time index, respectively, while the MEAN value of the temperature signal reaches its maximum value of 38.5°C. It can be seen that the method proposed in this article not only improves prediction accuracy through a multivariate random process model, but also takes into account the dynamic changes of multivariate performance indicators, providing a more in-depth degradation analysis. Therefore, it can be seen from the above that the research on mechanical equipment degradation and life prediction based on multivariate stochastic processes has more performance advantages compared to other methods.
6 Conclusion
To accurately predict the remaining life of mechanical equipment, this study constructed a multivariate stochastic process mechanical equipment degradation and life prediction model, which could analyze multiple performance indicators through the stochastic process model with Gamma and Wiener processes. The results show that the degradation and life prediction model of mechanical equipment based on multivariate random processes studied can effectively evaluate the health status of mechanical equipment and help predict the remaining service life of mechanical equipment. However, the study only considers the normal degradation process of the equipment and does not take into account the possibility of sudden equipment failure. Considering that unpredictable faults may suddenly occur in the equipment, future research can consider combining classification algorithms to identify and classify possible failure conditions and situations. At the same time, it is also possible to combine random impact models to simulate the impact of unexpected events on the performance of mechanical equipment, which can help predict sudden equipment failures caused by external factors. To further improve the degradation and life prediction ability of the model, future research directions can consider conducting more in-depth research on the time-varying characteristics of the correlation between performance indicators, thereby enhancing the ability of the prediction model to capture dynamic changes and further improving prediction accuracy.
Data availability statement
The original contributions presented in the study are included in the article/Supplementary Material, further inquiries can be directed to the corresponding author.
Author contributions
CL: Conceptualization, Data curation, Formal Analysis, Methodology, Project administration, Supervision, Writing–original draft, Writing–review and editing.
Funding
The author(s) declare that no financial support was received for the research, authorship, and/or publication of this article.
Conflict of interest
The author declares that the research was conducted in the absence of any commercial or financial relationships that could be construed as a potential conflict of interest.
Publisher’s note
All claims expressed in this article are solely those of the authors and do not necessarily represent those of their affiliated organizations, or those of the publisher, the editors and the reviewers. Any product that may be evaluated in this article, or claim that may be made by its manufacturer, is not guaranteed or endorsed by the publisher.
References
Adeen, M., and Milano, F. (2021). Modeling of correlated stochastic processes for the transient stability analysis of power systems. IEEE Trans. Power Syst. 36 (5), 4445–4456. doi:10.1109/TPWRS.2021.3066453
Bal, B. B., Parida, S. P., and Jena, P. C. (2020) “Damage assessment of beam structure using dynamic parameters,” in Innovative product design and intelligent manufacturing systems: select proceedings of ICIPDIMS 2019. Springer Singapore, 175–183. doi:10.1007/978-981-15-2696-1_17
Barma, M., and Modibbo, U. M. (2022). Multiobjective mathematical optimization model for municipal solid waste management with economic analysis of reuse/recycling recovered waste materials. J. Comput. Cognitive Eng. 1 (3), 122–137. doi:10.47852/bonviewJCCE149145
Chen, B., Kou, Y., Wang, Y., Zhao, D., Liu, S., Liu, G., et al. (2021). Analysis of storm surge characteristics based on stochastic process. AIMS Math. 6 (2), 1177–1190. doi:10.3934/math.2021072
Chen, Z., Wu, M., Zhao, R., Guretno, F., Yan, R., and Li, X. (2020). Machine remaining useful life prediction via an attention-based deep learning approach. IEEE Trans. Industrial Electron. 68 (3), 2521–2531. doi:10.1109/TIE.2020.2972443
Cheng, C., Ma, G., Zhang, Y., Sun, M., Teng, F., Ding, H., et al. (2020). A deep learning-based remaining useful life prediction approach for bearings. IEEE/ASME Trans. Mechatronics 25 (3), 1243–1254. doi:10.1109/TMECH.2020.2971503
Choi, S., Hwang, D., and Nam, S. S. (2022). New statistical results of partial sums of ordered Gamma-distributed RVs for performance evaluation of wireless communication systems. Appl. Sci. 12 (23), 12485–124890. doi:10.3390/app122312485
Debnath, S. (2022). Fuzzy quadripartitioned neutrosophic soft matrix theory and its decision-making approach. J. Comput. Cognitive Eng. 1 (2), 88–93. doi:10.47852/bonviewJCCE19522514205514
Fang, G., and Pan, R. (2021). On multivariate copula modeling of dependent degradation processes. Comput. and Industrial Eng. 159, 107450. doi:10.1016/j.cie.2021.107450
Fang, Y., Luo, B., Zhao, T., He, D., Jiang, B., and Liu, Q. (2022). ST-SIGMA: spatio-temporal semantics and interaction graph aggregation for multi-agent perception and trajectory forecasting. CAAI Trans. Intell. Technol. 7 (4), 744–757. doi:10.1049/cit2.12145
Goetzmann, L. (2020). Gamma elements as protomental representations: suggestions for expanding WR Bion’s theory of elements. Int. J. Psychoanal. 101 (6), 1085–1105. doi:10.1080/00207578.2020.1822145
Hsu, I. S., and Moses, A. M. (2022). Stochastic models for single cell data: current challenges and the way forward. FEBS J. 289 (3), 647–658. doi:10.1111/febs.15760
Hussain, G., Khan, T., Khan, A., Inc, M., Zaman, G., Nisar, K. S., et al. (2021). Modeling the dynamics of novel coronavirus (COVID-19) via stochastic epidemic model. Alexandria Eng. J. 60 (4), 4121–4130. doi:10.1016/j.aej.2021.02.036
Jia, R., Wang, L., Zheng, C., and Chen, T. (2022). Online wear particle detection sensors for wear monitoring of mechanical equipment-A review. IEEE Sensors J. 22 (4), 2930–2947. doi:10.1109/JSEN.2021.3131467
Li, J., Wang, Z., Liu, X., and Feng, Z. (2023). Remaining useful life prediction of rolling bearings using GRU-DeepAR with adaptive failure threshold. Sensors 23 (3), 1144. doi:10.3390/s23031144
Liu, Z., Guo, S., Xu, X., Xu, S., and Cheng, J. (2021). Application of Copula functions in hydrology and water resources: a state-of-the-art review. Adv. Water Sci. 32 (1), 148–159. doi:10.14042/j.cnki.32.1309.2021.01.015
Mahmood, T., and Ali, Z. (2023). Analysis of Maclaurin symmetric mean operators for managing complex interval-valued q-Rung orthopair fuzzy setting and their applications. J. Comput. Cognitive Eng. 2 (2), 98–115. doi:10.47852/bonviewJCCE2202164
Manlin, C., Zhijie, Z., Zhang, B., Guanyu, H. U., and You, C. A. O. (2022). A novel combination belief rule base model for mechanical equipment fault diagnosis. Chin. J. Aeronautics 35 (5), 158–178. doi:10.1016/j.cja.2021.08.037
Mei, M., Yao, M., Yang, Q., Qin, M., Kwak, K. S., and Rao, R. R. (2022). Delay analysis of mobile edge computing using Poisson cluster process modeling: a stochastic network calculus perspective. IEEE Trans. Commun. 70 (4), 2532–2546. doi:10.1109/TCOMM.2022.3151879
Parida, S. P., and Jena, P. C. (2020) “Dynamic analysis of cracked FGM cantilever beam,” in Innovative product design and intelligent manufacturing systems: select proceedings of ICIPDIMS 2019. Singapore: Springer, 339–347. doi:10.1007/978-981-15-2696-1_33
Parida, S. P., Jena, P. C., Das, S. R., Dhupal, D., and Dash, R. R. (2022). Comparative stress analysis of different suitable biomaterials for artificial hip joint and femur bone using finite element simulation. Adv. Mater. Process. Technol. 8 (Suppl. 3), 1741–1756. doi:10.1080/2374068X.2021.1949541
Pustovyi, V. М., Semenov, P. O., Nemchuk, O. O., Hredil, M. І., Nesterov, O. A., and Strelbitskyi, V. V. (2022). Degradation of steels of the reloading equipment operating beyond its designed service life. Mater. Sci. 57 (5), 640–648. doi:10.1007/s11003-022-00590-1
Qi, W., Zong, G., and Zheng, W. X. (2020). Adaptive event-triggered SMC for stochastic switching systems with semi-Markov process and application to boost converter circuit model. IEEE Trans. Circuits Syst. I Regul. Pap. 68 (2), 786–796. doi:10.1109/TCSI.2020.3036847
Radev, S. T., Mertens, U. K., Voss, A., Ardizzone, L., and Köthe, U. (2020). BayesFlow: learning complex stochastic models with invertible neural networks. IEEE Trans. Neural Netw. Learn. Syst. 33 (4), 1452–1466. doi:10.1109/TNNLS.2020.3042395
Razmkhah, H., Fararouie, A., and Ravari, A. R. (2022). Multivariate flood frequency analysis using bivariate copula functions. Water Resour. Manag. 36 (2), 729–743. doi:10.1007/s11269-021-03055-3
Ren, L., Liu, Y., Wang, X., Lü, J., and Deen, M. J. (2020). Cloud–edge-based lightweight temporal convolutional networks for remaining useful life prediction in IIoT. IEEE Internet Things J. 8 (16), 12578–12587. doi:10.1109/JIOT.2020.3008170
Sahoo, S., Parida, S. P., and Jena, P. C. (2023). Dynamic response of a laminated hybrid composite cantilever beam with multiple cracks and moving mass. Struct. Eng. Mech. 87 (6), 529–540. doi:10.12989/sem.2023.87.6.529
Smolyak, S. (2021). Valuation of machinery and equipment subject to the Wiener degradation process. Ekon. I Mat. Metody 57 (3), 97–109. doi:10.31857/S042473880016422-3
Sun, F., Li, H., Cheng, Y., and Liao, H. (2021). Reliability analysis for a system experiencing dependent degradation processes and random shocks based on a nonlinear Wiener process model. Reliab. Eng. and Syst. Saf. 215, 107906. doi:10.1016/j.ress.2021.107906
Wang, B., Hu, X., Mei, T. X., Jian, S. D., and Wei, W. (2021). Rolling bearing degradation condition clustering using multidimensional degradation feature and Gath–Geva fuzzy clustering algorithm. J. Vib. Control 27 (17-18), 1929–1938. doi:10.1177/1077546320954958
Xu, A., Wang, B., Zhu, D., Pang, J., and Lian, X. (2024). Bayesian reliability assessment of permanent magnet brake under small sample size. IEEE Trans. Reliab., 1–11. doi:10.1109/TR.2024.3381072
Keywords: multivariate stochastic processes, mechanical equipment, life prediction, equipment degradation, copula function
Citation: Lin C (2024) Degradation and life prediction of mechanical equipment based on multivariate stochastic process. Front. Mech. Eng. 10:1418137. doi: 10.3389/fmech.2024.1418137
Received: 16 April 2024; Accepted: 07 August 2024;
Published: 20 August 2024.
Edited by:
Hamid Reza Karimi, Polytechnic University of Milan, ItalyReviewed by:
Naipeng Li, Xi’an Jiaotong University, ChinaWei Guo, City University of Hong Kong, Hong Kong, SAR China
Ancha Xu, Zhejiang Gongshang University, China
Xiangyu Kong, Xi’an Research Institute of High Technology, China
Copyright © 2024 Lin. This is an open-access article distributed under the terms of the Creative Commons Attribution License (CC BY). The use, distribution or reproduction in other forums is permitted, provided the original author(s) and the copyright owner(s) are credited and that the original publication in this journal is cited, in accordance with accepted academic practice. No use, distribution or reproduction is permitted which does not comply with these terms.
*Correspondence: Chengwang Lin, Y3dsaW41NzA0MjFAMTYzLmNvbQ==