 Jianwei Zhang
 Tao Wang*
- School of Automotive Engineering, Foshan Polytechnic, Foshan, China
Introduction: Traditional adaptive cruise control systems ignore the impact of the driver’s intentions and driving behavior on system performance.
Methods: In response to this issue, this study designs a new adaptive cruise control system by combining personalized driving style recognition, dynamic distance control, prospective energy management, and a model predictive control framework that integrates long short-term memory neural networks and ensemble learning.
Results: It was verified that the accuracy of the algorithm was 96.2%. In addition, experts had average ratings of 95, 96, and 98 for the economy, safety, and comfort of the system, respectively.
Discussion: This model is expected to achieve comprehensive performance optimization and improvement of EREV in complex driving environments, injecting new vitality and power into the intelligent development of electric vehicles.
1 Introduction
Currently, Electric Vehicles (EVs) have received widespread attention as green and environmentally friendly modes of transportation. Among them, Extended Range Electric Vehicles (EREVs) have become a popular choice in the market due to their unique driving method - they can still rely on internal combustion engines to generate electricity and continue to operate after running out of battery. However, having only efficient energy utilization methods is not enough to meet the safety and comfort needs of modern drivers. Therefore, the Adaptive Cruise Control (ACC) strategy of EREV has become a focus of research (Dinesh et al., 2017a; Dinesh et al., 2017b). ACC is a driver assistance technology that adaptively adjusts vehicle distance to ensure safety. However, traditional ACC systems are mostly designed based on fixed parameters and control logic, ignoring differences in driver behavior. In actual driving, the driver’s reaction speed, following distance, and preferences for acceleration and deceleration can all affect the performance of the ACC system. In view of this, this study innovatively applies driver intention prediction, Model Predictive Control (MPC), modular central control unit design, and enhanced Long Short-Term Memory Network (LSTM) integration algorithm to the adaptive cruise control strategy of EREVs. Finally, a Boosted LSTM Ensemble (BLE) algorithm is designed to achieve comprehensive optimization of driving experience, energy management, safety performance, and comprehensive performance, opening up a new path for the intelligent development of EVs. The research mainly includes four parts. The second part provides an overview of the current research status in EREV adaptive cruise control, and summarizes the research achievements and methods at home and abroad. In the third part, a driving behavior model is first designed, and MPC and BLE algorithms are combined for EREV adaptive cruise control. In the fourth part, the optimization effect of the algorithm is verified through comparative experiments and efficiency verification, and the various performance aspects of the technology are tested in practical use (Groumpos, 2023).
2 Related works
Nowadays, more scholars are dedicated to the research of control strategies for EREV power systems. Lasocki et al. proposed three control strategies for EREV power systems: pure electric mode, hybrid mode with ICE continuous operation, and hybrid mode with ICE only operating at high power demands. In pure electric mode, the battery energy balance was negative, while in mixed mode using ICE continuously or dynamically, the battery energy balance was positive (Lasocki et al., 2022). Zhang and others proposed an energy management strategy with multi-agent system network technology to improve the fuel economy of EREVs. Compared to traditional strategies, this strategy could significantly reduce fuel consumption and total energy consumption, providing new methods and theoretical support for energy management of hybrid vehicles (Zhang et al., 2023). Rosolia et al. proposed a learning Model Predictive Controller method for autonomous racing control, which stored the system trajectory and input sequence for each lap. This method effectively improved the performance of autonomous racing by proposing a system recognition strategy (Rosolia and Borrelli, 2019). Researchers such as Sun et al. proposed a comprehensive solution combining ACC and energy management strategy to address the economic following problem of intelligent hybrid EVs. The performance of fusion control and series control was compared through MPC method, and fusion control could reduce fuel consumption by about 5% compared to series control (Sun et al., 2019).
Kopczyński et al. analyzed and compared three modes for the control strategy of the power system of EVs with extended range, namely, pure electric, continuous operation of the range device and operation only under high power demand. The results showed that the battery energy was negative in the pure electric mode, the battery was significantly positive in the continuous operating mode, and the battery was moderately positive in the active mode in the dynamic time (Kopczyński et al., 2022). Wischnewski et al. established a robust control model with Tube Model Predictive Control (TMPC) to address the nonlinear effects and external disturbances experienced by autonomous racing cars during handling limits. Compared with MPC and infinite time LQR controllers, TMPC controllers reduced constraint violations while maintaining similar performance levels and have higher practicality (Wischnewski et al., 2022). Zhai et al. developed a comprehensive control strategy to control the trajectory tracking and handling stability of EVs during high-speed driving. The method performed good effectiveness, with cumulative lateral tracking errors reduced by 51.9% and 87.7%, respectively (Zhai et al., 2022). Aiming at the fuel economy problem of EVs with extended range, an energy control strategy based on multi-agent system network technology was proposed by Zhang et al. The results showed that compared with the dynamic planning control strategy, the strategy saved 3.3%, the total energy consumption was reduced by 1.4%; compared with the traditional electric auxiliary control strategy, E.S was 18.2%, and the total energy consumption was reduced by 16.6% (Zhang et al., 2023). Li et al. established a model with recurrent neural network to address the issue of lane change intention inference in traffic scenarios. After training with TensorFlow and Next-Generation Simulation (NGSIM) data in typical scenarios, the accuracy of intent inference reached up to 96% (Li et al., 2021). Venkitaraman and Venkata proposed a hybrid deep learning method for the low accuracy of movement state power control in EVs. The recurrent neural network was used to extract the features, and then the bidirectional gated cycle cell framework was used to predict the EV state. The results showed that this method could accurately predict the motor power consumption of EVs, and compared with the traditional model, the convergence rate was fast and the error rate was lower (Venkitaraman and Venkata, 2023).
In summary, the LSTM algorithm and MPC provide a certain reference for EREV control. However, traditional gesture recognition systems rarely combine the advantages of the two to enhance the accuracy and robustness. Therefore, the study combines the improved MPC algorithm to design a new type of EREV adaptive cruise control system based on MPC, providing new ideas and directions for the intelligent development of EVs.
3 EREV control system based on driving behavior model
This chapter is divided into two sections. The first section mainly focuses on the overall design of the ACC system and the design of the MPC model. The second section establishes a driving behavior model and establishes a BLE model.
3.1 Overall design and MPC optimization of ACC system
The ACC system has three core functions that together enhance driving comfort and efficiency. Firstly, it can accurately identify and adapt to each driver’s unique driving style by analyzing their behavioral data in depth. Whether they prefer smooth cruising or are passionate about aggressive driving, ACC can perfectly replicate this style while ensuring safety, tailoring a more intimate autonomous driving experience for drivers (Yang and Yin, 2020; Huang et al., 2022). Secondly, when the driver shows the intention of overtaking, such as activating the steering signal or pressing on the accelerator pedal, the ACC system will immediately respond and intelligently adjust the distance control with the previous vehicle, leaving enough space for the driver’s overtaking operation to ensure the smooth and safe process. Dynamic distance control is a key function in the adaptive cruise control system. By adjusting the distance from the car in front in real time, it can effectively respond to various driving scenes. In terms of safety, dynamic distance control can ensure that the vehicle keeps a safe distance from the vehicle in front, avoid rear-end accidents, and improve driving safety. In terms of comfort, the speed and distance can be automatically adjusted according to the driver’s preferences and road conditions, reducing the discomfort caused by frequent acceleration and deceleration, and improving the driving experience. Finally, energy management plays a crucial role in optimizing the performance of adaptive cruise control systems, particularly in improving the efficiency of EREVs. Its function is mainly reflected in the following points: firstly, through precise energy management, it can ensure that during the adaptive cruise process, the car can efficiently utilize energy according to road conditions and driving needs, reducing unnecessary energy consumption (Sun et al., 2021; Luan et al., 2023; Yang et al., 2023). In addition, combining intelligent scheduling and path planning, energy management can optimize driving routes and speeds, thereby reducing energy consumption and improving overall efficiency. The system framework is shown in Figure 1.
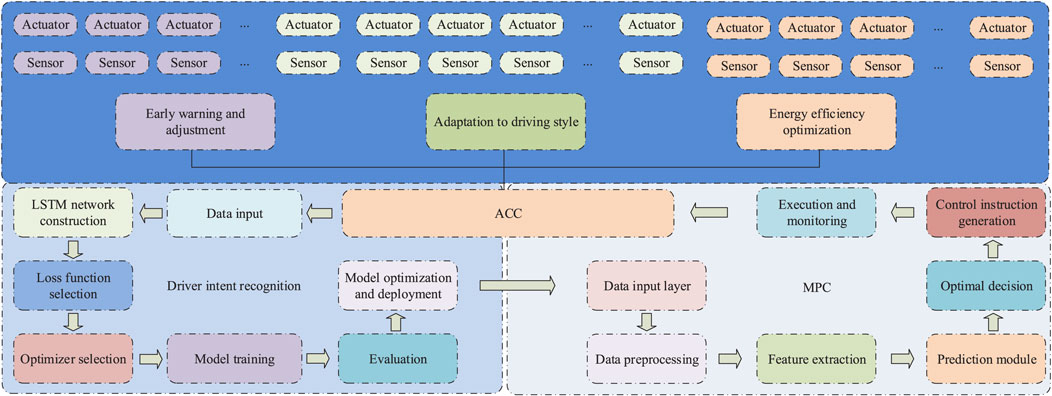
Figure 1. Schematic diagram of ACC system framework structure.
In the framework of MPC, the Predictive Time Domain (Np) defines the time span over which the future state of the system is predicted, while the Control Time Domain (Nc) defines the time period during which the control input is optimized, typically within the range of Np. At the beginning of each control cycle, the system obtains the current state information through sensor measurement or estimation. Subsequently, set one or more optimization objectives based on actual needs, such as reducing tracking errors, reducing energy consumption, etc., as shown in Eq. 1.
In Eq. 1,
In Eq. 2,
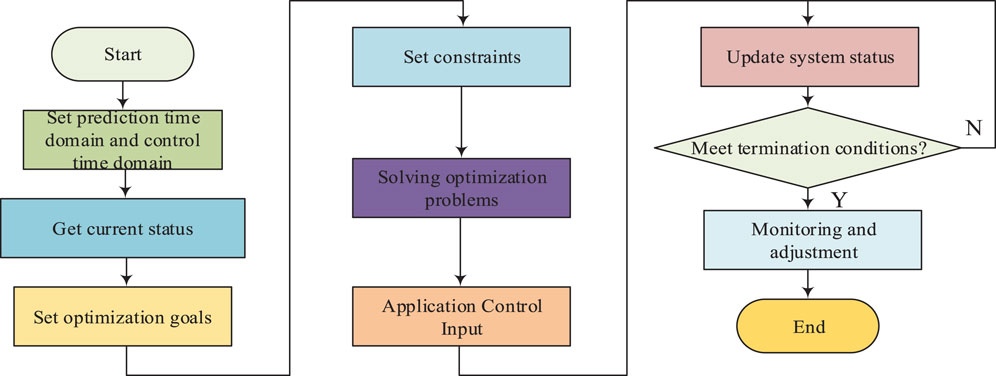
Figure 2. Schematic diagram of MPC algorithm flow.
In EREV, the optimal power source (battery or engine/generator) and allocation ratio can be determined by MPC based on the information predicted by it for future driving conditions and energy requirements, and then a method that accurately describes the dynamic behavior of the EREV can be developed. This includes battery discharge and charging models, fuel efficiency models for internal combustion engines, vehicle power demand models, and possible environmental models (such as climate impacts). Firstly, the vehicle power demand model is integrated with the predicted driver intentions, as shown in Eq. 3.
In Eq. 3,
By integrating the driver’s intentions, MPC can not only respond to the vehicle’s energy state, but also predict and adapt to the driver’s behavior. The central control unit mainly includes 6 core modules. Firstly, there is the data acquisition module, where the CCU is responsible for collecting key data from the sensor network, including battery state of charge, temperature, engine status, vehicle dynamic parameters, etc. These data are the foundation for accurate prediction and decision-making of MPC strategies. Next is the data pre-processing module, where the CCU cleans, filters, and converts the raw data to eliminate noise and outliers. Kalman filtering is used to reduce sensor noise and estimate the state of dynamic systems. The prediction steps are shown in Eq. 5.
In Eq. 5,
In Eq. 6,
In Eq. 7,
In Eq. 8,
3.2 Driving intention prediction and BLE model
In complex MPC frameworks, LSTM is introduced to accurately identify the driver’s intentions. Within the framework of MPC, ensemble LSTM and ensemble learning can effectively enhance the adaptability and responsiveness of Adaptive Cruise Control Systems (ACCS). Firstly, LSTM can process long sequence data, accurately identify driver intentions, and provide accurate predictive information for MPC. Secondly, ensemble learning can improve the generalization ability and stability of the system by combining multiple learners, enabling ACCS to respond quickly under different driving conditions. Therefore, this integration method can significantly improve the performance of ACCS and ensure driving safety. The input size (N) is set in the range of 5–20 to adapt to the input of different sensor data, including engine power, motor power, brake pressure, etc. The output of the system is the goal of the control strategy, reflecting changes in the system state, including vehicle speed, acceleration, distance, etc. During the control process, it is necessary to optimize the control signal for a certain period of time in the future according to the following formula, as shown in Eq. 9a.
In Eq. 9a,
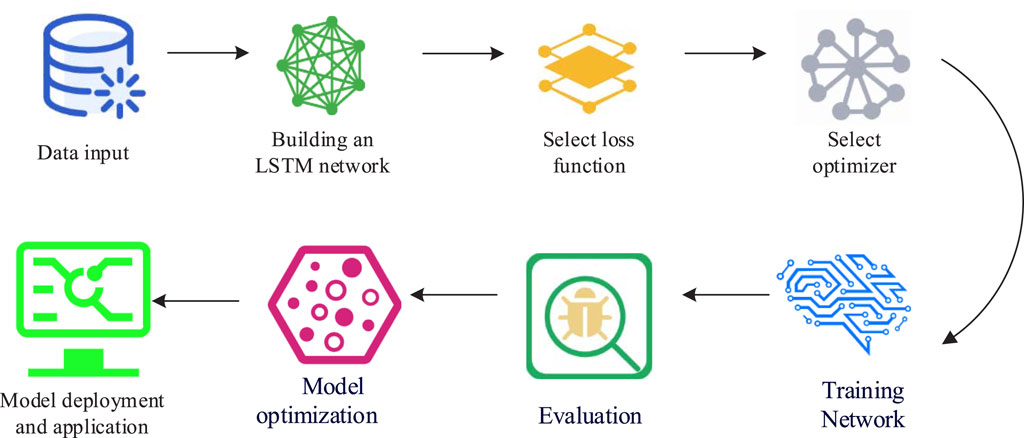
Figure 3. Algorithm flow of LSTM model for continuous driver intention recognition.
Eq. 9b shows the expression for its forget gate.
In Eq. 9b,
In Eq. 10,
In Eq. 11,
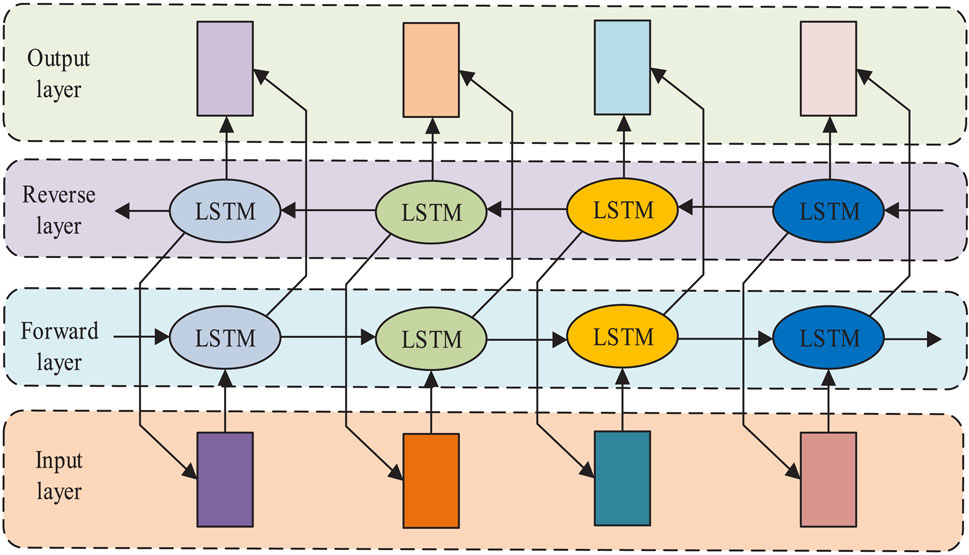
Figure 4. Schematic diagram of lLSTM neural network structure.
The third step is to select a loss function. For classification tasks such as driver intent recognition, the loss function used in the study is Cross Entropy Loss. The fourth step is to select an optimizer. The research adopts the Adam optimizer, which combines the ideas of Momentum and RMS prop, and can automatically adjust the learning rate of each parameter. In the later stage of training, it can approach the optimal solution more stably. The driver intention model is shown in Eq. 12.
In Eq. 12,
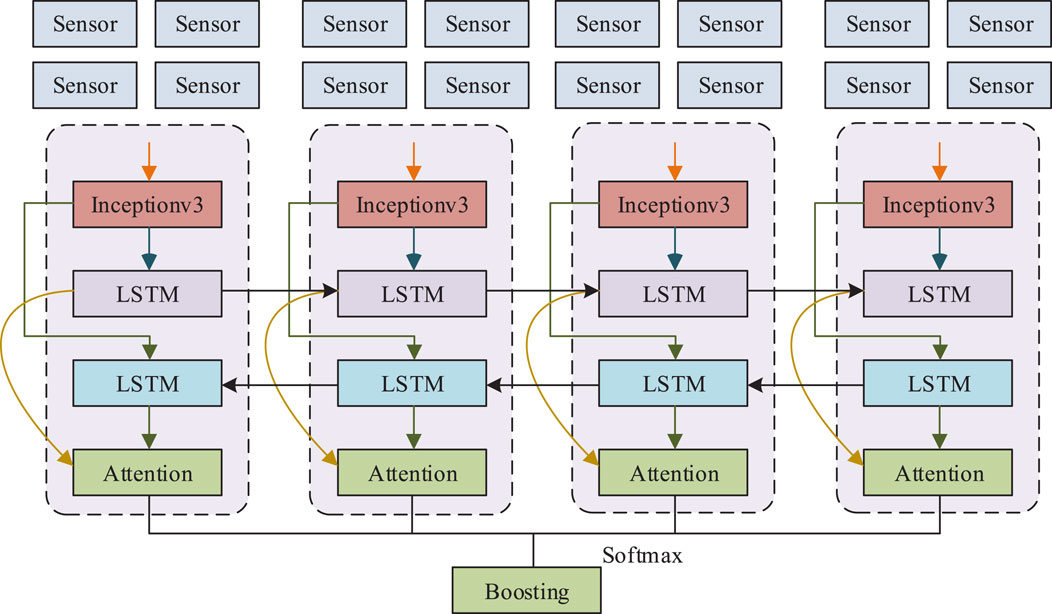
Figure 5. Schematic diagram of BLE algorithm structure.
4 Performance verification and application effect analysis of 3 algorithms
This chapter consists of two sections. The first section mainly is the performance verification and comparative experiments of the BLE algorithm. The second section mainly focuses on conducting horizontal comparison and simulation experiments on the proposed ACC system.
4.1 BLE algorithm performance verification
To fully evaluate the superiority of BLE algorithm in the field of driving intention recognition, the experiment introduces the Graph LSTM algorithm proposed in reference (Zhang et al., 2020), LS, Bidirectional LSTM algorithm proposed in reference (Varghese et al., 2020), and Stacking LSTM algorithm for horizontal comparison with BLE algorithm. Table 1 shows the experimental results.
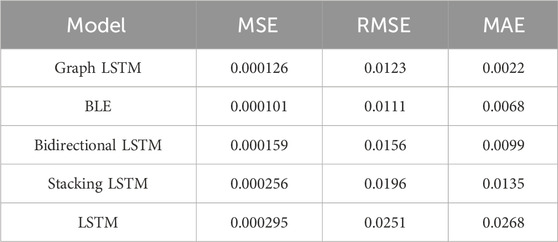
Table 1. Training parameters of the models.
In Table 1, the Graph LSTM algorithm shows relatively good performance in three metrics: MSE, RMSE, and MAE, but it is not optimal compared to other algorithms. The BLE algorithm achieves the best performance in MSE and RMSE metrics, indicating that it has lower errors in predicting driving intentions. Compared to Graph LSTM, Bidirectional LSTM performs slightly worse in MSE, RMSE, and MAE metrics. Among all algorithms, Stacking LSTM performs relatively poorly on three metrics: MSE, RMSE, and MAE. In Figure 6, the experiment also records the changes in accuracy and loss values of five algorithms during the training process.
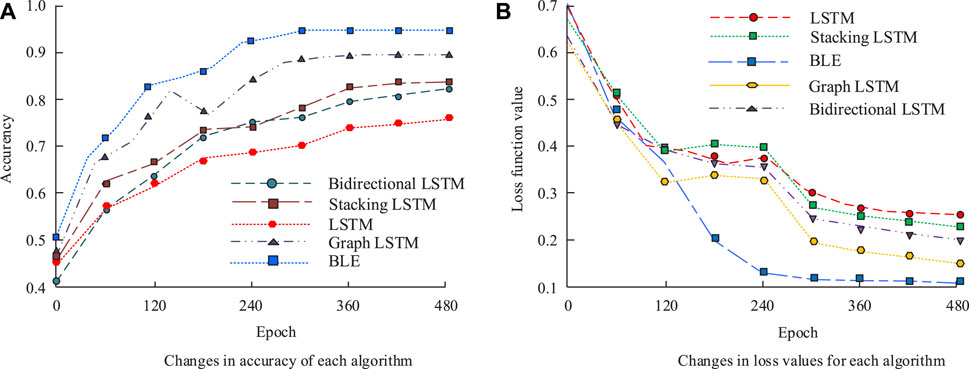
Figure 6. Changes in accuracy and loss values of each algorithm (A) Changes in accuracy of each algorithm (B) Changes in loss values for each algorithm.
In Figure 6A, the BLE algorithm proposed in this study demonstrates excellent performance among five different algorithms. After 250 iterations, its accuracy gradually stabilizes and ultimately reaches a high level of 95.6%. In contrast, the accuracy performance of Graph LSTM, Bidirectional LSTM, Stacking LSTM, and LSTM algorithms is slightly inferior, converging to 90.4%, 80.3%, 80.4%, and 76.6%, respectively. In Figure 6B, the BLE algorithm performs equally well in terms of loss values. After 270 iterations, its loss value gradually decreased and steadily converges to a low level of 0.11. Meanwhile, the loss values of Graph LSTM, Bidirectional LSTM, Stacking LSTM, and LSTM converge to relatively high values of 0.15, 0.25, 0.26, and 0.27, respectively. To eliminate the influence of dataset selection on the experiment, the NGSIM dataset and the Advanced Driving Simulation Dataset (HighD) are also used for 500 iterations to verify the accuracy of the model by comparing the dataset and the identified labels with the model prediction labels. The experimental results are shown in Figure 7.
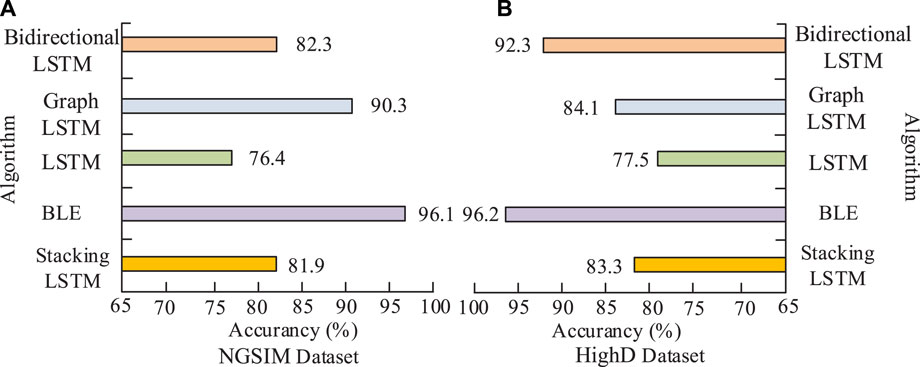
Figure 7. Accuracy performance of various algorithms in different datasets (A) NGSIM Dataset (B) HighD Dataset.
In the testing of the NGSIM data set in Figure 7A, the BLE algorithm stands out with a high accuracy of 96.1%, significantly outperforming the other four algorithms. In contrast, the accuracy of Graph LSTM, Bidirectional LSTM, Stacking LSTM, and LSTM converge to 90.3%, 82.3%, 81.9%, and 76.4%, respectively. Although they also perform well, they are slightly inferior in comparison. In Figure 7B, the BLE algorithm also demonstrates its powerful performance in the evaluation of the HighD data set, leading again with an accuracy of 96.2%. High accuracy means that the system can more accurately predict driving intentions, thus providing more accurate and safer control instructions for the adaptive cruise control system, which will greatly improve the system’s response capability in complex driving environments and reduce the possibility of misjudgment and error. Secondly, high accuracy will also enhance the users’ trust in the system. Graph LSTM, Bidirectional LSTM, Stacking LSTM, and LSTM have also achieved certain results, with accuracy rates of 84.1%, 92.3%, 83.3%, and 77.5%, respectively.
4.2 ACC system simulation experiment and comparative analysis
In the simulation experiment of comparing the SOC values of power batteries, the characteristics of the battery and power train, as well as the physical properties of the vehicle, are defined. The choice of driving cycle is a standardized test cycle, such as NEDC, FTP-75, or WLTP. The parameters of the control strategy, including acceleration, speed, shift logic, and energy management, need to be set to ensure comparability. The initial SOC and charging and discharging limits of the battery should be in line with actual operation. The experiment introduces the Nonlinear Model Predictive Control algorithm (NMPC) proposed in reference (Rathai et al., 2019) and the stochastic MPC scheme proposed in reference (Tran et al., 2020) as a comparison. Professional simulation software Simulink is used to simulate vehicle dynamics and battery response, and data on SOC changes under different strategies is collected. The experimental results are shown in Figure 8.

Figure 8. SOC variation data under different strategies.
In Figure 8, under the NMPC control strategy, the SOC value of the power battery is maintained at a high level (about 0.8), which is mainly due to the excess energy caused by the range extender charging. Under the BLE optimal control strategy, the SOC change curve follows closely the optimal SOC curve derived from the stochastic MPC algorithm. In the power consumption phase (CD mode), when the speed is low at the beginning (0–800 s), the SOC change curves of the three control strategies are basically the same. In the range of 800–3,000 s, at 3,000–4,500 s under BLE control, the battery SOC drops below 0.3, the battery cost rises, and the SOC decline rate slows down compared with the stochastic MPC algorithm. During the charge maintenance phase (CS mode), the power battery cost is converted to equivalent fuel consumption, at which point the SOC is maintained with the help of a range extender. In addition, the experiment also simulates the 60 km energy consumption of the three algorithms respectively under the same conditions, as shown in Figure 9.
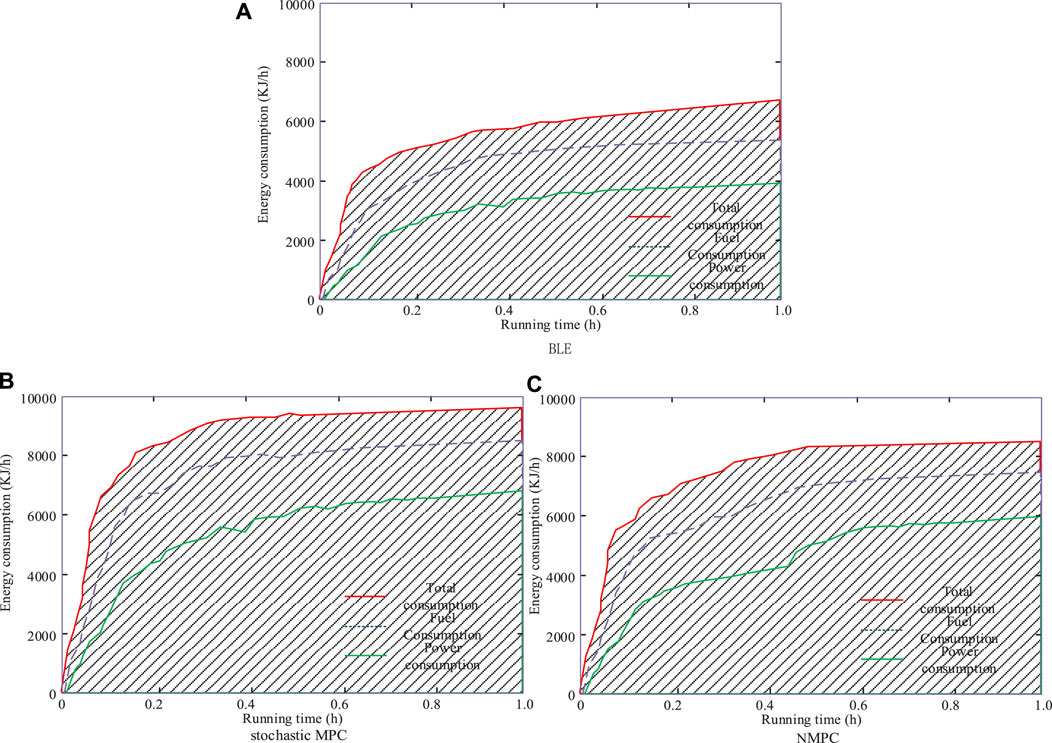
Figure 9. Energy consumption of three algorithms at 60 km under the same conditions (A) stochastic MPC (B) NMPC.
Figure 9 shows the power consumption characteristics of the three different models under the uniform acceleration curve. In the BLE model, power consumption slowly rises as it transitions from the acceleration phase to the steady state, eventually reaching a total power consumption of 6, 130 kJ per hour. In contrast, Figure 9B shows the same power consumption growth trend in the NMPC model, but the total power consumption is significantly higher than that in the BLE model, at 9,630 kJ/h. In the stochastic MPC model shown in Figure 9C, power consumption also rises slowly, with the total power consumption between the first two at 8,130 kJ per hour. Among the models studied, BLE model is the most economical in power utilization, while NMPC model consumes more power. To explore the impact of NMPC system on vehicle comfort, the Random Reinforcement Learning Algorithm (JReLM) proposed by reference (Purushothaman and Vijaya, 2020) is introduced as a comparison. Using two vehicles, one NMPC system, and the other vehicle, the JReLM system is used as the control group. Both cars travel 2.5 km simultaneously. The acceleration and turbulence during driving are recorded, and the experimental results are shown in Figure 10.
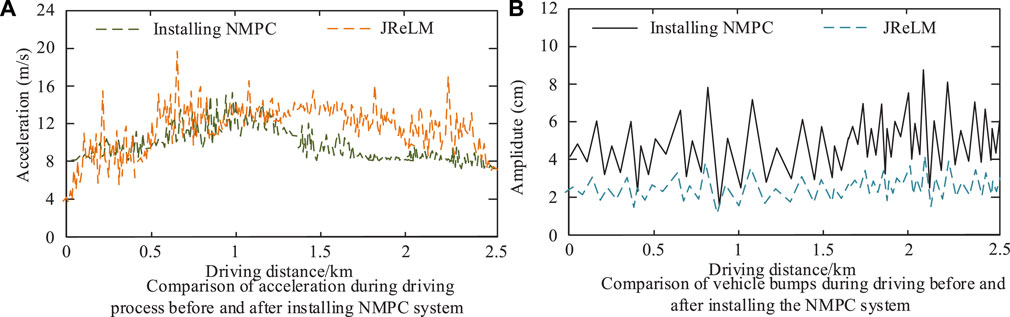
Figure 10. Acceleration and turbulence during NMPC system (A) Comparison of acceleration during driving process before and after ins talling NMPC system (B) Comparison of vehicIe bumps during driving before and after installing the NMPC system.
In Figure 10A, vehicles without NMPC system exhibit extremely unstable changes in acceleration during driving, with significant gradient fluctuations. This instability can bring passengers a very uncomfortable experience, such as moving forward in constant bumps and shaking, which can easily make people feel motion sickness and discomfort. After installing the NMPC system, the acceleration curve of the vehicle becomes significantly smoother, which means that the impact and shaking felt by passengers inside the car will be greatly reduced, and the riding experience will undoubtedly be significantly improved. In Figure 10B, vehicles without NMPC system experience very severe bumps during driving, even reaching a maximum bump height of 8 cm. However, after installing the NMPC system, the vehicle’s jolt amplitude is significantly reduced and controlled within 4 cm. This is undoubtedly a huge improvement, as it will greatly enhance passenger comfort and driving safety. In the ablation experiment, the study evaluates the effect of each function on the overall performance of the system by gradually removing the different functions of the ACC system. First, the performance of the full system is tested, including driving style fitness, overtaking safety, energy efficiency, and system response time. Then, the behavioral adaptation function, overtaking response function, and energy optimization function are removed, respectively, and tested again by them. The experimental results are shown in Table 2.
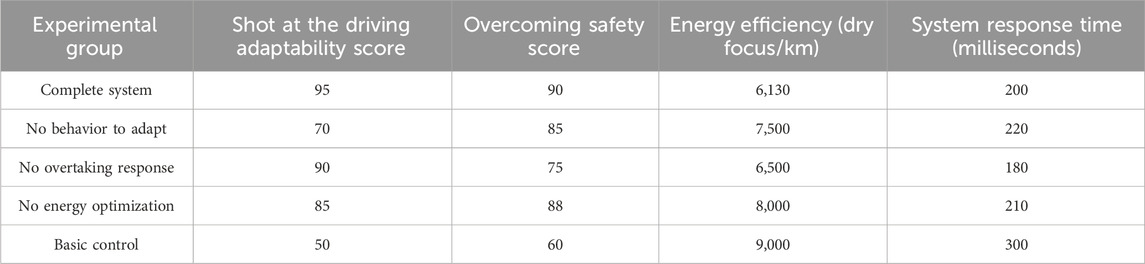
Table 2. Results of ablation experiments of the ACC system model.
According to the above table data, it can be seen that under the complete system configuration, the ACC system performs the best. The adaptability of driving style, overtaking safety, energy efficiency, and system response time are all superior to other experimental groups. Among them, the driving style adaptation score is the highest, indicating that the system can adapt well to the driving habits of different drivers and provide a personalized driving experience. Meanwhile, the overtaking safety score is also high, indicating that the system can provide sufficient safety protection during the overtaking process. In terms of energy efficiency, the complete system group has the lowest energy consumption, indicating that the system has effectively reduced energy consumption and increased driving range by optimizing energy management. In addition, the system response time is also relatively short, indicating that the system can quickly respond to the driver’s operations and provide a smooth driving experience. In contrast, other experimental groups have some shortcomings in various performance indicators. For example, systems without behavioral adaptation function score lower in driving style adaptation, while systems without overtaking response function score lower in overtaking safety. Therefore, a complete system configuration can better meet the needs of drivers and provide a safer and more comfortable driving experience. Nine experts in the field of automotive control are recruited to assign the economy, safety and comfort of the NMPC and BLE systems, using the percentage system as the evaluation system, as shown in Figure 11.
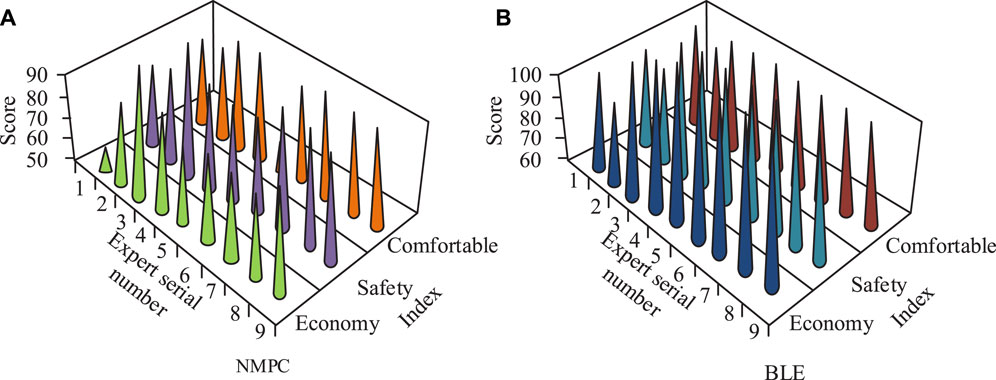
Figure 11. Expert evaluation statistics on various aspects of two systems (A) NMPC (B) BLE.
In Figure 11A, the average scores of the experts on the economy, safety and comfort of the NMPC system are 73, 82 and 85, respectively, which reflect the positive evaluation of the NMPC system for its combined performance in terms of cost control, safety and ride comfort. In Figure 11B, the average scores of experts on economy, safety and comfort of BLE system are 95, 96 and 98, respectively. These scores clearly indicate that BLE systems are highly recognized and praised by experts for their superior performance in saving costs, ensuring safe use and enhancing the ride experience in all dimensions.
5 Conclusion
To solve the problem that the traditional adaptive cruise control system neglected the influence of the driver’s intention and driving behavior on the system performance, a new ACC control system based on BLE was designed. In the test of NGSIM data set, BLE algorithm stood out with its high accuracy of 96.1%, which was significantly better than the other four algorithms. In contrast, the accuracy rates of Graph LSTM, Bidirectional LSTM, Stacking LSTM and LSTM converged to 90.3%, 82.3%, 81.9% and 76.4%, respectively. In the evaluation of the HighD data set, the BLE algorithm also demonstrated its strong performance, once again leading the field with 96.2% accuracy. The algorithms Graph LSTM, Bidirectional LSTM, Stacking LSTM and LSTM also achieved certain effects, with the accuracy rate reaching 84.1%, 92.3%, 83.3% and 77.5%, respectively. In the simulation experiment, under the BLE optimal control strategy, the SOC change curve followed closely the optimal SOC curve derived from the stochastic MPC algorithm. In the power consumption phase (CD mode), when the speed was low at the beginning (0–800 s), the SOC change curves of the three control strategies were basically the same. In the range of 800–3,000 s, at 3,000–4,500 s under BLE control, the battery SOC dropped below 0.3, the battery cost rose, and the SOC decline rate slowed down compared with the stochastic MPC algorithm. During the charge maintenance phase (CS mode), the power battery cost was converted to equivalent fuel consumption, at which point the SOC was maintained with the help of a range extender. In summary, the EREV adaptive cruise control system had the advantages of high accuracy, effective SOC management and strong adaptability. But the computational complexity may also be relatively high. This may affect the real-time responsiveness of the system, which is also an area that needs to be improved in subsequent research.
Data availability statement
The original contributions presented in the study are included in the article/supplementary material, further inquiries can be directed to the corresponding author.
Author contributions
JZ: Conceptualization, Methodology, Project administration, Visualization, Writing–original draft, Writing–review and editing. TW: Data curation, Formal Analysis, Investigation, Supervision, Writing–review and editing.
Funding
The author(s) declare that no financial support was received for the research, authorship, and/or publication of this article.
Conflict of interest
The authors declare that the research was conducted in the absence of any commercial or financial relationships that could be construed as a potential conflict of interest.
Publisher’s note
All claims expressed in this article are solely those of the authors and do not necessarily represent those of their affiliated organizations, or those of the publisher, the editors and the reviewers. Any product that may be evaluated in this article, or claim that may be made by its manufacturer, is not guaranteed or endorsed by the publisher.
Abbreviations
EREV, Extended range electric vehicles; EV, Electric vehicles; ACC, Adaptive cruise control; MPC, Model predictive control; LSTM, Long short-term memory; BLE, Boosted Lstm ensemble; NGSIM, Next generation simulation; HighD, Advanced driving simulation dataset; SOC, State of charge; NMPC, Nonlinear model predictive control; JReLM, Randomized reinforcement learning algorithm; TMPC, Tube model predictive control; ES, Electrical steering.
References
Dinesh, S., Murugan, V. S., Harsha, Y., Karthikeyan, P., Potom, B., Gokulraj, V., et al. (2017b). Suspension kinematics and compliance simulation using carsim. Int. J. Mech. Eng. Technol. 8 (10), 936–944. doi:10.1007/978-3-030-75884-4_8
Dinesh, S., Sakthi Murugan, V., Jaganathan, R., Aarvindakshaan, S., Kumar, N. N., and Robin, J. R. (2017a). Steering and constant steer test analysis of FSAE vehicle using carsim. Int. J. Mech. Eng. Technol. 8 (10), 928–935. doi:10.1145/3343055.3359697
Groumpos, P. P. (2023). A critical historic overview of artificial intelligence: issues, challenges, opportunities, and threats. Artif. Intell. Appl. 1 (4), 197–213. doi:10.47852/bonviewaia3202689
Huang, H., Zeng, Z., Yao, D., Pei, X., and Zhang, Y. (2022). Spatial-temporal ConvLSTM for vehicle driving intention prediction. Tsinghua Sci. Technol. 27 (3), 599–609. doi:10.26599/tst.2020.9010061
Kopczyński, J., Lasocki, P., Krawczyk, A., Roszczyk, P., and Hajduga, A. (2022). Analysis of the strategies for managing extended-range electric vehicle powertrain in the urban driving cycle. Электротехника и электромеханика 1 (eng), 70–76. doi:10.20998/2074-272x.2022.1.10
Lasocki, J., Krawczyk, P., Kopczyński, A., Roszczyk, P., and Hajduga, A. (2022). Analysis of the strategies for managing extended-range electric vehicle powertrain in the urban driving cycle. Electr. Eng. Electromechanics (1), 70–76. doi:10.20998/2074-272x.2022.1.10
Li, L., Zhao, W., Xu, C., Wang, C., Chen, Q., and Dai, S. (2021). Lane-change intention inference based on RNN for autonomous driving on highways. IEEE Trans. Veh. Technol. 70 (6), 5499–5510. doi:10.1109/tvt.2021.3079263
Luan, Z., Huang, Y., Zhao, W., Zou, S., and Xu, C. (2023). A comprehensive lateral motion prediction method of surrounding vehicles integrating driver intention prediction and vehicle behavior recognition. Proc. Institution Mech. Eng. Part D J. Automob. Eng. 237 (1), 61–74. doi:10.1177/09544070221078636
Purushothaman, K., and Vijaya, C. (2020). Roth-Erev reinforcement learning approach for smart generator bidding towards long term electricity market operation using agent based dynamic modeling. Electr. Power Components Syst. 48 (3), 256–267. doi:10.1080/15325008.2020.1758840
Rathai, K. M. M., Sename, O., and Alamir, M. (2019). GPU-based parameterized NMPC scheme for control of half car vehicle with semi-active suspension system. IEEE Control Syst. Lett. 3 (3), 631–636. doi:10.1109/lcsys.2019.2915002
Rosolia, U., and Borrelli, F. (2019). Learning how to autonomously race a car: a predictive control approach. IEEE Trans. Control Syst. Technol. 28 (6), 2713–2719. doi:10.1109/tcst.2019.2948135
Sun, T., Hu, Q., Gulati, P., and Atashzar, S. F. (2021). Temporal dilation of deep LSTM for agile decoding of sEMG: application in prediction of Upper-Limb motor intention in neurorobotics. IEEE Robotics Automation Lett. 6 (4), 6212–6219. doi:10.1109/lra.2021.3091698
Sun, Y., Wang, X., Li, L., Shi, J., and An, Q. (2019). Modelling and control for economy-oriented car-following problem of hybrid electric vehicle. IET Intell. Transp. Syst. 13 (5), 825–833. doi:10.1049/iet-its.2018.5421
Tran, A. T., Muraleedharan, A., Okuda, H., and Suzuki, T. (2020). Scenario-based stochastic MPC for vehicle speed control considering the interaction with pedestrians. IFAC-PapersOnLine 53 (2), 15325–15331. doi:10.1016/j.ifacol.2020.12.2341
Varghese, A. S., Sarang, S., Yadav, V., Karotra, B., and Gandhi, N. (2020). Bidirectional LSTM joint model for intent classification and named entity recognition in natural language understanding. Adv. lntelligent Syst. Comput. 16 (1), 13–23. doi:10.3233/his-190275
Venkitaraman, A., and Venkata, S. (2023). Hybrid deep learning mechanism for charging control and management of Electric Vehicles. Eur. J. Electr. Eng. Comput. Sci. 7 (1), 38–46. doi:10.24018/ejece.2023.7.1.485
Wischnewski, A., Euler, M., Gümüs, S., and Lohmann, B. (2022). Tube model predictive control for an autonomous race car. Veh. Syst. Dyn. Int. J. Veh. Mech. Mobil. 60 (9), 3151–3173. doi:10.1080/00423114.2021.1943461
Yang, J., and Yin, Y. (2020). Novel soft smart shoes for motion intent learning of lower limbs using LSTM with a convolutional autoencoder. IEEE Sensors J. 21 (2), 1906–1917. doi:10.1109/jsen.2020.3019053
Yang, W., Tan, C., Chen, Y., Xia, H., Tang, X., Cao, Y., et al. (2023). BiRSwinT: bilinear full-scale residual swin-transformer for fine-grained driver behavior recognition. J. Frankl. Inst. 360 (2), 1166–1183. doi:10.1016/j.jfranklin.2022.12.016
Zhai, L., Wang, C., Hou, Y., and Liu, C. (2022). MPC-based integrated control of trajectory tracking and handling stability for intelligent driving vehicle driven by four hub motor. IEEE Trans. Veh. Technol. 71 (3), 2668–2680. doi:10.1109/tvt.2022.3140240
Zhang, D., Niu, L., Li, D., and Wu, W. (2023a). Research on EREV energy management strategy based on MAS networking technology. J. Xihua Univ. Nat. Sci. Ed. 42 (5), 11–18. doi:10.4271/2004-01-1105
Zhang, D. Q., Niu, L. M., Li, D. Y., and Wu, W. J. (2023b). Research on EREV energy management strategy based on MAS networking technology. J. Xihua Univ. Nat. Sci. Ed. 42 (5), 11–18. doi:10.12198/j.issn.1673-159X.4449
Keywords: LSTM, EREV, driving behavior model, cruise control, MPC
Citation: Zhang J and Wang T (2024) Design of adaptive cruise control strategy for EREV considering driving behavior. Front. Mech. Eng. 10:1408277. doi: 10.3389/fmech.2024.1408277
Received: 28 March 2024; Accepted: 23 July 2024;
Published: 16 August 2024.
Edited by:
Alpaslan Atmanli, National Defense University, TürkiyeReviewed by:
Lei Zhang, Beijing Institute of Technology, ChinaMelvin Victor De Poures, Saveetha University, India
Copyright © 2024 Zhang and Wang. This is an open-access article distributed under the terms of the Creative Commons Attribution License (CC BY). The use, distribution or reproduction in other forums is permitted, provided the original author(s) and the copyright owner(s) are credited and that the original publication in this journal is cited, in accordance with accepted academic practice. No use, distribution or reproduction is permitted which does not comply with these terms.
*Correspondence: Tao Wang, d2FuZ3RhbzA4MjlmekAxMjYuY29t