 Radharaman Tripathi1*
 Tushar A. Jadhav1
 Mahesh K. Gaikwad2
 Mithul J. Naidu3
 Aishwarya B. Gawand4
 Duran Kaya5
 Sachin Salunkhe6,7
 Robert Cep8
 Emad Abouel Nasr9
- 1Department of Mechanical Engineering Sinhgad College of Engineering, Savitribai Phule Pune University, Pune, Maharashtra, India
- 2Department of Mechanical Engineering, Jayawantrao Sawant College of Engineering, Savitribai Phule Pune University, Pune, Maharashtra, India
- 3Faculty of Mechanical Engineering, Tolani Maritime Institute Pune, Indian Maritime University, Pune, India
- 4Department of Engineering Sciences, Jayawantrao Sawant College of Engineering, Savitribai Phule Pune University, Pune, Maharashtra, India
- 5Gazi University Project Coordination and Implementation Research Center, Ankara, Türkiye
- 6Department of Biosciences, Saveetha School of Engineering, Saveetha Institute of Medical and Technical Sciences, Chennai, India
- 7Department of Mechanical Engineering, Gazi University Faculty of Engineering, Ankara, Türkiye
- 8Department of Machining, Assembly and Engineering Metrology, Faculty of Mechanical Engineering, VSB-Technical University of Ostrava, Ostrava, Czechia
- 9Department of Industrial Engineering, College of Engineering, King Saud University, Riyadh, Saudi Arabia
The piping system connected with the shipboard equipment may be subjected to excessive vibration due to harmonic base excitation produced by hydrodynamic force imposed on the propeller blades interacting with the hull and by other sources. Vibration design aspects for shipboard pipework are often ignored, which may cause catastrophic fatigue failures and, consequently, leakage and spillage in the sea environment. Without dedicated design codes, the integrity of shipboard equipment against this environment loading can be ensured by testing as per test standard MIL-STD-167-1A (2005). However, in many cases, testing is not feasible and economically viable. Hence, this study develops an FE-based vibration analysis methodology based on MIL-STD-167-1A, which can be a valuable tool to optimize the testing requirement without compromising the integrity of these piping systems. The simulated model dynamic properties are validated with experimental modal testing and Harmonic response analysis result confirm that a mitigating solution option can be verified by a FE based vibration analysis to mitigate the vibration problem.
1 Introduction
Excessive vibration in the piping system in the oil and gas and shipping industry is the biggest threat to safe and reliable operation since it can cause catastrophic fatigue failure without prior warning. Excessive vibration can pose severe issues related to safety, environment, and cost, i.e., it can cause uncontrolled leakage from piping flanges and, consequently, spillage in the seawater. The spillage of hydrocarbon liquids in the seawater can seriously threaten the sea environment and ecology. This study focuses on developing an approach for vibration analysis of piping systems connected with shipboard equipment to mitigate excessive vibration. Consequently, this will ensure environmental sustainability around the sea and nearby areas.
However, the contrary, most of the piping design codes focus mainly on static loadings like temperature and pressure. Hence, accurate analysis and subsequent calibration of appropriate vibration reduction simulation ensure the integrity and continuous operation of the plant. The vibration in piping mainly depends on three aspects, i.e., magnitude and frequency of excitation force (e.g., flow disturbance or pressure pulsation), system’s modal characteristics (natural frequency, mode shape, and damping), and fluid-structure interaction. In most cases, improper system modal characteristics are a prominent cause of the piping system’s vibration, especially when excitation and natural frequency are very close. Hence, realistic estimation of modal characteristics is vital to generate accurate results from the simulated Finite element model.
Several simulations and experimental studies have been conducted to validate the mitigation options for troubleshooting excessive vibration. Atkins Kenneth et al. (2004). Discussed the various mitigating options for controlling the vibration in piping connected with a reciprocating compressor, and they also discussed the multiple constraints to get the realistic value of modal parameters from the finite element model. Alexandre et al. (2018) discussed an F.E. analysis methodology for assessing the fatigue life of welded components based on a realistic simulated stress and Stress life (S-N) approach from British Standard BS-7608. Beauvais Romain et al. (2021) tested a piping system and established a non-intrusive acceleration measurement technique to identify the internal sound pressure level within a piping loop. Pulsation-induced vibration problems can be easily diagnosed based on this approach. Richard and Jacquelin. (2021) determined a procedure for incorporating the underlying wall pressure fluctuations in a finite element model to determine the fatigue life of a piping system. They studied the manual assessment method based on energy institute Guidelines (2008) and the experimental method to verify and validate the F.E. analysis results. Baldwin and Simmons. (1986) studied flow-induced vibration in safety relief valves (SRVs) in high-energy piping systems. They developed an analytical design procedure based on the Strouhal number, Mach number, and stub dimensions to eliminate the vibration problem in the existing system. Cicero et al. (2016) studied the effect of thermal cutting methods (oxyfuel, plasma, and laser cut technologies) on the fatigue behavior of structural steels. Then, the S-N results obtained were used to derive the corresponding BS7608 design classes. El-Borgi et al. (2021) established the F.E. model updating technique to minimize errors between the analyzed and measured responses. This model updating procedure was established iteratively by tuning the parameters associated with the assumed boundary conditions for the simulation until the computational F.E. model can replicate the system’s actual behavior. Gao and Hongquari (2020). Proposed an improved FEM approach for vibration analysis of a pipeline system subjected to multi-excitation, i.e., a pipeline subjected to both hydraulic pump pressure fluctuation and base excitation from the engine.
Haapaniemi Heikki et al. (2002) focused on the correlation between the simulated finite element model and modal testing measurement. The technique of Output-only modal analysis was established and verified to get the modal parameters of piping even when the system is in use. Jiang and Zhu. (2018) simulated a piping system model in FEA software. Based on the experimental modal testing, the simulated model was tuned to reflect the realistic boundary condition and modal properties. The simulated results comply with exploratory testing; hence, experimental modal testing can be used to calibrate the model for vibration analysis. Jiang et al. (2013). Describe an expert system for online monitoring and diagnosis of realistic vibration faults in reciprocating compressor systems with the help of facts and rules logic. Kedar Bhagwat and Gulave. (2017) proposed a method to reduce the acoustic and flow-induced vibrations in the piping system. Liu et al. (2020) developed and demonstrated an approach of vibration analysis for troubleshooting the severe vibration problem in the compressor station yard pipeline. The field vibration test verified the computer model. The best solution was based on the increasing natural frequency of the system by additional support constraints. Moon Seong-In et al. (2011) developed test specifications for components, which were applied to predict fatigue life for the unit brackets at the initial product design stage using a vibration fatigue technique.
Noh Byeongwook et al. (2006) studied the fatigue strength of load-carrying cruciform fillet welded joints for geometric or structural stress in the welded joint. The structural stress concentration factor for 1 mm below the surface was calculated by finite element analysis and compared to the basic fatigue resistance curve offered by BS7608 (2014). Martin et al. (2012) presented two methods for extracting the modal properties of the compressor yard pipeline based on experimental testing and the finite element method, respectively. The modal testing verified the simulated results. Tison and Atkins. (2001) presented various methods to mitigate vibration in reciprocating compressor piping systems. They explained the multiple limitations for getting accurate modal characteristics by computer simulation, e.g., natural frequencies. Wachel et al. (1986) conducted dynamic pressure and vibration measurements to diagnose the exact cause of vibration. Test measurement verified the mitigation solution for troubleshooting a complex vibration problem in piping connected with a reciprocating pump. Wang Qiang et al. (2016) investigated the dynamic strain measurement FBG sensors, confirming the excellent correlation with simulated results for modal parameters like natural frequencies. Fiber Bragg sensors are helpful for the health monitoring of small-bore hydraulic piping due to smaller additional mass. Adil and Alaeddin. (2010) presented a study to understand the effect of the high speed of a ship on the shipboard vibration, which can be unpleasant to passengers and crew members and additionally can cause malfunction and fatigue failure of the shipboard equipment and structures.
The current study demonstrates the methodology for vibration analysis of piping systems subjected to mechanical or base excitation. The excitation mechanism, like mechanical excitation due to connected reciprocating equipment and base excitation due to the ship, can generate a high vibration level, which can cause catastrophic fatigue failure. A dedicated design code for the shipboard piping system is not available. Hence, test standard MIL-STD-167-1 can guide the design and vibration analysis of the shipboard equipment’s pipework without a design code. A finite element model has been generated based on design parameters to generate dynamic characteristics and results. Experimental modal testing has been conducted to validate the modal properties. These modal properties can calibrate the simulated model to develop realistic results and validate the mitigation options. In this regard, the paper is organized as follows. Section 2 presents modal and harmonic response analysis of a finite element model of a piping loop system. Section 3 offers the experimental modal testing by modal hammer and FFT analyzer, which validate the piping system’s fundamental mode and corresponding natural frequency. Finally, Section 4 provides some concluding remarks regarding the finite element analysis methodology to generate accurate results and optimize the testing requirements.
2 Modal and harmonic response analysis
The piping with a vertical pipe loop is used at the ship, in the skid of reciprocating machinery or other equipment, where a loop is provided to absorb the thermal displacement or due to adjacent piping layout space constraints. In this study, an F.E. model of a piping system was generated in the ANSYS workbench based on the design parameters shown in Figure 1. This piping system consists of a vertical loop with four elbows, and the piping system material is Stainless steel. The F.E. model contains 47,719 nodes and 7,938 elements. The model’s mesh was created with sweep mesh, mostly Solid element Solid 186. The Fixed support boundary condition was kept at the start and end of the piping Loop model to simulate the stiff connection on the connected equipment.
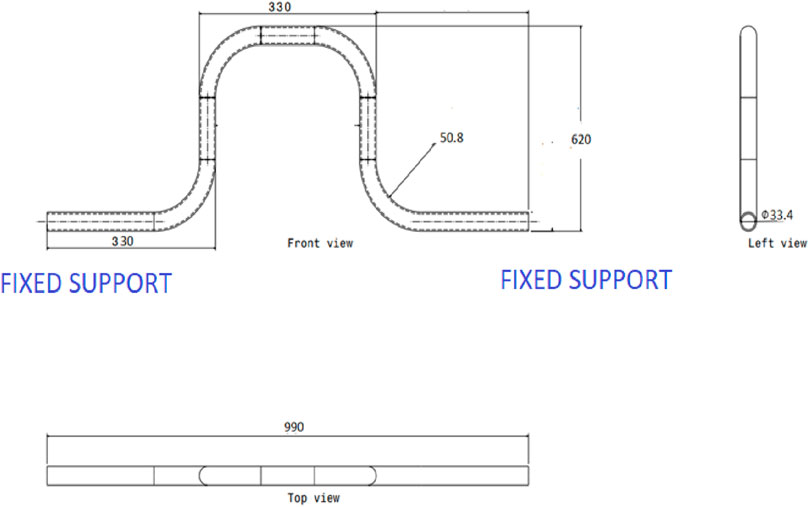
Figure 1. Geometry of piping connected with a vertical loop.
2.1 Modal analysis of original pipe structure
Modal analysis determines a mechanical structure’s vibration characteristics (mode shape, natural frequency), e.g., a piping Loop. The natural frequency and mode shapes depend on the distribution of mass and stiffness in a piping system and boundary conditions considered in an F.E. simulation. Hence, to generate accurate results, calibration of simulated results is often required by experimental modal testing.
A fixed beam can represent the geometry (shown in Figure 1) as a 4-D system if each pipe element resembles a point element in a beam. This assumption holds when a straight pipe does not deform significantly in a radial direction. It is valid for various piping installations in the plant system in which flexibility is introduced by elbow elements only. Hence, this vertical pipe loop configuration can be idealized by 4-degree freedom system, where each axis is collinear to the bisector of each elbow. The extracted natural frequencies based on F.E. modal analysis are listed in Table 1.
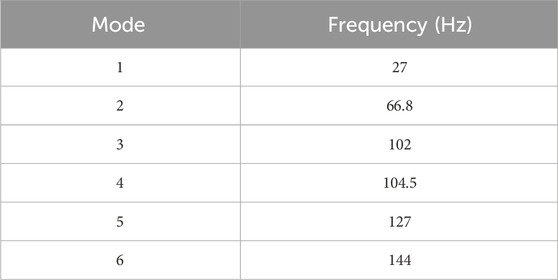
Table 1. Natural frequency of original pipe structure.
Figure 2 shows the first mode shape of the piping loop system, which indicates maximum deformation in a Lateral direction(Y) at the center of the piping loop. The second mode shape in Figure 3 represents the bending mode in the longitudinal l(Z) direction. Other modes are second-order or complex vibration modes, which maintain a separation margin of more than 50% with the excitation frequency, and significant dynamic response is not expected for these modes mentioned in section 2.2.
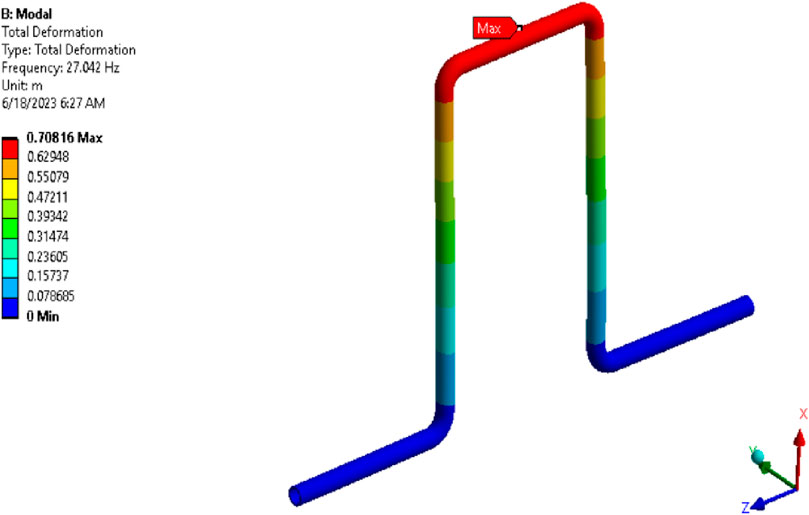
Figure 2. First mode shape; Mode 1, f1 = 27 Hz.
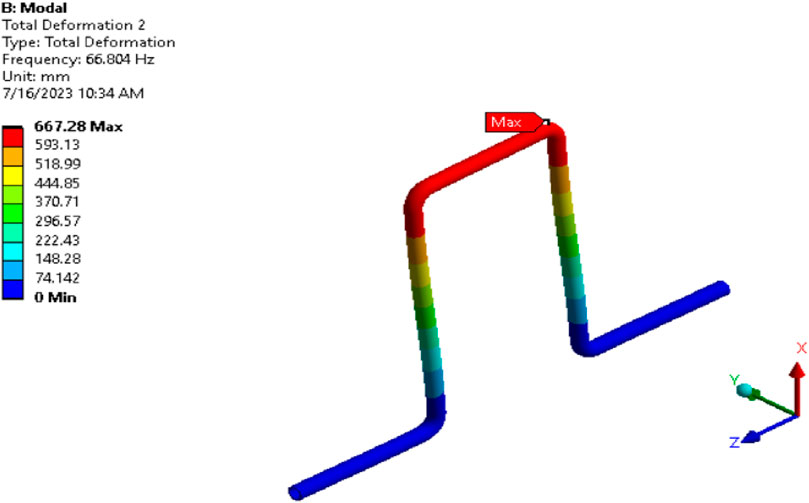
Figure 3. Second mode shape; Mode 2, f2 = 66.8 Hz.
2.2 Effect of separation margin on the dynamic response
The amplification factor represents the amplification of static response under a dynamic condition, which depends on the ratio of excitation to natural frequency and the damping factor in the system. The amplification factor for a simple dynamic system is shown in Eq. (1). It shows that the amplification factor reduces sharply with a ±20% separation margin. It can be seen in Figure 4 that for a separation margin of 40%, the amplification factor is 1.5 or less, which can go up to 20 without a separation margin for a critical damping ratio of 0.025. The amplification factor can be higher for lower damping values, i.e., for a 0.01% damping ratio, the amplification factor is 50.Amplification Factor (A.F) for Steady-state harmonic excitation
where, ω = Excitation frequency,
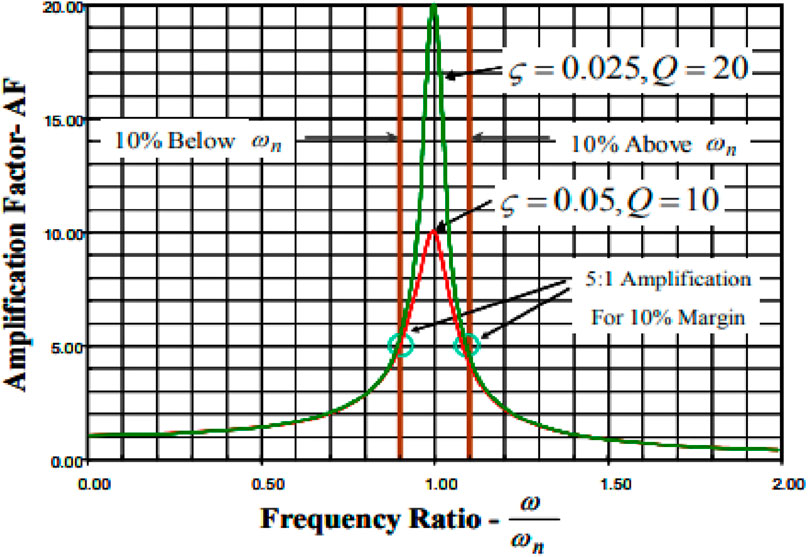
Figure 4. Effect of separation margin on amplification factor.
ωn = Natural frequency,
ξ = Critical damping ratio.
Hence, it shows that the accurate estimation of natural frequency is an essential step of dynamic analysis to derive accurate results from F.E. analysis. The sufficient separation margin between excitation and natural frequencies can maintain a dynamic response close to the static response.
2.3 Harmonic response analysis of original pipework
Modal results are linked to Harmonic analysis; a periodic excitation determines the structure’s response under a steady-state sinusoidal loading at a given frequency in harmonic response analysis. Harmonic response analysis mainly checks the excessive dynamic response due to mechanical resonance. This magnifies structural response in a lightly damped system when driven with a sinusoidal input at its natural frequencies. The paper will expose the piping system to prescribed frequency, and amplitude ranges to reveal critical response prominences or potential deficiencies.
MIL-STD-167-1A(2005) provides dynamic excitation force for shipboard equipment testing for hydrodynamic force imposed on the propeller blades interacting with the hull and by other sources. This standard provides an environment vibration amplitude sufficiently large for a selected frequency range to avoid malfunctioning shipboard equipment and connected piping systems on Naval Ships. Exploratory vibration and variable frequency tests specify the excitation frequency range and single excitation amplitudes to determine the presence of response prominence. Response prominence mainly represents a resonance or other distinct maximum in the form of transmissibility. In most cases, transmissibility greater than 1.5 is sufficient to classify a maximum as a response prominence, and for these systems, endurance testing is required. It is evident from Figure 4 that a separation margin of 40% or more can bring the transmissibility or amplification factor value to less than 1.5 and may omit the requirement of endurance testing.
MIL-STD-167-1A(2005) specifies the excitation frequency range and vibration amplitude as 4–33 Hz and 0.012 inches for exploratory vibration tests. This vibration amplitude is equal to 1.3 g acceleration at 33 Hz. Hence, on the conservative side, a 0.024-inch (0.6096 mm) excitation force in the lateral direction and excitation frequency range of 0–33 Hz has been considered for the harmonic response analysis (refer to Figure 5). This may cover more severe environmental conditions associated with ships of higher speed. The analysis result shows an amplitude of dynamic displacement and stress of 11.23 mm and 319 MPa (at 27 Hz), respectively, for a damping factor of 0.015. Displacement profile and stress contour for original pipework are shown in Figures 6, 7 respectively. It is equal to the transmissibility factor or response prominence of 18.4.
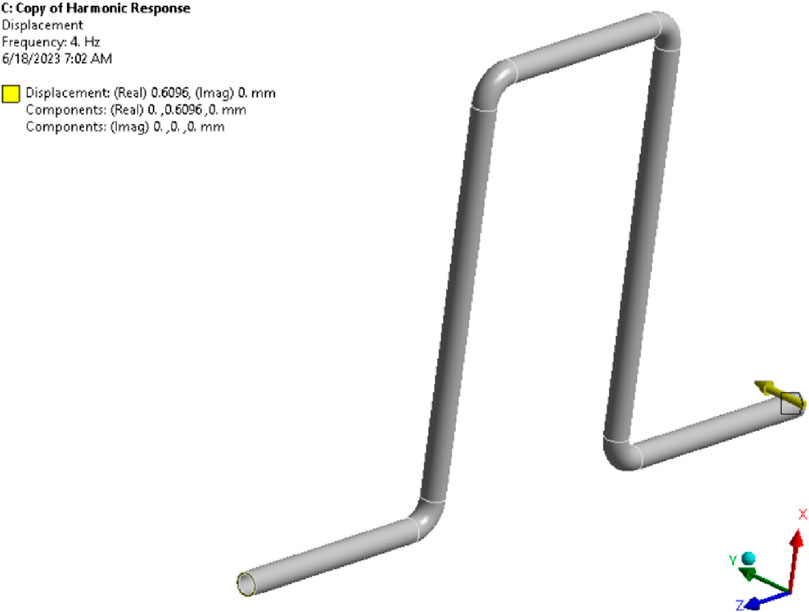
Figure 5. Excitation displacement on the F.E. model.
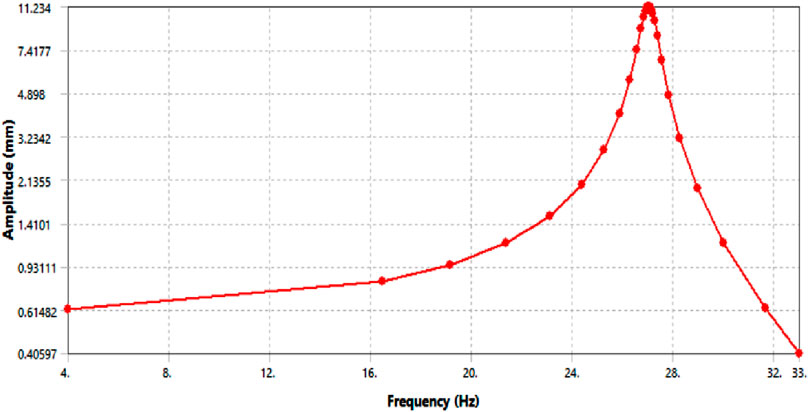
Figure 6. Output displacement results: original pipework.
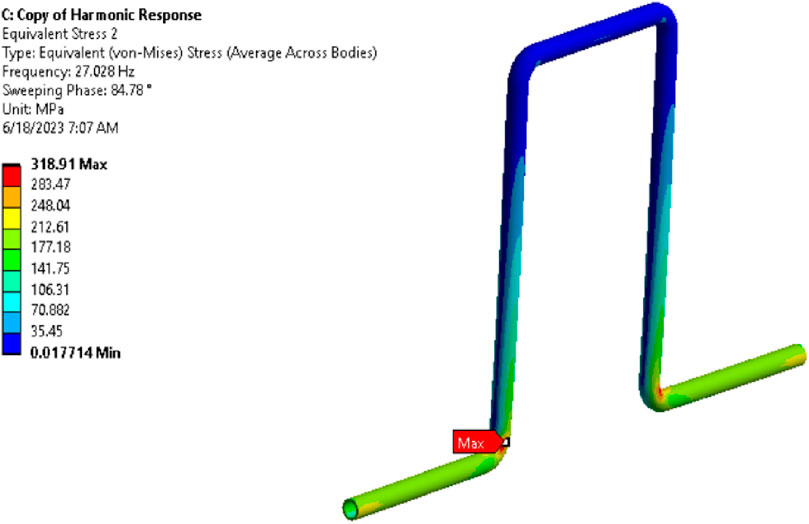
Figure 7. Output stress results: original pipework.
The BS7608[22] provides the basic design S-N curve to a particular structural detail class based on the type of stress for assessment (e.g., nominal, hot spot, or shear stress), local stress concentration, stress direction, residual stress, size and shape of discontinuity on piping, etc. The weld classes D and F2 are common in the piping system, representing the pipe without discontinuity and pipe with welded discontinuity, like shoe support and small-bore connection. The allowable endurance limit for weld class D & F2 is 80 and 35 MPa peak to peak (P-P), respectively, as per BS-7608. The standard basic design S-N curve is shown in Figure 8. It shows that with current support, the piping system will be subjected to fatigue failure, and this excessive vibration is required to be mitigated.
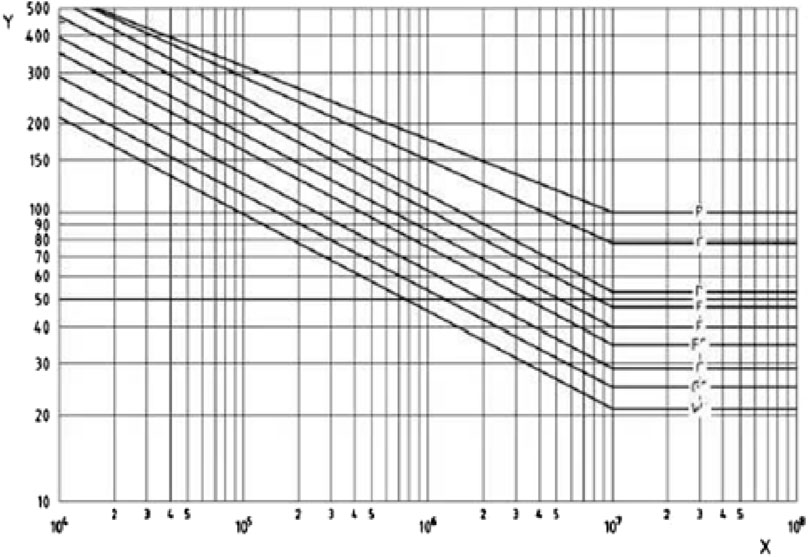
Figure 8. S-N curve for nominal stress as per BS7608[22].
This high transmissibility can be reduced by providing a restraint that increases the system’s natural frequency by shortening the free span length. The force required to restrain the pipework can be calculated based on a piping system’s inertial force (mass x acceleration) at a particular frequency. Restoring force exerted by the pipework at maximum displacement (N) =
f = frequency of vibration = 27 Hz,
m = equivalent mass of pipework = 4.86 kg,
x = amplitude of vibration = 11.23 mm
Based on the formula, the force required to restrain the pipework is 1569 N, which can be considered 3138 N with a safety factor of 2.0. Hence, 3.138e+006 N/mm restraint stiffness can be considered in the F.E. model.
2.4 Modal analysis: pipe structure with damper
The pipework with the damper is shown in Figure 9.
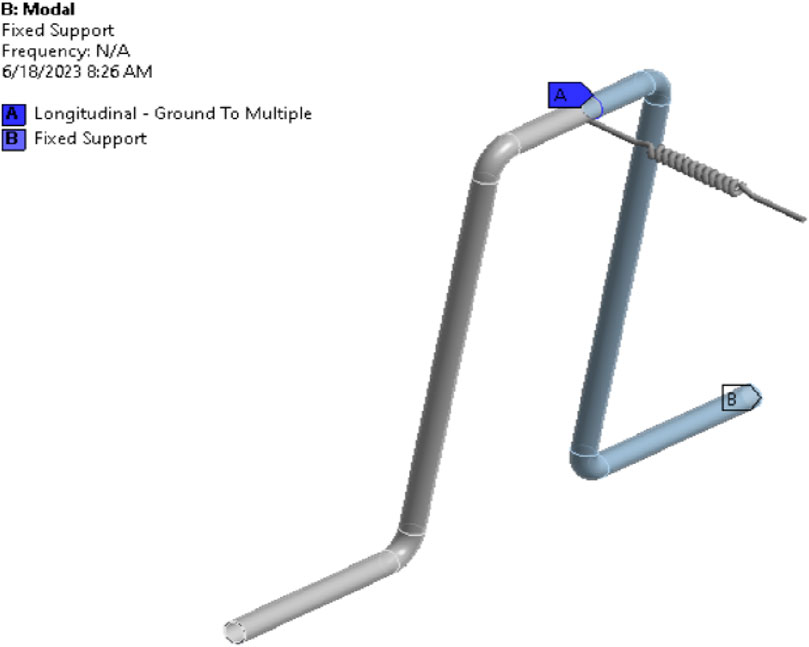
Figure 9. F.E. Model for pipework with the damper.
The extracted natural frequencies for the modified system are shown in Table 2.
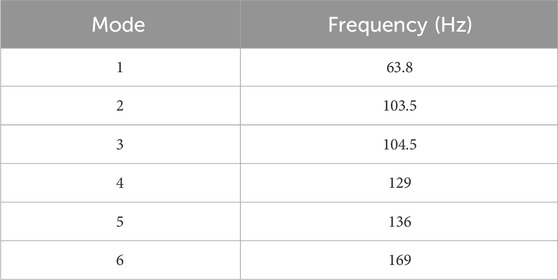
Table 2. The natural frequency of pipework with the damper.
It shows that the second mode’s natural frequency is increased significantly after providing the restraint in the lateral direction. The problematic natural frequency, which was in the ±20% of the excitation frequency, has been deleted after adding the support. In the modified system, a minimum separation margin of 90% exists between the excitation frequency range and natural frequency. The comparison of natural frequencies for the original pipework and modified pipework is shown in Figure 10; Table 3. It shows that support in the lateral direction increases the second and fourth mode natural frequency.
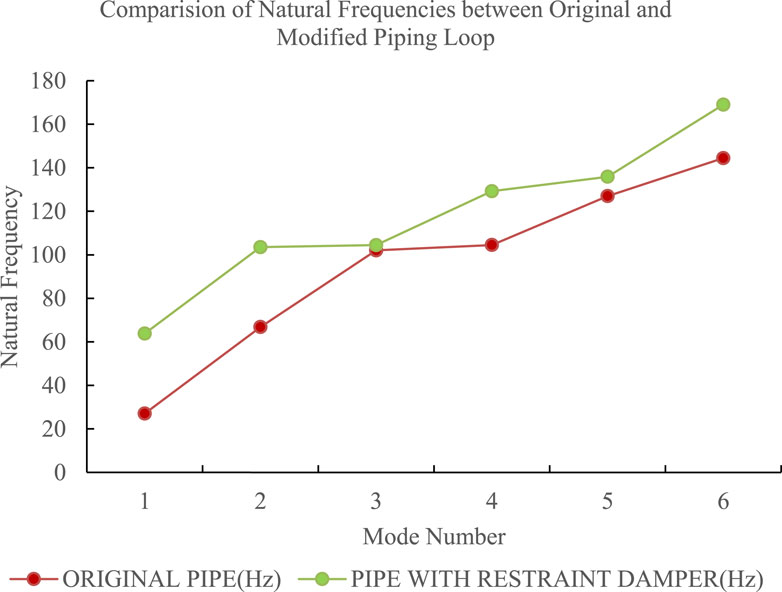
Figure 10. Comparison of natural frequencies.
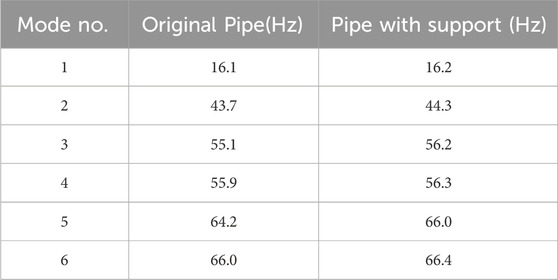
Table 3. Comparison of natural frequency original vs. modified system.
2.5 Harmonic analysis: pipe structure with support
The harmonic analysis results show a significant reduction in dynamic response. The system’s displacement and stress amplitudes are 0.368 mm and 9.25 mm at 33 Hz, respectively. Displacement profile and stress contour for modified pipework are shown in Figures 11, 12 respectively.
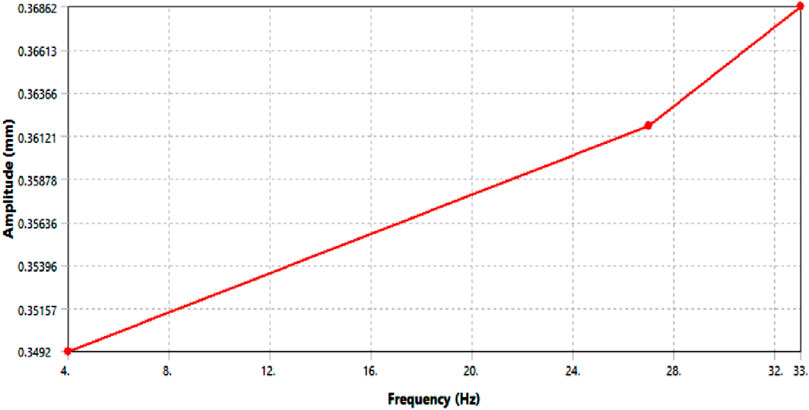
Figure 11. Output displacement: modified pipework.
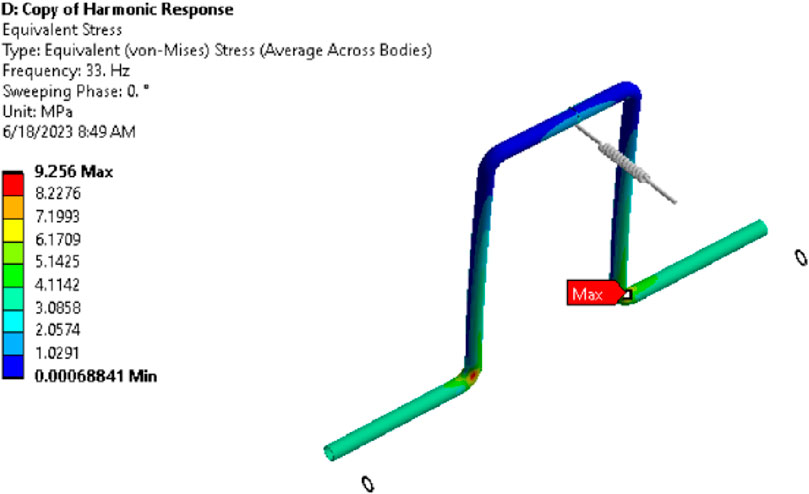
Figure 12. Output stress results: modified pipework.
The dynamic amplification factor or response prominence for this displacement is below 1, which omits the requirement of endurance testing. The response has been reduced due to the increased separation margin between forcing and natural frequency. The allowable endurance limit for weld class D & F2 is 80 and 35 MPa P-P, respectively, as per BS-7608. It shows that with additional support, the piping system will not fail due to fluctuating vibration loading.
3 Experimental testing of piping loop
Experimental work is carried out on the 3D vertical piping Loop sample with the help of a Modal hammer and FFT analyzer. The test has been performed in the laboratory to extract the modal properties (natural frequencies, mode shape) to verify simulated modal analysis results for extracted mechanical-natural frequency and corresponding modes.
For the experiment, one uni-directional accelerometer and modal hammer with an 8-channel data acquisition system with Dewesoft software (2022) were used to measure the frequency response function. The experimental modal testing setup and subparts are shown in Figure 13.
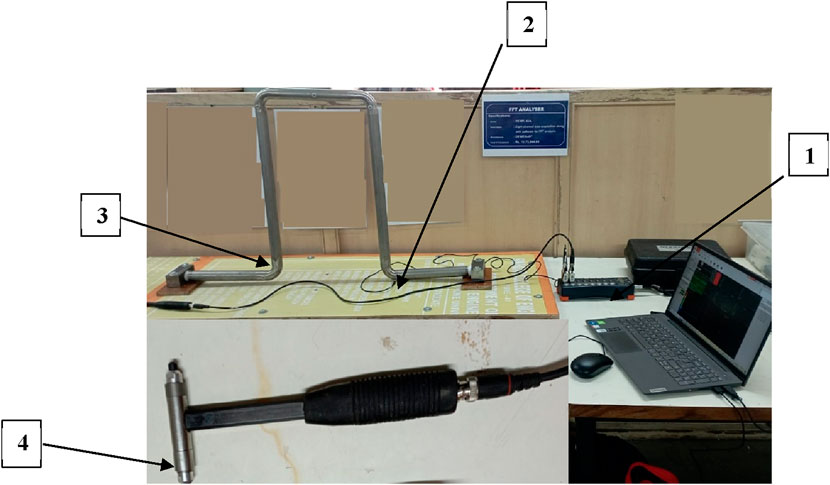
Figure 13. Experimental modal testing: modal hammer and setup.
1. Data Acquisition System; 2. Accelerometer; 3. Piping Loop Sample 4. Impact Hammer.
An instrumented impact hammer excites the pipe structure to extract the modes. Impact location was selected by first assessing the pipework layout and judging lower-order modes expected deflected shape. The results from the F.E. analysis were also added to the selection of impact locations. The frequency response function is used to identify detected modal/natural frequencies. An ideal modal frequency is indicated by the following.
• A peak in the FRF magnitude And
• an FRF phase change range of 90–180°
• Coherence close to one
The plot of the modal testing and subsequent analysis is shown in Figure 14, which shows an indication of a first modal frequency at 25 Hz. The Nyquist plot also indicates the presence of a mode at a particular frequency; points fitted on the circle indicate a well-defined mode.
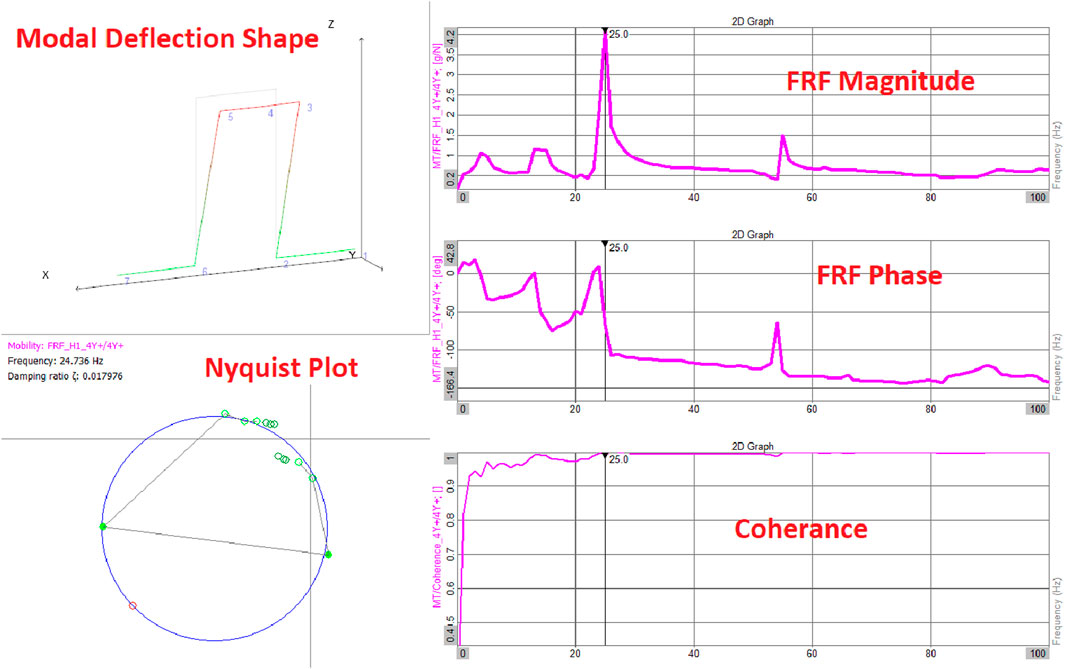
Figure 14. Experimental modal testing: modal properties.
4 Conclusion
➢ The study demonstrates the methodology for doing dynamic analysis of piping systems on ships, which may be subject to excessive vibration due to harmonic base excitation produced by hydrodynamic force imposed on the propeller blades interacting with the hull and by other sources. Without proper design code, this methodology is derived with the help of testing standard MIL-STD-167-1A.
➢ This analysis can also help optimize the testing requirement of MIL-STD-167-1A by calculating and optimizing the response prominence by finite element analysis. The dynamic simulation shows endurance testing is not required when the separation margin is more than 40% between the natural and excitation frequency since response prominence reduces below 1.5. In this way, testing is required for that piping system only where a separation margin of 40% can not be maintained between excitation frequency and natural frequency. This can help to avoid the testing of piping systems for which either testing is not feasible or not economically viable.
➢ Modal properties and dynamic response due to mechanical excitation or base excitation of the ship hull can be calculated by F.E. analysis. It shows that the dynamic response increases drastically with low damping at resonance, and the amplification factor is approximately 18 for a critical damping ratio of 0.015%. Additional support can reduce this amplification factor, and the mitigating option can be validated by F.E. analysis, hence optimizing the testing requirement.
➢ The fundamental natural frequency of the system is 27 Hz based on F.E. analysis, while it is 25 Hz based on experimental modal testing. This 8% error may be omitted by tweaking the boundary condition.
➢ The demonstrated analysis technique can be useful for mitigating the vibration problem in existing piping systems due to mechanical excitation (due to reciprocating equipment), or base excitation (base excitation due to ship hull structure), and it can also be utilized for the design of piping system against these vibration loadings. Hence, this technique can ensure environmental sustainability against catastrophic vibration events without a dedicated design code or methodology.
Data availability statement
The original contributions presented in the study are included in the article/Supplementary Material, further inquiries can be directed to the corresponding author.
Author contributions
RT: Conceptualization, Data curation, Formal Analysis, Funding acquisition, Investigation, Methodology, Project administration, Resources, Software, Supervision, Validation, Visualization, Writing–original draft, Writing–review and editing. TJ: Conceptualization, Data curation, Formal Analysis, Funding acquisition, Investigation, Methodology, Project administration, Resources, Software, Supervision, Validation, Visualization, Writing–original draft, Writing–review and editing. MG: Conceptualization, Data curation, Formal Analysis, Funding acquisition, Investigation, Methodology, Project administration, Resources, Software, Supervision, Validation, Visualization, Writing–original draft, Writing–review and editing. MN: Conceptualization, Data curation, Formal Analysis, Funding acquisition, Investigation, Methodology, Project administration, Resources, Software, Supervision, Validation, Visualization, Writing–original draft, Writing–review and editing. AG: Conceptualization, Data curation, Formal Analysis, Funding acquisition, Investigation, Methodology, Project administration, Resources, Software, Supervision, Validation, Visualization, Writing–original draft, Writing–review and editing. DK: Funding acquisition, Project administration, Resources, Software, Visualization, Writing–review and editing. SS: Conceptualization, Data curation, Funding acquisition, Project administration, Writing–review & editing. RC: Conceptualization, Data curation, Formal Analysis, Funding acquisition, Investigation, Methodology, Project administration, Resources, Software, Supervision, Validation, Visualization, Writing–original draft. EA: Conceptualization, Data curation, Formal Analysis, Funding acquisition, Investigation, Methodology, Project administration, Resources, Software, Supervision, Validation, Visualization, Writing–original draft, Writing–review and editing.
Funding
The author(s) declare that financial support was received for the research, authorship, and/or publication of this article. The authors thank King Saud University for funding this work through the Researchers Supporting Project number (RSP2024R164), King Saud University, Riyadh, Saudi Arabia. This article was co-funded by the European Union under the REFRESH – Research Excellence For Region Sustainability and High-tech Industries project number CZ.10.03.01/00/22_003/0000048 via the Operational Programme Just Transition and has been done in connection with project Students Grant Competition SP2024/087 “Specific Research of Sustainable Manufacturing Technologies” financed by the Ministry of Education, Youth and Sports and Faculty of Mechanical Engineering VŠB-TUO.
Conflict of interest
The authors declare that the research was conducted in the absence of any commercial or financial relationships that could be construed as a potential conflict of interest.
Publisher’s note
All claims expressed in this article are solely those of the authors and do not necessarily represent those of their affiliated organizations, or those of the publisher, the editors and the reviewers. Any product that may be evaluated in this article, or claim that may be made by its manufacturer, is not guaranteed or endorsed by the publisher.
References
Adil, Y., and Alaeddin, A. (2010). “Analysis of free and forced ship vibrations using finite element method,” in Proceedings of the ASME 2010 10th Biennial Conference on Engineering Systems Design and Analysis, Istanbul, Turkey, July 12-14, 2010.
Alexandre, S. F., Camarão Arnaldo, F., Fernandes, A. de O., Bezerra, M. A., Argentino Marcos, A., and Ripoli, R. R. (2018). “A finite element approach for fatigue analysis of welded components,” in SAE Brazil- International Conference on Fatigue, 2001-01-4077.
Atkins Kenneth, E., Pyle Alan, S., and Tison, J. D. (2004). “Understanding the pulsation & vibration control concepts in the new API fifth edition,” in presented at the 2004 Gas Machinery Conference, New Mexico.
Baldwin, R. M., and Simmons, H. R. (1986). Flow-induced vibration in safety relief valves. J. Press. Vessel Technol. (ASME) 108/267, 267–272. doi:10.1115/1.3264785
BS7608 (2014) Guide to fatigue design and assessment of steel products. London: BSI Standard Publication.
Byeongwook, N., Jungil, S., and Sungin, B. (2006). Fatigue strength evaluation of the load-carrying cruciform fillet welded joints using hotspot stress. Key Eng. Mater. Vols 324-325, 1281–1284. doi:10.4028/scientific.net/kem.324-325.1281
Cicero, S., García, T., Álvarez, J. A., Martín-Meizoso, A., Bannister, A., and Klimpel, A. (2016). Definition of BS7608 fatigue classes for structural steels with thermally cut edges. J. Constr. Steel Res. 120, 221–231. doi:10.1016/j.jcsr.2016.02.004
Dewesoft-software (2022). Dewesoft-software. Available at: https://training.dewesoft.com/online/course/modal-testing-frf.
El-Borgi, S., Alrumaihi, A., Rajendran, P., Yazbeck, R., Fernandes, R., Boyd, J. G., et al. (2021). Model updating of a scaled piping system and vibration attenuation via locally resonant bandgap formation. Int. J. Mech. Sci. 194, 106211. doi:10.1016/j.ijmecsci.2020.106211
Gao, P., Hongquan, Qu, Zhang, Y., Yu, T., and Zhai, J. (2020). Experimental and numerical vibration analysis of hydraulic pipeline system under multi excitations. Hindawi-Shock Vib. 2020, 1–13. article id 3598374. doi:10.1155/2020/3598374
Guideline, E. I. (2008). Guidelines for the avoidance of vibration induced fatigue failure in process pipework. Energy Inst.
Heikki, H., Pekka, L., Pekka, N., Jaakko, R., and Arja, S. (2002) Correlation analysis of modal analysis results from a pipeline, Joint Finnish Industry Group.
Jiang, Yu, and Zhu, L. (2018). Modal analysis of liquid-filled pipeline under fluid-structure interaction by simulation and experiment methods. Vibro Eng. Procedia 21, 42–47. doi:10.21595/vp.2018.20307
Jiang, Z., Zhang, J., jin, M., and bo, ma (2013). An expert system based on multi-source signal integration for reciprocating compressor. WSEAS Trans. Syst. 12 (5).
Kedar Bhagwat, B., and Gulave, J. S. (2017). Acoustically induced vibration (AIV) & flow induced vibration (FIV) analysis for the high-pressure reducing systems using energy institute Guidelines. J. Res. 02 (11).
Liu, E., Wang, X., Zhao, W., Su, Z., and Chen, Q. (2020). Analysis and research on pipeline vibration of a natural gas compressor station and vibration reduction measures. Am. Chem. Soc. 35, 479–492. doi:10.1021/acs.energyfuels.0c03663
Martin, S., František, T., Martin, H., and Matúš, K. (2012). Methodology for experimental analysis of pipeline system vibration. Procedia Eng. 48, 613–620. doi:10.1016/j.proeng.2012.09.561
MIL-STD-167-1A (2005) Mechanical vibrations of shipboard equipment (type I – environmental and type II – internally excited).
Qiang, W., Jun, H., Liu, Q., and Zhou, Z. (2016). Dynamic strain measurement of hydraulic system pipeline using fibre Bragg grating sensors. Adv. Mech. Eng. 8 (4), 1–8.
Richard, B., and Jacqueline, B. (2021). Flow-induced vibrations of oil and gas piping systems: wall pressure fluctuations and fatigue life assessment. West Indian J. Eng. 43, 54–68.
Romain, B., Adrien, P., François, G., Veronique, F., Guillaume, V., and Gilbert, J. (2021). Inverse identification of the acoustic pressure inside a U-shaped pipe line based on acceleration measurements. Mech. Syst. Signal Process. 160 (2021), 107831. doi:10.1016/j.ymssp.2021.107831
Seong-In, M., Cho, Je, and David, Y. (2011). Fatigue life evaluation of mechanical components using vibration fatigue analysis technique. J. Mech. Sci. Technol. 25 (3), 631–637. doi:10.1007/s12206-011-0124-6
Tison, J. D., and Atkins, K. E. (2001). “The new fifth edition of API 618 for reciprocating compressor- which pulsation and vibration control philosophy should you use?,” in Proceedings of the 30th Texas A&M Turbomachinery Symposium, Houston, TX, 183–195.
Keywords: vibration, shipboard equipment, piping, mechanical resonance, modal, harmonic analysis
Citation: Tripathi R, Jadhav TA, Gaikwad MK, Naidu MJ, Gawand AB, Kaya D, Salunkhe S, Cep R and Abouel Nasr E (2024) Vibration analysis of piping connected with shipboard equipment. Front. Mech. Eng 10:1396170. doi: 10.3389/fmech.2024.1396170
Received: 05 March 2024; Accepted: 22 April 2024;
Published: 15 May 2024.
Edited by:
Govind Vashishtha, Wrocław University of Science and Technology, PolandReviewed by:
Maan Singh Rathore, Indian Institute of Technology Roorkee, IndiaSumika Chauhan, National Institute of Technology Delhi, India
Copyright © 2024 Tripathi, Jadhav, Gaikwad, Naidu, Gawand, Kaya, Salunkhe, Cep and Abouel Nasr. This is an open-access article distributed under the terms of the Creative Commons Attribution License (CC BY). The use, distribution or reproduction in other forums is permitted, provided the original author(s) and the copyright owner(s) are credited and that the original publication in this journal is cited, in accordance with accepted academic practice. No use, distribution or reproduction is permitted which does not comply with these terms.
*Correspondence: Radharaman Tripathi, cmFtYW4yNDYwMThAZ21haWwuY29t