 Obidah Alawneh1†
 Basaam Rassas
 Xianzhi Zhong
 Reza Faieghi
95% of researchers rate our articles as excellent or good
Learn more about the work of our research integrity team to safeguard the quality of each article we publish.
Find out more
ORIGINAL RESEARCH article
Front. Mech. Eng. , 04 April 2024
Sec. Biomechanical Engineering
Volume 10 - 2024 | https://doi.org/10.3389/fmech.2024.1373545
Aircraft seats play a key role in the competition between aircraft companies seeking to differentiate themselves in terms of passengers’ inflight experience. The seat design process relies on computational and experimental methods based on subjective measures, such as comfort rating questionnaires, and objective comfort indicators of seat-occupant interaction, such as contact pressure distribution and muscle activation. Previous studies around muscle activity for seating comfort assessment have primarily focused on more active scenarios or active systems. As such, there are limited studies about the role of muscle force in normal and relaxed sitting conditions, common in aircraft settings. This paper explores the relationship between activities of the neck muscles, sternocleidomastoid, and upper trapezius, measured from human participants seated sedentarily on conventional business aircraft seats and their perceived comfort with different backrest inclinations. The results show, for normal seating without neck pillow, no significant association is found between the backrest inclination and the neck’s comfort or muscle activation. For general seating across different backrest inclinations, a positive medium correlation between muscle activation and comfort is found in upper trapezius (R = 0.5332, p = 0.0187). This work serves as a pilot study of this new approach of comfort evaluation using muscle feedback in seat designing processes and highlights the posterior’s effect to seating experience in the neck region.
Sitting comfort has a direct relationship with passengers’ level of satisfaction. Comfortable seat design receives a wide attention in various industrial sectors especially in transportation. Design for comfort continues to remain a challenging task because comfort is perceived as a subjective parameter whose relationship with objective parameters needs to be further explored. Comfort and discomfort are influenced by many factors, including service (Vink and Hallbeck, 2012), psychological factors (Ahmadpour et al., 2014), and angles of the joints (i.e., seating posture) (Apostolico et al., 2014).
Despite a large body of research on seating comfort, there is little understanding of how comfort can be quantified as a function of measurable parameters, as pointed out in (Kolich, 2008). Many studies have investigated the use of numerous objective parameters from experiment measurement and modeling tools to approach or evaluate the design of vehicle seats. Seat sizing, such as the determination of width, backrest height and seat pan length can be based on anthropometric data, which are also incorporated in design software packages such as RAMSIS (Vogt et al., 2005; Stefani et al., 2007). The measure of body contour in contact with the seat has also been the subject of scientific research, e.g., 3D body scans were used to study aircraft seat designs in (Smulders et al., 2016). To evaluate the efficacy and comfort of a specific seat design, objective indicators have been widely used. In a review study (De Looze et al., 2003), pressure distribution appears to be the most clearly associated objective measure to seating comfort. Pressure distribution was applied in the analysis of occupant-seat interface (Zenk et al., 2006; Ciaccia and Sznelwar, 2012; Li et al., 2017; 2019; Yongxiang et al., 2019; Campos and Xi, 2020). Hartung (Hartung, 2006) describes the ideal pressure distribution, which was later used to determine the comfort seating with the lowest spine loading (Zenk et al., 2012).
In addition to interface pressure, muscle activity is also important for the overall sitting experience, especially on a long-haul flight. Even though no definitive conclusions of direct connections between muscle activation and seating comfort have been drawn, the literature shows that fatigue causes discomfort in seating (Grujicic et al., 2010; Li et al., 2020). According to (Jørgensen et al., 1988), in long-haul flights, passengers may experience discomfort due to the fatigue in Upper Trapezius (UT) muscle. A static isometric muscle contraction of 5%–10% MVC (Maximum Voluntary Contraction) for 1 h can cause fatigue. In addition to fatigue, the muscle force is shown to be a predictor of occupants’ seating experience (Majid et al., 2013; Smulders et al., 2019; Gao et al., 2022).
Previous studies have also referred to muscle activation for seating comfort evaluation. Zhao and Tang (Jianghong and Long, 1994) used electromyography sensors (surface electrodes), which were attached to thoracic region, along with comfort rating, to measure the muscle activation for different sitting posture and seat height condition and to finally assess the comfort of a bus passenger seat. A similar technique was applied to compare specific dynamic office chairs (Ellegast et al., 2012), while the interested muscle group shifts to the trapezius and erector spine. Makhsous et al. (Makhsous et al., 2009) evaluated a new seat configuration that facilitated “off-loading” sitting posture, which was proven effective in reducing the lumbar paraspinal muscle activity in subjects with and without lower back pain (LBP) using electromyography (EMG) measurement on the paraspinal muscles. The muscle activity was also applied to investigate the effect of a lightweight massage system on a driver’s seat. According to the muscle measurement, the added system reduced the average EMG for rhomboid muscles, and a connection between lowering EMG amplitude and better perceived comfort was identified (Franz et al., 2011). Smulders et al. investigated the neck posture and muscle activity in a reclined business class aircraft seat watching IFE (In-flight entertainment) with different head supporting scenarios (Smulders et al., 2019).
Nevertheless, the work on studying the relationship of muscle forces and comfort is more limited compared to seating pressure. Additionally, based on the aforementioned literature review, the muscle activity was usually evaluated in studies that either considered more active seating cases, such as working on an office chair (Ellegast et al., 2012), watching IFE on an aircraft seat (Smulders et al., 2019), or tested new design figures of the seat (Makhsous et al., 2009; Franz et al., 2011). Static normal seating is perceived effortless; thus, muscle activity is not emphasized. However, it has been reported that discomfort may occur due to unsupported body parts (Zhong et al., 2021; Zhong et al., 2022), such as the neck and lumbar region because of lordotic body shape and sitting posture. Fundamentally, the unsupported body segment imposed excessive torque at the local spine joints (vertebra-intravertebral disc system), inducing muscle activation. This corresponds to uncomfortable fatigue feelings, such as sore neck and back, especially for long-haul flights. Thus, studying muscle activity is essential, even for static passive seating scenarios.
In light of the above discussion, and to the best of our knowledge, there is a gap in the knowledge of the relation of muscle activity for passive or relaxed seating state, which is commonly and normally experienced on an aircraft seat, especially during a long-haul flight. The objective of this study is to further investigate the relationship between the muscle activity and comfort levels of relaxed seating on an aircraft seat. This paper is the first to experimentally explore the role of muscle activity in comfort for relaxed seating state on a conventional seat. For this pilot study, we will focus on the neck region because body concavity in this region (lordotic cervical spine) usually induces non-contact condition, where the muscle is deemed to play a more significant role compared to contacted body parts.
The research was conducted by experimental observations from recruited human participants with the approval from Research Ethics Board of the Toronto Metropolitan University (REB-2022-250). The experiment was carried out on a cushioned business aircraft seat with different backrest inclinations (30°, 40°, 50° referring to the vertical direction), simulating different activities of sitting. Comfort survey and muscle activation measurements were included in the experiment protocol to collect the subjective and objective data regarding seating comfort under different seat conditions. The details of our experimental elements are elaborated in the following subsections.
19 adult participants (aged from 21 to 26 years old), with 14 male and 5 females, participated in this study. The sample size is larger than the minimum expectation of 15 for human factors validation testing (Food and Drug Administration’s FDA, 2016). The exclusion criterion was prior traumatic injuries in the upper back-neck area. The reason for this criterion was that traumatic injuries often modify the muscular structure of the damaged tissue, and this may induce asymmetric neuromuscular loading and activation (Ball and Scurr, 2011). The exact degree of internal asymmetry is difficult to measure and/or model which can lead to systematic errors in the data. The demographic and basic anthropometry data of the participants were collected prior to the sitting tests (Table 1).

Table 1. Body information of participants (14 males and 5 female).
The experiment was conducted on a typical cushioned business aircraft seat, as shown in Figure 1. The seat is equipped with an extendable headrest along the longitudinal direction for its height adjustments. The seat’s cushion surface has little geometric curvature with no additional neck support provided. The seat pan has a tilting angle of 15° from the horizontal direction. The backrest can be inclined, and such flexibility makes the seat capable of simulating various preferred backrest conditions of different in-seat activities, e.g., preferred backrest inclination of 56° for sleeping (Smulders et al., 2016). The backrest inclination angle was tracked by a digital inclinometer (accuracy: ±0.2°). The bed shown in Figure 1 was used for muscle initialization before the sitting test and for conducting the muscle’s maximum voluntary contraction, which is elaborated in Sec 2.3.2.
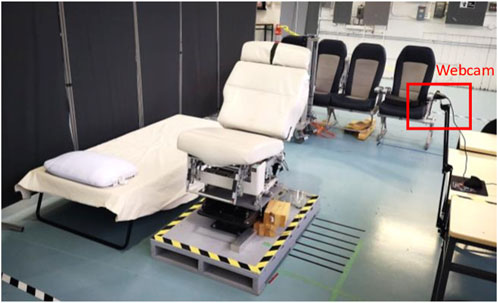
Figure 1. Test set-up including the test seat, a cushioned bed, and a webcam.
The muscle activation was measured using surface electromyography (sEMG) sensors (TEA CAPTIV T-Sens EMG with sampling rate of 2048 Hz), whose connected electrode pad is adhesively attached to the designated body area, as shown in Figure 2. A webcam was positioned laterally to the seat to capture the movement and details during the test, i.e., posture adjustments, change of trunk position for different backrest inclination setup, sitting down and standing up, etc. The video tracking of motion details throughout the experiment helps to exclude useless sEMG data during post-experiment data processing and analysis.
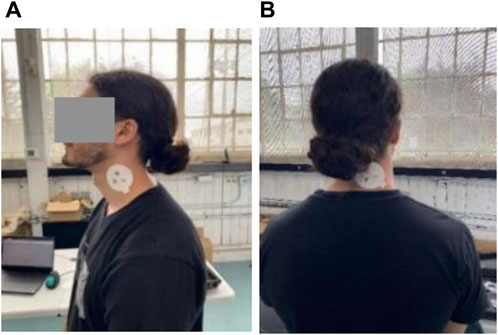
Figure 2. sEMG sensor placement on the neck for SCM (A) and UT (B).
Regarding the muscle activation measurement using sEMG sensors, two muscles, the sternocleidomastoid (SCM) and upper trapezius (UT), were selected. Other muscles are excluded due to either their lack of contribution to the interested movement, such as suprahyoid, infrahyoid, platysma, subclavius, and levator scapulae muscle (Sommerich et al., 2000), or the non-superficial locations making the muscle activity signal unable to be accurately detected and measured by the sEMG sensor such as scalene, splenius, and semispinalis muscle bypassing the superficial muscles (Haff and Triplett, 2016). In addition, the trapezius is generally separated according to the direction of the fibers that are contracting and consists of three portions, the upper trapezius, middle trapezius, and lower trapezius. Only the upper trapezius was included, as this is the portion of the trapezius responsible for neck extension (Smulders et al., 2019).
sEMG sensors were attached to the corresponding area of the two selected muscle groups: SCM and UT, to capture the muscle signal throughout the siting test with different backrest inclinations. sEMG electrodes were placed based on the palpation of SCM and UT on the left and right side, respectively, as shown in Figure 2. Left and right muscles are considered equally reacted during the test as no previous asymmetric pain, or symptoms of the neck region are reported by the subject. The instructed movement of the participants during the sitting test (following the backrest inclination adjustments) were also within the sagittal plane (no coronal-plane motions). The same process as our previous work (Alawneh, 2022) was taken to locate the electrodes’ attachment points. For SCM, the subject was asked to lay on their back on the bed and only lift the head up while looking to the contralateral side. This way, the SCM muscle becomes firm, and the mid-point of the extruded SCM can be selected; the electrode is placed after cleaning the designated skin area by using medical tape (multiple times sticking and peeling) and alcohol wipes (Hermens et al., 2000). For UT, the subject was asked to sit erectly at the edge of the chair, and the C4 process was located by palpation. An electrode was then placed one finger-width from the midline of the C4 vertebra, which is the approximate location of the center of UT. It is worth mentioning that, for a better data quality of the muscle measurement using sEMG sensor, appropriate skin preparation techniques were applied prior to the measurement according to (Keshner et al., 1989).
Maximum voluntary contraction (MVC) test was conducted after the sitting test as the muscle activity cannot be directly measured by the muscle’s electro signal but the percentage of the signal of maximum contraction. The MVC test procedure was adopted from the previous work (Alawneh, 2022). For the SCM, the subject is asked to lay flat, lift the head off the bed, and hold the head position for 2 s against the resistance band placed across the forehead by only rotating the head and neck. For UT, an ipsilateral flexion test, which has been shown to optimally elicit EMG activity specific to the upper portion of the trapezius muscle (Castelein et al., 2015), is chosen. This test applies a resisting load to the subject’s laterally extended arm and the head while the subject bends the head to drive the ear towards the same-side shoulder. The operations for the MVC test of both SCM and UT are shown in Figure 3.
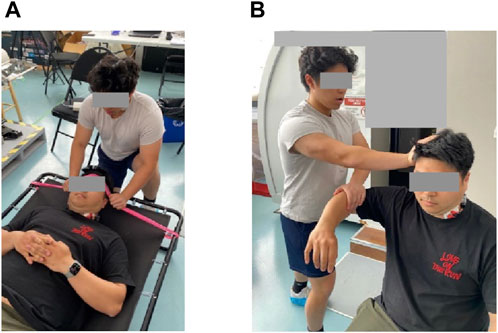
Figure 3. MVIC test for SCM (A) and UT (B).
In addition to the objective measure of muscle activation using sEMG sensor, the subjective muscle comfort level was based on a simple comfort scale. During each test, the occupant was asked to provide the verbal comfort rating on the one to five scale (1 - very low comfort, 2—low comfort, 3—medium confirm, 4—high comfort 5 - very high comfort) at the anterior (front) and posterior (back) side of the neck region, corresponding to the muscle SCM and UT, respectively.
Before starting the test, the participant was first briefed about the test procedure and asked to read and sign the consent form. Then, the basic demographic information (age and gender) and anthropometry (stature, weight) of the participant were collected. Next, the sEMG sensors were attached to the corresponding areas for SCM and UT, as explained in Sec 2.3.2.
Afterwards, the participant was asked to lay flat on the bed with pillow (Figure 1) simulating the normal sleeping condition (full relaxation) for 3 min for body initialization before the sitting test, inspired by (Smulders et al., 2019) Then, the participant was asked to sit on the seat with the head naturally leaning against the headrest and the full back in contact with backrest. This requirement is to ensure all participants sit with the same constraint for better test consistency regardless of their personal sitting habits. After the sitting was stabilized, the condition remained static and undisturbed for a short period of time of 1 min to produce regions of consistency in the sensor data. The relatively short stable sitting duration was applied in the test to avoid potential tediousness developed due to multiple trials of each test, which could potentially affect the perceived comfort. The participant was then asked to provide the comfort rating of each muscle area, referring to Sec 2.3.3. The mentioned sitting test procedures were repeated for the backrest inclination of 30°, 40° and 50°, with three trials for each condition. MVC test was conducted at the end of the test for the normalization of interested sEMG data during sitting.
The conducted experiment focused on two muscle groups and was repeated for each subject a total of three times, and the average sEMG and comfort rating values of the trials was used for the analysis. For the muscles’ sEMG data, the irrelevant and unstable data regions were identified and excluded based on the webcam recording, e.g., standing up from the bed and walking to the seat, posture change for inclination adjustment, and wiggling for comfort position.
The sEMG signal was recorded and processed with CAPTIV 2.4.0, the companion software of the sensor system. The root mean square (RMS) value of the recorded rectified raw data was calculated. Then, the signals of SCM of UT during the sitting test with 30°, 40° and 50° backrest inclination were normalized based on the MVC test maximum value, and the muscle activation was expressed as %MVC.
With the obtained data of two muscles’ activations and their corresponding comfort ratings, statistical analysis was performed to identify the association of observed values and influence of human and seat conditions. Figure 4 illustrates the overview of data collection and analysis. Correlation analysis was performed between muscle activation and comfort rating to understand the role of muscle activation in perceived seating comfort in the neck region. In addition, One-way ANOVA were used to test the statistical significance in the means of data groups of different backrest inclinations.
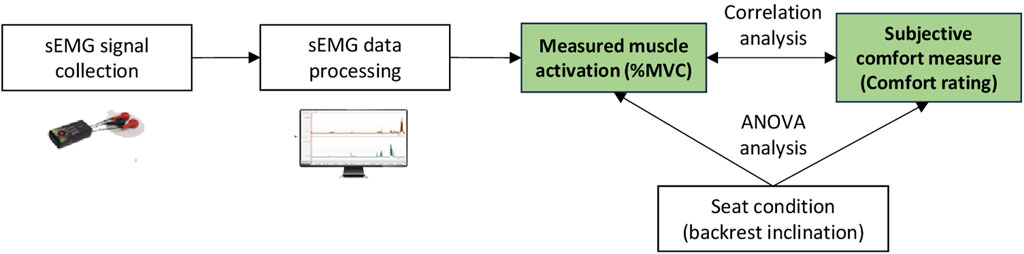
Figure 4. Diagram of data analysis.
The muscular activation and subjective comfort level measured in this study are assessed by considering the collected experimental data under each seat recline angle condition.
The measured activation and comfort rating of the studied muscles are plotted for each backrest inclination, as shown in Figure 5. Figures 5A,B are the distributions of the subjective levels of comfort reported during experimental trials for the SCM and UT muscle groups, respectively. Each bar represents the average perceived level of comfort on a scale of 1–5, reported by the participant across three trials for each seat recline angle. A high degree of variability of SCM and UT area comfort level across participants is observed. The standard deviation of each inclination condition is displayed in each chart.
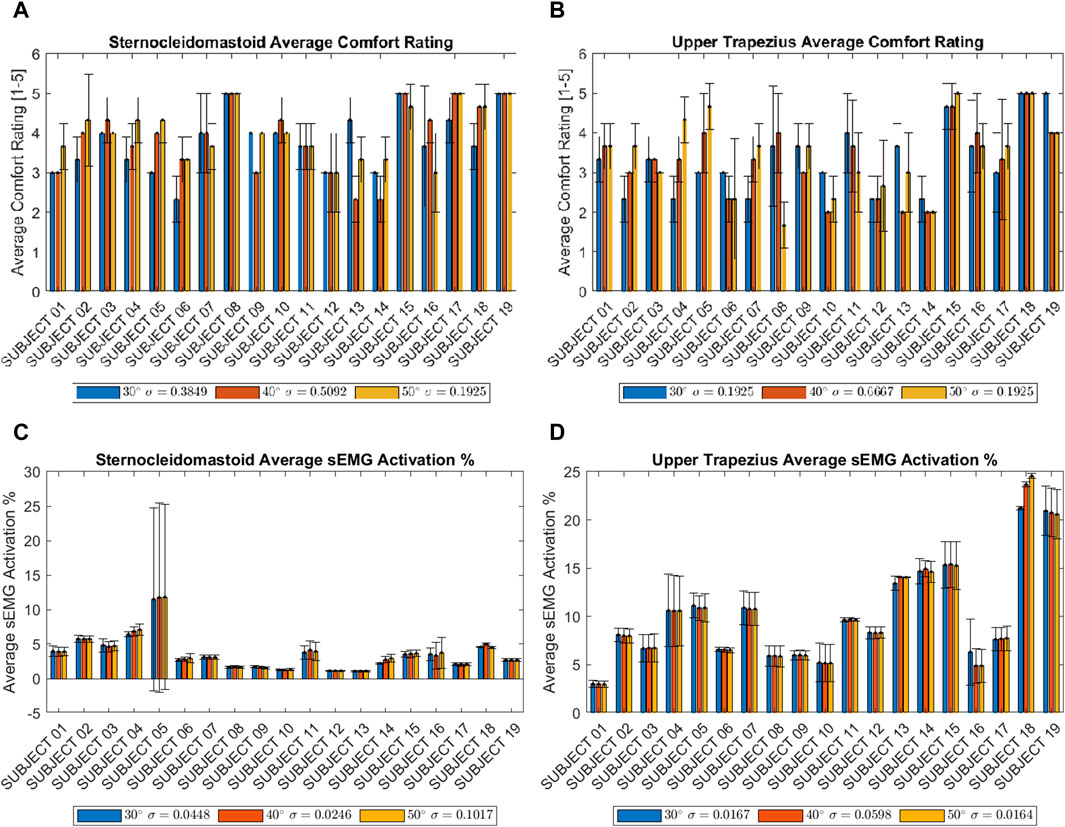
Figure 5. (A) Average reported comfort rating of the SCM across inclination conditions (B) average reported comfort rating of the UT across inclination conditions (C) average measured sEMG activation of the SCM across inclination conditions (D) average measured sEMG activation of the UT across inclination conditions.
Figures 5C,D illustrates the distribution of the average measured sEMG activation percentage across the three experimental trials performed for each recline angle for the SCM and UT muscle groups, respectively. It is evident that the inter-subject variation for the measured sEMG activation percentage is high (standard deviations shown in charts), and there is little change in the measured activation percentage across different backrest inclinations for the same participant.
The data can be generally visualized by plotting the total average of each evaluated comfort parameter against the seat reclination grouping to explore the effect of seat reclination on the studied parameters of comfort and muscle activation (Figure 6; Figure 7).
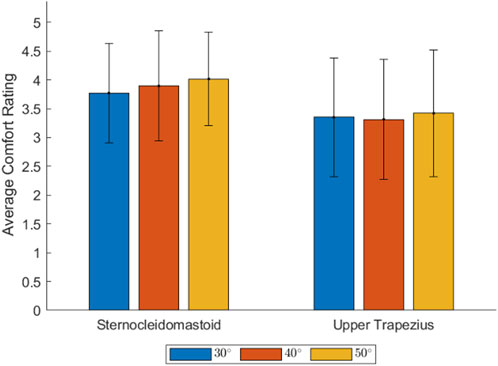
Figure 6. Average comfort rating at different backrest inclinations.
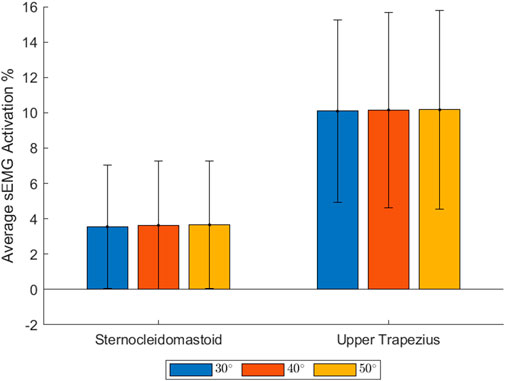
Figure 7. Average muscle activation level percentage at different backrest inclinations.
The following observations can be made about the effects of seat reclination on the evaluated comfort parameters. First, Figure 6 shows that subjects reported a steady increase in the perceived levels of comfort in the SCM region as the seat became more reclined; however, no clear trend can be observed in the perceived level of comfort reported by subjects in the UT region as the seat became more reclined. In Figure 7, relatively constant muscle activations are found for both SCM and UT at different backrest inclination angles. Second, higher comfort ratings were generally reported in SCM compared to that of UT muscle area, suggesting that passengers felt more uncomfortable in the posterior side of the neck when seated, given the test condition of the neck being unsupported. The muscle activation measurement reveals reasonable corresponding phenomenon that UT activation is significantly higher than SCM. The less relaxed muscle may induce discomfort and generate fatigue for long-duration sitting. Due to the unsupported condition of the neck, the neck’s body weight introduces more forces on the headrest, creating excessive flexion torque in the joints in the neck region. This would require the posterior muscles to strain more to keep a balanced body position. The results also imply the efficacy of using neck support to improve upper-body seating comfort.
The collected data of muscle activation (sEMG data) and comfort rating are grouped based on the muscle and the seat’s backrest inclination, respectively, for processing and analysis. To analyze the effect of backrest’s inclination on the evaluated dependent measures (the muscle activation and comfort rating) for each of the muscle groups studied, one-way analysis of variance (ANOVA) study is performed on the experimental data. The one-way ANOVA test helps uncover significant differences in the means of the dependent variable across the three tested inclination conditions (30°, 40° and 50°). From Table 2, the results of the one-way ANOVA study indicate that the null hypothesis is retained for all of the analysis configurations (F < F_crit,p > 0.05). Based on the analysis of 19 participants’ experimental data, backrest inclinations do not exhibit statistically significant differences in subjective comfort rating or muscle activation measurement, which indicates that different backrest inclination statistically shows nonsignificant influence on the participants seating experience in the neck region.
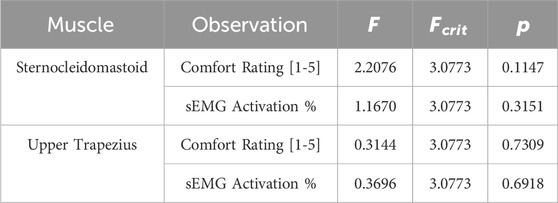
Table 2. Summary of one-way ANOVA results for comfort rating and muscle activation at different backrest inclinations (n = 19).
In addition to investigating the impact of the backrest inclination on neck comfort, the measured muscle activation was also tested for correlation with the perceived neck comfort. Such a correlation study based on the intersubject data helps to understand how subjective comfort can be reflected with the objective measure of muscle reaction (EMG signal). The correlation test results are provided in Table 3, consisting of Pearson’s correlation coefficient (R) and the corresponding p-value. From the results, all significant correlations between the measured muscle’s EMG and comfort rating were found in UT except for 40° backrest inclination. This may be due to the limited sample size (n = 19); thus, a nonsignificant correlation is identified. The last column of the table, with the highest correlation factor (medium correlation with R = 0.533), shows the correlation across all test inclinations, which can be interpreted as the indication of overall muscle activation-comfort association for various seat conditions.
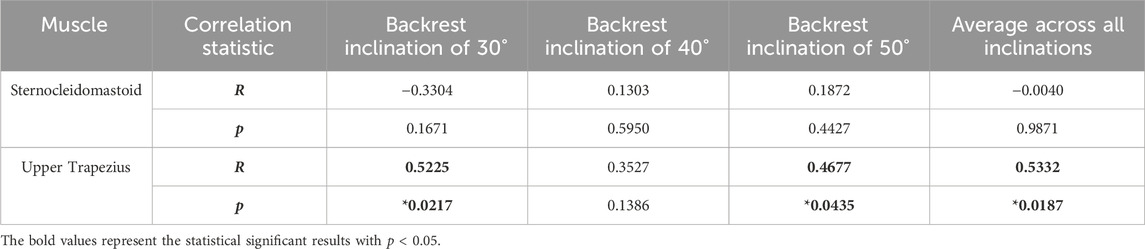
Table 3. Correlation analysis between the measured muscle activation and reported comfort ratings (n = 19).
Interestingly, the significant correlations found in UT have positive coefficients, while the positive correlation means that an occupant’s higher UT muscle activation corresponds to its higher perceived comfort. This is contrary to the common understanding that, for the same muscle group, a more relaxed condition always leads to better comfort feelings. To comprehend the observed phenomenon, it should be first understood that the strained muscle in the posterior neck region is induced by the supporting load from the headrest pointing towards the sitter’s frontal direction from a seating biomechanical point of view (Zhong et al., 2021), as mentioned in Sec 3.2. Thus, this observed tendency imply that a higher headrest supporting load would result in better comfort in the UT area. It is worth mentioning that such an inference does not conflict with that stated in Sec 3.2, that the less relaxed muscle (UT) may induce discomfort (Figure 6; Figure 7). The statement remains true when comparing different muscle groups (UT and SCM).
Nevertheless, it should be noted that the experiment designed in this study only focuses on short-term sitting. Further investigation on the monotonic trend of muscle activation and comfort can be conducted with a longer period of sitting to assess comfort and muscle fatigue in prolonged sitting. The finding from this paper shows that for a short period, a higher strained (for the same muscle) condition could generate better comfort, and this may explain why the sitter does not always feel as comfortable with a constant posture and tends to move and change posture to relieve discomfort during sitting (Jackson et al., 2009; Tan et al., 2009; Søndergaard et al., 2010; Cascioli et al., 2016; Hiemstra-van Mastrigt et al., 2017), regardless how relaxed the initial condition was. In addition, while the studied backrest inclination range (30°-50°) covers most seated activities, higher backrest angle can be considered as literature shows the comfortable sleeping angle for the backrest can reach 55.5°
Existing studies around muscle activity for seating comfort assessment focus on more active scenarios (e.g., driving and office working) or active systems (e.g., new features of seat design). The investigation on the muscle’s aspect for general relaxed sitting conditions is limited. This study proposed the evaluation of muscle forces as an additional insight into comfort levels for general relaxed seating on a conventional business aircraft seat. While seated, the unsupported neck region was specifically investigated by collecting and analyzing the muscle activation using EMG signal sensing and subjective comfort rating. The results show that the effect of backrest inclination on the neck seating experience was not statistically significant based on the scale of this study. It was also found that the unsupported neck area induces more muscle strain and discomfort in UT, which implies the ergonomic benefit of deploying neck support. A medium correlation was also found in UT for general short-term seating, showing that sEMG could be a valid measure of neck comfort.
Based on the results of this pilot study, extended studies can be conducted with a more extensive test sample size and test duration while also considering other body regions, such as upper thoracic and lumbar area in relaxed posture.
The raw data supporting the conclusion of this article will be made available by the authors, without undue reservation.
The studies involving humans were approved by Research Ethics Board of Toronto Metropolitan University. The studies were conducted in accordance with the local legislation and institutional requirements. The participants provided their written informed consent to participate in this study.
OA: Writing–review and editing, Writing–original draft, Visualization, Validation, Methodology, Investigation, Formal Analysis, Conceptualization. BR: Writing–review and editing, Writing–original draft, Visualization, Validation, Methodology, Formal Analysis, Data curation, Conceptualization. XZ: Writing–review and editing, Writing–original draft, Visualization, Validation, Methodology, Formal Analysis, Data curation, Conceptualization. JX: Writing–review and editing, Validation, Formal Analysis, Data curation, Conceptualization. RF: Writing–review and editing, Supervision, Resources, Funding acquisition, Conceptualization. FX: Writing–review and editing, Supervision, Funding acquisition, Conceptualization.
The author(s) declare financial support was received for the research, authorship, and/or publication of this article. This research is supported by the Natural Sciences and Engineering Research Council of Canada Discovery Grants, and NSERC/Bombardier Senior Industrial Research Chair in Advanced Interiors and Systems program.
The authors declare that the research was conducted in the absence of any commercial or financial relationships that could be construed as a potential conflict of interest.
All claims expressed in this article are solely those of the authors and do not necessarily represent those of their affiliated organizations, or those of the publisher, the editors and the reviewers. Any product that may be evaluated in this article, or claim that may be made by its manufacturer, is not guaranteed or endorsed by the publisher.
Ahmadpour, N., Lindgaard, G., Robert, J. M., and Pownall, B. (2014). The thematic structure of passenger comfort experience and its relationship to the context features in the aircraft cabin. Ergonomics 57, 801–815. doi:10.1080/00140139.2014.899632
Alawneh, O. (2022). Computational methods application of musculoskeletal analysis for seating comfort.
Apostolico, A., Cappetti, N., D’Oria, C., Naddeo, A., and Sestri, M. (2014). Postural comfort evaluation: experimental identification of Range of Rest Posture for human articular joints. Int. J. Interact. Des. Manuf. 8, 109–120. doi:10.1007/s12008-013-0186-z
Ball, N., and Scurr, J. (2011). Effect of muscle action, load and velocity variation on the bilateral neuromuscular response. J. Exerc. Physiology 14. ISSN 1097-9751
Campos, G. H., and Xi, F. J. (2020). Pressure sensing of an aircraft passenger seat with lumbar control. Appl. Ergon. 84, 103006. doi:10.1016/j.apergo.2019.103006
Cascioli, V., Liu, Z., Heusch, A., and McCarthy, P. W. (2016). A methodology using in-chair movements as an objective measure of discomfort for the purpose of statistically distinguishing between similar seat surfaces. Appl. Ergon. 54, 100–109. doi:10.1016/j.apergo.2015.11.019
Castelein, B., Cagnie, B., Parlevliet, T., Danneels, L., and Cools, A. (2015). Optimal normalization tests for muscle activation of the levator scapulae, pectoralis minor, and rhomboid major: an electromyography study using maximum voluntary isometric contractions. Arch. Phys. Med. Rehabil. 96, 1820–1827. doi:10.1016/j.apmr.2015.06.004
Ciaccia, F. R. D. A. S., and Sznelwar, L. I. (2012). An approach to aircraft seat comfort using interface pressure mapping. Work 41, 240–245. doi:10.3233/WOR-2012-0163-240
De Looze, M. P., Kuijt-Evers, L. F. M., and Van Dieën, J. (2003). Sitting comfort and discomfort and the relationships with objective measures. Ergonomics 46, 985–997. doi:10.1080/0014013031000121977
Ellegast, R. P., Kraft, K., Groenesteijn, L., Krause, F., Berger, H., and Vink, P. (2012). Comparison of four specific dynamic office chairs with a conventional office chair: impact upon muscle activation, physical activity and posture. Appl. Ergon. 43, 296–307. doi:10.1016/j.apergo.2011.06.005
Food and Drug Administration’s (FDA) (2016). Applying human factors and usability engineering to medical devices: guidance for industry and food and Drug administration staff. Available at: http://www.regulations.gov.
Franz, M., Zenk, R., Vink, P., and Hallbeck, S. (2011). The effect of a lightweight massage system in a car seat on comfort and electromyogram. J. Manip. Physiol. Ther. 34, 107–113. doi:10.1016/j.jmpt.2010.12.002
Gao, K., Du, J., Ding, R., and Zhang, Z. (2022). Lumbar spinal loads and lumbar muscle forces evaluation with various lumbar supports and backrest inclination angles in driving posture. Eur. Spine J. 32, 408–419. doi:10.1007/s00586-022-07446-x
Grujicic, M., Pandurangan, B., Xie, X., Gramopadhye, A. K., Wagner, D., and Ozen, M. (2010). Musculoskeletal computational analysis of the influence of car-seat design/adjustments on long-distance driving fatigue. Int. J. Ind. Ergon. 40, 345–355. doi:10.1016/j.ergon.2010.01.002
Haff, G., and Triplett, N. T. (2016). Essentials of strength training and conditioning. Champaign, IL: Human Kinetics.
Hartung, J. (2006). Objektivierung des statischen Sitzkomforts auf Fahrzeugsitzen durch die Kontaktkräfte zwischen Mensch und Sitz.
Hermens, H. J., Freriks, B., Disselhorst-Klug, C., and Rau, G. (2000). Development of recommendations for SEMG sensors and sensor placement procedures. J. Electromyogr. Kinesiol. 10, 361–374. doi:10.1016/S1050-6411(00)00027-4
Hiemstra-van Mastrigt, S., Groenesteijn, L., Vink, P., and Kuijt-Evers, L. F. M. (2017). Predicting passenger seat comfort and discomfort on the basis of human, context and seat characteristics: a literature review. Ergonomics 60, 889–911. doi:10.1080/00140139.2016.1233356
Jackson, C., Emck, A. J., Hunston, M. J., and Jarvis, P. C. (2009). Pressure measurements and comfort of foam safety cushions for confined seating. Aviat. Space Environ. Med. 80, 565–569. doi:10.3357/ASEM.2320.2009
Jørgensen, K., Fallentin, N., Krogh-Lund, C., and Jensen, B. (1988). Electromyography and fatigue during prolonged, low-level static contractions. Eur. J. Appl. Physiol. Occup. Physiol. 57, 316–321. doi:10.1007/BF00635990
Keshner, E. A., Campbell, D., Katz, R. T., and Peterson, B. W. (1989). Neck muscle activation patterns in humans during isometric head stabilization. Exp. Brain Res. 75, 335–344. doi:10.1007/BF00247939
Kolich, M. (2008). A conceptual framework proposed to formalize the scientific investigation of automobile seat comfort. Appl. Ergon. 39, 15–27. doi:10.1016/j.apergo.2007.01.003
Li, C. T., Chen, Y. N., Tseng, Y. T., and Tsai, K. H. (2019). Biomechanical analysis of different dynamic sitting techniques: an exploratory study. Biomed. Eng. Online 18, 4. doi:10.1186/s12938-018-0621-2
Li, C. T., Huang, K. Y., Kung, C. F., Chen, Y. N., Tseng, Y. T., and Tsai, K. H. (2017). Evaluation of the effect of different sitting assistive devices in reclining wheelchair on interface pressure. Biomed. Eng. Online 16, 108. doi:10.1186/s12938-017-0398-8
Li, M., Gao, Z., Gao, F., Gao, F., Zhang, T., Mei, X., et al. (2020). Quantitative evaluation of vehicle seat driving comfort during short and long term driving. IEEE Access 8, 111420–111432. doi:10.1109/ACCESS.2020.2999080
Majidbinti, N. A. A., Edzuan Abdullah, M. F., Jamaludin, M. S., Notomi, M., and Rasmussen, J. (2013). Musculoskeletal analysis of driving fatigue: the influence of seat adjustments. Adv. Eng. Forum 10, 373–378. doi:10.4028/www.scientific.net/aef.10.373
Makhsous, M., Lin, F., Bankard, J., Hendrix, R. W., Hepler, M., and Press, J. (2009). Biomechanical effects of sitting with adjustable ischial and lumbar support on occupational low back pain: evaluation of sitting load and back muscle activity. BMC Musculoskelet. Disord. 10, 17–11. doi:10.1186/1471-2474-10-17
Smulders, M., Berghman, K., Koenraads, M., Kane, J. A., Krishna, K., Carter, T. K., et al. (2016). Comfort and pressure distribution in a human contour shaped aircraft seat (developed with 3D scans of the human body). Work 54, 925–940. doi:10.3233/WOR-162363
Smulders, M., Naddeo, A., Cappetti, N., van Grondelle, E. D., Schultheis, U., and Vink, P. (2019). Neck posture and muscle activity in a reclined business class aircraft seat watching IFE with and without head support. Appl. Ergon. 79, 25–37. doi:10.1016/j.apergo.2018.12.014
Sommerich, C. M., Joines, S. M. B., Hermans, V., and Moon, S. D. (2000). Use of surface electromyography to estimate neck muscle activity. J. Electromyogr. Kinesiol. 10, 377–398. doi:10.1016/S1050-6411(00)00033-X
Søndergaard, K. H. E., Olesen, C. G., Søndergaard, E. K., de Zee, M., and Madeleine, P. (2010). The variability and complexity of sitting postural control are associated with discomfort. J. Biomech. 43, 1997–2001. doi:10.1016/j.jbiomech.2010.03.009
Stefani, M., Pewinski, W., and Furtado, R. (2007). “Occupant head restraint usage heights relative to backset and safety,” SAE Technical Paper 2007-01-2503. doi:10.4271/2007-01-2503
Tan, C. F., Chen, W., Liu, H., and Rauterberg, M. (2009). “Adaptive framework and user preference modeling for economy class aircraft passenger seat,” in Ems 2009 - UKSim 3rd European modelling symposium on computer modelling and simulation, 66–69. doi:10.1109/EMS.2009.25
Vink, P., and Hallbeck, S. (2012). Editorial: comfort and discomfort studies demonstrate the need for a new model. Appl. Ergon. 43, 271–276. doi:10.1016/j.apergo.2011.06.001
Vogt, C., Mergl, C., and Bubb, H. (2005). Interior layout design of passenger vehicles with RAMSIS. Hum. Factors Ergon. Manuf. 15, 197–212. doi:10.1002/hfm.20022
Yongxiang, J., Jingle, D., Sanpeng, D., Yuming, Q., Peng, W., Zijing, W., et al. (2019). Sitting posture recognition by body pressure distribution and airbag regulation strategy based on seat comfort evaluation. J. Eng. 2019, 8910–8914. doi:10.1049/joe.2018.9143
Zenk, R., Franz, M., Bubb, H., and Vink, P. (2012). Technical note: spine loading in automotive seating. Appl. Ergon. 43, 290–295. doi:10.1016/j.apergo.2011.06.004
Zenk, R., Mergl, C., Hartung, J., Sabbah, O., and Bubb, H. (2006). Objectifying the comfort of car seats. doi:10.4271/2006-01-1299
Zhong, X., Alawneh, O., Liu, Y., Faieghi, R., and Xi, F. (2022). “A 3D biomechanical model of human-seat interaction,” in Proceedings of the 2022 USCToMM symposium on mechanical systems and robotics (Rapid City: Springer), 129–143. doi:10.1007/978-3-030-99826-4_12
Keywords: seating comfort, muscle activation, neck, comfort measure, backrest inclination
Citation: Alawneh O, Rassas B, Zhong X, Xi J, Faieghi R and Xi F (2024) The role of muscle forces in neck comfort for static seating: a pilot study. Front. Mech. Eng 10:1373545. doi: 10.3389/fmech.2024.1373545
Received: 19 January 2024; Accepted: 07 March 2024;
Published: 04 April 2024.
Edited by:
Alessandro Ruggiero, University of Salerno, ItalyReviewed by:
Nicola Cappetti, University of Salerno, ItalyCopyright © 2024 Alawneh, Rassas, Zhong, Xi, Faieghi and Xi. This is an open-access article distributed under the terms of the Creative Commons Attribution License (CC BY). The use, distribution or reproduction in other forums is permitted, provided the original author(s) and the copyright owner(s) are credited and that the original publication in this journal is cited, in accordance with accepted academic practice. No use, distribution or reproduction is permitted which does not comply with these terms.
*Correspondence: Reza Faieghi, cmV6YS5mYWllZ2hpQHRvcm9udG9tdS5jYQ==
†These authors have contributed equally to this work
Disclaimer: All claims expressed in this article are solely those of the authors and do not necessarily represent those of their affiliated organizations, or those of the publisher, the editors and the reviewers. Any product that may be evaluated in this article or claim that may be made by its manufacturer is not guaranteed or endorsed by the publisher.
Research integrity at Frontiers
Learn more about the work of our research integrity team to safeguard the quality of each article we publish.