 M. Hafid
 Jos Istiyanto
 Nasruddin Nasruddin
94% of researchers rate our articles as excellent or good
Learn more about the work of our research integrity team to safeguard the quality of each article we publish.
Find out more
ORIGINAL RESEARCH article
Front. Mech. Eng., 06 October 2023
Sec. Solid and Structural Mechanics
Volume 9 - 2023 | https://doi.org/10.3389/fmech.2023.1273447
This article is part of the Research TopicHybrid Modeling - Blending Physics with DataView all 5 articles
In this study, the crashworthiness performance of a thin-walled square steel-tube structure with an elliptical crush initiator under impact loading was investigated. The effect of the height, width, and distance of the crush initiator from the top of the tube on the crashworthiness performance was analyzed using several numerical simulations using ABAQUS Explicit. The response surface methodology was used to predict the crashworthiness performance indices, and optimization was performed to determine the optimal dimensions and position of the crush initiator. The optimization was aimed at minimizing the peak force (PF) while maximizing the mean crushing force (MCF), crush force efficiency (CFE), and specific energy absorption (SEA). The result was an elliptical crush initiator with a height of 15 mm, width of 24.784 mm, and distance of 15.08 mm. Validation was performed to verify these results. The optimal crush initiator effect resulted in a 10.12% decrease in the peak force, 13.67% increase in the crush force efficiency, and 2.23% increase in the mean crushing force. However, a slight decrease of 0.82% in specific energy absorption was observed.
Thin-walled tubes, which are used to absorb energy during collisions, have been extensively investigated in the automotive industry. Various researchers have used experiments, numerical simulations, and theoretical analyses to reveal their energy absorption capabilities. To minimize passenger injury, various researchers focused their studies on several parameters, such as the peak force (PF), mean crushing force (MCF), crush force efficiency (CFE), and specific energy absorption (SEA). Numerous studies have been conducted to determine the effects of various crush initiators, including cut-out and foam packing. These studies revealed the potential of decreasing PF and increasing SEA.
Some studies have investigated the use of cut-outs as crush initiators to reduce the PF while maintaining the MCF. The geometry and position of the cross-section and the crush initiator increase the CFE of tube structures. Nghia et al. (2013) developed an analytical model for a square thin-walled aluminum tube with a circular cut-out as the crush initiator, which effectively decreased the PF in the first fold while maintaining a similar MCF. Subramaniyan et al. (2014) found that the quantity of circular cut-outs contributed to decreasing the PF in circular and square tubes. Other studies examined the impact of crush initiator placement, such as drilling holes (Estrada et al., 2019) and multiple holes (Malawat et al., 2019; Dionisius et al., 2022) in square steel tubes, leading to improved crashworthiness performance. Researchers have examined the use of V-notch, groove (Balaji and Annamalai, 2017), and tapered (Asanjarani et al., 2018) shapes as effective crush initiators, reducing the initial force spikes without compromising the total energy absorption. Hexagonal (Rogala et al., 2021b) and elliptical (Cheng et al., 2006) cut-outs in square aluminum tubes have been analyzed, revealing their significant influence on decreasing the PF. The position and width-to-height ratio of the cut-out are critical factors that influence PF reduction.
For inflexible foam applications, various studies have aimed to enhance the energy absorption capacity while maintaining the PF in tubular structures. For instance, Rezvani and Jahan (2015) investigated a circular aluminum tube reinforced with an annular ring and rigid polyurethane foam, which showed improved energy absorption and CFE using a specific design. Razazan et al. (2018) developed a shock absorber with a crush initiator on a rectangular aluminum tube filled with rigid polyurethane foam, which exhibited a higher energy absorption capacity than partially filled structures. Studies on thin-walled square aluminum tubes with foam and various crush initiators have shown that structures with four holes at the corners (Li et al., 2019) demonstrate the best crashworthiness performance. Rogala et al. (2021a) analyzed the effect of impact load on the dimple depth and diameter by incorporating aluminum foam to improve the CFE without increasing the initial PF, leading to an increased MCF.
The cut-out position and width of the crush initiator parameter influence the PF more significantly than the height (Huang et al., 2010; Rogala et al., 2021b) under impact loads. However, studies addressing the crashworthiness performance, dimension optimization, and optimal positioning of a cut-out in an energy-absorbing structure are rare. This study addresses this problem by introducing an elliptical cutout model in which various heights, widths, and distances from the top end are optimized. The elliptical shape was selected owing to its composition of two circular axes, which are easier to manufacture than a hexagonal shape, but slightly more intricate than a simple circular hole.
This study is primarily aimed at investigating the relationship between the cut-out parameters and the crashworthiness performance of a thin-walled square steel tube. Moreover, this study focused on identifying the most significant parameters influencing crashworthiness and clarifying the interactions between these parameters. Subsequently, optimization was conducted to determine suitable geometric parameters capable of enhancing the CFE while preserving the SEA of the square-tube structure.
The capacity of a structure to absorb the energy generated from an impact or crash is called the energy absorption in crash testing. Several crash tests involve subjecting a material or structure to collision with an object at a predetermined velocity, and the absorbed energy is subsequently determined (Guler et al., 2010; Sun et al., 2017). This aspect is of the utmost importance in designing structures or vehicles to minimize human injuries and vehicle damage. Eq. 1 is the formula for calculating the energy absorption (EA):
where
where
where
The PF is obtained from the force–displacement graph. This represents the maximum force experienced during collision, which typically occurs at the beginning, when the highest impact velocity is reached. The PF measurement plays a crucial role in evaluating the EA capability of a material or structure and in predicting potential damage.
Validation was conducted to ensure the accuracy, reliability, and suitability of various simulation results serving as information for researchers to make decisions. It was achieved by comparing the simulation results with the data obtained from other trusted sources. A validation simulation typically involves a top–down arrangement consisting of an impactor, a thin-walled square tube, and a fixed base. Figure 1 illustrates the meshing and overall arrangement of a rigid shell plane with several 5 mm elements used in the energy-absorbing structure.

FIGURE 1. General configuration of thin-walled square tube simulation.
The cross-sectional measurements of the square tube were derived from the typical average perimeter of the tubes used in sedans (Tarlochan et al., 2013). The simulated tube had a 300 mm perimeter, 350 mm length, 1.7 kg mass, 75 mm × 75 mm major dimension, and 2 mm thickness. The impact simulation results are depicted by a curve showing the crushing force versus displacement (Figure 2). An insignificant difference exists between the conducted simulation and reference simulation results. In this study, the significance of the differences in the calculated values of the generated curves was determined.
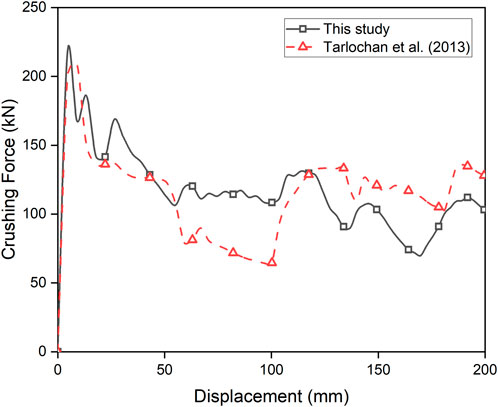
FIGURE 2. Validation results of thin-walled square steel tube.
Based on the data processing, it was found that the most significant difference in the crashworthiness indicator values between the simulation results and the reference was 3.9% for the PF, as listed in Table 1. This difference may not be significant; therefore, we may further investigate various optimization processes for tube structures incorporating the crush initiator.
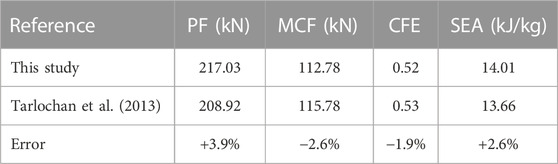
TABLE 1. Errors between conducted results of simulations and reference.
The authors observed the occurrence of the asymmetric mixed collapse mode B in the current problem. This mode was determined using the analytical equations derived by Abramowicz and Jones (1984), which provide the MCF values for a thin-walled square tube and the first-fold wavelength of the basic collapse element, expressed by Eqs 5, 6, respectively:
where
where
For simplicity, the analytically calculated values of the MCF and first folding wavelength were 113.02 kN and 37.2 mm, respectively. The flow stress was determined using the Johnson–Cook constitutive model for mild steel A36 material (Lacy, 2010), as shown in Figure 3. The material exhibited high sensitivity to strain rate, with increased strain rates resulting in increased flow stress. From Eq. 7, the strain rate generated during the drop impact scenario was approximately 85 s-1, yielding a corresponding flow stress of 421.24 MPa. The initial distance measured between the upper point (
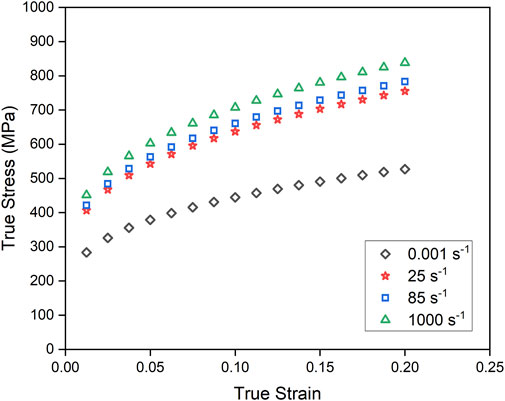
FIGURE 3. Stress–strain curves extracted from Johnson–Cook parameters for mild steel A36.
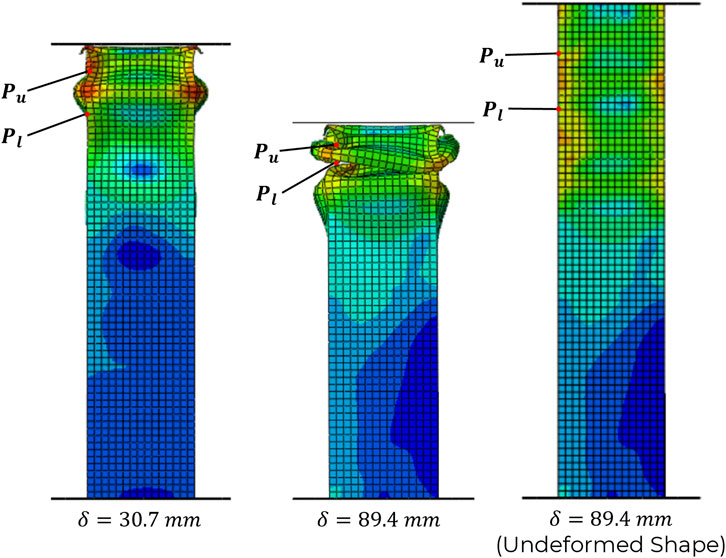
FIGURE 4. Numerical solution for upper and lower points of first folding wavelength.
The experimental design was used to examine the relationship between the experimental parameters and responses. Three parameters were selected as input variables, and their effects on the responses were observed using a face-centered central composite design (CCD). The three factors analyzed were the height, width, and distance between the center point of the crush initiator and the top of the tube, as shown in Figure 5, as well as the detailed geometry illustrated in Figure 6. An empirical correlation was established, based on the results of the experimental design, which were statistically analyzed using an RSM. RSM is a reliable analytical method that employs a second-order polynomial for investigating the effects of these input variables (Sahoo, 2011; Nagaraju et al., 2016; Deshwal et al., 2020). The analysis of variance (ANOVA) was employed to examine the significance of the model and input parameters by calculating the mean squared, degrees of freedom, and sum of the squared deviations for each input (Maqsood et al., 2022). A significance level of 5% was applied to determine the significant input values, and the p-value was used to assess the acceptance or rejection of the null hypothesis by the model. A lower p-value provides more significant evidence to reject the null hypothesis, indicating a more compelling indication that the model is significant. The key aspect of the RSM is the derivation of various mathematical formulas that express the relationship between the response and input variables (Dadrasi et al., 2020). This relationship is expressed as a quadratic equation (Eq. 8):
where
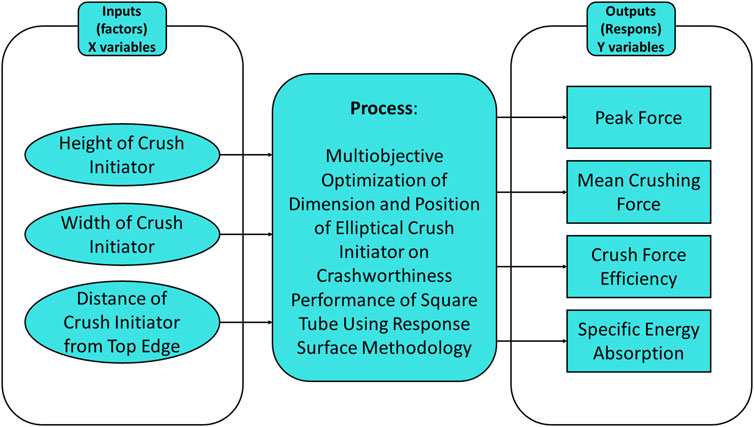
FIGURE 5. Design of experiment.
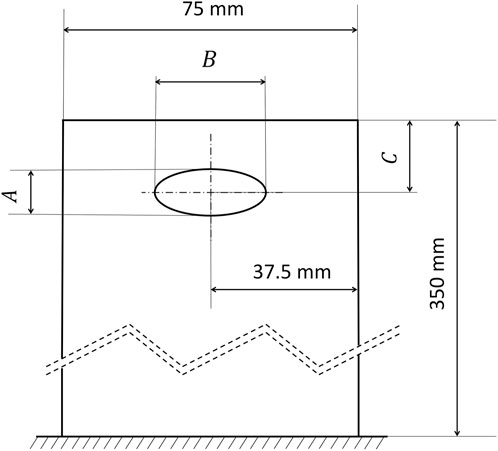
FIGURE 6. Geometry of thin-walled square tube with an elliptical cut-out in line on each side.
The low and high values of the height were 5 and 15 mm, respectively. The low and high values of the width were 10 and 35 mm, respectively, and those of the distance were 15 and 40 mm, respectively. A CCD with six center points suggests conducting 20 runs with varying input parameters for the geometry and position of the crush initiator in the square-tube structure. The response variables of interest are the PF, MCF, CFE, and SEA, as shown in Figure 5.
After the validation was completed, the square tube structures with the optimized elliptical crush initiators were designed, based on Figure 1. The design of the elliptical crush initiator was based on three geometric parameters: height (
In this study, A36 mild steel was used as the tube material. This material has the following parameters (Lacy, 2010): initial yield
Four different responses were analyzed in this study: PF, MCF, CFE, and SEA. These responses were analyzed by varying the height, width, and center distance of an elliptical crush initiator at the top end of a square steel tube. The experiment was conducted using a face-centered CCD for each input parameter. The results are presented in Table 2. Design-Expert software (Anderson and Whitcomb, 2017) was employed to determine the square regression coefficients (
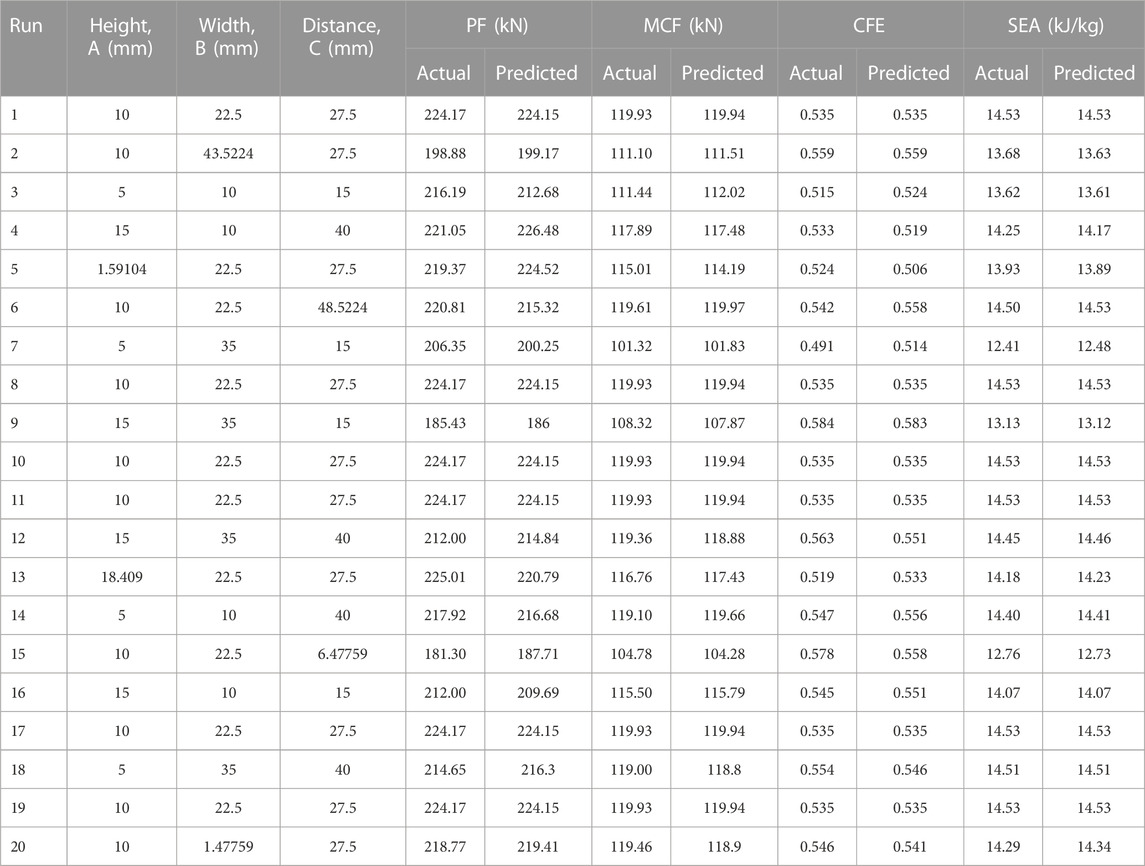
TABLE 2. Design of experiment according to face-centered CCD.
Table 3 lists the ANOVA values for all responses and the suggested model for each response, which involves a quadratic order process to calculate the sum of squares, F-values, and p-values for each input parameter, their squares, and interactions. This table lists data on the sum of the squares of the model, residuals, and lack of fit for each response. Based on the data, the PF model is statistically significant, with an F-value of 14.95 and a corresponding p-value <0.05, indicating its sensitivity to any changes occurring in the input. The PF model is expressed by Eq. 9.
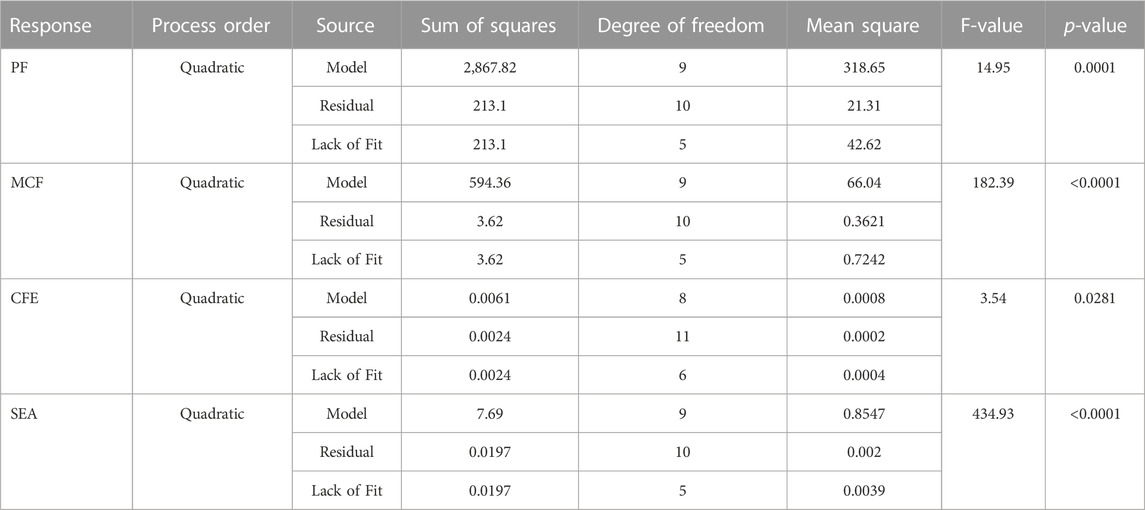
TABLE 3. ANOVA results for all responses.
The statistical analysis of the MCF model reveals an F-value of 182.39 and a corresponding p-value <0.05, indicating that the model is highly sensitive to changes in the input. The MCF model is expressed by Eq. 10.
The CFE model had an F-value of 3.54 and a corresponding p-value <0.05, indicating sensitive to changes in the input. The CFE model can be expressed by Eq. 11.
Statistical analysis of the SEA model revealed an F-value of 434.93 and a corresponding p-value <0.05, indicating that the model is highly significant and sensitive to changes in the input. The SEA model can be expressed by Eq. 12.
Figure 7 shows the importance of each input parameter, square, and interaction for all the four responses. The results indicate that in the case of the PF, input parameter
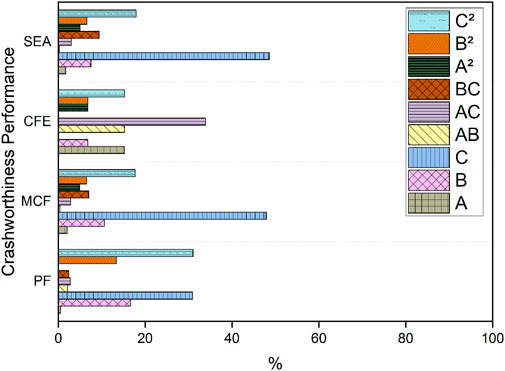
FIGURE 7. Significance of individual parameters, their squares, and their interactions.
The suitability and abnormality of data from the developed model were assessed using several normal plots of the residuals and residual-predicted plots (Anderson and Whitcomb, 2007). A model must have a good fit with the numerical data to be deemed acceptable, and the difference between the predicted and actual values should be minimal and follow a linear trend (Sahoo, 2011; Deshwal et al., 2020; Maqsood et al., 2022), indicating a normal distribution of errors (Chakule et al., 2017). The residual and outlier plots for the PF, MCF, CFE, and SEA models are shown in Figure 8. The data points on the normal plot of the residuals are randomly distributed and do not follow any particular pattern, indicating that the predictions by the proposed model are reliable. All data points in the residual-predicted plot for the entire response model fell within an acceptable range, indicating the absence of outliers, except for two data points related to SEA. The acceptable values for the PF, MCF, and SEA ranged from +4.14579 to −4.14579, whereas those for the CFE ranged from +4.00453 to −4.00453. Despite the presence of a few outliers, the model demonstrated its ability to precisely capture the relationship between the input and response variables with a high
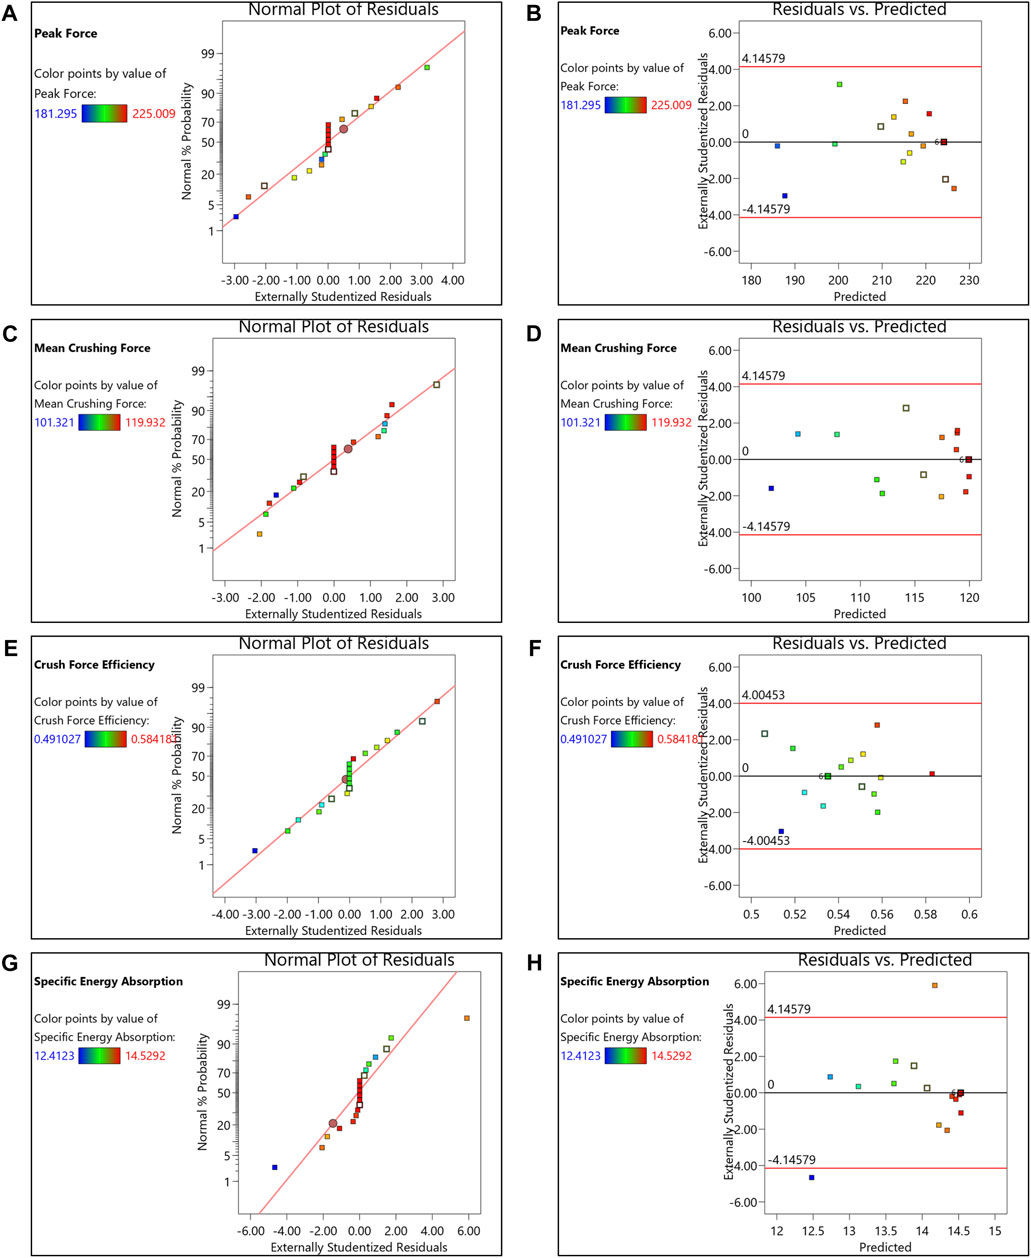
FIGURE 8. Normal plots of (A) residuals and (B) residuals-predicted for PF; normal plots of (C) residuals and (D) residuals-predicted for MCF; normal plots of (E) residuals and (F) residuals-predicted for CFE; normal plots of (G) residuals and (H) residuals-predicted for SEA.
This model has been analyzed and verified, and can help explore the design space. The 3-D surfaces comprehensively represent the responses when the input parameters are altered. Figure 9 shows the results of the numerical simulations and the use of 3-D surfaces and contours to depict the overall response using an RSM. One of the three input variables was kept constant at specific points, because displaying the interaction between more than two variables in a 3-D plot and contour was challenging. The selection of the constant variable was determined based on Figure 7, considering the linear coefficients that exhibited the lowest significance levels. Subsequently, the data points selected for the constant variable generated the highest or lowest values for each response.
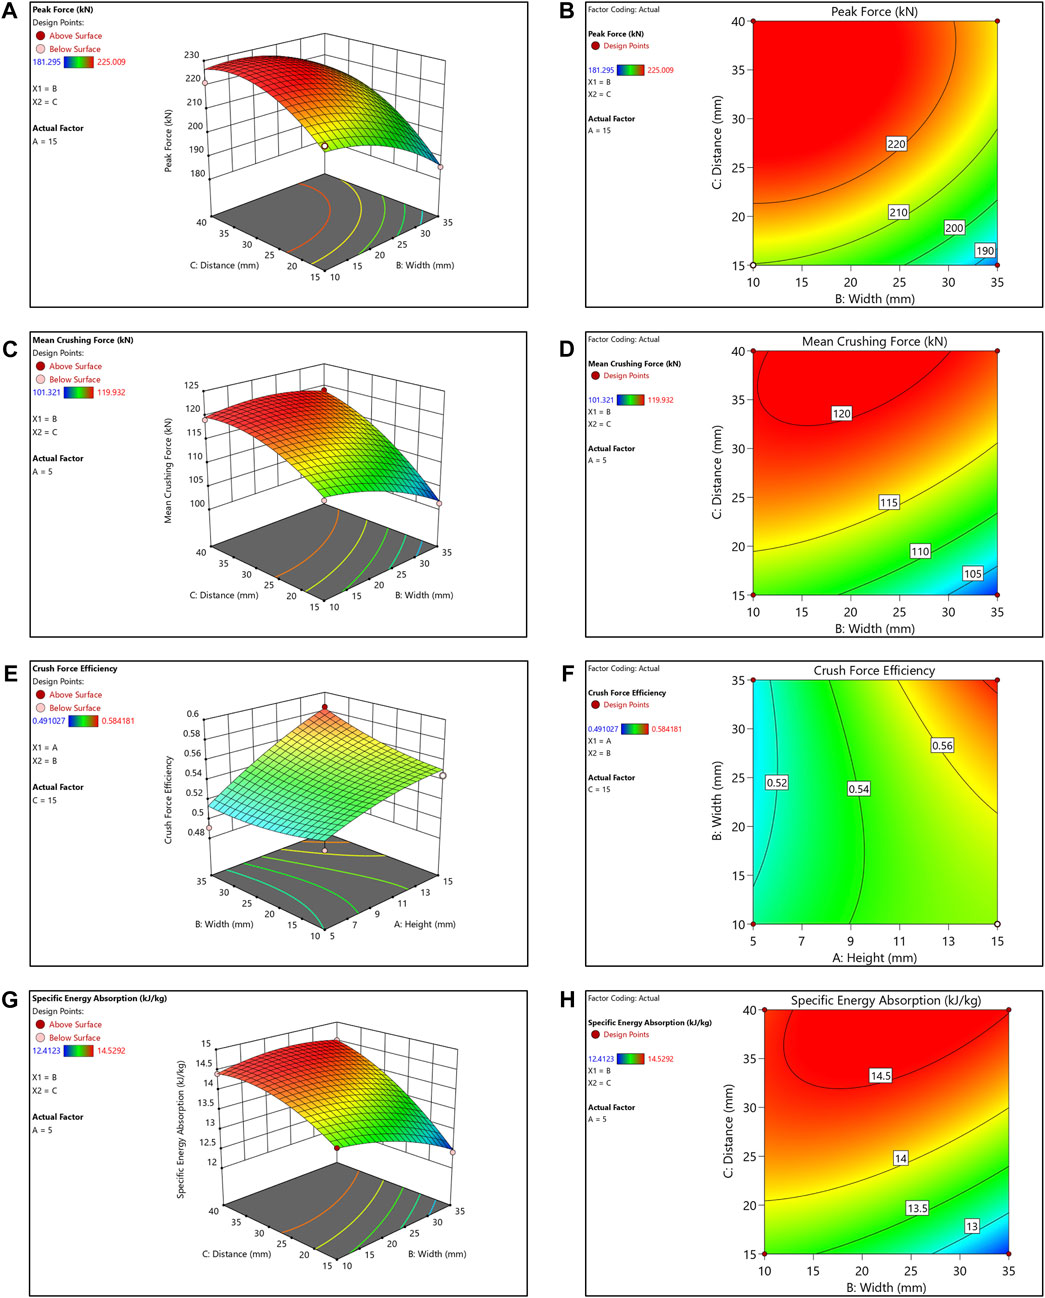
FIGURE 9. (A) 3-D surface and (B) contour of PF; (C) 3-D surface and (D) contour of MCF; (E) 3-D surface and (F) contour of CFE; (G) 3-D surface and (H) contour of SEA.
Figures 9A,C,G show visual representations of the width (
Figure 9E shows the height (
Consequently, designing an elliptical cut-out as a crush initiator in square steel tubes is a complex task because enhancing one crashworthiness performance indicator may compromise another. Hence, the optimization process is crucial for attaining an energy absorber that exhibits the highest performance across all crashworthiness indicators.
Designing an energy-absorbing tube with a square steel shape and crushing it to achieve a high CFE while maintaining an SEA is challenging. The design process must reflect all the crashworthiness performance indices. Typically, the design of an energy absorber aims to minimize the PF and maximize the MCF, CFE, and SEA. These input parameters are set within a specified range to achieve various optimization objectives (Djamaluddin, 2023). The weights and importance factors for all responses were uniform because all crashworthiness performance indicators were regarded as equal in this design. Eq. 13 expresses the expression for multiobjective optimization.
Figure 10 shows the ramp function of the optimization results. By employing an RSM for the optimization, optimal outcomes for the dimensions and positions of the elliptical crush initiator were obtained, with a height of 15 mm, width of 24.784 mm, and distance of 15.08 mm. The optimum values corresponding to these points for the PF, MCF, CFE, and SEA were 200.94 kN, 112.78 kN, 0.564, and 13.70 kJ/kg, respectively. The optimization results revealed an overall desirability (
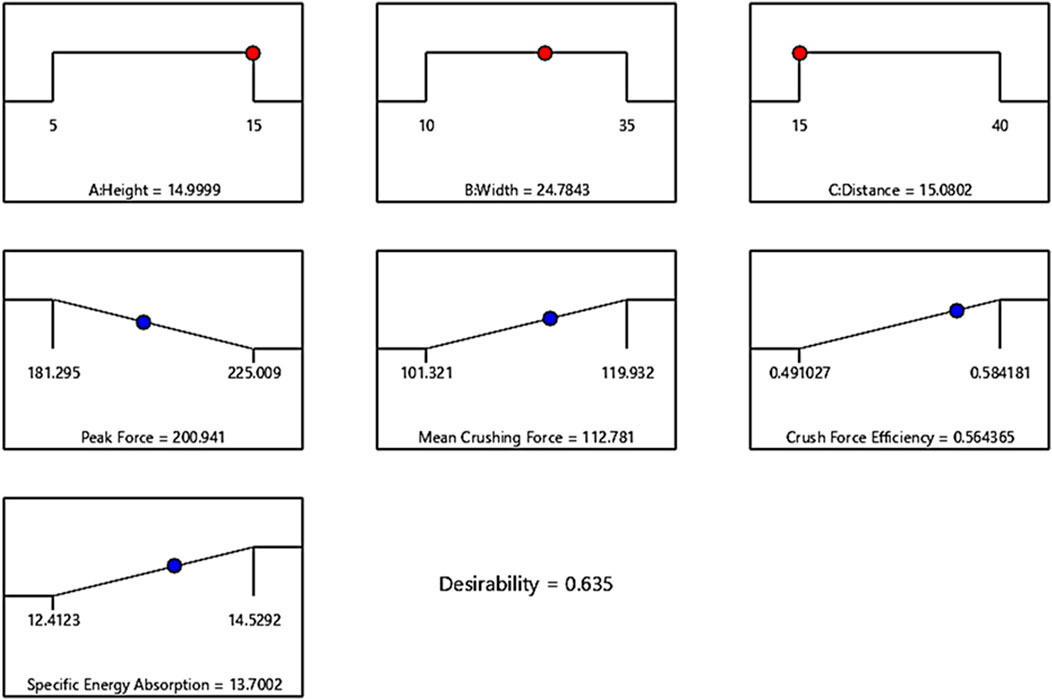
FIGURE 10. Ramp function of optimization results.
The dimensions and positions of the optimized elliptical crush initiator were verified through finite element simulations, as shown in Figure 11. Figure 12 shows the deformation patterns that matched the selected points during the impact test. The highest error between the optimization outcome using the RSM and that employing the finite element method was 4.8% for the CFE. This level of disparity is deemed acceptable.
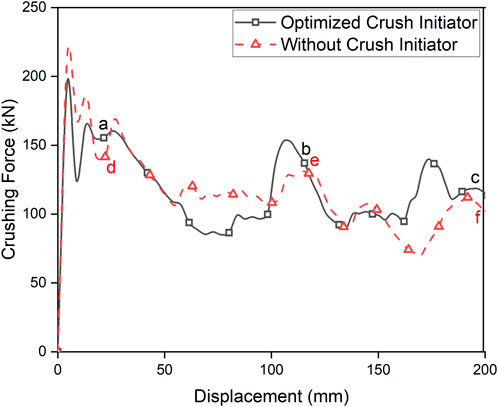
FIGURE 11. Validation of optimization results using finite element.
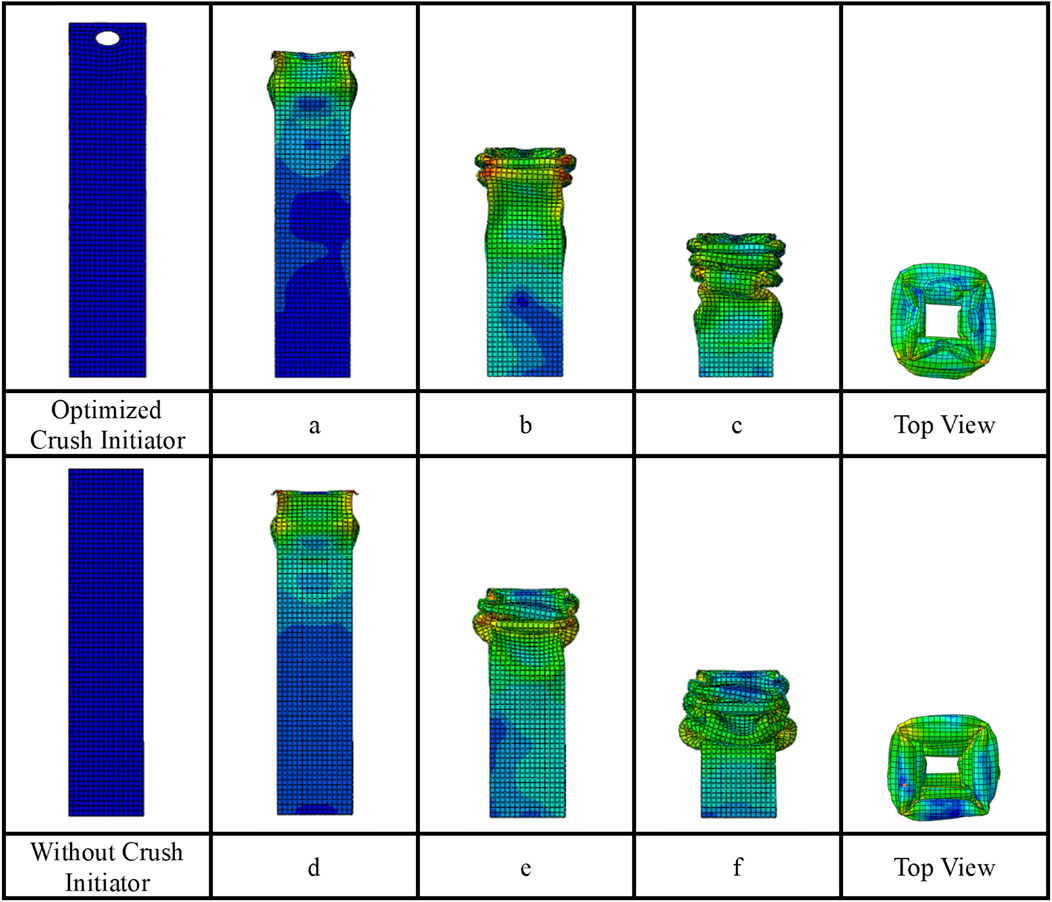
FIGURE 12. Collapse profile of square tube with optimized crush initiator and without crush initiator.
The finite element simulation results for the PF, MCF, CFE, and SEA obtained using the optimized dimensions and position of an elliptical cut-out were 195.06 kN, 115.3 kN, 0.591, and 13.89 kJ/kg, respectively. Based on finite element simulations, it was found that the optimal incorporation of crush initiators determined using the RSM resulted in a 10.12% decrease in PF, a 13.67% increase in CFE, and a 2.23% increase in MCF. However, these outcomes were offset by a slight decrease of 0.82% in the SEA.
This study focuses on the numerical analysis of how the dimensions and distance of an elliptical crush initiator positioned at the top end of a square tube influence its crashworthiness performance. The RSM was used in this study to predict the outcomes and evaluate the impacts of the geometric inputs on the PF, MCF, CFE, and SEA. The experiment involved selecting three input parameters and employing a face-centered CCD to observe their effects on the various responses. The RSM approach favors a quadratic process order. Based on the results of this study, several conclusions can be drawn. Various input parameters have varying significances for different responses. The squared distance input parameter most significantly impacted PF, and the distance input parameter had the greatest influence on the MCF. The interaction between height and distance influences the CFE, and the distance input parameter significantly influences the SEA.
The RSM optimization process yielded an optimal elliptical crush initiator geometry with a height of 15 mm, width of 24.784 mm, and distance of 15.08 mm from the top end. The results were validated using finite element analysis. Based on these data points, the optimal values for PF, MCF, CFE, and SEA were determined as 195.06 kN, 115.3 kN, 0.591, and 13.89 kJ/kg, respectively, consistent with the collected data. The findings of this study are consistent with this objective, except for a slight decrease in SEA. This finding suggests that the optimized elliptical crush initiator effectively enhances the crashworthiness performance while preserving the SEA. Therefore, RSM has been successfully applied to determine the dimensions and positioning of elliptical crush initiators in thin-walled square-tube structures. Hence, future research can focus on detailed analysis of the variations in geometrical inputs observed in this study by incorporating additional modifications to the cross-sectional profile of the tube and the number of elliptical cutouts. This possibility has been previously mentioned and provides opportunities for further investigation.
The original contributions presented in the study are included in the article/Supplementary Material, further inquiries can be directed to the corresponding author.
MH: Conceptualization, Methodology, Software, Validation, Visualization, Writing–original draft, Writing–review and editing. JI: Conceptualization, Funding acquisition, Methodology, Supervision, Writing–review and editing. NN: Methodology, Software, Visualization, Writing–review and editing.
The author(s) declare financial support was received for the research, authorship, and/or publication of this article. We express our sincere gratitude for the financial assistance received from Direktorat Riset dan Pengembangan Universitas Indonesia in the form of a research grant through Hibah Publikasi Terindeks Internasional (PUTI) Pascasarjana UI 2023-2024 (Grant Number: NKB-260/UN2.RST/HKP.05.00/2023).
Furthermore, we thank the High-Performance Computing Laboratory—National Research and Innovation Agency (BRIN) of the Republic of Indonesia for permitting the use of their ABAQUS software.
The authors declare that the research was conducted in the absence of any commercial or financial relationships that could be construed as a potential conflict of interest.
All claims expressed in this article are solely those of the authors and do not necessarily represent those of their affiliated organizations, or those of the publisher, the editors and the reviewers. Any product that may be evaluated in this article, or claim that may be made by its manufacturer, is not guaranteed or endorsed by the publisher.
The Supplementary Material for this article can be found online at: https://www.frontiersin.org/articles/10.3389/fmech.2023.1273447/full#supplementary-material
Abramowicz, W., and Jones, N. (1984). Dynamic axial crushing of square tubes. Int. J. Impact Eng. 2 (2), 179–208. doi:10.1016/0734-743X(84)90005-8
Altin, M., Güler, M. A., and Mert, S. K. (2017). The effect of percent foam fill ratio on the energy absorption capacity of axially compressed thin-walled multi-cell square and circular tubes. Int. J. Mech. Sci. 131, 368–379. doi:10.1016/j.ijmecsci.2017.07.003
Anderson, M. J., and Whitcomb, P. J. (2017). DOE simplified: Practical tools for effective experimentation. United States: CRC Press.
Anderson, M. J., and Whitcomb, P. J. (2007). Using graphical diagnostics to deal with bad data. Qual. Eng. 19 (2), 111–118. doi:10.1080/08982110701241434
Asanjarani, A., Mahdian, A., and Dibajian, S. H. (2018). Comparative analysis of energy absorption behavior of tapered and grooved thin-walled tubes with the various geometry of the cross section. Mech. Adv. Mater. Struct. 27 (8), 633–644. doi:10.1080/15376494.2018.1488311
Balaji, G., and Annamalai, K. (2017). An experimental and numerical scrutiny of crashworthiness variables for square column with V-notch and groove initiators under quasi-static loading. Cogent Eng. 4 (1). doi:10.1080/23311916.2017.1364118
Chakule, R. R., Chaudhari, S. S., and Talmale, P. (2017). Evaluation of the effects of machining parameters on MQL based surface grinding process using response surface methodology. J. Mech. Sci. Technol. 31 (8), 3907–3916. doi:10.1007/s12206-017-0736-6
Cheng, Q., Altenhof, W., and Li, L. (2006). Experimental investigations on the crush behaviour of AA6061-T6 aluminum square tubes with different types of through-hole discontinuities. Thin-Walled Struct. 44 (4), 441–454. doi:10.1016/j.tws.2006.03.017
Dadrasi, A., Albooyeh, A., Fooladpanjeh, S., Shad, M. D., and Beynaghi, M. (2020). RSM and ANN modeling of the energy absorption behavior of steel thin-walled columns: a multi-objective optimization using the genetic algorithm. J. Braz. Soc. Mech. Sci. Eng. 42 (11), 563. doi:10.1007/s40430-020-02643-5
Deshwal, S., Kumar, A., and Chhabra, D. (2020). Exercising hybrid statistical tools GA-RSM, GA-ANN and GA-ANFIS to optimize FDM process parameters for tensile strength improvement. CIRP J. Manuf. Sci. Technol. 31, 189–199. doi:10.1016/j.cirpj.2020.05.009
Dionisius, F., Istiyanto, J., Sumarsono, D. A., Prayogo, G., Baskoro, A. S., and Malawat, M. (2022). Modeling of crashworthiness criteria based on variation of hole as crush initiator in thin-walled square. Int. J. Automot. Mech. Eng. 19 (1), 9487–9497. doi:10.15282/ijame.19.1.2022.12.0731
Djamaluddin, F. (2023). Finite element analysis and optimization of foam filled fender under quasi static and dynamic responses. Front. Mech. Eng. 9, 1091345. doi:10.3389/fmech.2023.1091345
Estrada, Q., Szwedowicz, D., Rodriguez-Mendez, A., Elías-Espinosa, M., Silva-Aceves, J., Bedolla-Hernández, J., et al. (2019). Effect of radial clearance and holes as crush initiators on the crashworthiness performance of bi-tubular profiles. Thin-Walled Struct. 140, 43–59. doi:10.1016/j.tws.2019.02.039
Guler, M. A., Cerit, M. E., Bayram, B., Gerceker, B., and Karakaya, E. (2010). The effect of geometrical parameters on the energy absorption characteristics of thin-walled structures under axial impact loading. Int. J. Crashworthiness 15 (4), 377–390. doi:10.1080/13588260903488750
Hawkins, D. M. (2004). The problem of overfitting. J. Chem. Inf. Comput. Sci. 44 (1), 1–12. doi:10.1021/ci0342472
Huang, M. Y., Tai, Y. S., and Hu, H. T. (2010). Dynamic crushing characteristics of high strength steel cylinders with elliptical geometric discontinuities. Theor. Appl. Fract. Mech. 54 (1), 44–53. doi:10.1016/j.tafmec.2010.06.014
Kallath, H., Lee, J. S., Kholi, F. K., Ha, M. Y., and Min, J. K. (2021). A multi-objective airfoil shape optimization study using mesh morphing and response surface method. J. Mech. Sci. Technol. 35, 1075–1086. doi:10.1007/s12206-021-0221-0
Lacy, J. (2010). Optimization-based constitutive parameter identification from Sparse Taylor cylinder data. Idaho Falls, ID (United States): Idaho National Lab.
Li, Z., Rakheja, S., and Shangguan, W. B. (2019). Study on crushing behaviors of foam-filled thin-walled square tubes with different types and number of initiators under multiple angle loads. Thin-Walled Struct. 145. doi:10.1016/j.tws.2019.106376
Malawat, M., Sumarsono, D. A., Istiyanto, J., Prayogo, G., and Dionisius, F. (2019). Theoretical prediction of dynamic axial crushing on a square tube with eight holes used as a crush initiator. Int. J. Technol. 10 (5), 1042–1055. doi:10.14716/ijtech.v10i5.2297
Maqsood, K., Ali, A., Ilyas, S. U., Garg, S., Danish, M., Abdulrahman, A., et al. (2022). Multi-objective optimization of thermophysical properties of multiwalled carbon nanotubes based nanofluids. Chemosphere 286, 131690. doi:10.1016/j.chemosphere.2021.131690
Nagaraju, S., Vasantharaja, P., Chandrasekhar, N., Vasudevan, M., and Jayakumar, T. (2016). Optimization of welding process parameters for 9Cr-1Mo steel using RSM and GA. Mater. Manuf. process. 31 (3), 319–327. doi:10.1080/10426914.2015.1025974
Nghia, N. C., Dirgantara, T., Gunawan, L., Putra, I. S., and Anh, L. H. (2013). “Analytical prediction of square crash box structure with holes due to impact loading,” in Proceeding of The Regional Conference on Mechanical and Manufacturing Engineering (RCMME), Kuala Lumpur, Malaysia, 25th November 2013.
Razazan, M., Rezvani, M. J., and Souzangarzadeh, H. (2018). Evaluation of the performance of initiator on energy absorption of foam-filled rectangular tubes: experimental and numerical assessment. Exp. Tech. 42 (2), 129–139. doi:10.1007/s40799-017-0206-1
Rezvani, M. J., and Jahan, A. (2015). Effect of initiator, design, and material on crashworthiness performance of thin-walled cylindrical tubes: A primary multi-criteria analysis in lightweight design. Thin-Walled Struct. 96, 169–182. doi:10.1016/j.tws.2015.07.026
Rogala, M., Ferdynus, M., Gawdzińska, K., and Kochmański, P. (2021a). The influence of different length aluminum foam filling on mechanical behavior of a square thin-walled column. Materials 14 (13). doi:10.3390/ma14133630
Rogala, M., Gajewski, J., and Górecki, M. (2021b). Study on the effect of geometrical parameters of a hexagonal trigger on energy absorber performance using ann. Materials 14 (20). doi:10.3390/ma14205981
Sahoo, P. (2011). Optimization of turning parameters for surface roughness using RSM and GA. Adv. Prod. Eng. Manag. 6 (3), 197–208.
Subramaniyan, S. K., Kananasan, A. K., Yunus, M. R. M., Mahzan, S., and Ghazali, M. I. (2014). Crush characteristics and energy absorption of thin-walled tubes with through-hole crush initiators. Appl. Mech. Mater. 606, 181–185. doi:10.4028/www.scientific.net/AMM.606.181
Sun, G., Pang, T., Xu, C., Zheng, G., and Song, J. (2017). Energy absorption mechanics for variable thickness thin-walled structures. Thin-Walled Struct. 118, 214–228. doi:10.1016/j.tws.2017.04.004
Tarlochan, F., Samer, F., Hamouda, A. M. S., Ramesh, S., and Khalid, K. (2013). Design of thin wall structures for energy absorption applications: enhancement of crashworthiness due to axial and oblique impact forces. Thin-Walled Struct. 71, 7–17. doi:10.1016/j.tws.2013.04.003
Keywords: crashworthiness, optimization, response surface methodology, finite element, crush initiator
Citation: Hafid M, Istiyanto J and Nasruddin N (2023) Multiobjective optimization of dimension and position of elliptical crush initiator on crashworthiness performance of square tube using response surface methodology. Front. Mech. Eng 9:1273447. doi: 10.3389/fmech.2023.1273447
Received: 06 August 2023; Accepted: 25 September 2023;
Published: 06 October 2023.
Edited by:
Yue Yu, Lehigh University, United StatesCopyright © 2023 Hafid, Istiyanto and Nasruddin. This is an open-access article distributed under the terms of the Creative Commons Attribution License (CC BY). The use, distribution or reproduction in other forums is permitted, provided the original author(s) and the copyright owner(s) are credited and that the original publication in this journal is cited, in accordance with accepted academic practice. No use, distribution or reproduction is permitted which does not comply with these terms.
*Correspondence: Jos Istiyanto, am9zaXN0QGVuZy51aS5hYy5pZA==
Disclaimer: All claims expressed in this article are solely those of the authors and do not necessarily represent those of their affiliated organizations, or those of the publisher, the editors and the reviewers. Any product that may be evaluated in this article or claim that may be made by its manufacturer is not guaranteed or endorsed by the publisher.
Research integrity at Frontiers
Learn more about the work of our research integrity team to safeguard the quality of each article we publish.