 Kristopher Olshefski
 Addison Collins1
94% of researchers rate our articles as excellent or good
Learn more about the work of our research integrity team to safeguard the quality of each article we publish.
Find out more
ORIGINAL RESEARCH article
Front. Mech. Eng., 30 September 2022
Sec. Turbomachinery
Volume 8 - 2022 | https://doi.org/10.3389/fmech.2022.951986
This article is part of the Research TopicParticulate Laden Flows in Turbomachinery and ConsequencesView all 4 articles
Sand and dust particle ingestion is an inevitability for aircraft operating in arid environments. For conventional takeoff and landing aircraft, significant dust can be ingested into the gas turbine powerplant. Helicopters and vertical takeoff and landing (VTOL) aircraft are at especially high risk due to their tendency to blow significant debris into the air during takeoff and landing operations. The present study highlights the development of an anisokinetic particle sampling probe for use in aircraft engines to obtain real-time measurement of ingested particles often present in these harsh environments. Offtake of particles during engine operation in dusty conditions will provide researchers with an improved understanding of particle breakage tendency and component erosion susceptibility. Three foundational studies were conducted to establish a baseline understanding of probe performance: an aerodynamic study, a particle tracking study, and a particle sampling study. These studies were performed using the Free Jet rig at the Advanced Propulsion and Power Laboratory at Virginia Tech. Particles as large as 1.3 mm were sampled at Mach numbers where M = (0.25, 0.70) and yaw angles ranging from 0° to 45° relative to freestream, conditions not previously investigated. Results indicate that the probe operates sub-isokinetically throughout the full range of test conditions and that probe aerodynamic capture efficiency is inversely proportional to both Mach number and yaw angle. However, this efficiency limitation does not notably influence the sampling probe’s ability to capture the test dust of interest. While the presence of the probe in the flow does result in an airflow velocity reduction of up to 55%, due to their relatively large Stokes numbers the particles of interest only experience a decrease of roughly 5%. These results indicate that this probe is capable of providing researchers with valuable particle size and shape information through effective particle sampling at particle sizes (100 μm ≤ dp ≤ 1,300 μm) and speeds (M ≥ 0.25) not previously investigated.
Solid particulate ingestion while operating in harsh environments has been shown to hinder the performance of gas turbine engines. The source of these particulates can vary from ash to sand to dust. In severe cases, ingestion of particles can be the main cause of temporary engine flameout and possible permanent engine failure. A flameout is an instance where the flame in the combustion chamber of a jet engine has been extinguished, resulting in a total loss of power (Chambers, 1985; Campbell, 1994). For conventional takeoff and landing aircraft, significant dust can be ingested into the gas turbine powerplant. As a key historical example, a Lockheed L-100 aircraft encountered two engine failures and two temporary engine flameouts while flying over Mount St. Helens after a volcanic eruption (Mitchell and Gilmore, 1982). All four engines showed signs of melted dust in the turbine section and severe abrasion in the compressor section. In December 1989, the volcanic eruption of Mt. Redoubt sent ash clouds more than 30,000 feet into the atmosphere (Neal et al., 1997). Operating in nearby Anchorage, a KLM Royal Dutch Airlines Boeing 747–400 equipped with four General Electric CF6-80C2 engines inadvertently entered the ash cloud and experienced a four engine flameout causing the flight crew to make an emergency landing (Daw, 1992). All four engines from the aircraft were replaced, costing the airline over 80 million dollars in replacements and repairs (Miller, 1996). Helicopters and vertical takeoff and landing (VTOL) aircraft are at especially high-risk due to their tendency to blow significant debris into the air during takeoff and landing operations. This is a continuing concern for US Naval operations. In 2015, an MV-22 Osprey crashed during a training exercise in Hawaii, claiming the lives of two US Marines and injuring twenty other personnel (Whittle, 2015). The cause of the fatal crash was attributed to dust ingestion resulting in an engine failure.
There currently exists a limited understanding of how ingested particles traverse engines after entering the inlet section. Researchers are interested in investigating the behavior of sand particles as they traverse an aircraft engine compressor. To this end, a particle sampling probe is under continued development and initial analysis has been conducted using a high-speed free jet laden with particles. In subsequent studies, this probe will be installed in the compressor section of an engine operating in a particle-laden environment. This environment governs design considerations for the sampling probe. The anisokinetic particle sampling probe designed for this study is capable of effectively capturing highly poly-dispersed test dust MIL E-5007C at speeds where M = (0.25, 0.70) and at yaw angles θ ≤ 45°. Additionally, efforts have been made to determine the time-averaged particle concentration from these samples. The work contained herein is presented as follows: Section 2 outlines the materials and facilities used during the investigation, Section 3 details the three experimental campaigns and, Section 4 presents the results of these experiments and discusses their implications. Finally, Section 5 provides conclusions which can be drawn from these findings.
For particles suspended in flow, a primary metric of characterization is the particle Stokes number where
and τp is the momentum response time of a particle and the characteristic time scale of the carrier phase is τf. The particle response time is defined as
where ρp is the fluid density, dp is the particle diameter, μf is the dynamic viscosity of the fluid, and C is the non-Stokesian correction factor
The particle Reynolds number, Rep is
and |u − v| is the relative velocity of the particle with respect to the fluid (Varaksin, 2007). We define the characteristic timescale of the flow as
where UB is the bulk velocity of the jet, and Ds is the probe outer diameter. This definition of Stokes number assumes the particle is spherical but is the standard definition used in relevant literature (Varaksin, 2007; Crowe, 2005). The particle Stokes number can be thought of as a representation of how quickly a particle responds to changes within a flow field. For Stokesian particles (St ≤ 1), particle response times are short enough to allow particle trajectories to match fluid streamlines. Conversely, ultra-Stokesian particles with longer particle response times react more slowly to changes in a flow field.
During these studies two ranges of glass microspheres were used to assess the baseline performance of the sampling probe. These particles were selected with two purposes: providing an experimental control by limiting particle size to a small range of diameters, and ensuring consistent particle behavior through uniform shape distribution. Glass microspheres were chosen for their regular shape and tight size distribution at nominal diameters of 3–6 μm and 65–75 μm. We will refer to the 3–6 μm spheres as small spheres and the 65–75 μm as large spheres moving forward. By collecting samples of the glass microspheres, researchers are able to study fundamental probe behavior and eliminate uncertainties that would otherwise arise from highly poly-dispersed size and shape characteristics of typical test dusts. The batches of small and large spheres are characterized by the particle size distribution (PSD) graphs in Figures 1A,B. The microscopic images of microspheres in Figures 2A,B display the uniformity of the samples. This uniformity is contrasted in Figure 2C which shows the diversity of shapes and sizes seen in the test dust (C-Spec) sample. Researchers found that the particles are prone to clumping due to ambient moisture absorption. Therefore, samples were dried in an oven 24 h before being used in jet studies. Using the above analysis, the small glass spheres are found to have a Stokes number of St = 3.5 at M = 0.25 and St = 9.75 for M = 0.70. The large glass spheres were found to have St = 842 where M = 0.25 and St = 2357 for M = 0.70. This analysis assumes no slip exists between the particles and the flow. In reality, some slip will occur and will result in a reduced Stokes number. This estimate is therefore taken as a limiting case.
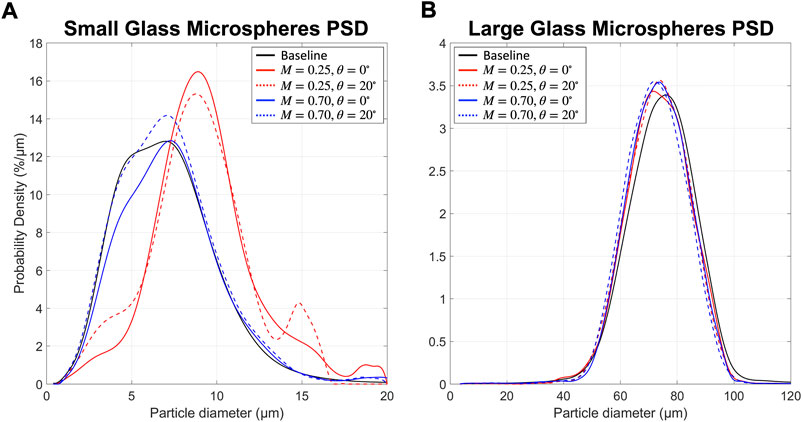
FIGURE 1. Glass microsphere particle size distributions (PSD) for small microspheres (A) and large microspheres (B).
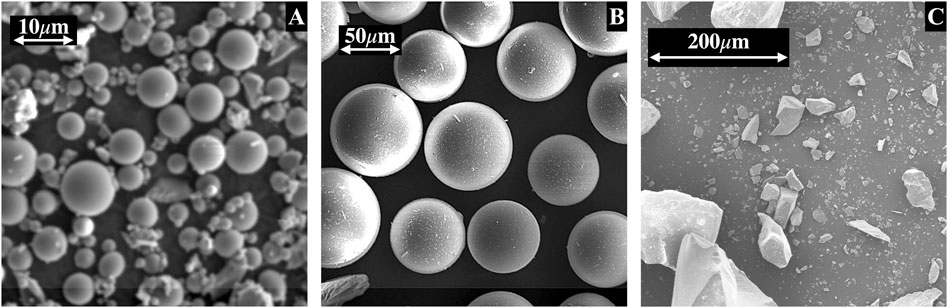
FIGURE 2. Detailed imagery of small glass spheres (A), large glass spheres (B), and C-Spec sand (C).
Particle size and shape measurements are conducted using a Microtrac CAMSIZER X2. The CAMSIZER X2 is rated to measure particles ranging in size from 0.8 μm to 8 mm. The system utilizes dual cameras to illuminate a particle flow path. Then, an LED stroboscopic light source and two high-resolution cameras capture photos which are then evaluated in real-time to provide particle information. The key feature of this particular model, which makes it ideal for the current research, is its use of Dynamic Image Analysis (DIA). With this feature the unit employs two cameras of different magnifications to make measurements of a wide range of particle sizes without compromising accuracy. From the Microtrac and included software, researchers can determine the various particle shape coefficients and particle size distribution of a given sample.
The medium of interest for engine tests is test dust MIL E-5007C, commonly referred to as C-Spec, which is a commercially available crushed quartz mixture. The material is chosen for its wide particle size distribution which is representative of dusts encountered by aircraft. Particle sizes of C-Spec range from 50 to 1,300 μm. Particle size distribution is provided by the manufacturer on a mass basis with 50% of particles larger than 200 μm and 3% of particles smaller than 75 μm. Therefore, conducting a Stokes analysis using Eq. 1 provides that particles which are smaller than 2.5 μm can be expected to fall within the Stokesian regime at velocities corresponding to M = 0.25 and particles which are 1.5 μm or smaller will remain Stokesian at M = 0.70. This accounts for less than 1% of particles of interest. Instead, average size particles (250 μm) will experience Stokes numbers ranging from 850 ≤ St ≤ 1,170 where 0.25 ≤ M ≤ 0.70, which is considerably higher than ranges explored by previous studies and indicates that particle inertia is significant relative to the forces acting on them by the surrounding fluid.
Material analysis conducted by the Virginia Tech Petrology Lab utilized X-ray diffraction to determine the relative constituents of each particle variety. They found that the C-Spec sample is over 99% quartz and less than 1% microcline. Being almost entirely quartz, the density of C-Spec is assumed to be 2650 kg/m3. The glass microspheres are composed completely of soda-lime-silica, with a density of 2500 kg/m3. While the particles in this research are largely silica-based, this is not a requirement for the sampling probe as it is also capable of sampling a wide range of particle types. For example, AFRL-03, which has large quantities of non-silica constituents such as gypsum and dolomite, should be sampled with similar performance (Poursaeidi et al., 2018).
Isokinetic sampling systems are the standard method for capturing particulate samples from a moving gas stream. Achieving an isokinetic condition requires that the sampling probe be aligned isoaxially with the free stream and that the velocity at which the probe samples be equal to the undisturbed local flow velocity (Soo, 2013). In this scenario, particles which are entrained in the flow upstream of the probe do not “feel” the effects of a body immersed in the flow. This ensures an undistorted stream tube upstream of the probe and assures particles flow smoothly into the probe.
While an isokinetic condition presents an ideal sampling scenario, this arrangement is rarely realized for practical flow applications. Instead, an anisokinetic condition occurs when sampling velocity does not match the bulk velocity, the sampling plane is not perpendicular to the free stream, or both. Flows with unsteady velocity fields, such as the flow field within a rotating compressor as is the focus of this work, make it impractical to reliably match the sampling velocity to that of the free stream. These cases motivate an investigation of the effects of anisokinetic conditions on the deviation from ideal measurement capability. The anisokinetic condition can be subdivided into three categories: super-isokinetic, sub-isokinetic, and misalignment. If we consider that the Stokes number provides information about how well a particle’s trajectory follows flow streamlines, it is evident from the figure that small Stokesian particles will be over-sampled in a super-isokinetic condition. Those same particles will be under-sampled in a sub-isokinetic condition. Conversely, large particles (St ≫ 1) are inertially driven and are unaffected by the presence of the probe. Therefore, the mass flow measurement of very large particles is independent of the isokineticity. This conclusion is confirmed by Hemeon and Haines (1954).
The design of this probe is constrained by factors of the environment where the probe will be operating. Of primary concern is the confined space of the compressor where the probe will be installed. Researchers at Virginia Tech have recently commissioned an engine test stand facility which is specifically designed to study sand ingestion. The test stand operates a Rolls-Royce M250-C20B turboshaft engine. The particle sampling probe will be installed within a stator row of the engine’s six-stage axial compressor. This region limits the size of the sampling probe. Prior particle sampling probe configurations would not be suitable for this geometry as typical geometries may be as large as six inches in the streamwise length (Heo et al., 2018a; Heo et al., 2018b; Briones et al., 2008). Material selection is also an important consideration for this work. While a material such as steel or titanium may have strength characteristics for withstanding the forces of high-speed flow, a probe dislodging event would have disastrous consequences. For this reason, the probe was constructed from polycarbonate tubing, bent at 90°, and fitted with a steel collar for additional support. Figure 3A shows the developed probe next to an early prototype. The internal diameter of the probe is 2 mm, the external diameter of the probe is 4 mm, and the axial length of the probe is approximately 20 mm as shown by Figure 3B. Lastly, it is well known that a sharp edge is preferred for particle sampling probes (Whiteley and Reed, 1959; Davis, 1972; Fuchs, 1975). To achieve this and increase the capture area, the sampling probe is given an internal chamfer rather than a more traditional external chamfer. This increases the effective capture area of the probe while maintaining a sharp tip. During the development process, researchers modified the probe design from an internal chamfer angle (ψ) of 45°–30° to reduce the likelihood of particle ejection from the probe after impact. Therefore, additional aerodynamic studies were conducted to compare the performance of each configuration.
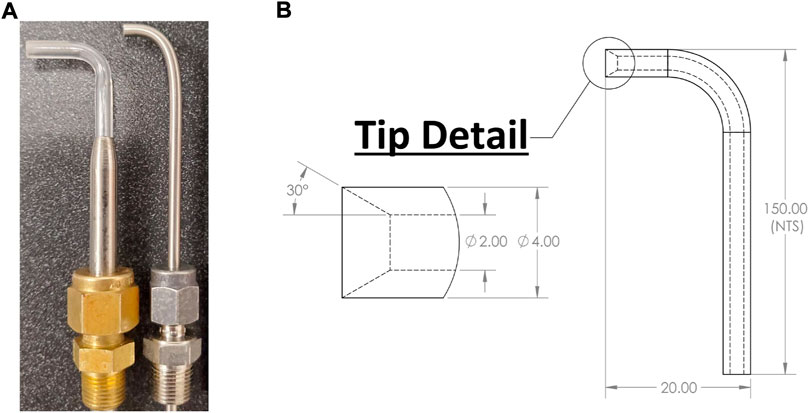
FIGURE 3. Sampling probe (left) placed next to early steel prototype (A) and probe dimensions in mm (B).
The data obtained for all investigations was collected using the Free Jet rig at the Advanced Propulsion and Power Laboratory (APPL) at Virginia Tech seen in Figure 4A. The jet uses facility compressed air supply to accelerate flow through various nozzle configurations to reach desired flow conditions. Flow enters the assembly through impinging jets and passes through a mixing section with a diameter of 200 mm before being reduced down to 100 mm. The flow progresses through several screens and honeycomb structures which condition the flow. For these studies, test particles were then seeded into the flow in a plenum section and accelerated out of a 50.8 mm diameter converging nozzle as shown in Figure 5. The rig is controlled using a National Instruments cDAQ-9184 chassis and Scanivalve Corp. ZOC17IP/8x-APC pressure transducer which provides pressure measurements for flow condition calculations. As seen in Figure 4B, the particle sampling probe is placed directly downstream of the Free Jet nozzle exit at the jet centerline. Additional information about the Virginia Tech Free Jet can be found in (Mayo et al., 2017; Saltzman et al., 2020).
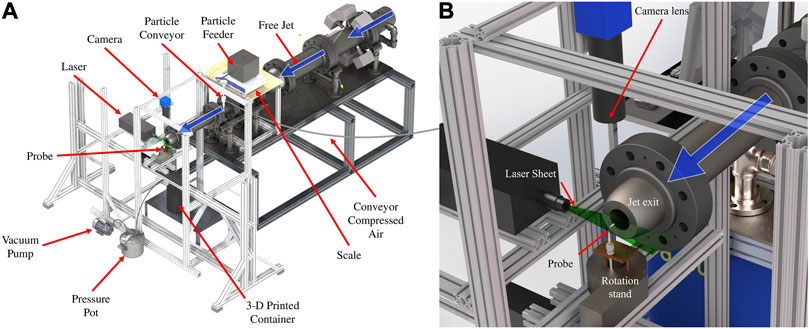
FIGURE 4. Virginia Tech Free Jet rig (A) and detailed perspective of probe experiment setup (B).
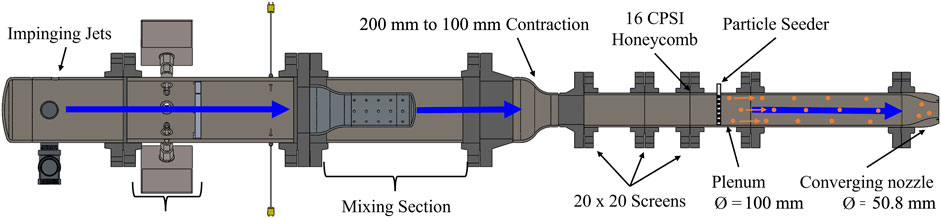
FIGURE 5. Detailed section view of the Virginia Tech Free Jet.
For these studies, the probe was positioned using a Velmex rotation stage which ensured the consistent axial location of the probe face and rotated the probe to a desired yaw angle. The stand was used to rotate the probe at various yaw angles with respect to the flow streamwise direction and was modified so that the probe would rotate about the probe tip, so the location of the probe inlet would not change with respect to the jet. The modification on the rotation stage also allows the probe to be moved up and down by loosening a compression fitting to accomodate sampling at various radial locations. We define the non-dimensional radial location as the ratio of position (r) and jet outer radius (r0) where
For tests where suction pressure was applied to the probe, a vacuum pump and intermediate plenum were positioned downstream of a particle sampling container as described in Section 2.3.4.
Two different seeding apparatuses were used, one for seeding Di-Ethyl-Hexyl-Sebacate (DEHS) oil particles used for flow field measurements with particle image velocimetry (PIV), and another for seeding C-Spec particles and glass spheres for the particle tracking velocimetry (PTV) study and concentration sampling experiment. These DEHS particles are commonly used in PIV studies as they aerosolize to diameters less than 1 μm, which is ideally suited for this application (Adrian and Westerweel, 2011).
For the PTV and concentration sampling experiment, an AccuRate particle feeder was used to provide a constant flow of particles into the jet. The particle feeder sits atop a Fristaden Lab scale, and the weight of the feeder is recorded before and after each run to calculate the mass of sand which was introduced to the jet during the run. This was done to ensure a consistent feed rate throughout all tests. The feeder and scale are secured to a platform above the jet plenum. The feeder has a hopper that is filled with particles, and a rotating helix transports the sand from the bottom of the hopper through a nozzle where particles exit. At its maximum setting, the particle feeder can introduce C-Spec particles at approximately 10 g/min. Upon exiting the sand feeder nozzle, the particles fall into a small funnel which leads into an Exair Line Vac pneumatic particle conveyor. The Line Vac works as follows:
1. Facility compressed air is driven through an inlet section into an annular plenum chamber.
2. The flow is directed into the throat through focused nozzles.
3. The resulting jet creates a vacuum near the intake of the conveyor section.
4. The vacuum draws in particles which are then carried through the seeder and into the jet.
The Line Vac creates a vacuum of −29.9 kPa given a supply pressure of 552 kPa. This vacuum pressure was found to be sufficient to force particles into the jet without backflow. Particles enter the jet through the seeder, which is inserted into an orifice in the side of the free jet plenum. The seeder is a tube with seventeen 2.5 mm holes along one side to accomodate particle dispersion. The tube is oriented with the holes facing upstream to maximize mixing of the particles with the airflow. The particle feeder, conveyor, and seeder are all used in conjunction with the free jet to supply a particle laden jet flow to the sampling probe.
Researchers required that particle samples be contained and stored for further analysis without any particle loss, whether to the suction source or from bouncing out of the sampling container. To this end, a sample containment system was developed and is shown in Figure 6. Anti-static tubing was connected to the bottom of the sampling probe, leading to a collection jar. To create a negative pressure environment, the jar was placed inside of a 3-D printed black cylindrical container. The lid of this container has two holes, one through which the tubing could connect from the probe to the jar, and another with tubing leading to a suction source. The suction source consisted of a vacuum pump and plenum (pressure pot), with the vacuum pressure in the plenum reaching about −50 kPa. To prevent particles from escaping the jar, the jar’s lid was kept on, but two holes were created in the jar lid, one for the particle tubing, and the other for air to escape to the suction source, with the second hole of the jar lid being covered with a 20 μm paper filter to prevent particles from escaping. The 3-D printed container made it easy to see if particles had escaped the jar, being easily visible if strewn about the black container.
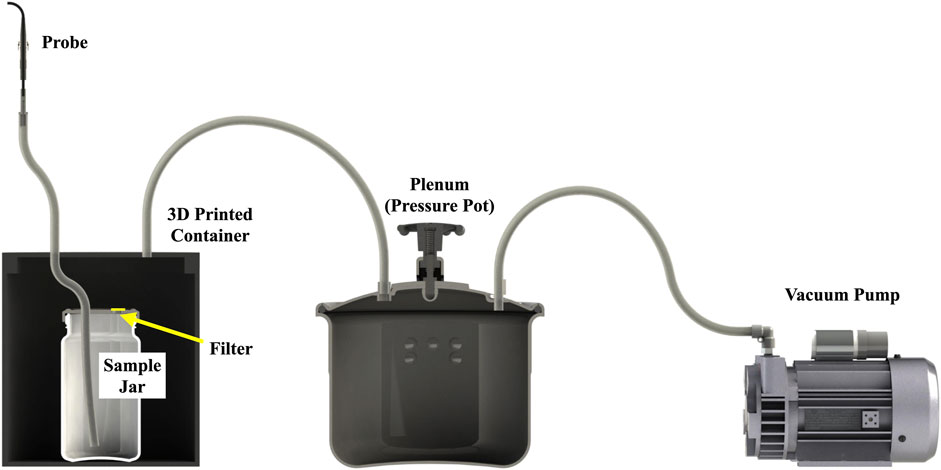
FIGURE 6. Particle containment system.
For all experimental studies, the particle sampling probe face was positioned 2.54 cm downstream of the free jet nozzle exit. Unless otherwise stated, it may be assumed that the probe was positioned at jet centerline. Under these conditions it is sufficient to assume the probe is well within the potential core of the jet and a uniform velocity field exists within the relevant proximity.
The primary metric used to evaluate the aerodynamic performance of the probe is the aspiration efficiency (Ae) described as
where As is the frontal projected area of the probe and A0 is the area of the undisturbed streamtube. This ratio provides insight into the probe’s ability to sample small particles with St < 1. The probe operating under the sub-isokinetic regime results in Ae < 1. Here, streamlines will diverge near the probe inlet, causing Stokesian particles to be undersampled. Conversely, the probe operating under super-isokinetic conditions results in Ae > 1, which means the streamlines will converge near the probe inlet, causing smaller particles to be oversampled. The first desire regarding this efficiency is that it be known, in which case it is a calibration quantity. If the efficiency is unknown or changes from the calibration, then uncertainties are incurred in the sampled particle distribution. Finally, the extreme case of very low efficiency will yield statistically insufficient samples of particles (or take an excessively long time to acquire data).
The aerodynamic characteristics of the sampling probe were assessed through planar, two-component PIV measurements conducted in the previously described Free Jet rig. The jet was brought to the desired flow rate and atomized DEHS oil particles were seeded into the jet using a Laskin nozzle. This nozzle uses shear forces to atomize the DEHS oil into droplets with a nominal diamter of less than a micron (Kähler et al., 2002). The shearing process in the Laskin nozzle plenum was controlled using compressed nitrogen at 415 kPa for Mach 0.25 flows and 485 kPa for Mach 0.70 flows. Next, an EverGreen2 dual, pulsed, frequency-doubled Nd:YAG laser with up to 200 mJ output at 532 nm wavelength was formed into a sheet intersecting the sampling probe as shown in Figure 4B and pulsed at a predetermined interval. A LaVision Imager sCMOS CLHS camera, positioned above the probe and facing downward, then took an image for each pulse, and created image pairs of subsequent images. These image pairs were then analyzed using LaVision DaVis 8.4 software. After initial processing within DaVis, velocity field data was exported to MATLAB where the non-physical data was removed and the time-averaged velocity field was constructed with the remaining data. This time-averaged data was then used by a separate MATLAB script to compute velocity streamlines as seen in Figures 7–9, which were in turn used to calculate the stream tube from the far-field to the probe face. This streamtube can then be used to calculate probe aspiration efficiency. There were two general conditions present in these experiments: 1) unaltered probe exit and 2) probe exit under an induced suction of −50 kPa. The objective of these studies was to quantify the aerodynamics near the probe tip. The suction case however, provided additional insight by determining whether the sampling efficiency increased by introducing a vacuum at the probe face. Baseline aerodynamic performance was established by evaluating the streamtube area at the probe face and upstream in undisturbed flow, and thus the probe aerodynamic efficiency. Data was acquired at Mach numbers of M = (0.25, 0.70), and at probe yaw angles of θ = (0°, 20°, 45°). These Mach numbers correspond to nominal jet bulk velocities of UB = 85 m/s and 240 m/s, respectively. For each case of Mach number and yaw angle, 1,000 image pairs were taken. A third study was conducted using the same methodology with the finalized probe geometry and sampling apparatus. Here, the probe was aspirated with the same vacuum pressure and results were compared to the previous cases.
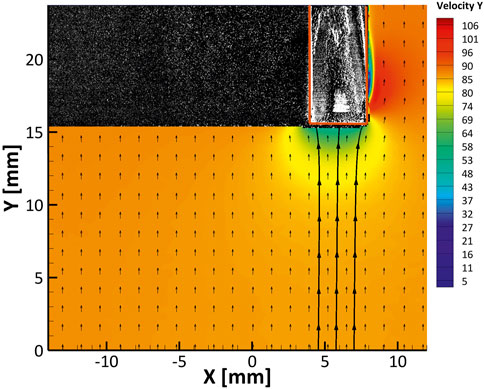
FIGURE 7. Axial velocity contours (m/s) with vector field and streamtube overlaid on image of probe to show approximate location for the M = 0.25, θ = 0° test case. Sampling probe boundaries are highlighted in red.
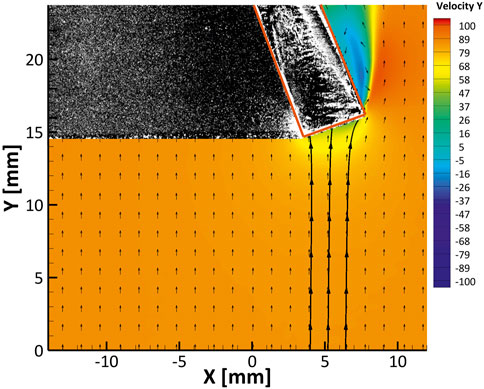
FIGURE 8. Axial velocity contours (m/s) with vector field and streamtube overlaid on image of probe to show approximate location for the M = 0.25, θ = 20° test case. Sampling probe boundaries are highlighted in red.
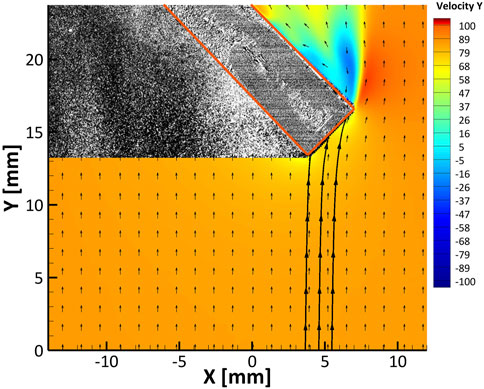
FIGURE 9. Axial velocity contours (m/s) with vector field and streamtube overlaid on image of probe to show approximate location for the M = 0.25, θ = 45° test case. Sampling probe boundaries are highlighted in red.
The image pairs taken during the PIV experiment were processed in the PIV software, LaVision DaVis 8.4, which calculates a velocity vector field for each image pair by observing the mean displacement of DEHS particles over all locations in the frame and using a specified time separation, dt. The velocity vectors were not calculated in the area on the opposite side of the probe from the laser due to the laser’s inability to fully penetrate through the polycarbonate probe. The vector fields calculated for all image pairs were then averaged, yielding one vector field of averaged velocities. Next, to remove non-physical velocities, which were likely a result of the DaVis software, MATLAB code was used to select locations in the average velocity field, plot all instantaneous data used to calculate the average data at those locations on a streamwise versus spanwise coordinate plot, and remove outlier data. The resulting average velocity data was then imported into separate MATLAB code, which plotted streamlines using the velocity vector field. These streamlines then were used to calculate the area ratio of the probe.
The setup for the particle tracking study which investigated the effects of the sampling probe on particle trajectories was nearly identical to the probe aerodynamic study. However, for the particle tracking study, the jet was seeded with C-Spec sand in place of the DEHS. The laser and camera were then used to take 1,000 image pairs for later processing. Particle velocity data was determined using PTVlab, a MATLAB add-on software (Brevis et al., 2011). A total of 50 composite image pairs was created using the original 1,000 image pairs. The PTVlab software then processed each composite image pair and calculated individual particle velocity data. The final result was a list of particle position, velocity vector magnitude, and particle velocity angle relative to free stream. This study was conducted at Mach number M = 0.70 and yaw angle θ = 0°.
Three particle concentration studies were conducted. The first two studies aimed at investigating particle sampling bias using the well-defined glass microspheres. Here, the glass bead particles were seeded into the free jet and captured by the sampling probe. Both the small glass spheres and the large glass spheres were tested separately to determine whether either distribution would be over- or under-sampled by the sampling probe. The experiment again followed the previously described testing conditions. The particles were sent directly to the Microtrac analyzer to minimize potential for losses resulting from post-test analysis methods. The analyzer provided size distributions for the particles sampled by the probe. By comparing the previously established size distribution to the sampled distribution, conclusions about the probe’s ability to sample the various particle types were drawn.
The third study assessed the concentration of C-Spec as sampled by the sampling probe. This was conducted at two jet locations, at jet centerline (R = 0), and halfway between centerline and the bottom of the jet (R = 0.5). Before each run, a new jar with its own unmodified lid was weighed using an Adam Equipment LTB 2602E scale, and the weight was recorded. The lid was removed, the jar was placed in the 3-D printed container, and the custom filtered jar lid screwed on. With the 3-D printed container closed and the jar secure, the suction source was activated, and the free jet was run to the desired Mach number. Then, C-Spec was seeded to the free jet, and a timer was started. Particles were captured by the probe for a period of 15 minutes. For the case where M = 0.70, θ = 0°, 1,000 image pairs were taken using the laser and camera for later PTV processing. At the end of the time period, the particle feeder was stopped, the free jet was turned off, and suction was deactivated. To ensure there were no residual particles in the probe or line leading to the jar, compressed air was blown into the probe inlet, pushing any remaining particles into the jar. The 3-D printed container was then opened and the custom filtered lid removed from the jar. The jar’s original unmodified lid was screwed back on, and the jar was weighed. The difference in weight was the weight of particles collected by the probe. This process was repeated for all cases of Mach number, yaw angle, and probe location. To supplement the concentration sampling study, another series of runs was completed to measure the air volumetric flowrate through the probe. A Kelly Pneumatics digital flowmeter was used to measure the volumetric flowrate for all cases of Mach number and yaw angle. This volumetric flowrate would later be used to calculate particle concentration.
Particle concentration was calculated as
where
where m is the total mass accumulated by the probe, and Δt is the time elapsed. For these studies, Δt remained a constant 15 minutes. Volumetric flowrate was measured using the previously described flowmeter in a separate experiment and corrected for the conditions at the time of the concentration study. This corrected flowrate
where Pm, Tm, and
The researchers chose to calculate an idealized concentration, Ci, which assumes the probe operates isokinetically. In this hypothetical scenario, an ideal probe volumetric flowrate is found by assuming the velocity of the air entering the probe is the same as the velocity of the air exiting the free jet. This ideal flowrate
where UB is taken as the jet exit velocity and As is the probe frontal area. The probe frontal area is based on an inlet diameter of 4 mm. Although the probe inner diameter is 2 mm, the 30° internal chamfer creates an effective capture diameter equal to the probe outer diameter, and it is assumed that all C-Spec particles entering the chamfered area are captured. Additionally, frontal area was taken to be the projected inlet area for cases of non-zero yaw angle. The idealized concentration value is then calculated as
and is the primary metric used to assess the accuracy of the concentration measured by the sampling probe. In theory, this idealized concentration should exactly match the true particle concentration of the flow. However, additional investigation may be required to assess the uncertainty associated with assuming the capture diameter is equal to the frontal area as there is potential for particle rebound after interacting with the probe chamfer.
An uncertainty analysis was performed to assess the precision of the reported results. Overall uncertainty was calculated using a root-sum-square of individual uncertainty contributions as
where δR is the absolute uncertainty and
The primary metric used to assess probe aerodynamic capture efficiency was the aspiration ratio (Ae) found in Eq. 7. To determine the areas used to calculate this ratio, the upstream streamtube diameter was manually selected using the streamline plotting program. The chosen diameter is directly related to the aspriation ratio as
where the projected area at the probe face, As, assumes a major radius equal to the probe outer radius (rs) and a minor radius which is the projection of rs onto a plane at angle θ. The diameter, d0, is the diameter which is manually selected and it is assumed that the area calculated with this measurement is circular. This selection relied on visual inspection and should therefore be considered a primary source of uncertainty. As such, the uncertainty of the upstream diameter was chosen to be ±0.1 mm. For any streamtube diameter value selected in this range, the plotted streamlines would still have aligned reasonably well with the probe inlet. With these assumptions a maximum uncertainty value was found to be δAe = ±0.017. While additional uncertainty may be present in the LaVision DaVis 8.4 software, providing an estimate of this uncertainty as it relates to streamtube diameter was deemed to be beyond the scope of this work.
The primary source of uncertainty associated with the particle tracking study was found to be converting pixel displacement to velocity. Conversion is calculated as
where
For the particle sampling and concentration study, primary sources of uncertainty included the instrument uncertainty of the scale used for measuring the mass accumulated by the probe (m) and the instrument uncertainty of the flowmeter used to determine the volumetric flow rate inside the sampling probe
The results of the previously described experiments are discussed below. The aerodynamic study explored the influence of placing the particle sampling probe within the flow downstream of the jet exit. Similarly, the particle tracking study looked at the change in the behavior of the particles as they approached and entered the sampling probe. Lastly, the particle sampling studies analyzed particle sampling bias, the effectiveness of the sampling container assembly, and estimated particle concentration from the flow. From these results, an extensive understanding of probe performance was established.
Table 1 provides the resulting aspiration ratios from the PIV studies. Here we see that the ratio in every case was less than unity, indicating sub-isokinetic sampling across all flow scenarios. This is due to the higher pressure at the probe tip than in the free stream as confirmed in Figures 7–9. Sub-isokinetic conditions indicate that the probe can be expected to undersample only the smallest of C-Spec particles which are fractions of a micron in diameter and have St < 1. From these results it is evident that the addition of aspiration suction increases probe efficiency. This increase is most notable in the lower Mach number cases where an efficiency of more than 75% is observed. In the higher Mach number case, however, this efficiency increase is limited to a maximum of 12.5%. Comparing the study of the 30° chamfered probe to that of the 45°, a decrease in area ratio is observed. This can most likely be explained by the addition of the particle collection apparatus, which may cause the probe tip to feel less suction from the vacuum pump and pressure plenum, causing the static pressure at the probe tip to be higher than in the previous study. The area ratio decreases as the yaw angle increases, indicating that the probe is sensitive to changes in flow angle. For the finalized probe geometry, increasing the yaw angle from θ = 0° to θ = 20° results in a 17% reduction in aspirational efficiency. Further increasing yaw angle from θ = 20° to θ = 45° results in a 29% reduction at M = 0.25 and a 45% reduction at M = 0.70. This is in part due to the decrease in probe inlet projected area with increasing yaw angle. This implies that abrupt changes in flow direction near the probe tip will cause further undersampling of small C-Spec particles. However, as previously stated, C-Spec particles experiencing Stokesian behavior are expected to be a negligibly small proportion of all particles encountering the sampling probe. Probe aerodynamic efficiency decreases as the Mach number increases across all studies.
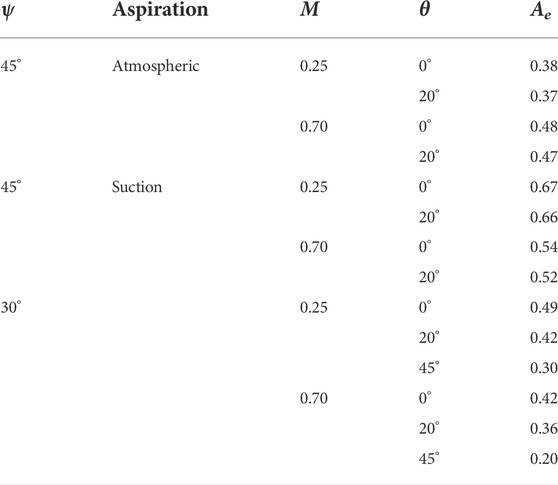
TABLE 1. Aerodynamic study aspiration ratio results.
The list of particle locations and velocity vector information was split into two data sets for analysis: all particles in frame, and particles only within the probe capture area. Figures 10A,B show all the velocity vectors in each data set. The purpose of the first data set was to characterize the overall movement of the C-Spec particles, whereas the purpose of the second data set was to characterize the behavior of C-Spec particles approaching the probe inlet. First, the distribution of the velocity magnitudes was analyzed for both data sets as seen in Figures 11AB. This test was conducted at a Mach number of M = 0.70 and a yaw angle of θ = 0°. This condition resulted in a nominal jet bulk velocity of UB = 240 m/s and a uniform flow field was assumed. For both data sets, the velocity distribution was found to be bimodal, with peaks around 120 m/s and 220 m/s. The bimodal nature of the distribution can be explained by a slightly bimodal diameter distribution discovered during the initial particle size investigation. The close proximity of the sampling probe to the free jet nozzle exit makes it likely that large particles are unable to equilibrate to the bulk flow velocity prior to interacting with the sampling probe. For the data set of all particles in the window, a mean velocity of 155.0 m/s was calculated with a minimum value of 54.1 m/s and a maximum value of 261.6 m/s found. For the data set constrained to particles in the probe path, a mean velocity of 143.8 m/s was found with a minimum value of 58.8 m/s and a maximum value of 253.1 m/s calculated.
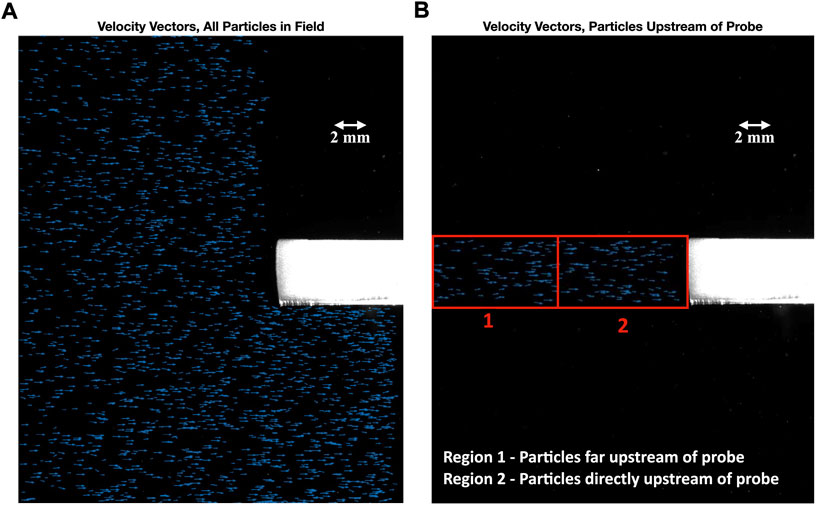
FIGURE 10. Particle velocity vectors for full field (A) and for regions far upstream (1) and directly upstream (2) of sampling probe (B).
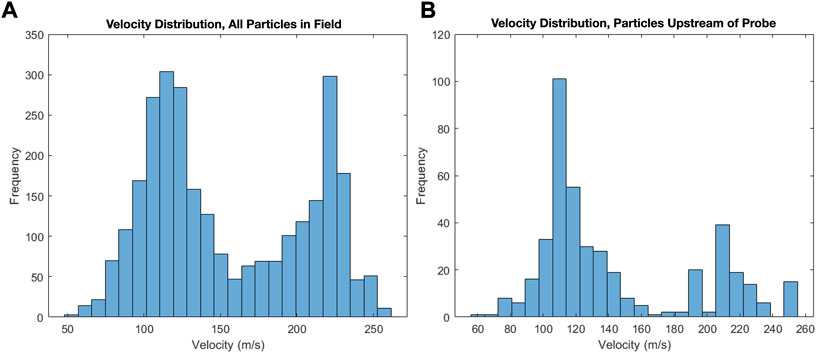
FIGURE 11. Particle velocity distribution profiles from PTV results for full field (A) and for regions far upstream (1) and directly upstream (2) of sampling probe (B).
Both velocity distributions appear to be biased towards slower velocities, with the first apex of the bimodal curve being larger than the second. At first glance, this is counterintuitive when compared to the bimodal diameter distributions, which is biased towards small particles. However, this discrepancy is likely caused by the higher detectability of larger particles by the laser and camera as well as the relative ease with which the PTV software can calculate velocities for these particles.
Next, the distribution of the velocity vector directions for both data sets was analyzed. The vector direction was taken as the angle relative to the streamwise direction. In both cases, the mean angle relative to the streamwise direction is less than 2°. This means, on average, the C-Spec particles are coming straight out of the free jet with no directional bias. However, the distribution ranges from -30° to 30°. By observation, the distribution is random and not dependent on location. One explanation for this randomness of directions is particles bouncing off the inner wall of the free jet plenum or nozzle, a phenomenon that will certainly occur when the probe is placed in an engine.
Finally, the data confined to the probe flow path was analyzed to determine whether the particle velocities were influenced by the aerodynamic changes that occur near the probe tip. To do this, the data was broken into two regions of equal area, one containing particles far from the probe and the other containing particles close to the probe. Figure 11B shows how the data was divided. The average velocity was found for each region and compared. The average velocity in region 1 and region 2 was found to be 149.5 m/s and 141.6 m/s, respectively. That is a decrease of only 5.3% from the average velocities reported previously. For comparison, based on PIV results, the airflow experiences a 55% decrease in velocity from the freestream to the probe inlet. This is sufficient to conclude that the velocities for the overwhelming majority of C-Spec particles are not heavily affected by aerodynamic changes induced by the probe. This conclusion also agrees with the Stokes number calculation of Section 2.1.4 where it was determined that most C-Spec particles would be classified as highly ultra-Stokesian and therefore the trajectories of these particles would be unaffected by the presence of the sampling probe. By determining the particle momentum response time from Eq. 2 assuming a mean particle diameter of 250 μm, and a characteristic fluid time scale from equation 5using the sampling probe outer diameter as the characteristic length (D = 4 mm), we find that C-spec particles at these velocities will experience Stokes numbers of approximately 1,000 ≤ St ≤ 1,100. This suggests consistency between the previous theoretical expectations and experimental findings.
As described in Section 2.1.2 a particle bias analysis was conducted by using the sampling probe to capture glass microspheres and deliver them directly to the CAMSIZER particle analyzer. The captured distributions compared to baseline are shown in Figure 1. The result reconfirms those predicted by the aerodynamic study where we learned that the probe operates sub-isokinetically, and a Stokes number analysis suggests that particles with diameters less than 10 μm may be affected by the streamlines near the probe face. The large spheres sampled match the distribution of the baseline very well. With these findings, the authors conclude that the material of interest (C-Spec) should remain unaffected by the diverging streamlines at the sampling probe face as nearly all particles are larger than 10 μm.
Sending the particles directly to the machine for analysis contains the sample in the analyzer and makes subsequent inquiry impossible. Therefore, to assess the sampling characteristics of C-Spec and the local particle concentration of the flow, the particle sampling apparatus was developed. Then, a concentration study was conducted where the sampling probe captured C-Spec particles as described in Section 3.3. Two types of concentration were calculated for each test case, one calculated using the volumetric flowrate measured from the probe by the digital flowmeter, referred to as measured concentration (Cm). A separate concentration was calculated using an ideal volumetric flowrate assuming the probe operated isokinetically, referred to as ideal concentration (Ci). Ideal concentration was chosen as the primary metric to compare the different test cases because it more accurately represents the true concentration in the airflow. The sub-isokinetic conditions experienced by the probe cause the measured volumetric flowrate to be much lower than it would be in isokinetic conditions. This also makes the measured concentration higher than the true concentration. Another consideration is that the majority of C-Spec particles have St > 1 and will not be affected by changes in airflow near the probe tip.
The results given in Table 2 show the effect of changing individual sampling parameters: Mach number and yaw angle. For each variable examined, results are compared with the baseline case of M = 0.70, probe at yaw angle θ = 0° , and probe location at the center of the jet exit area (R = 0). The results show an inversely proportional relationship between calculated concentration and Mach number. This makes intuitive sense, as the higher velocity will cause the particles to be spaced further apart as they are seeded into the free jet. Interestingly, total weight accumulated was higher for Mach 0.70 than for Mach 0.25. The authors believe this is due to a difference in particle distribution about the free jet cross-sectional area at the different Mach numbers. This proportionality also holds for increasing yaw angle and is consistent with a projected area analysis. However, the decrease in concentration was steeper than the decrease in projected area. Particle bouncing is a likely culprit for this discrepancy, as it is easier for particles to bounce off of the inner wall and out of the probe at higher yaw angles.
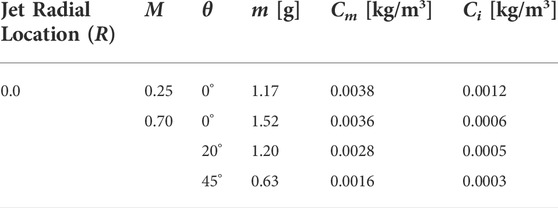
TABLE 2. Concentration study results.
An anisokinetic sampling probe is under continued development for use in an operational turboshaft engine. Three preliminary studies were conducted to gain a baseline understanding of the sampling probe’s performance. During these studies, the developed probe was placed directly downstream of a free jet. First, an aerodynamic analysis was conducted using particle image velocimetry techniques and probe efficiency was determined at various Mach numbers (M = 0.25, 0.70), yaw angles relative to freestream (θ = 0°, 20°, 45°), and ambient as well as aspirated suction conditions. Next, a particle dynamic analysis was conducted whereby the free jet was seeded with particulates (small and large glass microspheres) and probe sampling bias was determined for the range of particle sizes. Then, the jet was seeded with C-Spec sand particles and particle tracking velocimetry techniques investigated particle behavior due to the influence of the probe in the flow path. Lastly, sampling concentration was calculated using flow parameters and sampled particulate mass. The primary findings from these investigations are as follows:
1. The developed probe has demonstrated effective particle sampling at particle sizes (100 μm
2. The sampling probe operates sub-isokinetically for all relevant flow scenarios as determined by the aerodynamic analysis.
3. Probe aerodynamic efficiency (Ae) is inversely proportional to freestream Mach number (M) and yaw angle (θ). However, this efficiency limitation does not notably influence the sampling probe’s ability to capture the test dust of interest.
4. There appears to be no trajectory modification of C-Spec particles due to the presence of the sampling probe in the flow.
5. Although airflow velocity is markedly reduced near the probe tip, particle velocities remain constant through probe interaction.
6. Calculation of concentration remains inconclusive at this time and requires additional investigation.
The ultimate target for this probe is to be placed within the compressor section of a small turboshaft engine for real-time offtake of particles. The work described here provides an initial characterization of the behavior of this probe under idealized conditions inside a uniform flow to assess a baseline understanding of performance without the additional complexities which will be present in the engine environment. The flow conditions and sand type studied for this work were carefully selected with guidance from government and industry partners to closely recreate damage mechanisms seen by operational aircraft. Prior to the realization of this ambitious objective, future efforts will need to focus on assessing probe performance under conditions which more closely resemble those seen in the complex engine environment. These additional conditions to explore may include a wider range of bulk flow velocities, more dense or more dilute sand concentrations, performance with various test dusts, and performance within confined and unsteady flows. The concentrations used in these studies were dilute suspensions where particle volume fraction was on the range of 10–8. A more dense suspension could result in particles clogging the sampling probe while a more dilute suspension may not recover a statistically significant particle sample. Due to the sub-isokinetic behavior observed during all cases, Stokesian particles will be under sampled by this probe configuration. This may make this probe less efficient at sampling finer powders of interest or may result in a sample which is not representative of the true particle distribution present in the flow. Mitigation strategies may be implemented by lowering the flow velocity or by increasing aspiration pressure. However, those flow regimes fall outside the scope of the current investigation and achieving an aspiration pressure to achieve an isokinetic condition at the relevant conditions is impractical. A comprehensive understanding of probe performance under a wide variety of conditions is necessary prior to executing particle sampling in an operational engine environment.
The original contributions presented in the study are included in the article/supplementary material, further inquiries can be directed to the corresponding author.
AC and TC contributed to conception, design, and execution of the study. KO was responsible for formal analysis, validation, and preparation of the manuscript. KO, AC, and TC wrote sections of the manuscript. TL and WN supervised the project and contributed to manuscript review and editing. All authors contributed to manuscript revision, read, and approved the submitted version.
This work was supported by the United States Office of Naval Research under award numbers N00014-20-1-2538 and N00014-21-1-2397.
The authors would like to thank Alix Ehlers and Dr. Mark Caddick of the Virginia Tech Petrology Lab for their assistance in classifying the particulates used for this study. Additional thanks is given to Dr. Loren Crook and Mr. James Loebig of Rolls-Royce North American Technologies Inc. for their many insightful contributions to the program.
The authors declare that the research was conducted in the absence of any commercial or financial relationships that could be construed as a potential conflict of interest.
All claims expressed in this article are solely those of the authors and do not necessarily represent those of their affiliated organizations, or those of the publisher, the editors and the reviewers. Any product that may be evaluated in this article, or claim that may be made by its manufacturer, is not guaranteed or endorsed by the publisher.
[Dataset] Adam Equipment (2019). Luna precision balances: Ltb 2602e. Available at: https://www.adamequipment.com/ltb-2602e/(Accessed April 30, 2022).
Adrian, R. J., and Westerweel, J. (2011). Particle image velocimetry, 30. Cambridge, United Kingdom: Cambridge University Press.
Brevis, W., Niño, Y., and Jirka, G. (2011). Integrating cross-correlation and relaxation algorithms for particle tracking velocimetry. Exp. Fluids 50, 135–147. doi:10.1007/s00348-010-0907-z
Briones, C., Stouffer, S., Bichal, A., Kang, H., Altman, A., Corporan, E., et al. (2008). “Aspiration efficiencies of a soot-particulate sampling probe with dilution under gas turbine conditions,” in 44th AIAA/ASME/SAE/ASEE Joint Propulsion Conference & Exhibit, Hartford,CT, 21-23 July 2008. AIAA.
Campbell, E. E. (1994). “Recommended flight-crew procedures if volcanic ash is encountered,” in Volcanic ash and aviation safety: Proceedings on the first international symposium of volcanic ash and aviation safety (Denver, CO: US Geological Survey Bull), 2047, 151–157.
Chambers, J. (1985). The 1982 encounter of british airways 747 with the Mt. Galuggung Eruption cloud. Reno, NV: AIAA Journal.
Davis, I. (1972). “Sampling probes for duct and stack sampling in: Acgih,” in Air sampling instruments for evaluation of atmospheric contaminants. 4th ed. (Cincinnati, Ohio: ACGIH (American Conference of Governmental Industrial Hygenists)), L11–L13.
Daw, R. C. (1992). Aviation accident final report. Washington D.C: NTSB (National Transportation Safety Board). Tech. rep.
Fuchs, N. (1975). Sampling of aerosols,” in Atmospheric environment. Amsterdam, Netherlands 9 (1967), 697–707.
Hemeon, W., and Haines, G. F. (1954). The magnitude of errors in stack dust sampling. Air repair 4, 159–164. doi:10.1080/00966665.1954.10467661
Heo, N.-G., Lim, J.-H., Lee, J.-W., Lee, J.-S., Yook, S.-J., and Ahn, K.-H. (2018a). Development of a sampling probe for representative sampling of pm at freestream velocities in the range from 0 to 300 km h1. J. Atmos. Ocean. Technol. 35, 727–738. doi:10.1175/jtech-d-17-0158.1
Heo, N.-G., Woo, S.-H., Lim, J.-H., Yook, S.-J., and Ahn, K.-H. (2018b). Investigation of a double shrouded probe for particle sampling in high velocity airflows. Adv. Powder Technol. 29, 1085–1091. doi:10.1016/j.apt.2018.01.025
Kähler, C., Sammler, B., and Kompenhans, J. (2002). Generation and control of tracer particles for optical flow investigations in air. Exp. Fluids 33, 736–742. doi:10.1007/s00348-002-0492-x
[Dataset] Kelly Pneumatics (2021). Digital mass flow sensor. Available at: https://kellypneumatics.com/product/digital-mass-flow-sensor/(Accessed April 30, 2022).
Mayo, D., Daniel, K., Todd Lowe, K., and Ng, W. F. (2017). “Experimental investigation of a heated supersonic jet with total temperature non-uniformity,” in 23rd AIAA/CEAS Aeroacoustics Conference, 2017, Denver, Colorado, 5-9 June 2017, 1–14. doi:10.2514/6.2017-3521
Miller, E. (1996). “Volcanic ash warning for pilots,” in 34th Aerospace Sciences Meeting and Exhibit, Reno, NV, January 15-18, 1996, 140. doi:10.2514/6.1996-140
Mitchell, H., and Gilmore, F. (1982). Dust-cloud effects on aircraft engines: Emerging issues and new damage mechanisms. Palo Alto, CA: Research/Development Associates. Paper No. RDA-TR-120012-001.
Moffat, R. (1982). Contributions to the theory of single-sample uncertainty analysis. J. Fluids Eng.. Stanford, CA: ASME.
Neal, C. A., Casadevall, T. J., Miller, T. P., Hendley, J. W., and Stauffer, P. H. (1997). Volcanic ash-danger to aircraft in the North pacific. Washington, DC: US Geological Survey. Tech. rep.
Poursaeidi, E., Mohammadi Niaei, A., Lashgari, M., and Torkashvand, K. (2018). Experimental studies of erosion and corrosion interaction in an axial compressor first stage rotating blade material. Appl. Phys. A 124, 629. doi:10.1007/s00339-018-2007-5
Saltzman, A. J., Lowe, K. T., and Ng, W. F. (2020). 250 khz three-component Doppler velocimetry at 32 simultaneous points: A new capability for high speed flows. Meas. Sci. Technol. 31, 095302. doi:10.1088/1361-6501/ab8ee9
Soo, S. L. (2013). Instrumentation for fluid particle flow. Norwich, NY: Univ. Press of Mississippi.
Whiteley, A., and Reed, L. (1959). The effect of probe shape on the accuracy of sampling flue gases for dust content. J. Inst. Fuel 32, 316.
Whittle, R. (2015). Fatal crash prompts marines to change osprey flight rules. Breaking Defense, Available at http://breakingdefense.com/2015/07/fatal-crash-prompts-marines-to-change-osprey-flight-rules/(Accessed 15 August, 2016, 16 July, 2015)
Keywords: isokinetic, anisokinetic, particle-laden flow, sampling, probe, ingestion
Citation: Olshefski K, Collins A, Coulon T, Lowe T and Ng W (2022) Development of an anisokinetic particle sampling probe for use in a gas turbine engine compressor. Front. Mech. Eng 8:951986. doi: 10.3389/fmech.2022.951986
Received: 24 May 2022; Accepted: 20 September 2022;
Published: 30 September 2022.
Edited by:
Adel Ghenaiet, University of Science and Technology Houari Boumediene, AlgeriaReviewed by:
Chetankumar Sureshbhai Mistry, Indian Institute of Technology Kharagpur, IndiaCopyright © 2022 Olshefski, Collins, Coulon, Lowe and Ng. This is an open-access article distributed under the terms of the Creative Commons Attribution License (CC BY). The use, distribution or reproduction in other forums is permitted, provided the original author(s) and the copyright owner(s) are credited and that the original publication in this journal is cited, in accordance with accepted academic practice. No use, distribution or reproduction is permitted which does not comply with these terms.
*Correspondence: Kristopher Olshefski, a3Jpc29sc2hlZnNraUB2dC5lZHU=
Disclaimer: All claims expressed in this article are solely those of the authors and do not necessarily represent those of their affiliated organizations, or those of the publisher, the editors and the reviewers. Any product that may be evaluated in this article or claim that may be made by its manufacturer is not guaranteed or endorsed by the publisher.
Research integrity at Frontiers
Learn more about the work of our research integrity team to safeguard the quality of each article we publish.