 Anlue Li1
 Yu Fan
- 1School of Energy and Power Engineering, Beihang University, Beijing, China
- 2Beijing Key Laboratory of Aero-Engine Structure and Strength, Beijing, China
Periodic structures exhibit frequency band gaps, in which the propagation of certain waves is attenuated. A periodic structure can be designed such that its band gaps cover the excitation frequencies and its vibration can be reduced. However, perfectly periodic structures do not exist in reality due to inevitable deviations in the material and geometric properties. The vibration reduction performance can be significantly altered by the disorder, as reported by various authors. Therefore, it is favorable to find approaches that can retune disordered structures to the best possible state. In this way, robust vibration reduction performance can be achieved. In this study, a sorting strategy is proposed to rearrange the disordered unit cells. The aim is to reduce the performance change of vibration reduction. Specifically, a diatomic lumped-mass model has been used, where one mass coefficient in each unit cell is subject to random error. The forced response is computed, and the frequency-averaged spatially maximum amplitude is used as the indicator to quantify the influence of the disorder. Then, we reveal the importance of the deviation at different unit cells by a global sensitivity analysis. A variance-based approach termed Sobol’s sensitivity analysis is used. The results show that the deviation in the unit cell nearest to the excitation source is of the greatest importance. A theoretical interpretation from the perspective of wave propagation is given. Eventually, a simple sorting strategy is proposed, and the rule is to ensure that the unit cell in the first position has the smallest deviation. This strategy can significantly improve the similarity of the dynamic characteristics between the nominal and disordered structures. Overall, the conducted work provides a reference to the manufacture and assembly of periodic structures and a further understanding of the vibration reduction in band gaps.
1 Introduction
Periodic structures exhibit spatial periodicity in the material phases, the internal geometry, or the boundary conditions (Hussein et al., 2014) and are frequently encountered in engineering, such as multi-span beams, stiffened plates, and bladed disks. One of the most important characteristics is that periodic structures display frequency band gaps, in which the propagation of certain waves will be attenuated. Therefore, they are widely applied in vibration and noise control (Sánchez-Pérez et al., 1998; Richards and Pines, 2003; Collet et al., 2009), energy harvesting (Carrara et al., 2013; De Ponti et al., 2020), seismic protection (Huang and Shi, 2013; Krödel et al., 2015), and acoustic cloaking (Cummer and Schurig, 2007), to mention a few, and of increasing importance in modern technology (Kushwaha, 2016).
In reality, periodic structures are not perfectly periodic due to inevitable deviations in the material and geometric properties. The effects of disorder on band gaps and vibration reduction are critical and have attracted a great deal of attention. When Liu et al. (2000) first proposed the concept of locally resonant phononic crystals (PCs), an interesting result was shown concurrently that disordered periodic structures still work in band gaps. Wu et al. (2014) proved that the Bloch theorem still holds in the perspective of expectation. More detailed issues on the sensitivity to the disorder have been extensively explored for different models, objective functions, and band gap formation mechanisms (Jensen, 2003; Kwan et al., 2003; Li et al., 2006; Hussein et al., 2007; Achaoui et al., 2013; Wagner et al., 2016; Jia et al., 2018; De Ponti et al., 2019). Kwan et al. (2003) found that the quality of the photonic waveguide with cylindrical inclusions is very sensitive to the position and size randomness in the boundary layer. Achaoui et al. (2013) reported that the locally resonant band gap does not depend on the lattice symmetry and is strikingly resilient to the position randomness of pillars. In contrast, the Bragg band gap disappears with the random array. Wagner et al. (2016) presented experimental studies for investigating the influence of disorder on the hypersonic and thermal properties of two-dimensional PCs. De Ponti et al. (2019) demonstrated numerically and experimentally that perturbing the periodicity inside structures does not significantly affect its attenuation capabilities. However, only a few research studies (Ma et al., 2022) investigated the effects on wave propagation and vibration response from a statistical point of view. Moreover, the general conclusions on the effects of disorder and the corresponding solutions to the possible outcomes are still absent, to the best of our knowledge.
This work hereby concentrates on the influence of random disorder on periodic structures and gives engineering guidance. A diatomic lumped-mass model is used, where one of the mass parameters in each unit cell is subject to random error. A harmonic excitation with frequency in band gaps is applied at one tip, while the other tip is free. This model is used to find general conclusions and accelerate calculations because it is rather simple. The forced response of the model is computed within the stop band. The frequency-averaged spatially maximum amplitude is used as the indicator to quantify the influence of the disorder. The statistical results based on the indicator with different disorder strengths are described. Then, we reveal the importance of deviations of cells at different positions by global sensitivity analysis (GSA). Eventually, a simple sorting strategy is proposed for improving the similarity of the dynamic characteristics between the nominal and disordered structures. The prospect of the strategy is given. It has the potential application for the periodic structures assembled by modules, for example, by piezoelectric materials with shunt circuits. It can also guide the secondary modification when the periodic structure is manufactured as a whole. Overall, the conducted work provides a reference to the manufacture of periodic structures and a further understanding of the vibration reduction in band gaps.
This study is structured as follows: In Section 2, a diatomic lumped-mass model is used. Based on the model, structural dynamics description and wave propagation description are given. In Section 3, the effects of random disorder from the perspectives of modal and wave propagation are presented. The mean response amplification factor in the target band is proposed to quantify the vibration suppression performance and calculated by frequency response functions (FRFs). The statistical characteristics with different degrees of the disorder are obtained. In Section 4, the method of Sobol’ is applied to calculate the global sensitivity index. A theoretical interpretation from the perspective of wave propagation is given. In Section 5, a sorting strategy is proposed to inhibit the random disorder and protect the periodicity by decreasing the deviation of vibration reduction. Two tests with different disorder strengths are conducted to validate the strategy. In Section 6, the feasibility and the possible applications are discussed. An application scenario of the periodic beam is described.
2 One-dimensional diatomic lumped-mass model
Bragg band gaps are generated by the interaction of incidents and scattered waves in periodic structures (Hussein et al., 2014). One-dimensional (1D) diatomic lumped-mass models are used extensively to simulate periodic structures and form Bragg band gaps. It is a periodic repetition of a unit cell comprising two different masses. It should be noted that the unit cell, the simplest repeating unit forming this model, is chosen by splitting equally two neighboring masses (in red color) with parameter ma shown in Figure 1A. The parameter of center mass (in orange color) is mb. The spring parameters share the same index with the mass on the left side, which is ka and kb. In this unit cell, although there are three masses, leading to the contradiction with the diatomics, only two of them are independent, which will be explained later. In effect, the choices of the unit cell are not unique and do not influence the dispersion relation. n unit cells constitute this model in series. We distinguish them by the position, which is numbered from 1, the leftmost, to n, the rightmost shown in Figure 1B. The boundary conditions are free at both ends.
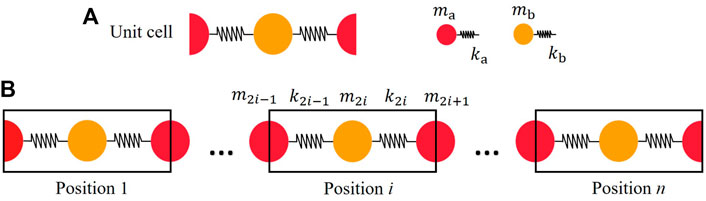
FIGURE 1. 1D diatomic lumped-mass model. (A) Unit cell, two types of masses with parameters ma and mb are marked by red and orange colors. (B) 1D diatomic lattice containing n cells in series distinguished by position.
2.1 Structural dynamics description
The equation of motion for the j-th mass (j = 1, 2, … , 2n + 1. For the center mass of the cell in position i, j = 2i.) from the model in Figure 1 is given by
where uj(t) is the displacement of the j-th mass mj, kj is the constant of the j-th spring, and fj is the external force loaded on the j-th mass. According to the periodicity of structure, the value of parameters are
And so on, the equation of motion for each mass in the structure can be obtained. Under the assumption of harmonic solution,
where
For free vibration, the external force is 0, and Eq. 4 becomes
The only non-trivial solutions of Eq. 7 correspond to the values of ω2 that satisfy the characteristic equation
Then, the natural frequencies and modal shapes can be obtained. Solving Eq. 4 directly when harmonic excitation is loaded gives the amplitudes of displacement response,
2.2 Wave propagation description
Individual mass and spring in the lumped-mass model are analyzed to get the transfer matrix. From the relationship of forces and displacement at both ends, and the harmonic vibration assumption, equations of motion are obtained. For mass,
or
for spring,
or
where uL, uR, FL, and FR are the displacement and the forces acting on the left and right ends, m and k are the parameters of mass and spring, vL and vR are the state vectors of left and right ends, Tm and Tk are the transfer matrix of mass and spring, respectively.
The unit cell in Figure 1 is composed of masses and springs in series; thus, the transfer matrix of unit cell Tuc is the product of transfer matrix of each component expressed as
According to the Bloch theorem, when a free wave travels in the periodic structure, the following condition should be satisfied:
where λ = eikd is a Floquet multiplier, k is wavenumber, and d is lattice constant. Substituting Eq. 16 in Eq. 14 leads to the following eigenvalue problem,
By solving this eigenvalue problem, the eigenvalues appear in pairs of
where
3 Influence of disorder
We consider the 1D lumped-mass model described before with dimensionless parameters n = 10, ma = 1, mb = 2, and ka = kb = 20. The dispersion curves are depicted in Figure 2 showing the real part and imaginary part of propagation constant kd. The ranges of frequency where the imaginary part of kd is non-zero correspond to the band gaps. As the result of the Bragg scattering, the band gaps only occur at wavelengths that are of the same order as the unit cell size. In Figure 2, the minimum wavelength in the range of the band gap equals 2d. In addition, there is no local resonator in the model; thus, it is impossible to generate a locally resonant band gap. Hence, the band gap can be classified as the Bragg band gap.
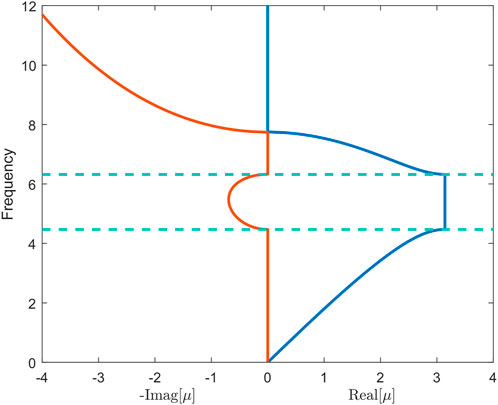
FIGURE 2. Dispersion curves showing the real part and imaginary part of propagation constant kd. The start frequency and cut-off frequency of the band gap are indicated by the dashed lines. The parameters of the unit cell are ma = 1, mb = 2, and ka = kb = 20.
The random disorder is introduced in every center mass mj (j = 2i, i is position number) of unit cells by supposing that mj ∼ U ((1 − α)mb, (1 + α)mb), where α is defined as disorder strength.
3.1 Modal analysis
For 104 samples with α = 10%, the natural frequencies are calculated by Eq. 8 and shown in Figure 3. The nominal natural frequencies are marked by diamond, and the bars are the range of variation of natural frequencies for the samples. The 1st Bragg band gap of the model without disorder is also obtained as a reference by Eq. 18, which is (4.47 and 6.32) consistent with the result from Figure 2. It can be seen from Figure 3 that when disorder does not exist, there is no natural frequency in the Bragg band gap, and the 11th natural frequency is coincident with the stop frequency of the band gap. Because this finite structure with free ends is symmetric, the natural frequencies are within or at the bounds of each propagation zone (Mead, 1975). Moreover, the influence of disorder on natural frequencies at the beginning of each propagation zone can be almost ignored but becomes gradually important with the increase of order. The range of variation of the 10th natural frequency, which is close to the start frequency of band gaps, has overlapping areas with the Bragg band gap.
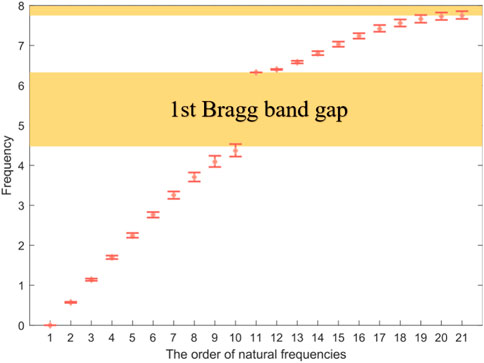
FIGURE 3. Variation of natural frequencies for 104 samples with 10% disorder strength. The pink diamonds are nominal natural frequencies, and the red bars represent the range of variation.
Next, we consider forced response and calculate amplitudes of displacement at some specific frequencies within the band gap. The responses are shown in Figure 4, where the red diamond markers are the amplitudes of the nominal displacement response. It can be seen that the amplitude of masses in the same cell decreases with the increase of the number of masses for all the frequencies. This is the typical characteristic of band gaps. The propagation of waves is prohibited within the band gaps exponentially; thus, the energy is confined near the origin of excitation and the structural response tends to be localized to the immediate vicinity of the excitation source (Langley et al., 1997).
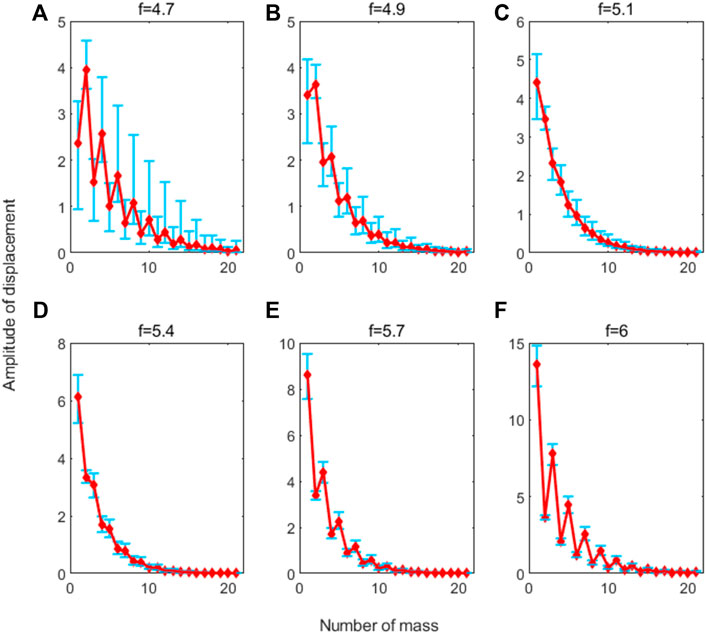
FIGURE 4. Variation of forced response at frequencies: (A) f = 4.7, (B) f = 4.9, (C) f = 5.1, (D) f = 5.4, (E) f = 5.7, and (F) f = 6.
We can also notice that the position of maximum amplitude is the second mass for f = 4.7 and 4.9. For the rest of the frequencies it is the first mass. This can be explained from the perspective of wave mode. We calculated the wave mode shapes in the 1st Bragg band gap. On a special note, we call that Mass 1, 2, and 3 are components of the unit cell, not the structure, and Mass 2 is the center mass. When cells are assembled to a periodic structure, Mass 2 corresponds to masses in the structure with an even index, while Mass 1 and 3 do not correspond directly to masses in the structure except the first and last masses. Mass 3 must be with Mass 1 in the next unit cell together to constitute a whole mass. Therefore, the amplitude of Mass 3 is equal to that of Mass 1 in the next cell, of which the amplitude is decided by Mass 1 in this cell according to Eq. 16. So, Mass 3’s amplitude is decided by Mass 1’s in the same cell, and only Mass 1 (or Mass 3) and Mass 2 are independent.
The wave mode shapes at frequencies f = 4.7 and f = 6.1 are shown in Figure 5A, B. These two wave mode shapes change with frequencies. Then, the proportion of magnitudes of wave mode shapes in the band gap is calculated and presented in Figure 5C. It can be seen that the proportion of Mass 2 is prominent at the beginning, while the proportion of Mass 1 is almost zero. With the increase of frequency, the proportion of Mass 2 decreases gradually until to zero, and Mass 1 begins to dominate. Actually, we can find the same phenomenon from the result of forced response in Figure 4. The amplitudes of masses with an even number, which corresponds to Mass 2, are the largest in each unit cell for f = 4.7, 4.9 and turn to be smaller gradually than those of masses corresponding to Mass 1 for f = 5.1, 5.4, 5.7, 6.
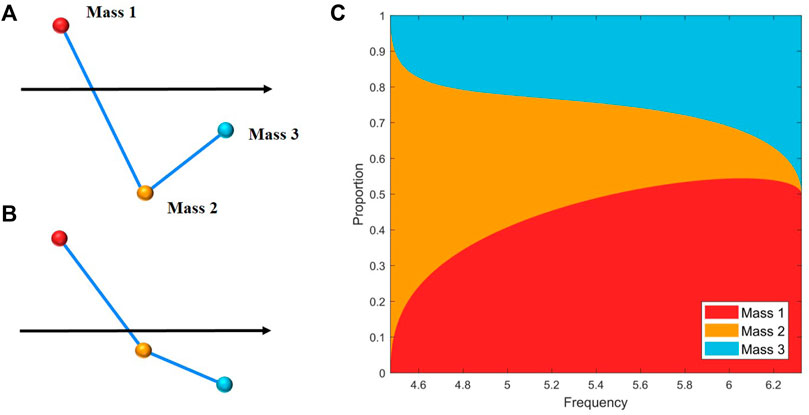
FIGURE 5. Wave mode shapes at frequency (A) f = 4.7 and (B) f = 6.1. (C) Proportion of magnitudes of wave mode shapes for Mass 1, 2, and 3 in the band gap.
For the samples with the disorder, the blue bars in Figure 4 are the ranges of variation of amplitudes. It is obvious that amplitudes of displacement are affected by random disorder, and the distributions of ranges differ in positions and frequencies. It is especially noted that there are always cases, where the maximum upper cap of bars exceeds the maximum red diamond, which means the maximum amplitude is amplified. Compared with the nominal situation, the difference for the maximum amplitude position is that it changes to the first mass for f = 4.9 in rare cases, but still in the first unit cell. In vibration control, the amplification of vibration is expected to be avoided. Hence, it is necessary to describe the variation of maximum amplitude quantitatively and figure out the effects of random disorder on it.
3.2 Indicator of vibration reduction performance
To quantify the influence of disorder on the maximum response in a certain band gap (fa, fb), the frequency-averaged spatially maximum response
where ω is the excitation frequency and Ud and Uo are the amplitudes of displacement when the structure is disordered and ordered. This indicator is normalized by the nominal maximum response and averaged in the frequency domain. So, it estimates the overall deviation of dynamic performance in the target band.
In this work, we discretize the frequency band (fa, fb) uniformly by N frequency points and calculate the maximum response by FRFs at each frequency. The frequency-averaged spatially maximum response
It needs to be mentioned that the target frequency band does not always coincide with the band gap (fa, fb). The magnitude of the imaginary part of the propagation constant kd reflects the degree of attenuation. At the beginning and ending parts of the band gap, the magnitude is small (Hussein et al., 2014), and so the vibration attenuation is limited. Therefore, it is preferred that the target band is a proper subset of band gaps. In this work, we suppose the target band is (fa + Δ, fb − Δ), where Δ = 0.1 (fb − fa).
3.3 Stochastic results
We consider that disorder strength α varies from 1% to 10%. For each situation, the frequency-averaged spatially maximum response of 2 × 10⁴ samples is calculated. The estimated probability density functions (PDFs) are shown in Figure 6.
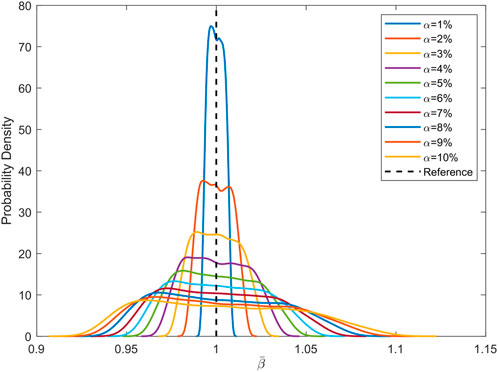
FIGURE 6. Probability density function with disorder strength varies from 1% to 10%. For each situation, the PDF is estimated from the results of 2 × 10⁴ samples. The reference line indicates
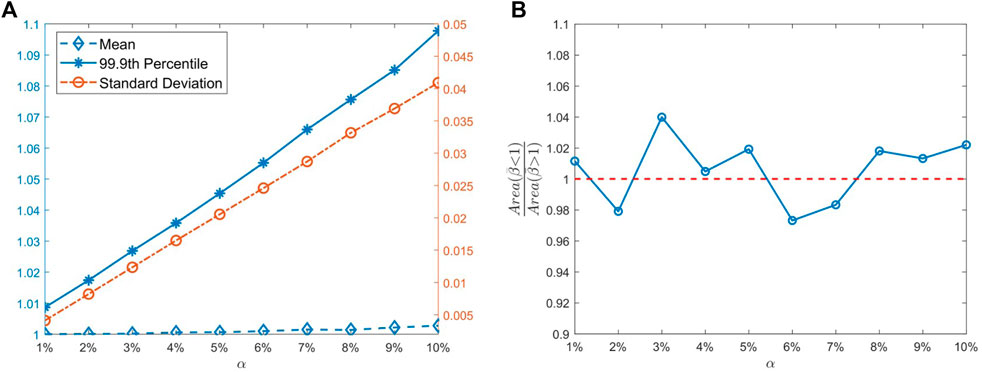
FIGURE 7. Statistical characteristics with different disorder strength. (A) Variation of means, 99.9th percentiles, and standard deviations. (B) Ratio of areas at two sides of the reference line in PDFs.
Once a periodic structure is manufactured, the disorder must exist, and the stochastic results tell that we cannot foresee the performance variation of this structure. The amelioration and deterioration of performance are both possible. It might perform better or worse with the same probability. But with greater disorder strength, the deviation of vibration performance from the nominal structure is bigger and the worst cases get worse in terms of probability. So, the disorder strength needs to be controlled to a minimum.
4 Global sensitivity analysis
4.1 Variance-based method
In this model, there are 10 independent variables (center mass parameters of 10 cells) distinguished by the position number. To investigate the impact of these variables on the indicator defined before, GSA is used. GSA is a better choice than local sensitivity estimated by the partial derivative. Derivatives are only informative at the base point, where they are computed (Saltelli et al., 2008). However, we need to estimate the importance of variables in an n-dimensional box, not only at a specific reference point. Moreover, the local sensitivity is not able to capture the interaction among parameters (Christopher Frey and Patil, 2002).
Variance-based methods have assessed themselves as versatile and effective for sensitivity analysis and look at the entire factor distribution, using customary Monte Carlo methods of various sophistication modes (Saltelli et al., 2010). Among them, Sobol’ method (Sobol, 2001) is extensively applied to calculate the global sensitivity index. Supposing the model f(x) defined in In, where I is the unit interval [0, 1], the variance-based framework is described by the ANOVA-representation,
where 1 ≤ i1 < ⋯ < is ≤ n, and
It can be derived from Eq. 23 that the members in Eq. 22 are orthogonal and can be expressed as integrals of f(x). Therefore, by squaring Eq. 22 and integrating, we get
where
D and
where the integer s is the order of the index. This index reflects the proportion of variance, which means the importance of impact on the output. The bigger the index, the greater the change of output produced by the variation of corresponding inputs and vice versa.
Under this framework, the ranking of input variables can be determined. In practice, the first-order indices also termed the main effects (ME), and the total sensitivity index (TSI) are computed, thus giving good information on the model sensitivities (Iooss and Lemaître, 2015). For the variable xj, the ME is Sj. It represents the share of the output variance that is induced by the variable xj alone. A high ME means that a variable is important, but a low ME does not mean that the variable has no influence, as it can be involved in interactions (Wu et al., 2019). The TSI,
contains all the sensitivity indices that xj participates in, including the first-order index Sj. It is a measure of the share of the variance that is removed from the total variance when the considered variable is fixed to its reference value (Christen et al., 2016). Therefore, variables with low TSI can be considered not influential.
4.2 Parametric sensitivity
We employ Sobol’ method to calculate the ME and TSI of the 10 inputs mi (j = 2i, i = 1, 2, … , 10. i is the position number, specifically, Position 1 is the closest to the excitation source, and Position 10 is the farthest.) to the output
Figure 8 shows the results of ME and TSI. There are 10 inputs, which correspond to 10 cells, respectively. It is obvious that the ME and TSI of the input at Position 1 are prominent. Their values all exceed 0.9, while the rest is less than 0.1, and almost 0, when the position number is greater than 2. This means that the model output (frequency-averaged spatially maximum response) is most sensitive to the variation in Position 1. For the input at Position 1, the value of TSI is slightly greater than that of ME, so the main contribution of TSI is the first-order index (ME) and other order indices are little. This means the interaction effect of the input at Position 1 with others is weak. That is to say, if we want to achieve the biggest variation of the output with individual change in a single input, the input at Position 1 will be expected to be the best choice. And supposing we changed the input at Position 1, the variation will not increase, if we keep on changing inputs in other cells. In addition, the ME and TSI decrease sharply with the increase in position number.
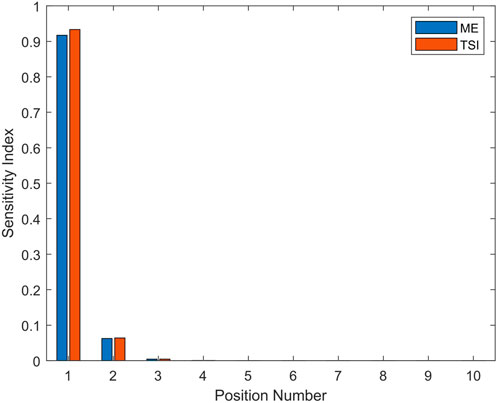
FIGURE 8. Global sensitivity indices of ten inputs corresponding to 10 cells marked by position number to the indicator.
These conclusions can be understood in the view of wave propagation. In the band gaps, the maximum energy arises in or near the exciting source, and this energy is little affected by the more remote parts of the system (Langley et al., 1997). Specifically, the amplitude decreases dramatically after the propagation in the first few cells due to the characteristic of exponential decay. That is to say, only the variations in the first few cells matter, and other cells far from the excitation point are not able to influence the maximum energy, which is exactly what the results of GSA reveal. The position, where maximum energy arises is verified and shown in Figure 9. It shows the proportion of positions, where the maximum amplitude occurs in the target band. The first and second masses take up all the proportion and they are both in the cell at Position 1. The difference in proportion between the first and second mass is affected by the wave mode vector illustrated in Section 3.1. From the statistical view, the proportion of samples with the disorder is the same as the nominal situation. It is explained by the maximum position of 200 disorder samples shown in Figure 10. The cut-off frequency of the maximum position varies around that of the nominal case (yellow line). Overall, the maximum amplitude still takes place in Position 1 in the disorder situation.
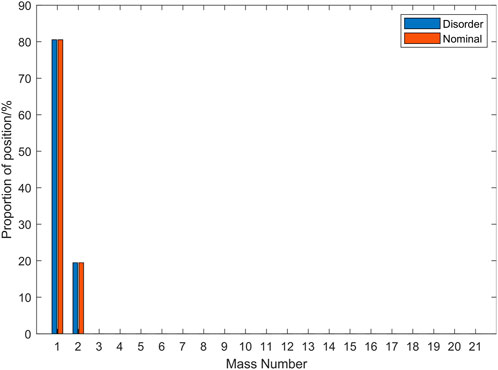
FIGURE 9. Proportion of position where the mass has maximum displacement response in the target band with and without the disorder.
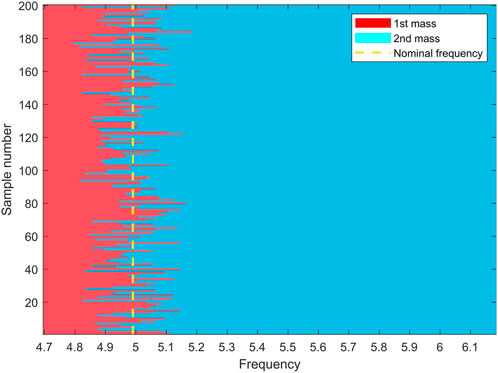
FIGURE 10. Positions where the mass has maximum displacement response in the target band for 200 samples. The yellow line refers to the frequency, where the mass changes from the first to the second for the nominal model.
5 Sorting strategy
The control of disorder strength is always difficult to implement. In contrast, changing the spatial disorder pattern is possible when the periodic structure is assembled by modules. We try to sort the order of unit cells to affect the vibration reduction performance for further finding a possible rule to decrease the impact of the disorder.
Based on the conclusion of GSA that the cell in the first position matters most, we propose a sorting strategy, and the rule is to ensure the minimum parameter deviation in the first position (nearest to the excitation source). That is to say, we select the most “perfect” cell and arrange it in the position nearest to the excitation to achieve the minimum variation of the most important factor.
We calculate the PDFs of two tests to validate the strategy. In the first case, the disorder strength α = 10%, and we take 2 × 10⁴ samples. For each sample it has an original disorder pattern, and then we apply the sorting strategy. Both the
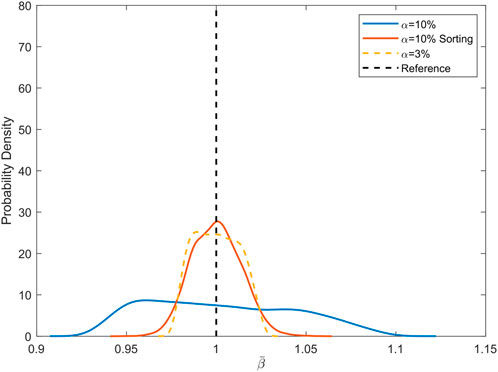
FIGURE 11. PDFs of the indicator with and without sorting strategy when disorder strength is 10%.
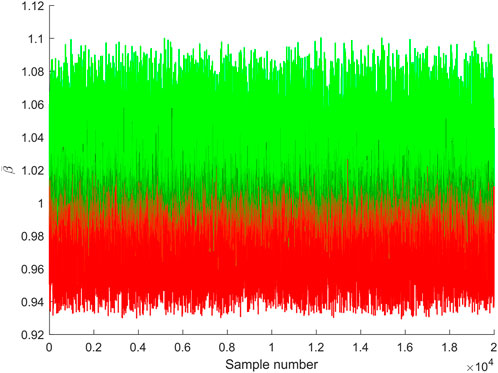
FIGURE 12. Variation of indicator caused by the sorting strategy for 2 × 10⁴ samples when disorder strength is 10%. The color red (green) means an increase (decrease) of value.
In the second case, the disorder strength α = 3%, the same analysis process is conducted. The estimated PDFs are shown in Figure 13. The pull-up effect of PDF is observed, and the PDF of α = 3% with the sorting strategy is similar to that of α = 1%. The variation of each sample is shown in Figure 14, where
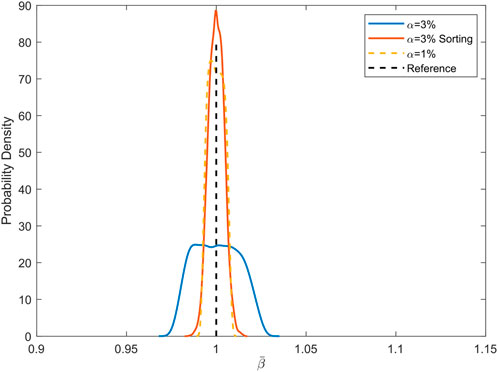
FIGURE 13. PDFs of the indicator with and without sorting strategy when disorder strength is 3%.
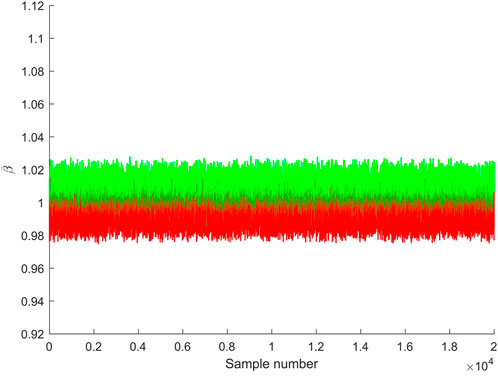
FIGURE 14. Variation of the indicator caused by the sorting strategy for 2 × 10⁴ samples when disorder strength is 3%. The color red (green) means an increase (decrease) of value.
The PDF and variation of samples valid the effectiveness of this sorting strategy that the deviation of the dynamic characteristics between the nominal and disordered structure gets smaller. The impact of the random disorder on the vibration reduction performance diminishes and the disordered periodic structure is returned.
6 Prospect
The fast-growing popularization of functional meta-structures brings new possibilities to industries like transportation, civil, and aerospace. The topics, such as piezoelectric metamaterials (Degraeve et al., 2015; Cardella et al., 2016; Fan et al., 2016; Li et al., 2018), rainbow metamaterials (Tsakmakidis et al., 2007; Krödel et al., 2015; Meng et al., 2020), and coding metamaterials (Wang et al., 2016; Li et al., 2020), have drawn a great deal of attention. In particular, they are all modulated and detachable making the sorting strategy feasible.
We take a piezoelectric metamaterial shown in Figure 15A as an example. For the undamped piezoelectric beam, the discrete dynamic equations are
where X is the displacement vector of mechanical system, V is the vector of voltage on each pair of electrodes, M and K is the mass matrix and stiffness matrix of mechanical system, Kme is the electromechanically coupled matrix, and Cp = CpI, where Cp is the intrinsic capacitance of piezoelectric material and I is the identity matrix. F is the external force vector applied to the mechanical system, and Q is the vector of charge on each pair of electrodes.
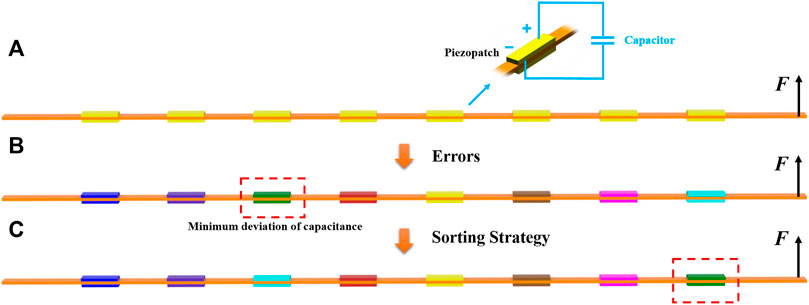
FIGURE 15. Example of a sorting strategy, (A) is a piezoelectric beam, all the piezopatch with a shunted capacitor in yellow are the same; (B) is the practical one with random errors in the capacitances; After the sorting strategy applied in (B), the final order is shown in (C).
The piezopatch is connected with a shunted capacitor, of which the capacitance is Ce. For the shunted capacitor,
where Ce = CeI. By substituting Eq. 29 into Eq. 28, we obtain
The beam is excited at the right end. Eight identical pairs of piezopatches with shunted capacitors are bonded to the beam to construct a periodic structure. The tailor of band gaps can be achieved by changing the capacitance to cover the excitation frequency. However, there always exists differences between capacitances due to errors in practice, even malfunction of devices, and the performance will deviate from expectation. Hopefully, there is still room for improvement by sorting the order of capacitors. It is supposed that the green piezopatch in Figure 15B possesses a minimum deviation of capacitance. According to the sorting strategy, we change the position of this shunted capacitor to the first place (nearest to the excitation source at the right end), which is the rightmost, and the others remain the same as shown in Figure 15A. So, the first unit cell has the smallest deviation of capacitance after sorting. Thus, the similarity of dynamic characteristics between the nominal and disordered structures is improved. The disordered piezoelectric metamaterial is retuned by the sorting strategy.
7 Conclusion
The influence of disorder on vibration reduction performance is investigated. The sensitivity indices of cell variables at different positions to the vibration reduction performance are calculated. Inspired by the sensitivity results, a sorting strategy is proposed and verified. The conclusions are as follows:
1. The effect of disorder on natural frequencies at the beginning of the propagation zone can be almost ignored but becomes gradually important with the increase of frequency order. The amplification of vibration may occur. The change of position of maximum displacement response in band gaps is explained by wave mode shapes. The position is still in the first unit cell with the random disorder.
2. The vibration reduction performance of periodic structures in the target band indicated by frequency-averaged spatially maximum amplitude is influenced. The statistical results based on the indicator with different disorder strengths are described. The amelioration and deterioration of performance are both equally possible. With greater disorder strength, the deviation of vibration performance is bigger, and the worst cases get worse in terms of probability. So, the disorder strength needs to be controlled to a minimum.
3. The distribution pattern of disorder also influences the vibration reduction performance. The sensitivities of parameter variations of cells at different positions are revealed by GSA. The vibration performance is most sensitive to the variation in the first unit cell (nearest to the excitation source) and insusceptible to the others. The interaction effect of the variation in the first unit cell with others is weak. A theoretical interpretation from the perspective of wave propagation is given.
4. A sorting strategy to retune the disordered periodic structures, of which the rule is to ensure the minimum parameter deviation in the first position (nearest to the excitation source) is proposed. This strategy can decrease the disorder strength regarding the vibration performance. Two tests show that disorder strength declines from 10% to 3% and from 3% to 1%, respectively, in a statistical sense. The validity is also verified by samples. The deviation of the dynamic characteristics between the nominal and disordered structure becomes smaller. The modularization and detachability of functional meta-structures provide the feasibility of this strategy. A prospect of application in piezoelectric metamaterials is presented.
Data availability statement
The raw data supporting the conclusion of this article will be made available by the authors, without undue reservation.
Author contributions
AL: methodology, investigation, and writing—original draft. YW: methodology, resources, and writing—review and editing. YF: conceptualization, writing—review and editing, supervision, and funding acquisition. LL: conceptualization, writing—review and editing, supervision, and funding acquisition.
Funding
This work was funded by major projects of aero-engines and gas turbines (2017-IV-0002-0039 and J2019-IV-0023-0091), Aeronautical Science Foundation of China (2019ZB051002), and Advanced Jet Propulsion Creativity Center (Projects HKCX 2020-02-013, HKCX 2020-02-016 and HKCX 2022-01-009).
Conflict of interest
The authors declare that the research was conducted in the absence of any commercial or financial relationships that could be construed as a potential conflict of interest.
Publisher’s note
All claims expressed in this article are solely those of the authors and do not necessarily represent those of their affiliated organizations, or those of the publisher, the editors, and the reviewers. Any product that may be evaluated in this article, or claim that may be made by its manufacturer, is not guaranteed or endorsed by the publisher.
References
Achaoui, Y., Laude, V., Benchabane, S., and Khelif, A. (2013). Local resonances in phononic crystals and in random arrangements of pillars on a surface. J. Appl. Phys. 114, 104503. doi:10.1063/1.4820928
Burhenne, S., Jacob, D., and Henze, G. P. (2011). Sampling based on sobol’sequences for Monte Carlo techniques applied to building simulations. Proc. Int. Conf. Build. Simulat., 1816–1823.
Cardella, D., Celli, P., and Gonella, S. (2016). Manipulating waves by distilling frequencies: A tunable shunt-enabled rainbow trap. Smart Mat. Struct. 25, 085017. doi:10.1088/0964-1726/25/8/085017
Carrara, M., Cacan, M., Toussaint, J., Leamy, M., Ruzzene, M., Erturk, A., et al. (2013). Metamaterial-inspired structures and concepts for elastoacoustic wave energy harvesting. Smart Mat. Struct. 22, 065004. doi:10.1088/0964-1726/22/6/065004
Christen, J.-L., Ichchou, M., Troclet, B., Bareille, O., and Ouisse, M. (2016). Global sensitivity analysis of analytical vibroacoustic transmission models. J. Sound Vib. 368, 121–134. doi:10.1016/j.jsv.2016.01.009
Christopher Frey, H., and Patil, S. R. (2002). Identification and review of sensitivity analysis methods. Risk Anal. 22, 553–578. doi:10.1111/0272-4332.00039
Collet, M., Cunefare, K. A., and Ichchou, M. (2009). Wave motion optimization in periodically distributed shunted piezocomposite beam structures. J. Intelligent Material Syst. Struct. 20, 787–808. doi:10.1177/1045389x08097902
Cummer, S. A., and Schurig, D. (2007). One path to acoustic cloaking. New J. Phys. 9, 45. doi:10.1088/1367-2630/9/3/045
De Ponti, J. M., Colombi, A., Ardito, R., Braghin, F., Corigliano, A., Craster, R. V., et al. (2020). Graded elastic metasurface for enhanced energy harvesting. New J. Phys. 22, 013013. doi:10.1088/1367-2630/ab6062
De Ponti, J. M., Paderno, N., Ardito, R., Braghin, F., and Corigliano, A. (2019). Experimental and numerical evidence of comparable levels of attenuation in periodic and a-periodic metastructures. Appl. Phys. Lett. 115, 031901. doi:10.1063/1.5090844
Degraeve, S., Granger, C., Dubus, B., Vasseur, J. O., Thi, M. P., Hladky, A.-C., et al. (2015). Tunability of Bragg band gaps in one-dimensional piezoelectric phononic crystals using external capacitances. Smart Mat. Struct. 24, 085013. doi:10.1088/0964-1726/24/8/085013
Fan, Y. (2006). Multi-scale approaches for the vibration and energy flow through piezoelectric waveguides: Simulation strategies, control mechanisms and circuits optimization. [dissertation]. Lyon: Ecole Centrale de Lyon.
Fan, Y., Collet, M., Ichchou, M., Li, L., Bareille, O., Dimitrijevic, Z., et al. (2016). Energy flow prediction in built-up structures through a hybrid finite element/wave and finite element approach. Mech. Syst. Signal Process. 66, 137–158. doi:10.1016/j.ymssp.2015.05.014
Huang, J., and Shi, Z. (2013). Attenuation zones of periodic pile barriers and its application in vibration reduction for plane waves. J. Sound Vib. 332, 4423–4439. doi:10.1016/j.jsv.2013.03.028
Hussein, M. I., Hulbert, G. M., and Scott, R. A. (2007). Dispersive elastodynamics of 1d banded materials and structures: Design. J. Sound Vib. 307, 865–893. doi:10.1016/j.jsv.2007.07.021
Hussein, M. I., Leamy, M. J., and Ruzzene, M. (2014). Dynamics of phononic materials and structures: Historical origins, recent progress, and future outlook. Appl. Mech. Rev. 66. doi:10.1115/1.4026911
Iooss, B., and Lemaître, P. (2015). “A review on global sensitivity analysis methods,” in Uncertainty management in simulation-optimization of complex systems (Springer), 59, 101–122. doi:10.1007/978-1-4899-7547-8_5
Jensen, J. S. (2003). Phononic band gaps and vibrations in one-and two-dimensional mass–spring structures. J. sound Vib. 266, 1053–1078. doi:10.1016/s0022-460x(02)01629-2
Jia, Z., Chen, Y., Yang, H., and Wang, L. (2018). Designing phononic crystals with wide and robust band gaps. Phys. Rev. Appl. 9, 044021. doi:10.1103/physrevapplied.9.044021
Krödel, S., Thomé, N., and Daraio, C. (2015). Wide band-gap seismic metastructures. Extreme Mech. Lett. 4, 111–117. doi:10.1016/j.eml.2015.05.004
Kushwaha, M. S. (2016). The phononic crystals: An unending quest for tailoring acoustics. Mod. Phys. Lett. B 30, 1630004. doi:10.1142/s0217984916300040
Kwan, K.-C., Zhang, X., Zhang, Z.-Q., and Chan, C. (2003). Effects due to disorder on photonic crystal-based waveguides. Appl. Phys. Lett. 82, 4414–4416. doi:10.1063/1.1584512
Langley, R., Bardell, N., and Loasby, P. (1997). The optimal design of near-periodic structures to minimize vibration transmission and stress levels. J. Sound Vib. 207, 627–646. doi:10.1006/jsvi.1997.1116
Li, C., Jiang, T., He, Q., and Peng, Z. (2020). Stiffness-mass-coding metamaterial with broadband tunability for low-frequency vibration isolation. J. Sound Vib. 489, 115685. doi:10.1016/j.jsv.2020.115685
Li, L., Jiang, Z., Fan, Y., and Li, J. (2018). Creating the coupled band gaps in piezoelectric composite plates by interconnected electric impedance. Materials 11, 1656. doi:10.3390/ma11091656
Liu, Z, Zhang, X., Mao, Y., Yang, Z., Chan, C. T., et al. (2000). Locally resonant sonic materials. Science 289, 1734–1736. doi:10.1126/science.289.5485.1734
Li, X., Liu, Z., Liang, H., and Xiao, Q. (2006). Band gap and waveguide states in two-dimensional disorder phononic crystals. Chin. Phys. Lett. 40, 23–1830. doi:10.1088/0256-307x/23/7/049
Ma, K., Liu, R.-X., Wu, F., and Xu, J. (2022). Statistical analysis of wave localization and delocalization in one-dimensional randomly disordered phononic crystals with finite cells. Waves Random Complex Media, 1–30. doi:10.1080/17455030.2022.2025502
Mead, D. J. (1975). Wave propagation and natural modes in periodic systems: I. Mono-coupled systems. J. Sound Vib. 40, 1–18. doi:10.1016/s0022-460x(75)80227-6
Meng, H., Chronopoulos, D., Fabro, A., Elmadih, W., and Maskery, I. (2020). Rainbow metamaterials for broadband multi-frequency vibration attenuation: Numerical analysis and experimental validation. J. Sound Vib. 465, 115005. doi:10.1016/j.jsv.2019.115005
Richards, D., and Pines, D. J. (2003). Passive reduction of gear mesh vibration using a periodic drive shaft. J. Sound Vib. 264, 317–342. doi:10.1016/s0022-460x(02)01213-0
Saltelli, A., Annoni, P., Azzini, I., Campolongo, F., Ratto, M., Tarantola, S., et al. (2010). Variance based sensitivity analysis of model output. design and estimator for the total sensitivity index. Comput. Phys. Commun. 181, 259–270. doi:10.1016/j.cpc.2009.09.018
Saltelli, A., Ratto, M., Andres, T., Campolongo, F., Cariboni, J., Gatelli, D., et al. (2008). Global sensitivity analysis: The primer. John Wiley & Sons.
Sánchez-Pérez, J. V., Caballero, D., Mártinez-Sala, R., Rubio, C., Sánchez-Dehesa, J., Meseguer, F., et al. (1998). Sound attenuation by a two-dimensional array of rigid cylinders. Phys. Rev. Lett. 80, 5325–5328. doi:10.1103/physrevlett.80.5325
Sobol, I. M. (2001). Global sensitivity indices for nonlinear mathematical models and their Monte Carlo estimates. Math. Comput. Simul. 55, 271–280. doi:10.1016/s0378-4754(00)00270-6
Tsakmakidis, K. L., Boardman, A. D., and Hess, O. (2007). ‘trapped rainbow’storage of light in metamaterials. Nature 450, 397–401. doi:10.1038/nature06285
Wagner, M. R., Graczykowski, B., Reparaz, J. S., El Sachat, A., Sledzinska, M., Alzina, F., et al. (2016). Two-dimensional phononic crystals: Disorder matters. Nano Lett. 16, 5661–5668. doi:10.1021/acs.nanolett.6b02305
Wang, Z., Zhang, Q., Zhang, K., and Hu, G. (2016). Tunable digital metamaterial for broadband vibration isolation at low frequency. Adv. Mat. 28, 9857–9861. doi:10.1002/adma.201604009
Wu, F., Gao, Q., Xu, X., and Zhong, W. (2014). Expectation-based approach for one-dimensional randomly disordered phononic crystals. Phys. Lett. A 378, 1043–1048. doi:10.1016/j.physleta.2014.02.031
Keywords: disordered periodic structures, statistical analysis, vibration reduction, global sensitivity analysis, sorting strategy
Citation: Li A, Wu Y, Fan Y and Li L (2022) Sorting strategy to retune the disordered periodic structures regarding vibration reduction in band gaps. Front. Mech. Eng 8:930946. doi: 10.3389/fmech.2022.930946
Received: 28 April 2022; Accepted: 08 July 2022;
Published: 04 August 2022.
Edited by:
Morvan Ouisse, École Nationale Supérieure de Mécanique et des Microtechniques, FranceReviewed by:
Guobiao Hu, Nanyang Technological University, SingaporeGongye Zhang, Southeast University, China
Copyright © 2022 Li, Wu, Fan and Li. This is an open-access article distributed under the terms of the Creative Commons Attribution License (CC BY). The use, distribution or reproduction in other forums is permitted, provided the original author(s) and the copyright owner(s) are credited and that the original publication in this journal is cited, in accordance with accepted academic practice. No use, distribution or reproduction is permitted which does not comply with these terms.
*Correspondence: Yu Fan, ZmFueXUwNEBidWFhLmVkdS5jbg==