 Lei-Yong Jiang
 Patrick Trembath2
 Michele Capurro
95% of researchers rate our articles as excellent or good
Learn more about the work of our research integrity team to safeguard the quality of each article we publish.
Find out more
ORIGINAL RESEARCH article
Front. Mech. Eng. , 05 January 2023
Sec. Turbomachinery
Volume 8 - 2022 | https://doi.org/10.3389/fmech.2022.924755
This article is part of the Research Topic Particulate Laden Flows in Turbomachinery and Consequences View all 4 articles
The aircraft engine hot section is most vulnerable and failure prone to environmental particle ingestion, which, particularly for helicopters, can cause detrimental effects ranging from reduced performance to complete engine failure. The objective of this work is to develop an analytical tool to assess environmental particle impact on engine hot sections. The current state of the art in experimental and analytical research on environmental particle ingestion related to engine hot sections was reviewed, with emphasis on sand particles. From these efforts, the available experimental data for model calibration were identified, and an innovative particle rebound/deposition model has been developed. A semi-empirical approach is selected to model particles bouncing off metal surfaces, where the coefficients of restitution measured in a temperature range of 297–1323 K are used to calculate particle bounce-back velocity components. The developed deposition model is based on non-dimensional parameter analysis over more than seventy experiments related to particle deposition in engine hot sections. The metal surface temperature, one of two critical parameters in particle deposition, is also included in the model. The model was successfully implemented into commercial software and checked step by step. It was calibrated by two cases: sand [Arizona road dust (ARD)] particle impingement on a circular plate and Mt. St. Helens volcanic ash impinging on a first-stage air-cooled nozzle guide vane (NGV). For the former case, the calibrated model predicts fairly well the variation of particle deposition rate with flow/particle temperature. The latter case indicates that the particle deposition rate at engine operating conditions can be assessed by the developed model. Due to the lack of experimental data that would permit a full calibration/validation, for the time being the model can be only used under limited conditions. As additional relevant experimental data appears, the model will be continuously improved.
The aircraft hot section is most vulnerable and failure prone to environmental particle ingestion. During takeoff, wind, engine-induced ground vortex, and thrust efflux from other aircraft can blow sand, dust, ice, and other particles into the engine. Helicopter engines are especially susceptible to environmental particle ingestion during hover, takeoff, and landing. Aircraft engines can confront particles transported by sandstorms to several thousand feet altitude (Mann and Wares, 1994).
Volcanic ash cloud presents one of the most dangerous environments for aircraft engines. Several incidents related to engine operation in volcanic ash cloud environments are well documented. Compressor blades and rotor-path erosion, particle deposition on hot-section components, and blockage of cooling passages are some of the phenomena observed in volcanic ash cloud encounters (Mitchell and Gilmore, 1982; Chambers, 1985; Smith, 1985; Dunn et al., 1994).
For land-based engines, experience with early coal-burning and subsequently alternate fuel gas turbine projects produced a great deal of information on erosion and deposition (Smith et al., 1967; Atkin and Duke, 1971; Wenglarz and Wright, 2003).
In the 21st century, the particle ingestion into gas turbines becomes more important because of two factors: 1) in pursuit of higher efficiency, engine manufacturers are increasing peak temperatures well above the softening temperature of airborne particles and 2) air quality in parts of the Far East, Middle East, and Africa is poor and air traffic is growing in these areas.
The experimental measurements and numerical modeling of particle rebound and deposition, particularly in engine hot sections, involve complicated physical phenomena with a rich parameter space: 1) flow dynamics and heat transfer, 2) particle properties, and 3) metal surface properties. The harsh conditions in engine hot sections make experimental study and model development more difficult. All of these challenges motivate researchers around the world to pursue suitable methods to assess environmental particle behaviors in engine hot sections.
There are two major aspects to the damage caused by environmental particle ingestion in turbine engines (Suman et al., 2019). At low temperature, the particles are likely to bounce off the metal wall and cause damage by erosion, and at high temperature the particles become soft and can stick to an engine component wall. Erosion is the dominant damage mechanism in fans and compressors, and adhesion is the primary damage mechanism taking place in engine hot sections, as shown in Figure 1. In general, erosion damage progresses rather slowly; while adhesion or deposition can occur rapidly, which can cause detrimental effects ranging from reduced performance to complete engine failure.
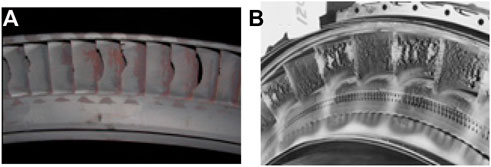
FIGURE 1. Erosion and adhesion damage, (A) severe erosion on turbine blades (Nomoto and Tanuma, 2017) and (B) volcanic ash adhesion on turbine vanes (Hamed et al., 2006).
The objective of this work is to develop an analytical tool to assess environmental particle impact on engine hot sections. Sand particles, typical of environmental particles ingested by helicopters, are used as a demonstration case. The developed numerical tool can be easily adopted to other environmental particles, such as volcanic ash, dust and CMAS (calcium magnesium aluminosilicate) as long as their physical properties and chemical compositions are known.
In the subsequent sections, literature search results of experimental, theoretical, and numerical studies on the interaction of environmental particles and metal surfaces at high-temperatures, and engine hot-section field data are briefly described, followed by the development and implementation of an innovative particle rebound/deposition model, and model calibration/validation with available experimental data. Finally, a few highlights are provided.
Hamed et al. (2006) comprehensively reviewed environmental particle erosion, rebound and deposition research in turbomachines from the late 1960’s to the early 2000’s. Suman et al. (2019) systematically reviewed and analyzed more than seventy experimental datasets of coal particle, volcanic ash, and sand deposition relevant to engine hot sections from open literature, dating back 30 years. The current state of the art in testing and modeling of environmental particle ingestion into gas turbine engines was discussed, and the difficulties and challenges of particle deposition experiments and modeling were described.
For the particle deposition in turbines, there are two types of mechanisms as discussed by Hamed et al. (2006): accretion on the turbine surface due to the balance of forces acting on the particle, and adhesion due to particles sticking to the surface. For the first mechanism, the turbulent diffusion, Brownian diffusion, thermophoresis in the boundary layer, etc. can cause low-speed fine particles to stay on the turbine surface. They also pointed out that a significant quantity of this type of deposition can occur only after molten particles have already adhered to these surfaces. In the present study, the second deposition mechanism, which causes permanent damage to engine components, is primarily considered.
It is known that environmental particles that enter engine hot sections have four possible paths: flowing through the domain, bouncing off the metal wall, sticking to the metal wall, or being trapped in engine components (Jiang et al., 2018). To predict adequately the particle behaviors inside engine hot sections, the particle rebound and deposition phenomena have to be properly modelled.
Particles trapped in engine components could be considered as another type of particle deposition or the first type of deposition mechanism. Dead-flow zones in the engine, such as inside cooling flow passages, wiggle-strips, cooling baffles, end of flow passage, and secondary flow passages, can trap not only fine particles but also large particles.
The rebound characteristics of particles impinging on metal walls play an important role in the assessment of particle behaviors in turbine engines. Particle rebound characteristics related to gas turbines were experimentally investigated by many researchers with high-speed camera and/or laser diagnostics, such as (Grant and Tabakoff, 1975; Tabakoff et al., 1987; Tabakoff et al., 1996). The tested particles included coal ash, fly ash, chromite, aluminum oxide, quartz, etc., and the target metal materials included stainless steel 304, X-40, INCO 738, and Al 2024 (Hamed et al., 2006).
Extensive tests were conducted by Wakeman and Tabakoff (Wakeman and Tabakoff, 1982) in the High-Temperature Erosion Rig at the University of Cincinnati. The impact and rebound velocities of 165 μm silica particles impinging on 2025 AL, INCO 718, and Ti 6-4 targets were measured by a high-speed camera in a velocity range of 60–170 m/s, impact angles from 25° to 90°, and temperatures from 297 K to 972 K. The major conclusions from these results were as follows: particle rebound characteristics were generally influenced by impact angle, and particle rebound characteristics were not affected significantly by target material or temperature. From these experimental data, a few semi-empirical correlations expressed as coefficient of restitution (COR) vs. impact angle were derived and were successfully applied to many investigations related to particle ingestion for engine inlets and compressors (Taslim and Spring 2010; Jiang et al., 2012).
Recently, the COR of ARD particles impinging on polished SS304 coupons was reported by Reagle et al. (2014). The experiments were carried out in the Virginia Tech Aerothermal Rig at particle temperature/velocity pairs of 300 K/27 m/s, 533 K/47 m/s, 866 K/77 m/s, and 1073 K/102 m/s, with impingement angles varying from 20° to 80°. The particle size was in a range of 20–40 μm with the average value of 29.25 μm. The experimental results showed that the total COR and normal COR were insensitive to the tested temperature/velocity conditions; but variations were observed for the tangential COR. With the same test facilities, similar tests on SS304 and Hastelloy X coupons were carried out by Delimont et al. (2015) at a velocity of 28 m/s and temperatures of 293–1073 K, and a velocity of 70 m/s and temperatures of 1073–1323 K. It was found that COR variation for particle temperature from 873 to 1323 K was consistent with those from Reagle et al. (2014). These semi-empirical COR results are valuable to study sand particle rebound characteristics at temperatures relevant to engine hot sections.
Parallel to the semi-empirical modelling of COR, much effort was devoted to development of physics-based numerical models to account for particle rebound from metal walls, such as (Bons et al., 2017; Yu and Tafti, 2019). The main goal was to encapsulate all parameters, such as particle impact velocity, impact angle, size, particle and metal surface temperature, surface roughness, particle shape, material properties, etc., for rebound and/or deposition into a single parameter - COR. When the COR >0, the particle bounces off the wall, while a COR ≤0 indicates the particle deposits on the wall.
Bons et al. (2017) developed a rebound/deposition model including particle elastic deformation, plastic deformation, adhesion, and shear removal, where cylindrical particles with their flat bases colliding with the metal wall were assumed. Three rebound and two deposition validation cases showed some degrees of success. The major shortcoming was that the model was achieved by tuning the particle yield stress to fit experimental data.
This type of model was further developed by Yu and Tafti (2019), where spherical particles were assumed. For normal impact, four processes, the elastic, elastic–plastic, full plastic and full plastic recovery, were included, while for the tangential impact, an impulse-based model with both sliding and rolling friction was considered. Similar to the above model, the adjustments of Young’s modulus and yield stress were required to fit the COR experimental data at temperatures from 1000 to 1340 K.
As mentioned earlier, Suman et al. (2019) comprehensively reviewed and analyzed over seventy experimental tests related to particle deposition in gas turbine hot sections, conducted over the last 30 years. The tests mainly involved five types of particles, coal, bituminous coal, lignite, volcanic ash, and sand. Most of these tests were for coal ash in 1970’s and 1980’s, while the cases related to sand particles were few.
External deposition on film-cooled CFM56 nozzle guide vanes was explored by Lundgreen et al. (Lundgreen et al., 2016) with ARD ≤ 5 μm particles at temperatures of 1363 K, 1538 K, and 1623 K. The results indicated that the deposition was concentrated at the stagnation line for all three inlet conditions, and the amount of deposition on the vane pressure surface increased with inlet temperature. Unfortunately, no quantitative particle deposition rate or capture efficiency was given.
Whitaker et al. (2016) investigated the effects of particle loading, size, temperature, and the external metal temperature on cooling flow blockage development in a vane leading edge model. In their experiments, ARD particulates, ≤5 μm, ≤10 μm, and ≤20 μm were chosen, and the temperature ranged from 700 to 866 K. Evaluation of the experimental data and particle size distributions indicated that particles smaller than 3.25 μm were primarily responsible for blockage development, and particle loading rates had no substantial impact on flow blockage development.
Bowen et al. (2019) conducted ≤5 μm ARD particle impingement tests on circular Inconel coupons. Particle deposition rates at particle velocities of 65–125 m/s and temperatures of 644–866 K were measured. Their results indicated that the particle deposition rate increased monotonically and nonlinearly with temperature over the range of temperatures tested. In addition, the cone angle formed by particle accumulation increased with temperature and decreased with velocity. These experimental data can be used to calibrate/validate a particle deposition model although the temperatures are relatively low.
It is a challenging task to design, measure and analyze particle deposition testing at engine hot-section representative temperatures. Boulanger et al. (Boulanger et al., 2016; Boulanger et al., 2017) experimentally investigated sand particle deposits on Hastelloy-X coupons up to 1373 K using the Virginia Tech Aerothermal Rig and microscopic image processing programs. The tests were carried out with 20–40 μm ARD particles, impact angles of 20°, 50° and 80°, and a velocity of 70 m/s. Averaged particle deposits per unit area on the coupon were reported. However, as recognized by the authors, these tests suffered from two shortcomings: 1) the particle deposition overlap on the coupon was significant and 2) some particle deposition occurred on the long equilibration tube internal wall. Because of these, the actual values of particle deposition rates could not be used in the deposition model development (the corresponding numerical simulations confirmed this although the results are not presented in this paper). These tests represent a good start to measure sand particle deposition at high temperatures relevant to engine hot sections.
Contrary to the fundamental experimental studies on sand deposition, results from real engine tests with sand or volcanic ash are scarce in the open literature. A series of experimental tests on deposition of volcanic materials in the hot sections of two gas turbine engines, Allison T56 and Pratt and Whitney F-100, at high concentration levels (250 and 500 mg/m3), were performed in later 1980’s and early 1990’s (Dunn et al., 1987; Moller and Dunn, 1989; Kim et al., 1991), and summarized by Kim et al. (1993). The test rigs were built from real engine components and were operated at the same flow function and temperature levels as would occur in the operational engines. For the T56 engine tests, Mt. St. Helens ash (volcanic ash) and a blend of Hollywood sand (26%), Corona clay (26%), bentonite (6%), and Twin Mountain black scoria (volcanic ash, 42%) were selected as the test materials, with the average particle size from 5 to 73 μm, respectively. The turbine inlet temperature varied from 1222 to 1506 K, and the particle deposition rates were reported. The results indicated: 1) deposition was observed in some cases on the turbine inlet temperature probes and the nozzle guide vanes, 2) the turbine inlet temperature and vane surface temperature were the two dominant parameters for particle deposits.
More recently (Elms et al., 2020), a new evaporate-rich test dust (TD50) was developed by the University of Manchester on behalf of an engine manufacturer, which was designed to simulate operation in regions with evaporate-rich geology, such as Doha or Dubai. The full engine ingestion tests were conducted in spring 2018 using TD50. Analysis of the engine deposits showed that mineral fractionation was present in the cool upstream sections of the engine. In the hot sections, deposits contained new, high temperature phases formed by reaction of minerals in the test dust. Unfortunately, the results of the whole engine testing are not available in the open literature.
As mentioned earlier, particle deposition onto engine hot-section surfaces is determined by many parameters. Over the years, efforts have been devoted to model this phenomenon. The main concepts of the two popular models, critical viscosity and critical velocity models, together with an energy-based approach are briefly described.
The critical viscosity model was based on the particle viscosity variation with temperature (Walsh et al., 1990). The probability of particle sticking is determined by the following expression.
where μcr is the particle critical viscosity at the critical or softening temperature, and μTp represents the viscosity of the particle at the current temperature. If the particle viscosity is equal or smaller than the critical viscosity, the particle sticking occurs or the sticking probability is 100%; otherwise, the sticking probability is calculated from Eq. 1.
Many researchers have applied this model and, in some cases, validated their results with experimental data (Barker et al., 2013; Borello et al., 2014; Zagnoli et al., 2015). Other contributions were made to extend the model presentations to account for the particle energy losses during a collision, particle kinetic energy, or metal surface temperature (Srinivasachar et al., 1990; Sreedharan and Tafti, 2010; Singh and Tafti, 2016; Jiang et al., 2018).
The critical velocity model, based on classical impact dynamics and Hertzian theories, compares the particle velocity with the local wall shear velocity. If the particle velocity is less than the shear velocity the particle deposits on the surface, otherwise the particle bounces back from the surface. From the earlier work of Brach and Dunn (1992), Soltani and Ahmadi (1994), El-Batsh and Haselbacher (2002), Ai and Fletcher (2009) and Ai et al. (2012) gave a compact two-process format: the sticking process, a pure mechanical interaction in the absence of the fluid force, and the detachment process, a fluid dynamic interaction between the fluid and deposited particles. For the first process, a capture or critical velocity is defined as
where E is the Young’s modulus and d is the particle diameter. If the particle normal impact velocity is smaller than the capture velocity, the particle deposits, otherwise the particle bounces back from the surface. To apply this sticking model in their prediction, the dependency of Young’s modulus on temperature was tuned to match the deposition rate obtained in the experiments.
For the second process, a critical wall shear velocity is given by the following equation
where vsh is the shear velocity, Cu stands for the Cunningham correction factor, WA denotes the work of sticking, ρ is the particle density, and Ec represents the composite Young’s modulus. The model determines that the particle will be removed from the surface if the local wall shear velocity in the turbulent flow is larger than the critical velocity.
The current status of the critical velocity model could be represented by the contributions from Bons et al. (2017) and Yu and Tafti (2019), which are described in the previous sub-section.
The energy-based model compares the particle kinetic energy before impact to the energy dissipated due to its deformation and the work done against surface tension. If the particle remaining energy after impingement is greater than zero the particle rebounds, otherwise it adheres to the surface. The main parameters are the particle kinetic energy, viscosity and surface tension, and impact angle (Ni et al., 2011; Kleinhans et al., 2016). The remaining energy fraction is given as
where α is the impact angle and ξ is the particle spread factor, which represents the particle maximum deformation. If dmax is the maximum footprint diameter when the particle hits the surface, the spread factor is defined as
Several empirical tests of spread factor quantifications for droplet impinging on solid surfaces were reported in the literature (Mao et al., 1997; Ukiwe and Kwok, 2005). A sensitivity analysis of ξ variation with the particle impact angle from 0° to 90° indicated that as the particle adhesion took place, ξ ≥ 0.4, and the value of 0.4 was suggested as the threshold value (Suman et al., 2019).
Suman et al. (Suman et al., 2019) compared the energy-based sticking model with the critical viscosity model using all the deposition test data. They found that particle rebound and deposition regions differed between the two models, and mismatch between the actual experimental results and the model predictions were also observed.
Mizutori et al. (2019) compared the performance of three variants of critical velocity model Bons et al. (2017) and two variants of critical viscosity model against two experimental tests. The former was described previously for ARD particle deposition on circular coupons. The latter studied coal ash deposition near film cooling holes, and the tests were carried out with the average particle size of 16 μm, temperature of 1453 K, velocity of 180 m/s, and a blowing ratio range of 0.5–4.0. However, no quantitative deposition rate was given for any of these five models, rather than “adhesion” or “not adhesion”, although the deposition rates were available for both test cases.
In summary, neither the critical viscosity/velocity nor the energy-based methods appear mature enough to predict particle deposition in engine hot sections, thus driving a demand for new ideas to model environmental particle deposits in engine hot sections.
The above review of the current state of the art in experimental and analytical research on environmental particle impact on engine hot sections provides valuable information for the development of particle rebound/deposition model. Based on these efforts, an innovative particle rebound/deposition model is developed.
As discussed before, for the physics-based rebound approach, the particle properties have to be tuned to fit experimental data, which will then affect particle deposition prediction. Therefore, the medium- and high-temperature experimental results from Delimont et al. (2015) for ARD particles impinging and bouncing off Hastelloy X coupons are used in this paper. These measurements cover a wide range of temperatures from 293 to 1323 K.
The particle rebound characteristics are commonly represented by the normal and tangential coefficients of restitution (COR), defined as
In Eqs 6, 7, CORN and CORT are the normal and tangential coefficients of restitution, U and V stand for the particle normal and tangential velocities, and the subscripts 1 and 2 indicate before and after impingement respectively. The experimental results from Delimont et al. (2015) are expressed in a power-law form
where α is the impact angle in degrees, and e1 and e2 are constants which were obtained by curve fitting. Table 1 and Table 2 list the two constants and associated temperature for the normal and tangential COR in the temperature range of 293–1323 K.
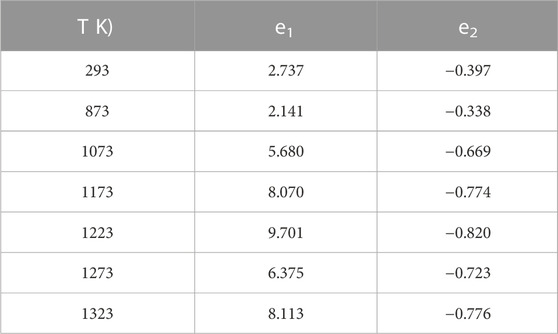
TABLE 1. Curve fit constants for normal COR.
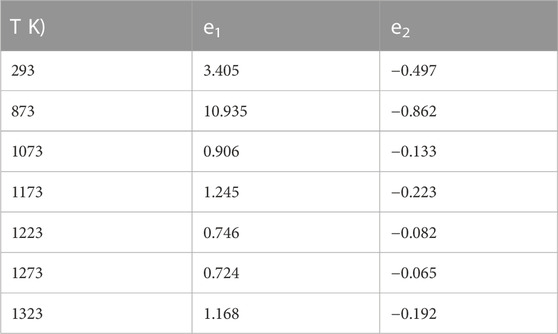
TABLE 2. Curve fit constants for tangential COR.
As stated earlier, these experimental data were obtained in a particle impact angle range of 20°–80°. For α > 80°. CORN and CORT values are extrapolated from the above curve fitting equations; while for α < 20°. CORN = .95 and CORT = .9 for T ≤ 873 K and CORN = .85 and CORT = .75 for T > 873 K, estimated based on the variation trends of COR with α of the experimental data.
Based on the systematic analysis over more than seventy particle deposition tests and the Pi Theorem (Buckingham, 1914), Suman et al. (Suman et al., 2019) mapped particle impact behaviors or regions, with particular attention to deposition behavior, by two non-dimensional parameters
In Eq. (9), T and Tsoft stand for the particle temperature and softening temperature, while Ekin and Ssurf are the particle kinetic energy and surface energy, respectively. For the second non-dimensional parameter in Eq. 9
where m stands for the particle mass, U is the particle velocity, γ denotes the particle surface tension, and r is the particle radius. It is noted that for the surface energy, the particle maximum footprint is not used in Eq. 10. This is because for particle sticking assessment, a constant spread factor of 0.4 can be assumed, as stated earlier.
One major advantage of the non-dimensional parameter, Θ, in Eq. 9 is that its calculation is based on the particle temperature, instead of the particle viscosity in Eq. 1. The particle temperature along its trajectory in engine hot sections can be accurately calculated in CFD simulations. However, it is not an easy task to determine accurately the particle viscosity. The immense variability of viscosity for a given substance obtained from different models has been reported (Suman et al., 2019).
Figure 2 maps the characteristic regions of particle impingement on the metal surface using the non-dimensional parameter group, Θ = T/Tsoft and K = Ekin/Esurf. The symbols in the figure represent over 70 deposition experimental tests, and the legend of all symbols can be found in the reference (Suman et al., 2019).
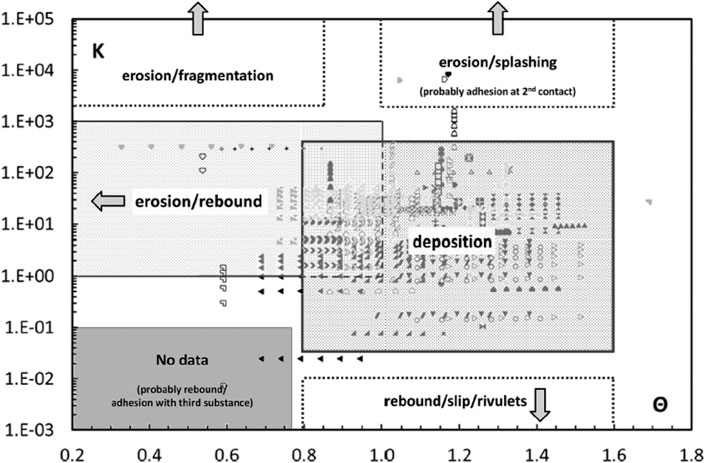
FIGURE 2. Particle impact characteristic map with non-dimensional parameters, K = Ekin/Esurf and Θ = T/Tsoft (Suman et al., 2019).
Figure 2 indicates that the deposition occurs in a range of Θ = 0.8–1.5, and at Θ = 1.5 the particle temperature is close to its melting temperature. Also note that both particle rebound and deposition coexist for all particle deposition experimental tests shown in Figure 2. For convenience of modeling, two alternative non-dimensional parameters, Θ+ and K+, are introduced as:
In Eq. 11, the particle melting temperature, Tmelt, instead of softening temperature, is used. In Eq. 12 K+ is the reciprocal of K. Examining the rebound-deposition overlapped region in Figure 2, it is understood that for the tests in the range of Θ = 0.8–1.0 or Θ+ = 0.53–0.67, the particle motion can contribute to deposition for 1.0 < K < 400 or 1/400 < K+ < 1. In this range, the larger K+, the higher the particle sticking probability.
In addition to the above non-dimensional parameters, the metal surface condition should be also included in the deposition model, as mentioned earlier (Kim et al., 1993). To account for the metal surface temperature effect on particle deposition, a non-dimensional parameter, Pm, is defined as
where Tm is the metal surface temperature and Tm, melt stands for the metal melting temperature.
From Eqs 11–13, the particle deposition probability on the metal surface can be considered to be a function of particle temperature, particle motion and metal surface temperature,
The three non-dimensional parameters in Eq. 14 can have different mathematical formulations, which may depend on deposition types, physical phenomena, material properties, etc. That is, the particle deposition probability is calculated from the three partial probabilities with adequate mathematical operations.
Equation 14 states that if the deposition probability is equal to 100%, the particle will stick on the metal surface. For a probability less than 100%, some particles will bounce back from the wall, and some will stick on the wall. In order to implement this function, a random number is generated in the range of 0–1 for each particle impact. If the random number is less than the calculated sticking probability, the particle will deposit on the wall; otherwise, the particle will bounce back from the wall. For particles bouncing back from the wall, the restitution coefficients in the previous sub-section are used to calculate the particle rebound velocity components. These particles will be continuously tracked until they pass through the domain, or deposit on the wall, or are trapped in the engine components.
In short, the above particle rebound/deposition model incorporates six independent particle variables, a) density, b) size, c) velocity, d) temperature, e) chemical compositions, and f) impact angle. Note that the particle impact/rebound velocity components are determined by c) and f), the particle mass is obtained from a) and b), both particle surface tension and softening temperature ae functions of d) and e), and the spread factor is related to a) - f). At the current time, the effect of impact angle on deposition probability is not well understood, and it will be further studied with available experimental data. In this paper, the particle velocity magnitude is simply used in Eq. 2, instead of the normal velocity.
The particle deposition rate at the metal surface is defined as
where mcapture and missue are the particle mass deposited on the target and issued from the inlet, respectively.
A user-defined-function was developed to implement the above particle rebound/deposition model, which was compiled and linked to a commercial CFD solver, ANSYS CFD Premium. The developed function was thoroughly verified step by step, by tracking a single or a few particles at various test conditions, and checking printed model parameters, such as particle temperature, velocity, mass, density, impact angle, surface tension, melting temperature, metal surface temperature, metal melting temperature, CORN, CORT, Θ+, K+, Pm, model constants and coefficients, deposition probability, random variable, etc. The verification ensured that the particle rebound/deposition model was properly implemented.
As the first test case, ARD particle impingement testing on circular Inconel coupons from Bowen et al. (2019) is considered. There are two reasons to choose this case: 1) the test material is ARD which has been used by many researchers as “standard sand” in this field (Boulanger et al., 2016; Lundgreen et al., 2016; Whitaker et al., 2016; Boulanger et al., 2017; Bowen et al., 2019); 2) the particle deposition rates are available, as mentioned in section 2.2. The computational domain is illustrated in Figure 3, and for clarity only metal surface meshes are shown except for Figure 3A. In Figure 3A, two atmospheric boundary meshes are also displayed. The mesh consists of 776,300 cells. The y+ values are in a range of 0.1–7.5 at the pipe wall and front plate, and 4-20 at the target plate.
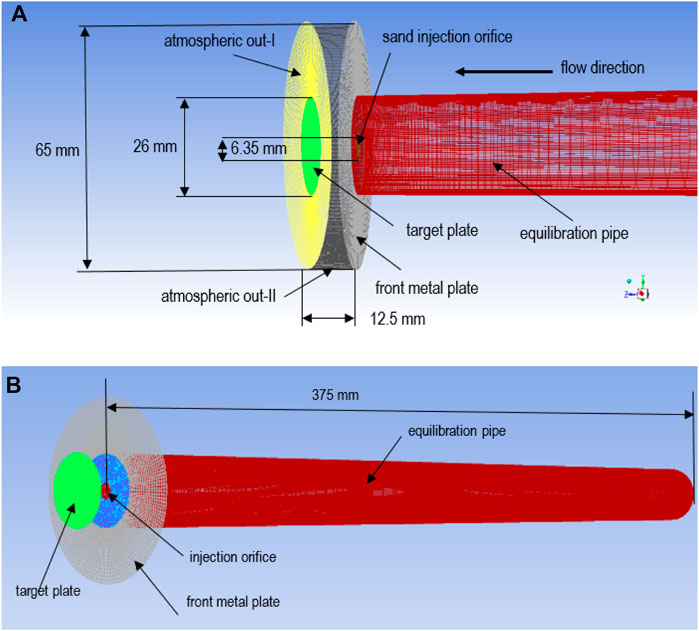
FIGURE 3. Computational domain and mesh, (A) the downstream portion and (B) a side view of domain and mesh.
The Inconel circular target plate has a diameter of 26 mm, and the diameter of the sand injection orifice is 6.35 mm. The target plate is located 12.5 mm downstream of the injection orifice. Note that the injection orifice is parallel to the target plate, i.e., the particle impact angle is 90°. The diameter of the front metal plate is 65 mm, and the equilibration pipe is 375 mm long with an inside diameter of 26 mm. The target plate, front metal plate and pipe wall are defined as adiabatic since they were well insulated. The flow inlet boundary conditions are given in Table 3.

TABLE 3. Flow inlet boundary conditions.
The chemical compositions and mass fractions of ARD particles are listed in Table 4.

TABLE 4. ARD compositions and mass fractions.
The particle surface tension was calculated based on the work from Rezaei et al. (Rezaei et al., 2002), and the temperature-dependent surface tension of the particle can be calculated as a linear function of its chemical compositions, i.e.,
where γi and mi are the surface tension and mass fraction of oxide i. The surface tension of each oxide is given in Table 5 (Hanao et al., 2007; Wu et al., 2014).
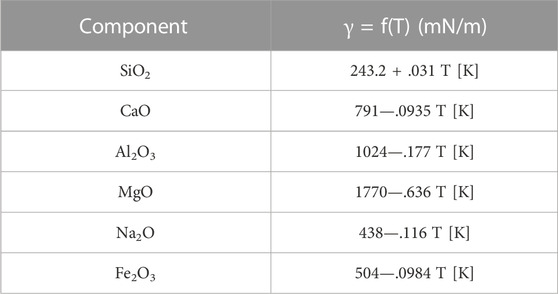
TABLE 5. Surface tension of single oxide.
Based on Table 4 and Table 5, the surface tension of ARD particles as a function of temperature can be estimated by the following equation in unit N/m
The particle melting temperature is one of the most important parameters in the developed deposition model. The melting evolution of nine volcanic ashes around the world for SiO2 content from 50.1% to 71.4% was systematically investigated by Song et al. (2016), and four characteristic temperatures were defined: shrinkage, deformation, hemispherical, and flow. Based on this work and considering 72.3% of SiO2 content, the ARD melting temperature is defined as 1783 K.
The input parameters of the particle rebound/deposition model are given in Table 6. The first seven parameters are particle melting temperature, surface tension, density (Suman et al., 2019), specific heat (ISO 12103-1 and 2016, 1210), diameter, velocity magnitude and temperature (Bowen et al., 2019); while the last variable is the Inconel melting temperature (High Temp Metals, 2015).
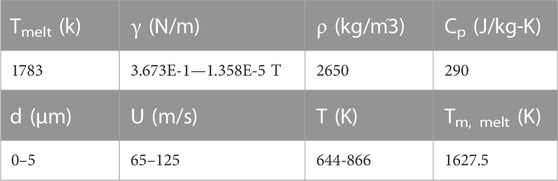
TABLE 6. Rebound/deposition model input parameters.
The traditional Eulerian-Lagrangian approach together with the realizable k-ε turbulence model is used to solve two-phase, turbulent, compressible flows, and the dilute discrete Lagrangian particle tracking method is chosen to study particle behaviours (Stiesch, 2003). The realizable k-ε turbulence model was selected for this case based on the primary author’s many year experience (Jiang, 2020), i.e., it is better to use this model for general thermal flow simulations.
The flow-field results related to particle rebound/deposition modeling are briefly described here, for the case T = 866 K and U = 80 m/s. Figure 4A shows the velocity magnitude contours around the target plate and injection orifice, downstream of the symmetric plane. Although the nominal velocity at the sand injection orifice is 80 m/s, the maximum velocity reaches 118 m/s due to the flow passage sudden contraction at the injection orifice. Approaching the target plate, the flow velocity rapidly decreases, and a stagnation area is observed at the centre of the plate. Figure 4B illustrates the temperature contours downstream of the symmetric plane. The temperature in the equilibration pipe and around the injection orifice is 866 K, and the temperature in the vicinity of the target plate is about 20 K below 866 K due to the heat transfer between the injection flow and cool air entrained from the surrounding environment. Conjugate heat transfers are observed between the pipe flow and entrained-air at the annulus plate formed by the injection orifice and pipe end wall.
FIGURE 4. Flow parameters across the symmetric plane: (A) velocity magnitude, and (B) temperature contours.
For the particle deposition study, the Rosin-Rammler distribution was assumed for the sand size ≤5 μm, and 47,400 particle streams were issued from the injection orifice. The trajectories of ten particles issued from the injection orifice are displayed in Figure 5A, and five are shown in a magnified view in Figure 5B, where the trajectories are colored by the velocity magnitude in a range of 0–120 m/s. As observed in Figure 5A, after leaving the injection orifice, the particle velocity increases to about 120 m/s, remains at this value before rapidly decreasing to zero at the target plate, then bounces off the plate and accelerates radially. Eventually eight particles flow out the flow domain and two stick on the plate. These observations are consistent with the flow velocity distribution in Figure 4. For this test case, the particle sizes are small, and therefore they can follow the gas flow in general.
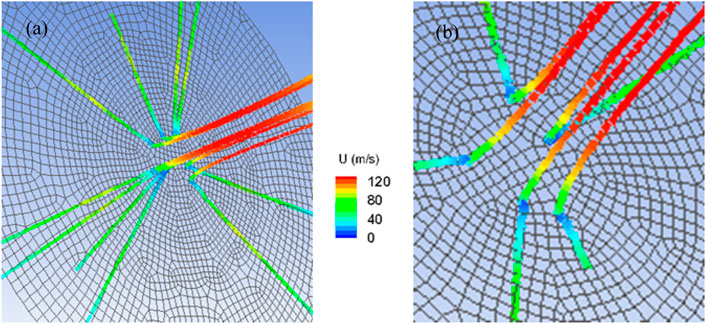
FIGURE 5. Particle trajectories: (A) ten particle trajectories, and (B) zoomed five trajectories.
In Figure 5B, four particles fly out of the domain, while one sticks on the plate. At the moment the deposited particle impinges on the plate, its velocity is reduced to zero; and then it bounces off the plate, accelerates, and eventually re-impinges/sticks on the plate at a velocity of ∼40 m/s. This re-impingement presents the behavior of most deposited particles in this case, where the nominal velocity representing the test condition is significantly different from that of the particle re-impingement. This phenomenon generally is not observed in the case of turbine blades, and thus this perpendicular impingement with a large stagnation zone may represent a special type of particle deposition.
For this medium temperature/velocity calibration/validation case, a few formulations of particle deposition probability were analyzed/tested, and eventually the following expression is selected,
In Eq. 18, A = 2.2, B = 0.7 and C = 2.5. The correlation among the three constants were estimated from a sensitivity analysis with the testing conditions (temperatures and velocities) and corresponding deposition rates.
The variation of deposition rates with temperature is illustrated in Figure 6 for both model prediction and experimental data, where a deposition rate scale of 1% is illustrated. Considering that the experimental accuracy is about 14% (Bowen et al., 2019), which is represented by error bars in the figure, the predicted results are consistent with the experimental data.
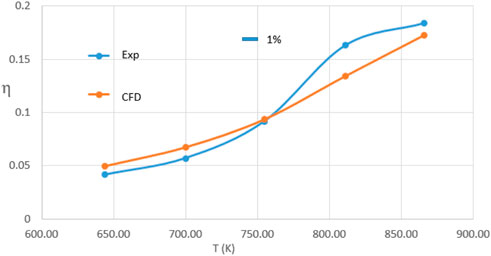
FIGURE 6. Model predicted sand deposition rates in comparison with experimental data.
The reasons for choosing this case to calibrate the developed particle rebound/deposition model are two-fold (Kim et al., 1993). First, the chemical compositions of Mt. St. Helens (MSH) volcanic ash are available and comparable with those of ARD. The mass fractions of two main chemical species SiO2/Al2O3 are 63.2%/16.4% for MSH, and 72.8%/10.8% for ARD. Second, more importantly, the particle deposition rate of the first stage NGV (nozzle guide vane) is available in the open literature.
The computational domain and mesh of the NGV are shown in Figure 7, with a mesh size of 6.2 million cells. Both fluid and solid meshes are illustrated in Figure 7A, and the solid mesh is given in Figure 7B. It is a 6-degree sector in the coordinates of the whole combustor. The computational domain begins upstream of the flat pates of the inner and outer shrouds, and the main flow domain is extended to half of the NGV chord length in the downstream direction.
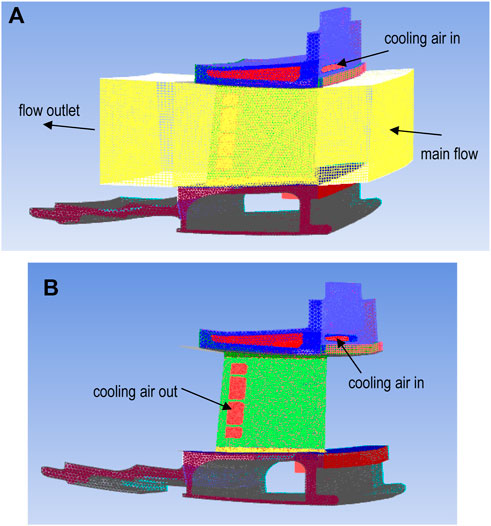
FIGURE 7. Computational domain and mesh: (A) flow and solid mesh, (B) solid mesh.
The boundary conditions were obtained from a combined combustor-NGVs simulation at the engine operating conditions as those in (Kim et al., 1993), where the compressible, two-phase, reacting flow-field of a 60-deg sector of the combustor with ten simplified NGVs was solved (Jiang et al., 2014). The mean total pressure and temperature obtained at the corresponding location were used as the inlet boundary conditions of the NGV main flow, and the cooling airflow rate was 2.3% of the total inlet air flow. The static pressure from the combined simulation at the NGV exit plane was used to define the domain outlet boundary, and a slight adjustment was made to match the total flowrate through the computational domain. For details of combined combustor-NGVs simulation, NGV simulation, mesh topology, size, mesh independence, the reader is referred to (Jiang et al., 2014; Jiang, 2020).
The chemical compositions and mass fractions of Mt. St. Helens volcanic particles (Taylor and Lichte, 1980) are listed in Table 7.
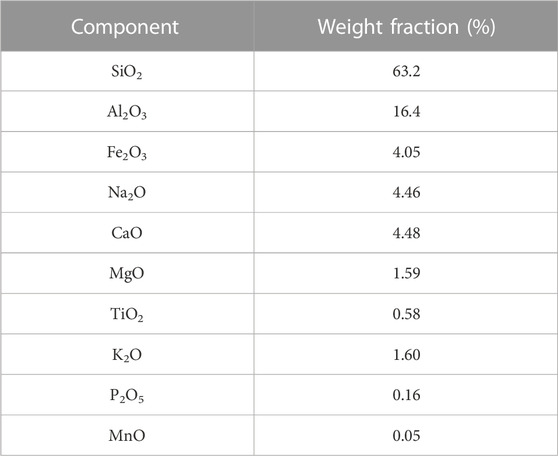
TABLE 7. Mt. St. Helens volcanic particle compositions and weigh fractions.
As for the ARD case, with Table 5 and Table 7, the surface tension of MSH particles can be calculated by the following equation
Similar to the ARD case, considering 63.2% of SiO2 content in MSH particles and the work from (Wu et al., 2014), its melting temperature is defined as 1663 K.
The input parameters to model MSH particle rebound/deposition are given in Table 8. The particle density is obtained from Bouyahyaoui et al. (2018), the specific heat is from Ebert et al. (Ebert et al., 2002), and the particle mean diameter of 23 µm is from Kim et al. (1993). The normalized particle inlet velocity magnitude and temperature are from the combined combustor-NGVs simulation, and the Hastelloy-X melting temperature is from High Temp Metals (High Temp Metals, 2015).
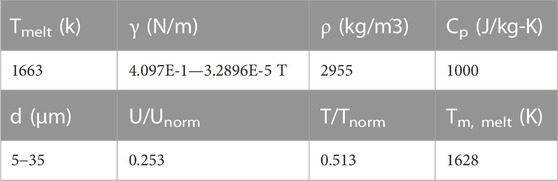
TABLE 8. Rebound/deposition model input parameters.
The same traditional Eulerian-Lagrangian approach as in the ARD case was used to solve two-phase, turbulent, compressible flows (Stiesch, 2003), together with the shear stress transfer k-ω turbulence model. The reason to use this turbulence model in this case is because it has been widely used in turbine machinery flows with a certain confidence (Menter, 1994). Both flow field and solid region were solved with the pressure coupled solver of the ANSYS CFD Premium.
The flow-field results related to particle modeling are briefed here, and the detailed flow-field information such as distributions of velocity, Mach number, temperature, pressure, cooling flow passage, and conjugate heat transfers between the cooling air, NGV body and main hot flow, can be found in (Jiang et al., 2014).
Figure 8 displays the normalized velocity magnitude distributions across one section near the hub (or inner shroud), mid-span section, and one near the shroud (or outer shroud). They are typical NGV flow-fields. At all three sections, a stagnation point is observed at the blade tip, and the velocity gradually increases along the pressure side. On the suction side, the velocity quickly increases after a short distance from the leading edge, and the normalized value is much higher than those on the pressure side, approaching ∼1.0. The internal cooling flow contours of the near-hub section are similar to those at the near-shroud section. The mid-span section cuts through a relatively large solid metal zone in the downstream region, and so there is no flow in this region. These flow features are determined by the cooling passage configuration.
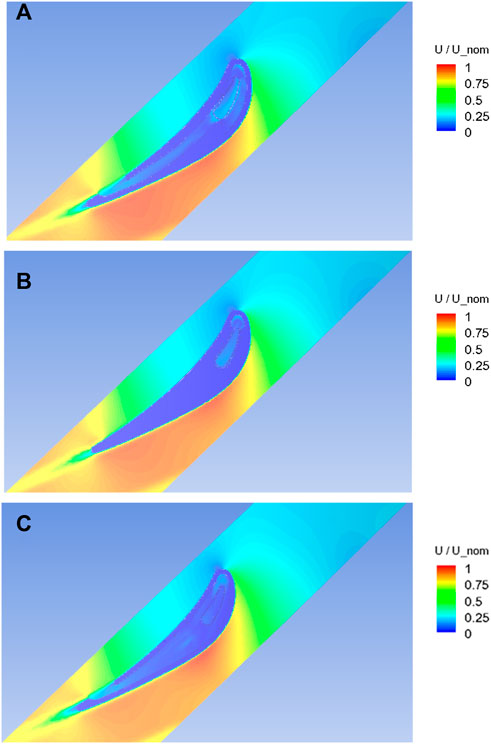
FIGURE 8. Velocity contours at: (A) the near-hub section, (B) the mid-span section, and (C) the near-shroud section.
Normalized temperature contours across the same three sections as in Figure 8 are given in Figure 9. For all three sections, the temperature is high around the leading edge, gradually decreases along the pressure side and rapidly decreases along the suction side due to flow rapid acceleration. Similar to Figure 8, the NGV internal cooling-flow temperature contours at the near-hub section are similar to those of the near-shroud section; while at the mid-span section, the metal surface temperature is quite uniform, surrounding the internal cooling air passage in the upstream.
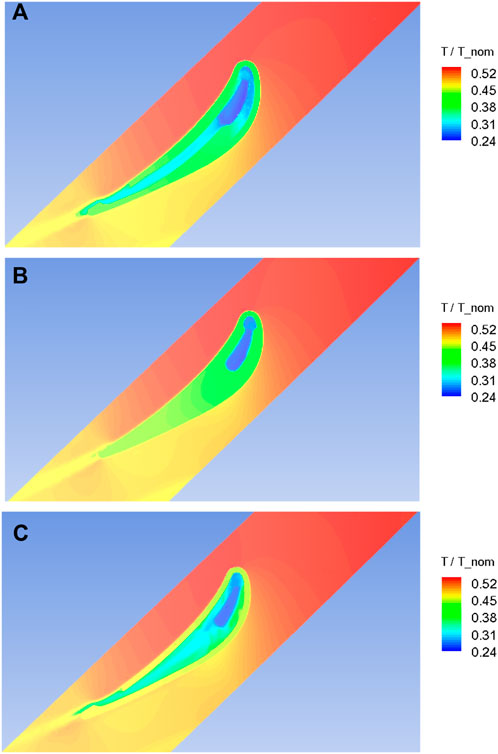
FIGURE 9. Temperature contours at: (A) the near-hub section, (B) the NGV mid-span section, and (C) the near-shroud section.
During the particle deposition study, a Rosin-Rammler size distribution with the minimum/maximum diameters of 5/35 µm and a mean value of 23 µm was assumed. For each particle tracking, 249,400 particle streams were issued from the NGV inlet, and four tracking results were averaged as the final result. Figure 10 shows ten particle trajectories, where the trajectories are colored by the normalized particle velocity magnitude in a range of 0–0.83, and the blade surface meshes are in white color. Figure 10A is a top-down view, and Figure 10B is viewed from the pressure side. All particles leave the NGV inlet at a normalized velocity ∼0.25, the five particles passing through the gap between the blades, gradually accelerate to ∼0.75 and leave the domain. For the five particles impinging on the blade surface, three bounce off the surface with velocities determined by their impact angles, impact velocities and CORs, and then gradually accelerate to ∼0.25 before leaving the domain, while the remaining two stick on the blade surface, as shown in Figure 10B. It is clear that after impinging on the NGV surface, particles either bounce off or stick on the NGV surface, and the so-called re-impingement behavior in the above case is not found for this NGV blade geometry. This was confirmed by tracking many more particles. The anticipated reason are three fold. First, the hot gas flows along the NGV external curvature, and it is expected that particle trajectories are not far from the flow path-lines although the particle inertia modifies particle trajectories to some extent. Second, the drag force acting on the particle can be significant in the high speed NGV flow, which limits the particle deviation from the gas flow. Third, in the high temperature NGV flow, the normal velocity of particles bouncing off the NGV wall is considerably reduced (Delimont et al., 2015).
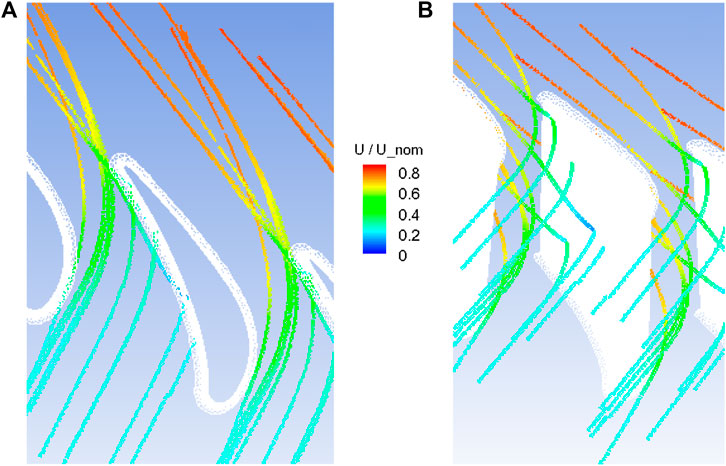
FIGURE 10. Trajectories of ten particles impinging on the NGV external surface: (A) an up-down view, (B) the pressure side view.
For this real engine calibration case, the flow or particle velocity is high and the K+ value is only of the order of 10−3. That is, the particle motion effect on deposition is minor, and the probability of particle deposition on the metal surface is estimated by the following expression,
where A = B = 4.2. Since only one point measurement is available, no sensitivity analysis is performed for the two constants. The predicted particle deposition rate at the engine operating conditions is 4.7% with a maximum deviation of ∼.15%, while the ground engine test result from Kim et al. (Kim et al., 1993) is 4.7%. In addition, the particle deposition rates with and without K+ term in Eq. 20 were compared, and no considerable difference was observed. Because of lack of enough experimental data to validate fully the rebound/deposition model, for the time being, it could only be used as a first-order assessment for particle deposition on engine hot sections.
The variation of particle deposition rate with particle size is shown in Figure 11. As illustrated, the particle size in the range of 5–35 µm has limited effect on the particle deposition rate. For the current model capabilities, the particle deposition rate distribution over the NGV walls is not available, this function will be available in the near future.
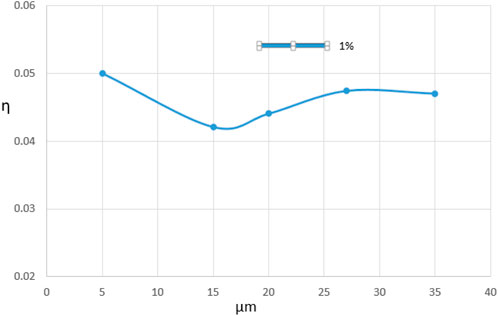
FIGURE 11. Variation of deposition rate with particle size.
As pointed by Suman et al. (2019), the nature of the environmental particles ingested into engines does not lead to a very precise characterization, and it is difficult to establish the limits of validity of sticking models. In this sense, the statistics based rebound/deposition model in this paper may represent a good start, and certainly it will be continuously validated and improved as relevant experimental data become available.
To assess environmental particle impact on engine hot sections, an innovative particle rebound/deposition model is developed. A semi-empirical approach was chosen to model particle bounce off the metal surface. Based on the detailed analysis over seventy experiments related to particle deposition in gas turbine hot sections by Suman et al. (2019), two new non-dimensional parameters are proposed, which are used in the developed deposition model. Metal surface temperature, one critical parameter in particle deposition, is also included in the developed model.
The developed particle rebound/deposition model is successfully implemented/linked into the ANSYS CFD Premium solver. It has been calibrated by two cases: ARD particle impingement on a circular plate and MSH volcanic ash impinging on engine first-stage air-cooled NGVs. For the first case, the calibrated model can fairly well predict the variation of deposition rates with particle injection temperature. The second case shows that particle deposition rate at the real engine operating conditions can be reasonably predicted by the developed model.
The innovative particle rebound/deposition model is a promising start, where a good foundation or platform is laid. The model will be continuously validated and improved as relevant experimental data become available.
The original contributions presented in the study are included in the article/Supplementary Material, further inquiries can be directed to the corresponding author.
All authors listed have made a substantial, direct, and intellectual contribution to the work and approved it for publication.
The authors are grateful to the Department of National Defense Canada and the National Research Council of Canada for funding and supporting this collaborative research project. Also, many thanks go to Dr. Steve Zan for his valuable comments and suggestions in the preparation of the manuscript.
The authors declare that the research was conducted in the absence of any commercial or financial relationships that could be construed as a potential conflict of interest.
All claims expressed in this article are solely those of the authors and do not necessarily represent those of their affiliated organizations, or those of the publisher, the editors and the reviewers. Any product that may be evaluated in this article, or claim that may be made by its manufacturer, is not guaranteed or endorsed by the publisher.
Ai, W., and Fletcher, T. H. (2009). Computational analysis of conjugate heat transfer and particulate deposition on a high-pressure turbine vane 134. Journal of Turbomachinery , GT2009–59573.
Ai, W., Murray, N., Fletcher, T. H., Harding, S., Lewis, S., and Bons, J. P. (2012). Deposition near film cooling holes on a high-pressure turbine vane. J. Turbomach. 134, 041013. doi:10.1115/1.4003672
Atkin, M. L., and Duke, G. A. (1971). The Operation of a Modified Ruston Hornsby Gas Turbine on N.S.W. Bituminous Coal, 133. Canberra, Australia: Aeronautical Research Lab. Dept. of Supply, Australian Defense Scientific Service.
Barker, B., Casady, P., Shankara, P., Ameri, A., and Bons, J. P. (2013). Coal ash deposition on nozzle guide vanes: Part II - computational modeling. J. Turbomach. 135, 011015. doi:10.1115/1.4006399
Bons, J. P., Prenter, R., and Whitaker, S. (2017). A simple physics-based model for particle rebound and deposition in turbomachinery. J. Turbomach. 139, 081009. doi:10.1115/1.4035921
Borello, D., D’Angeli, L., Salvagni, A., Venturini, P., and Rispoli, F. (2014). Study of particles deposition in gas turbine blades in presence of film cooling. ASME Paper, GT2014–26250.
Boulanger, A., Hutchinson, J., Ng, W. F., Ekkad, S. V., Keefe, M. J., Xu, W., et al. (2017). Experimental investigation of the onset of sand deposits on Hastelloy-X between 1, 000°C and 1, 100°C. Aeronaut. J. 121 (1242), 1187–1199. doi:10.1017/aer.2017.48
Boulanger, A., Patel, H., Hutchinson, J., DeShong, W., Xu, W., Ng, W., et al. (2016). Preliminary experimental investigation of initial onset of sand deposition in the turbine section of gas turbines. Proceeding of the ASME Turbo Expo 2016: Turbomachinery Technical Conference and Exposition, Seoul, South Korea, June 2016 GT2016–56059.
Bouyahyaoui, A., Cherradi, T., Abidi, M. L., and Juimo Tchamdjou, W. H. (2018). Characterization of particle shape and surface properties of powders from volcanic scoria. J. Mater. Environ. Sci. 9 (7), 2032–2041.
Bowen, C. P., Libertowski, N. D., Mortazavi, M., and Bons, J. P. (2019). Modeling deposition in turbine cooling passages with temperature dependent adhesion and mesh morphing. J. Eng. Gas Turbines Power 141, 071010. doi:10.1115/1.4042287
Brach, R. M., and Dunn, P. F. (1992). A mathematical model of the impact and adhesion of microsphers. Aerosol Sci. Technol. 16, 51–64. doi:10.1080/02786829208959537
Buckingham, E. (1914). On physically similar systems; illustrations of the use of dimensional equations. Phys. Rev. 4, 345–376. doi:10.1103/physrev.4.345
Chambers, J. C. (1985). The 1982 encounter of British airways 747 with the Mt. Galuggung eruption cloud. AIAA Paper 85-0097.
Delimont, J. M., Murdock, M. K., Ng, W. F., and Ekkad, S. V. (2015). Effect of temperature on microparticle rebound characteristics at constant impact velocity—Part II. J. Eng. Gas. Turbine. Power 137–112603. doi:10.1115/1.4030313
Dunn, M. G., Baran, A. J., and Miatah, J. (1994). “Operation of gas turbine engines in volcanic ash clouds” in ASME 1994 International Gas Turbine and Aeroengine Congress and Exposition, Portland, United States, 94–170.
Dunn, M. G., Padova, C., Moller, J. E., and Adams, R. E. (1987). Performance deterioration of a turbofan and a turbojet engine upon exposure to a dust environment. J. Eng. Gas Turbines Power 109, 336–343. doi:10.1115/1.3240045
Ebert, H. P., Hemberger, F., Fricke, J., Buttner, R., Bez, S., and Zimanowski, B. (2002). Thermophysical properties of a volcanic rock material. High. Temp. -High. Press. 34, 561–568. doi:10.1068/htjr058
El-Batsh, H., and Haselbacher, H. (2002). Numerical investigation of the effect of ash particle deposition on the flow field through turbine cascade. IGTI paper. GT-2002-30600 doi:10.1115/GT2002-30600
Elms, J., Pawley, A., Bojdo, N., Jones, M., and Clarkson, R. (2020). The Formation of high temperature minerals from an evaporate-rich dust in gas turbine engine ingestion tests. IGTI paper, GT2020–14236.
Grant, G., and Tabakoff, W. (1975). Erosion prediction in turbomachinery resulting from environmental solid particles. J. Aircr. 12 (5), 471–478. doi:10.2514/3.59826
Hamed, A., Tabakoff, W., and Wenglarz, R. (2006). Erosion and deposition in turbomachinery. J. Propuls. Power 22, 350–360. doi:10.2514/1.18462
Hanao, M., Tanaka, T., Kawamoto, M., and Takatani, K. (2007). Evaluation of surface tension of molten slag in multi-component systems. ISIJ Int. 47, 935–939. doi:10.2355/isijinternational.47.935
High Temp Metals (2015). Hastelloy X technical data,” 12500 foothill blvd. Sylmar, CA: High Temp Metals, Inc.
Iso 12103-1, 2016 Road vehicles – test contaminants for filter evaluation –Part 1: Arizona test dust. Geneva, Switzerland: International Organization for Standardization.
Jiang, L. Y., Benner, M., and Bird, J. (2012). Assessment of scavenge efficiency for a helicopter particle separation system. J. Am. helicopter Soc. 57, 41–48. doi:10.4050/jahs.57.022007
Jiang, L. Y. (2020). Gas turbine combustor modelling. Newcastle upon Tyne, England: Scholars’ Press. ISBN 978-613-8-93073-0.
Jiang, L. Y., Han, Y., and Patnaik, P. (2018). Characteristics of volcanic ash in a gas turbine combustor and nozzle guide vanes. J. Eng. Gas Turbines Power 140, 071502. doi:10.1115/1.4038523
Jiang, L. Y., Wu, X., and Zhong Zhang, Z. (2014). Conjugate heat transfer of an internally air-cooled nozzle guide vane and shrouds. Adv. Mech. Eng. 6, 146523. doi:10.1155/2014/146523
Kim, J., Dunn, M. G., and Baran, A. J. (1991). The 'most probable' dust blend and its response in the F-100 hot section test system (HSTS). Defense Nuclear Agency, Technical Report No. DNA-TR-91-160.
Kim, J., Dunn, M. G., Baran, A. J., Wade, D. P., and Tremba, E. L. (1993). Deposition of volcanic materials in the hot sections of two gas turbine engines. J. Eng. Gas Turbines Power 115, 641–651. doi:10.1115/1.2906754
Kleinhans, U., Wieland, C., Babat, S., Scheffknecht, G., and Spliethoff, H. (2016). Ash particle sticking and rebound behavior: A mechanistic explanation and modeling approach. Proc. Combust. Inst. 36, 2341–2350. doi:10.1016/j.proci.2016.05.015
Lundgreen, R., Sacco, C., Prenter, R., and JeffreyBons, P. J. P. (2016). Temperature effects on nozzle guide vane deposition in a new turbine cascade rig. Seoul, South Korea, GT2016–57560.
Mann, D. L., and Wares, G. D. (1994). Future direction in helicopter engine protection system configuration, 588. AGARD-CP. Paper No. 4.
Mao, T., Kuhn, D. C. S., and Tran, H. (1997). Spread and rebound of liquid droplets upon impact on flat surfaces. AIChE J. 43, 2169–2179. doi:10.1002/aic.690430903
Menter, F. R. (1994). Two-equation eddy-viscosity turbulence models for engineering applications. AIAA J. 32 (8), 1598–1605. doi:10.2514/3.12149
Mitchell, H. J., and Gilmore, F. R. (1982). Dust-cloud effects on aircraft engines: Emerging issues and new damage mechanisms. Palo Alto, CA: RDA-TR-120012-001, Research/Development Associates.
Mizutori, K., Fukudome, K., Yamamoto, M., and Suzuki, M. (2019). “Numerical simulation of deposition phenomena on high-pressure turbine vane using UPACS,” in Proceedings of the ASME-JSME-KSME 8th Joint Fluids Engineering Conference, San Francisco, Ca, USA, July 2019. AJKFluids2019-5612. doi:10.1115/AJKFluids2019-5612
Moller, J. C., and Dunn, M. G. (1989). Dust and smoke phenomenology testing in a gas turbine hot section simulator. Calspan Advanced Technology Center, Technical Report No DNA-TR-90-72-V2.
Ni, J., Yu, G., Guo, Q., Zhou, Z., and Wang, F. (2011). Sub-model for predicting slag deposition formation in slagging gasification systems. Energy fuels. 25, 1004–1009. doi:10.1021/ef101696a
Nomoto, H. (2017). “Solid particle erosion analysis and protection design for steam turbines,” in Advances in steam turbines for modern power plants. Editor T. Tanuma (New York, NY: Elsevier), 219–239. 978-0-08-100314-5.
Reagle, C. J., Delimont, J. M., Ng, W. F., and Ekkad, S. V. (2014). Study of micro-particle rebound characteristics under high temperature conditions. J. Eng. Gas. Turbine. Power 136, 011501. doi:10.1115/1.4025346
Rezaei, H. R., Gupta, R. P., Wall, T. F., Miyamae, S., and Makino, K. (2002). “Modelling the initial structure of ash deposits and structure changes due to sintering,” in Impact of mineral impurities in solid fuel combustion. Editors R. P. Gupta, T. F. Wall, and L. Baxter (New York: Kluwer Academic Publishers), 753–766.
Suman, A., Casari, N., Fabbri, E., di Mare, L., Montomoli, F., and Pinelli, M. (2019). Generalization of particle impact behavior in gas turbine via non-dimensional grouping. Prog. Energy Combust. Sci. 74, 103–151. doi:10.1016/j.pecs.2019.05.001
Singh, S., and Tafti, D. K. (2016). Prediction of sand transport and deposition in a two-pass internal cooling duct. J. Eng. Gas Turbines Power 138, 07260. doi:10.1115/1.4032340
Smith, J., Cargill, R. W., Strimbeck, D. C., Nabors, W. M., and McGee, J. P. (1967). Bureau of Mines Coal-Fired Gas Turbine Research Project: Test of New Turbine Blade Design, RI 6920. Washington, DC: U.S. Dept. of the Interior, Bureau of Mines.
Soltani, M., and Ahmadi, G. (1994). On particle adhesion and removal mechanisms in turbulent flows. J. Adhes. Sci. Technol. 8 (7), 763–785. doi:10.1163/156856194x00799
Song, W., Lavalle, Y., Hess, K. U., Kueppers, U., Cimarelli, C., and Dingwell, D. B. (2016). Volcanic ash melting under conditions relevant to ash turbine interactions. Nat. Commun. 7, 10795. doi:10.1038/ncomms10795
Sreedharan, S. S., and Tafti, D. K. (2010). Composition dependent model for the prediction of syngas ash deposition with application to a leading-edge turbine vane. ASME Paper, GT2010–23655.
Srinivasachar, S., Helble, J. J., and Boni, A. A. (1990). An experimental study of the inertial deposition of ash under coal combustion conditions. Symposium Combust. 23, 1305–1312. doi:10.1016/s0082-0784(06)80394-2
Tabakoff, W., Hamed, A., and Murugan, X. (1996). Effect of target materials on the particle restitution characteristics for turbomachinery application. J. Propuls. Power 12 (2), 260–266. doi:10.2514/3.24022
Tabakoff, W., Malak, M., and Hamed, A. (1987). Laser measurements of solid-particle rebound parameters impacting on2024 aluminum and 6A1-4V titanium alloys. AIAA J. 25 (5), 721–726. doi:10.2514/3.9688
Taslim, M. E., and Spring, S. (2010). A numerical study of sand particle distribution, density, and shape effects on the scavenge efficiency of engine inlet particle separator systems. J. Am. helicopter Soc. 55, 022006–220069. doi:10.4050/jahs.55.022006
Taylor, H. E., and Lichte, F. E. (1980). Chemical composition of mount st. Helens volcanic ash. Geophys. Res. Lett. 7 (11), 949–952. doi:10.1029/gl007i011p00949
Ukiwe, C., and Kwok, D. Y. (2005). On the maximum spreading diameter of impacting droplets on well-prepared solid surfaces. Langmuir 21 (2), 666–673. doi:10.1021/la0481288
Wakeman, T., and Tabakoff, W. (1982). Measured particle rebound characteristics useful for erosion prediction. American Society of Mechanical Engineers ASME.New York, USA Paper 82-GT-170.
Walsh, P. M., Sayre, A. N., Loehden, D. O., Monroe, L. S., Beér, J. M., and Sarofim, A. F. (1990). Deposition of bituminous coal ash on an isolated heat exchanger tube: Effects of coal properties on deposit growth. Prog. Energy Combust. Sci. 16, 327–345. doi:10.1016/0360-1285(90)90042-2
Wenglarz, R. A., and Wright, I. G. (2003).June 2003 Alternate fuels for land-based turbines,” materials and practices to improve resistance to fuel derived environmental damage in land- and sea-based turbines, rept. 1009173, EPRI. Golden, Colorado: Colorado School of Mines, 445–464.
Whitaker, S. M., Peterson, B., Miller, A. F., and Bons, J. P. (2016). The effect of particle loading, size, and temperature on deposition in a vane leading edge impingement cooling geometry. Seoul, South Korea, GT2016–57413.
Wu, C., Cheng, G., and Ma, Q. (2014). Calculating models on the surface tension of CaO-FeO-SiO2 molten slags. Res. Material Sci. 3, 10–16.
Yu, K., and Tafti, D. (2019). Size- and temperature-dependent collision and deposition model for micron-sized sand particles. J. Turbomach. 141, 031001. doi:10.1115/1.4042215
Zagnoli, D., Prenter, R., Ameri, A., and Bons, J. P. (2015). Numerical study of deposition in a full turbine stage using steady and unsteady methods. ASME Paper GT2015-43613.
A model constant
ARD Arizona road dust (referred as standard sand, ISO 12103-1, 2016)
B model constant
C model constant
CMAS calcium magnesium aluminosilicate
COR coefficient of restitution
Cp particle specific heat (J/kg-K)
Cu Cunningham correction factor
d particle diameter (μm)
E Young’s modulus (N/m2)
Ec composite Young’s modulus (N/m2)
Ekin kinetic energy (J)
Ere remaining energy fraction
K non-dimensional parameter, Ekin/Ssurf
K+ non-dimensional parameter, Ssurf/Ekin
m mass (g) or mole fraction
mcapture captured particle mass (g)
missue issued particle mass (g)
P probability
Pm deposition probability related to metal surface
r radius (m)
Ssurf surface energy (J)
T flow or particle temperature (K)
Tm metal surface temperature (K)
Tm, melt metal melting temperature (K)
Tmelt particle melting temperature (K)
Tsoft particle softening temperature (K)
U velocity magnitude or normal velocity (m/s)
vcr critical velocity (m/s)
V tangential velocity (m/s)
vsh critical wall shear velocity (m/s)
WA working of sticking (J/m2)
μcr critical viscosity (Pa·s)
μTp viscosity of the particle at the current temperature (Pa·s)
α impact angle (degree and for the normal impact α = 90°)
γ particle surface tension (N/m or mN/m)
η particle deposition rate
Θ non-dimensional parameter, T/Tsoft
Θ+ non-dimensional parameter, T/Tmelt
ξ spread factor
ρ particle density (kg/m3)
Keywords: environmental particle, sand, rebound, deposition, modeling, engine, hot-section
Citation: Jiang L-Y, Trembath P, Patnaik P and Capurro M (2023) Environmental particle rebound/deposition modeling in engine hot sections. Front. Mech. Eng 8:924755. doi: 10.3389/fmech.2022.924755
Received: 20 April 2022; Accepted: 30 November 2022;
Published: 05 January 2023.
Edited by:
Adel Ghenaiet, University of Science and Technology Houari Boumediene, AlgeriaCopyright © 2023 His Majesty the King in Right of Canada. This is an open-access article distributed under the terms of the Creative Commons Attribution License (CC BY). The use, distribution or reproduction in other forums is permitted, provided the original author(s) and the copyright owner(s) are credited and that the original publication in this journal is cited, in accordance with accepted academic practice. No use, distribution or reproduction is permitted which does not comply with these terms.
*Correspondence: Lei-Yong Jiang, bGVpLXlvbmcuamlhbmdAbnJjLWNucmMuZ2MuY2E=
Disclaimer: All claims expressed in this article are solely those of the authors and do not necessarily represent those of their affiliated organizations, or those of the publisher, the editors and the reviewers. Any product that may be evaluated in this article or claim that may be made by its manufacturer is not guaranteed or endorsed by the publisher.
Research integrity at Frontiers
Learn more about the work of our research integrity team to safeguard the quality of each article we publish.