 Bryan Zavala1
 James E. McCarthy
  Andrew Matheaus
94% of researchers rate our articles as excellent or good
Learn more about the work of our research integrity team to safeguard the quality of each article we publish.
Find out more
ORIGINAL RESEARCH article
Front. Mech. Eng., 25 July 2022
Sec. Engine and Automotive Engineering
Volume 8 - 2022 | https://doi.org/10.3389/fmech.2022.918003
This article is part of the Research TopicCoordinated Design and Control of Engine and Aftertreatment Systems for Reduced Vehicular NOx and CO2 EmissionsView all 4 articles
Commercial vehicles require fast aftertreatment heat-up in order to move the selective catalytic reduction catalyst into the most efficient temperature range to meet upcoming NOX regulations while minimizing CO2. This study is a follow-up study using an electric heater upstream of a LO-SCR followed by a primary aftertreatment system having an engine equipped with cylinder deactivation. The focus of this study is to minimize the maximum power input to the e-heater without compromising tailpipe NOX and CO2. A system solution is demonstrated using a heavy-duty diesel engine with an end-of-life aged aftertreatment system targeted for 2027 emission levels using various levels of controls. The baseline layer of controls includes cylinder deactivation to raise the exhaust temperature more than 100°C in combination with elevated idle speed to increase the exhaust mass flow rate through the aftertreatment system. The engine load is adjusted to compensate for generating electrical power on the engine. The combination of electrical heat, added load, cylinder deactivation, and elevated idle speed allows the aftertreatment system to heat up in a small fraction of the time required by today’s systems. This work was quantified over the cold federal test procedure, hot FTP, low load cycle (LLC), and the U.S. beverage cycle showing improved NOX and CO2 emissions. The improvement in NOX reduction and the CO2 savings over these cycles are highlighted.
Diesel cylinder deactivation (CDA) has proven essential for increasing selective catalytic reduction (SCR) temperature for NOX reduction while minimizing CO2 in the pursuit of upcoming regulations of NOX and CO2 (McCarthy, 2017a; McCarthy, 2017b; Joshi et al., 2017; Joshi et al., 2018; Ramesh et al., 2018; McCarthy, 2019; Neely et al., 2020a; Matheaus et al., 2021). CDA maintains the SCR in a favorable temperature range for NOX reduction and reduces engine-out (EO) NOX. The low load engine operation becomes more fuel efficient using CDA, resulting in CO2 reduction that can be realized on the new low load cycle (LLC) and even the heavy-duty federal test procedure (FTP). The California Air Resources Board (CARB) adopted new emission regulations in the United States for 2024 and 2027 (California Air Resources Board, 2019; Wang, 2019; California Air Resources Board, 2021), while the Environmental Protection Agency (EPA) is pursuing lower emission regulations as well (EPA, 2020). A thorough investigation for meeting these emission standards have been published (McCarthy, 2017a; Sharp et al., 2017a; McCarthy, 2017b; Sharp et al., 2017b; Sharp et al., 2017c; Joshi et al., 2017; Joshi et al., 2018; Ramesh et al., 2018; McCarthy, 2019; Neely et al., 2020a; Neely et al., 2020b; Chundru et al., 2020; Matheaus et al., 2020; Rao et al., 2020; Sharp, 2020; Zavala et al., 2020; California Air Resources Board, 2021; Harris et al., 2021; Matheaus et al., 2021; McCarthy et al., 2022). The CDA switching strategy, moving in and out of CDA, has been demonstrated to have smooth transitions without torque fluctuations (Gosala et al., 2017; Allen et al., 2018; Gosala et al., 2018; Allen et al., 2019). The number of cylinders deactivated is a function of speed and load and are discussed in these references. This work is complemented with other facets of CDA for seamless operation (Ding et al., 2015; Lu et al., 2015; Halbe et al., 2017; McCarthy et al., 2017; Roberts et al., 2020). Finally, CDA has shown that noise, vibration, and harshness (NVH) on diesel is proven to be manageable (Archer and McCarthy, 2018; Reinhart et al., 2020; Pieczko et al., 2021), and there were no observable oil consumption issues over the 4 years of running this engine.
This study leverages previous works for a heavy-duty engine calibration with CDA and a close-coupled aftertreatment system. Figure 1A shows the aftertreatment system that was coupled with a CDA engine for meeting upcoming regulations. The aftertreatment system uses a LO-SCR followed by a primary AT system including a diesel particulate filter (DPF) and dual path SCR. The Light-Off Selective Catalytic Reduction (LO-SCR) is placed as close to turbine’s exit as possible (approximately 42 inches) so that the catalyst reaches temperature quickly to reduce the NOX emissions as soon as possible. All catalysts were aged to the full useful life, both using a development-aged process and a full engine–aged process. Table 1 shows the reduction from a 3.0 g/hp-hr NOX engine to a 0.015 tailpipe (TP) with development-aged catalysts and 0.023 TP with final engine–aged catalysts. It should be noted that the engine calibration was altered as it approached end of life, which resulted in slightly higher CO2 than previous works. This is considered normal, as a calibration during early life can easily meet emissions performance and have lower CO2. As a system approaches end of life, however, NOX reduction performance can be maintained with changes to engine thermal management. This, though, will diminish the fuel savings benefit.
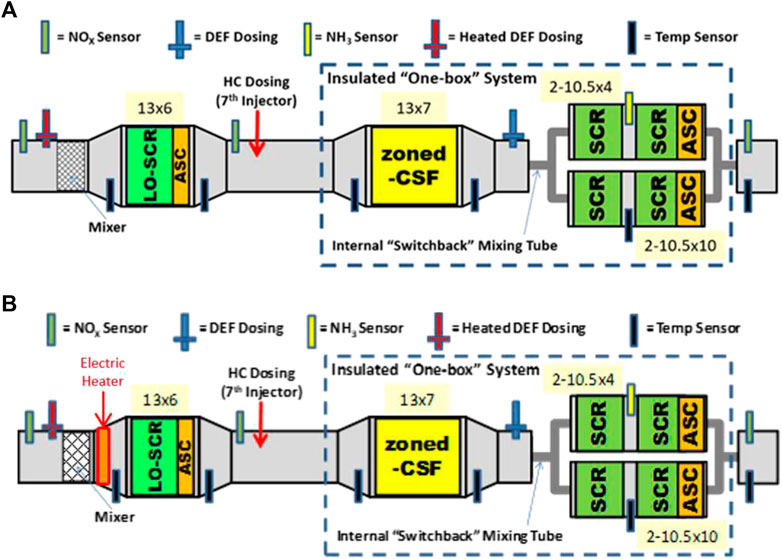
FIGURE 1. (A) LO-SCR + Primary AT system used in combination with CDA for meeting upcoming emission regulations (Neely et al., 2020a; Sharp, 2020; Matheaus et al., 2021). (B) Electric heater (EH) placed upstream of the LO-SCR + Primary AT system used in combination with CDA for meeting upcoming emissions regulations (Matheaus et al., 2021).
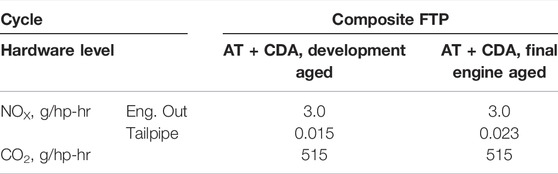
TABLE 1. Comparison of development-aged and engine-aged aftertreatment system that serves as the basis for this study (Sharp et al., 2017c).
Figure 1B shows the addition of an electric heater (EH) that is positioned upstream of the LO-SCR followed by the primary AT system, which was also coupled with a CDA engine. Previous works using this system found that utilizing the EH with a maximum power output of 5 kW was useful in meeting upcoming emission regulations and further reduced CO2. A 5 kW EH would require a 48 V electrical system to maintain EH current levels in a manageable range.
Tables 2, 3 show the test variations using the 5 kW EH relative to the base configuration from Figure 1A without the EH. All results account for the engine generating the electricity for the EH, unless otherwise noted (Matheaus et al., 2021). Table 2 shows the composite FTP which had the best result using the 5 kW EH with CDA, relative to CDA alone, dropping the CO2 by 0.8%–511 g/hp-hr. The results also indicated a small tailpipe NOX increase, but the system maintained NOX below the adopted CARB 2027 standard. Table 3 shows the low load cycle (LLC) using the 5 kW EH and CDA in a similar manner. Adding the 5 kW EH further dropped TP NOX in half to 0.012 g/hp-hr while also reducing CO2 by 1.8%–612 g/hp-hr. In the case where the vehicle batteries are charged via regenerative braking and the engine does not need to generate the electricity, further CO2 savings to 6.1% can be realized as noted by the “free energy” in the table.
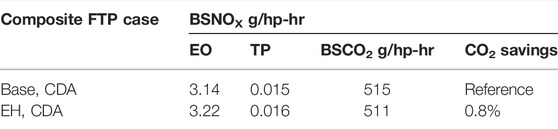
TABLE 2. Composite FTP emissions with 5 kW EH and CDA.
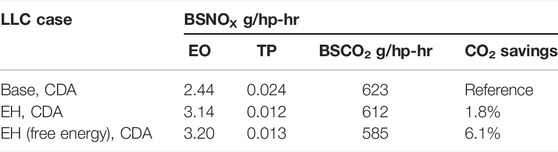
TABLE 3. LLC emissions with 5 kW EH and CDA.
The motivation of this work was to determine whether the maximum EH power could be substituted with 2.4 kW or 1.2 kW instead of the 5 kW from the previous work when using the same AT system with CDA. The reason for this test is that a maximum power of 2.4 kW may enable a smaller EH design that packages well into the aftertreatment system. For instance, a 2.4 kW EH could fit in a 4- or 5-inch-diameter exhaust pipe with negligible impact on aftertreatment system backpressure. A matrix of tests were executed that includes the base experiment shown in Figure 1A with CDA to the EH configuration with CDA in Figure 1B varying the maximum power from 5 to 2.4 to 1.2 kW over the FTP, LLC, and beverage cycles.
The engine utilized for this campaign was a modified Cummins X15 platform equipped with cylinder deactivation. The engine features an updated calibration strategy with critical elements required for achieving low NOX emissions, as well as CO2 neutrality. Table 4 provides specifications for the Cummins X15 engine platform.
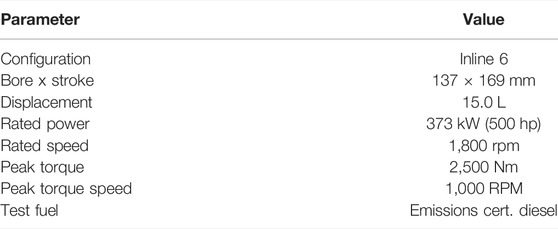
TABLE 4. Cummins X15 engine parameters.
Engine and aftertreatment evaluations were completed in a Code of Federal Regulations Part 1,065 compliant engine test cell. Characterization equipment included the following:
• A raw Horiba MEXA 7200 for the engine-out emissions sampling.
• Two FT-IRs located at the LO-SCR outlet and tailpipe.
• A dilute MEXA 7200 for tailpipe emission measurements.
This section discusses the EH operating modes followed by the approach used for the test cycles. The same EH, procedure, and means for power the EH from Matheaus et al. (2021) was used, while maximum EH power setting was varied from 5 to 2.4 to 1.2 kW. The electrical energy approach used in Matheaus et al. (2021) was to compensate for the EH power demand by instantaneously increasing the engine load. The current and voltage were measured out of the EH controller to make this power compensation. An electrical conversion efficiency of 80% was assumed in order to account for losses in generating electricity driving an alternator mechanically. The load was calculated in real time and added to the engine power demand. This power did not count toward the cycle work as it was not shaft work. Finally, a “free energy” mode of operation was included in the test plan. This mode of operation assumes that the EH power was provided by recuperated energy (braking energy) stored in batteries instead of being instantaneously generated by the engine.
The key test cycles evaluated were heavy-duty FTP, LLC, and U.S. beverage cycle. It is worth noting that CDA is highly effective up to 3–4 bar BMEP (McCarthy, 2017a; Sharp et al., 2017a; McCarthy, 2017b; Sharp et al., 2017b; Sharp et al., 2017c; Joshi et al., 2017; Joshi et al., 2018; Ramesh et al., 2018; California Air Resources Board, 2019; McCarthy, 2019; Wang, 2019; Neely et al., 2020a; EPA, 2020; California Air Resources Board, 2021; Matheaus et al., 2021). The FTP cycle spends 62% of the time below 3 bars, while the LLC and U.S. beverage cycle have higher time allotments of 81% and 85%, respectively. These high percentages provide ample opportunity to make use of CDA.
Results will be discussed for each of the cycles tested: FTP (composite, cold, and hot), LLC, and beverage cycle. A total of five experiments were completed: no heater (baseline), 1.2, 2.4, 2.4 kW (free energy), and 5 kW heater target experiments. Although duplicate testing was not completed in this campaign, the authors can comment on the test-to-test variability. Historically, tailpipe NOX variability is ∼ ± 0.001 g/hp-hr and tailpipe CO2 variability is ∼ ± 2 g/hp-hr. This statement holds true for all cycles discussed in this effort. The baseline testing (no heater) and 5 kW runs were tested 15 months earlier (Matheaus et al., 2021), and the results in this study match well.
A primary objective of the low NOX efforts was to provide a technology demonstration capable of meeting the 0.02 g/hp-hr NOX standard. This required an aftertreatment system to be aged and tested at multiple aging intervals, which reflected different service accumulation points. As the aftertreatment system was tested, it was apparent to the investigators that the calibration strategy required adjustments. The adjustments would enable the aftertreatment system to remain below the adopted CARB low NOX standard. The adjustments include a more aggressive thermal management strategy, which increased exhaust temperature and reduced engine-out NOX mass rates. This is accomplished by higher EGR rates and retarded injection timing. This strategy, however, also increased the CO2 emissions, which reduced the advanced technology’s fuel economy approach. Neely et al. can be referenced regarding the engine’s thermal management approach, engine mode information, and CDA strategy (Neely et al., 2020a; Neely et al., 2020b). A new reference test result was needed to be generated to account for this adjustment in engine calibration. The CDA + LO-SCR + primary AT configuration (i.e., without the EH and with the EH at 5 kW) was tested as this new reference. Thus, the 5 kW results presented, or the reference, accounted for changes made to the engine calibration strategy.
The composite FTP results are discussed first, followed by a detailed discussion of the cold and hot FTP. Table 5 shows the composite results in a quantitative form, while Figure 2 shows the results in a graphical form. The baseline composite FTP resulted in 0.014 g/hp-hr NOX and 521 g/hp-hr CO2. It should be noted that these results were re-baselined from the previous works showing lower CO2 at 515 g/hp-hr, as the engine calibration was adjusted to represent true end-of-life conditions that require a little more CO2 to lower NOX. This complete set of tests was generated approximately 15 months later than the previous results (Matheaus et al., 2021). As such, all results in this section were completed in the same week to maintain a true point-to-point comparison.
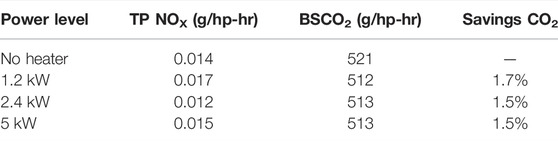
TABLE 5. Composite FTP.

FIGURE 2. Composite FTP results.
Re-testing the 5 kW maximum EH power showed nearly equivalent NOX at 0.015 g/hp-hr, while the CO2 was reduced by 1.5%–513 g/hp-hr. This CO2 reduction was consistent with previous results that showed 1.4% CO2 reduction, so excellent consistency was realized. Reducing the maximum EH power to 2.4 kW, the NOX slightly reduced to 0.012 g/hp-hr, to about ¼ of the 2027 CARB standard, saving a little more CO2 at 1.6%. This yielded the best NOX and CO2 trade-off. The final results showed that by reducing the maximum EH power to 1.2 kW, the NOX was slightly increased to 0.017 (still within 2027 regulations) and saving a little more CO2 to 1.8%. Overall, the 2.4 kW maximum EH calibration, when paired with CDA, offers the best NOX (0.012 g/hp-hr) along with a 1.6% CO2 savings compared to the CDA baseline. Since 2.4 kW offered the best trade-off, when used with CDA, an EH may offer many possibilities for easy integration in the aftertreatment system and vehicle.
A detailed analysis of the cold and hot FTPs that formed the composite results is provided in the next sections. It is worth noting that the minimum DEF injection threshold for the LO-SCR and downstream SCR were 130°C and 180°C, respectively. The LO-SCR threshold was made possible by utilizing a heated DEF injector, which was designed to inject DEF at low temperatures. Temperature triggers would be based the LO-SCR inlet and the dual pathway SCR inlet temperature sensors. The downstream SCR utilized unheated DEF.
The cold FTP sets result from the baseline that include CDA, LO-SCR, and primary AT system followed by the use of an EH upstream of the LO-SCR at three power levels (5, 2.4, and 1.2 kW) is provided. The baseline was CDA, LO-SCR, and primary AT. The cold FTP results are presented in Table 6 in a quantitative form and Figure 3 in a graphical form. All cold start evaluations were started with the aftertreatment system temperatures between 20°C and 30 °C as defined by 40 CFR part 1,065.
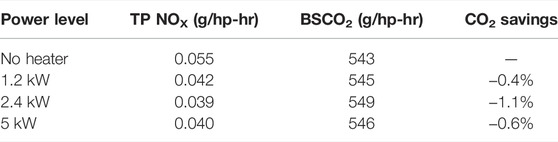
TABLE 6. Cold FTP results.
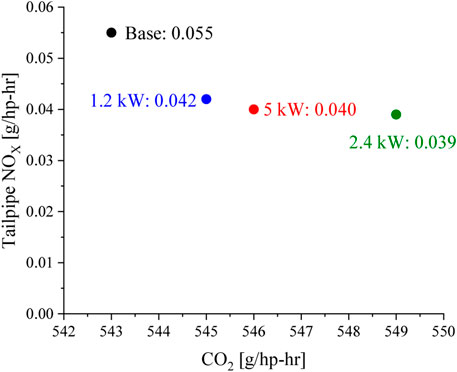
FIGURE 3. Cold FTP results.
Overall, the heater results were similar in regards to NOX and CO2 emissions. With the heater installed, tailpipe BSNOX was shown to improve by an average of 27%, relative to the baseline, while maintaining similar CO2 results. The 5 kW setpoint dropped NOX by 27%, 2.4 kW by 29%, and 1.2 kW by 24%.
Figures 4A–F provide critical performance parameters considered during the testing sequence. This includes aftertreatment temperature, cumulative NOX emissions, heater power, and cumulative CO2 emissions. As shown in Figure 4A, the LO-SCR average temperatures were similar between the different heater experiments. Because the temperature profiles were similar, catalyst performance did not improve with the increase in maximum heater power. Figure 4A also shows the difference between the no heater and the heater experiments to be 35°C within the first 200 s. This temperature increase was advantageous as the downstream system had yet to reach meaningful SCR catalyst activity temperatures (shown in Figure 4B). The higher LO-SCR temperatures improved LO-SCR performance within the first 400 s as shown by the instantaneous NOX conversion in Figure 4C and ultimately reduced tailpipe emissions (shown in Figure 4D).
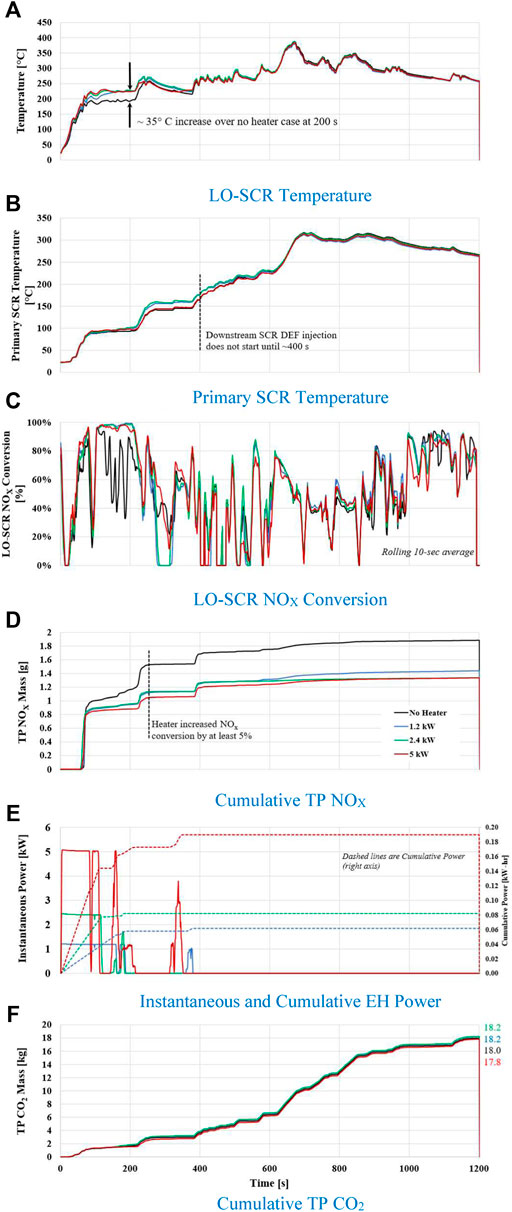
FIGURE 4. (A–F) Cold FTP.
The cold start cycles also yielded similar CO2 results and were within 0.5% from the baseline result, as well as the heater result CO2 average. This was attributed to the relatively low amount of heater “ON” time observed during the cycle. Figures 4E,F illustrate the heater power and cumulative CO2 mass, respectively. The majority of heater operation, shown in Figure 4E, was observed during the first 200 s when the LO-SCR was at low temperatures. The 1.2 and 5 kW experiments also had a brief activity after 200 s, but by then, the LO-SCR was near optimal conditions. As shown in Figure 4F, the CO2 cumulative trends were similar.
Additional insights on CO2 emissions are provided in Figures 5A–C. Figure 5A shows the cumulative engine-out NOX being similar for different experiments. Figure 5B shows the engine calibration strategy switching points from the thermal management mode to the fuel economy mode. With the exception of the 5 kW experiment, there was no difference in switching points between the baseline and the 1.2 kW/2.4 kW results. For the 5 kW case, the thermal management mode had a longer duration, but it did not greatly influence the final results. A closer look at the extended thermal management segment in the 5 kW experiment revealed that this part of the cycle was idle. Therefore, no noticeable change on CO2 emissions was expected. There were also no major differences in thermal management behavior for the cold cycle between the various EH power levels. CDA on/off times, shown in Figure 5C, provides an insight on CDA operation over the HD-FTP cycle, which accounts for 51% of time in CDA.
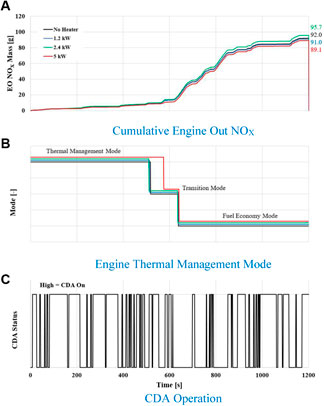
FIGURE 5. (A–C) Cold FTP engine operation.
The hot start FTP cycle was performed following the cold cycle and a 20-min soak period. Table 7 shows the quantitative hot start results, and Figure 6 graphically shows the NOX and CO2. As shown, the heater solutions provide a reduction in CO2, but with higher NOX. The best heater experiment result is shown to be the 2.4 kW result, which has a 1.9% decrease in BSCO2 but a slight increase in BSNOX. The 5 and 1.2 kW power ratings showed an increase in NOX, while the CO2 savings were consistent with the 2.4 kW power rating.
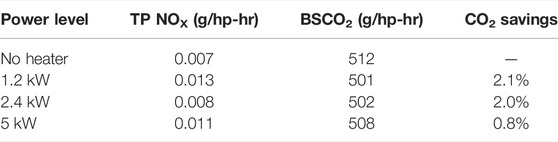
TABLE 7. Hot FTP results.
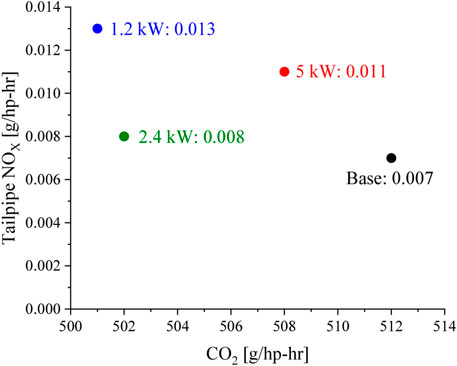
FIGURE 6. Hot FTP results.
Similar to the cold FTP, Figures 7A–F provide critical parameters monitored during the test sequence, such as temperature and NOX emission results. Figures 7A,B show that minor aftertreatment temperature differences were observed in the heater experiments, which led to similar TP NOX and CO2 results. Figure 7A shows the heater experiments to have ∼20°C higher LO-SCR temperatures for the first 200 s compared to the no heater case. However, 200–550 s show lower LO-SCR temperatures for the heater experiments. Depending on the cycle point, heater experiment LO-SCR temperatures were lower by as much as 20°C. Figure 7B, which considers the downstream system temperatures, also reports a decrease in temperature for the dual path SCR catalyst after 400 s. The temperature decrease leads to a 5–7% LO-SCR NOX conversion reduction (Figure 7C) compared to the no heater case. Figure 7D illustrates the cumulative TP NOX mass and corroborates that higher TP NOX emissions were generated in areas with lower catalyst temperature. Interestingly, the 2.4 kW experiment was able to maintain similar performance as the no heater case. In contrast, the 1.2 kW result generated almost two times more NOX emissions than the no heater experiment. The maximum limits on the power heater are shown in the instantaneous heater power graph shown in Figure 7E.
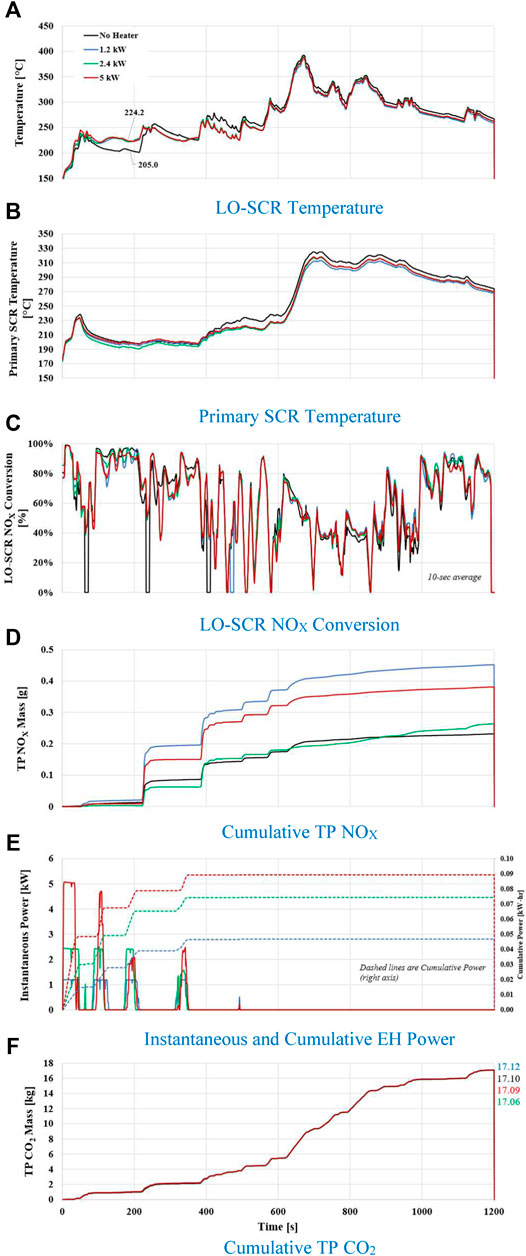
FIGURE 7. (A–F) Hot FTP.
Unlike the cold start, the hot start CO2 improved for the heater experiments. Reduction of CO2 was shown to be between 1.7 and 2.1% with a general increase in tailpipe NOX emissions. However, the 2.4 kW case did show very similar performance to the no heater case despite the differences in aftertreatment system temperature. The authors attributed this to the exhaust conditions generated as a result of the 2.4 kW setting. Because the performance demand is very high, small changes in aftertreatment inlet conditions can significantly impact the tailpipe result. For the 2.4 kW experiment, this included more favorable conditions to accumulate NH3 storage.
Figure 8A provides the hot start cumulative engine-out NOX, and Figure 8B considers the engine calibration states during the cycle. Engine-out NOX was observed to be lower for the no heater case and separation from the heater experiments started at ∼ 200 s. As discussed, it was following this point that heater TP NOX emissions were higher and the aftertreatment system temperatures were lower. A closer look at the engine calibration state indicates that for the heater experiments, the engine spent less time (90% less time) in the thermal management mode and more time in the fuel economy mode, which aided in the net 2% CO2 reduction. The fuel economy mode was characterized by higher engine-out NOX mass rates, lower engine exhaust temperatures, and lower CO2 emissions. Thus, augmentation of the heater reduced the thermal management mode duration, which caused higher tailpipe NOX emissions and improved CO2 emissions. CDA operation is shown in Figure 8C, which accounts for 48% of time in CDA. For both cold and hot FTP testing, the actual amount of time in CDA is less than projected because CDA exits immediately after an increased torque request.
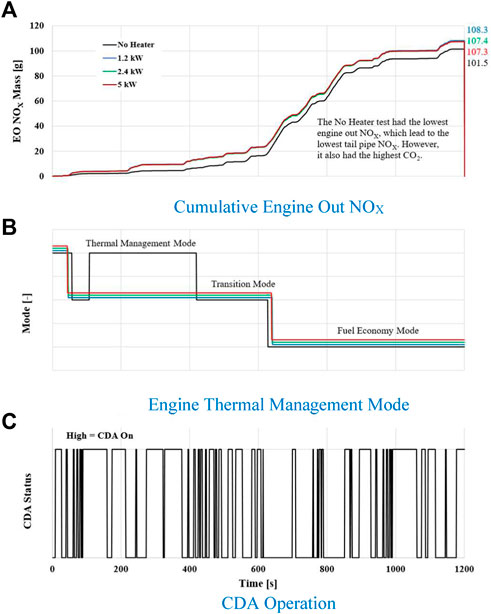
FIGURE 8. (A–C) Hot FTP engine operation.
The low load cycle, or LLC, is a newly adopted cycle by CARB as part of the 2024 + model year certification process. The final phase in limit will be 0.05 g/hp-hr.
Figure 9 provides the graphical data points generated during this campaign, and Table 8 provides the quantitative values. As shown in Figure 9, results for all cases were well below the 2027 regulatory limit. Heater configurations also generated less CO2 compared to the baseline result at 2.4 and 2.4 kW (free energy). The CO2 improvement for both cases amounted to ∼3%. For the 2.4 kW experiment, there was also an increase in NOX compared to the base, but the result remained 50% below the regulatory limit. The 5 kW experiment also shared similar results as the 2.4 kW result, which indicated no additional benefit from increasing the maximum heater power. Also, the 1.2 kW experiment generated the lowest NOX emissions from the heater tests, but it had the highest CO2 value. Despite this, the 1.2 kW heater test generated 2% lower CO2 compared to the baseline. The 2.4 kW EH level shows the most promise for CO2 reduction for normal engine-powered operation at 2.9 and 3.2% using free energy.
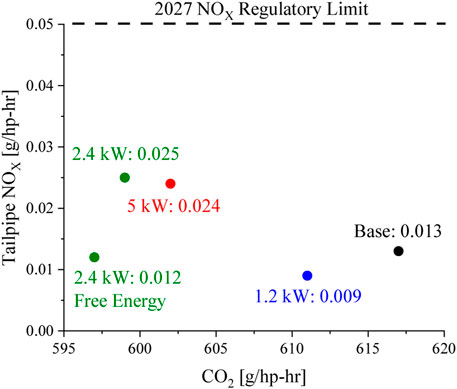
FIGURE 9. LLC results.
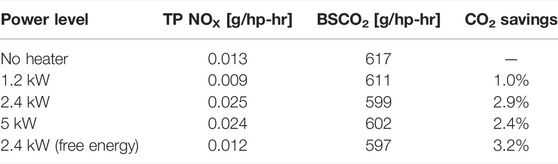
TABLE 8. LLC results.
Figures 10A–F provide critical continuous measurement data that includes aftertreatment temperatures, LO-SCR NOX conversion, cumulative tailpipe NOX emissions, and cumulative tailpipe CO2 emissions. In the first section of the LLC, or 0–1800 s, the LO-SCR temperature (Figure 10A) was shown to start low for the baseline experiment. The temperature then gradually increases to a stabilized temperature range before reaching an extended idle section. In the heater experiments, the start of the cycle was shown to have a 35°C LO-SCR temperature increase. The sustained temperature increase was also shown to impact the downstream section (Figure 10B) as a 10°C temperature increase was observed after 400 s. Figure 10D shows that all cases generated low emissions for the first 1800 s, as well as similar CO2 values (Figure 10F). Since the CO2 and NOX results indicated a negligible improvement, the heater integration showed no meaningful benefit in the first 1800 s.
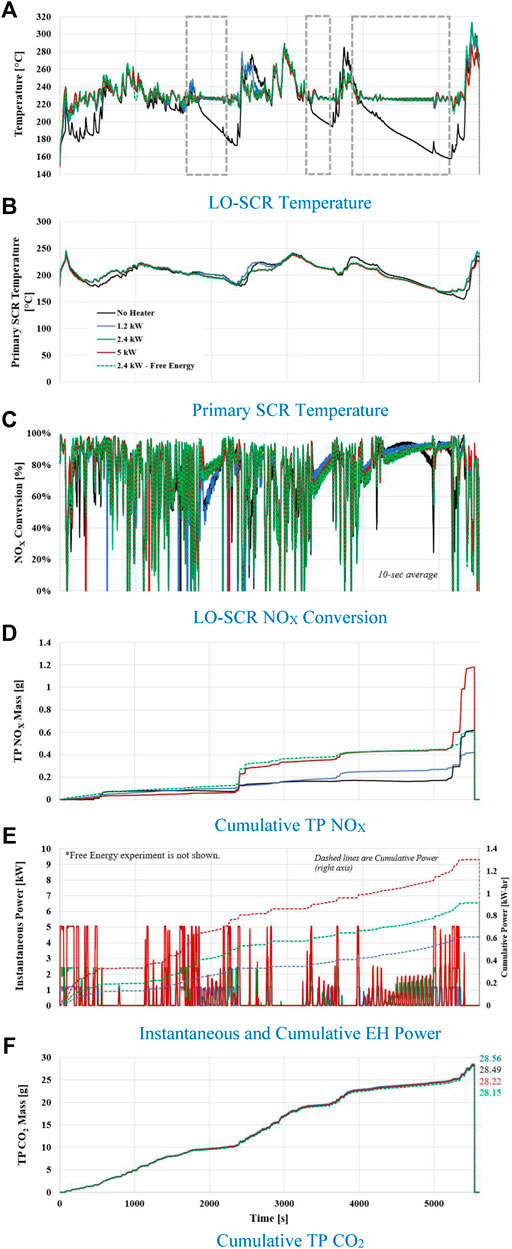
FIGURE 10. (A–F) LLC.
The next section between 1,800 s and 4,000 s begins with an extended idle period that slowly decreases LO-SCR and downstream temperatures in the baseline experiment (Figures 10A,B). For the heater cases, the temperature decrease was mitigated, and the LO-SCR temperature was maintained at 225°C. Though the downstream temperature decrease persists, a reduced temperature decrease rate was observed with the heater experiments. At ∼2,400 s, the engine transitions back into dynamic cycle operation. The baseline and the 1.2 kW cases were observed to have higher LO-SCR temperatures (Figure 10A) compared to the 2.4 and 5 kW experiments. In addition, the NOX emissions (Figure 10D) were shown to be higher for the 2.4 and 5 kW cases. It is worth noting that the 2.4 and 5 kW generated nearly identical cumulative NOX traces, which makes it difficult to see the 2.4 kW result. Though engine calibration state differences will be discussed in a later paragraph, it was found that both the baseline and 1.2 kW experiments were in the thermal management mode (Figure 11B), while the 2.4 kW/5 kW experiments were in the fuel economy mode. This also contributed to the higher emissions as the fuel economy mode increases engine-out NOX (Figure 11A) emissions and has lower engine-out exhaust temperatures. Later portions of this section included a sustained low load section and a shorter extended idle element. NOX emissions (Figure 10D) did increase for all heater cases following the idle section as the engine was in the fuel economy mode (Figure 11B).
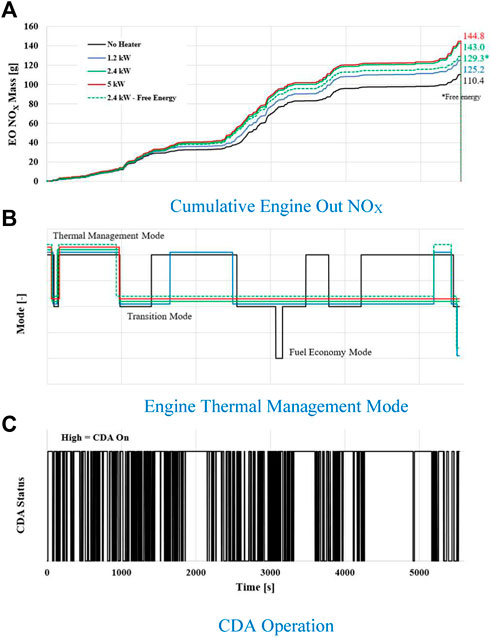
FIGURE 11. (A–C) LLC engine operation.
The last section, after 4,000 s to the cycle end, includes the longest idle element. Figure 10A illustrates an 80°C temperature decrease for the baseline LO-SCR temperature. In contrast, the heater experiments generated stable LO-SCR temperatures at 225°C. Figure 10B shows some temperature decrease on the downstream temperature for all cases, but less so on the heater experiments. At ∼5,100 s, the engine entered dynamic operation, which increased NOX emissions for all cases. The baseline for the LO-SCR and the downstream SCR started at a non-service state. That is, the SCR catalysts were at temperature conditions where activity was very low or non-existent. In the heater experiments, the LO-SCR temperatures enabled SCR activity. In addition, 15b shows that less time was required for the downstream system to move back to the in-service state following the extended idle. Despite the improved temperature characteristics, Figure 10D shows that the 2.4 kW/5 kW experiments had the highest emissions for this portion of the cycle, while the baseline also had some increase. The 1.2 kW experiment had the lowest increase, which contributed to the best overall tailpipe BSNOX result. This, again, was attributed to the engine’s thermal management mode (Figure 11B). Figure 11A also shows that the 2.4 kW/5 kW experiments yielded a higher engine-out NOX rate increase compared to the 1.2 kW/baseline experiments further corroborating the reason for better NOX emissions results.
Figures 11A,B show the cumulative engine-out NOX and engine state during the LLC. Table 9 provides the quantitative values for the LLC result, as well as the thermal management frequency. As shown, there was a positive correlation with the amount of time spent in thermal management mode and the CO2 emissions. Despite the higher NOX emissions for 2.4 and 5 kW experiments, the NOX remained well below the 2027 regulatory limit, while improving CO2 by up to 3%. In this case, the augmentation of the heater technology at 2.4 kW provides sufficient NOX control with a significant CO2 benefit. While the 5 kW was also similar in performance, there was no need to go this high as the CO2 benefit was reduced and there was no improvement in NOX emissions. As a final note, the investigators noted that the heater control strategy could be further optimized. Specifically, the target temperature during the extended idle could be lowered to reduce the heater “ON” time and further reducing CO2 emissions. However, this will only reduce the CO2 emissions by a marginal amount (0.1–0.5%) as most of the benefit will be realized by staying in the fuel economy mode. For the 2.4 kW experiment, the engine was in the fuel economy mode for all of the extended idle sections. The CDA operation is shown in Figure 11C, which accounts for 68% of time in CDA.
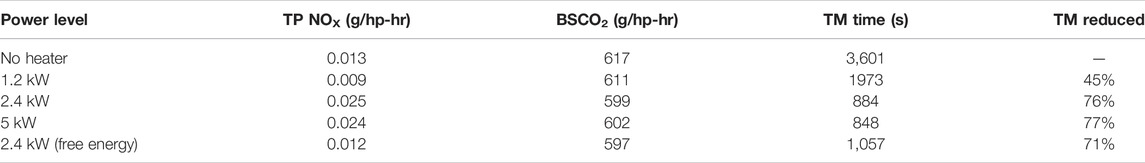
TABLE 9. LLC time in engine thermal management.
The beverage cycle, which is an element of the LLC, was another low load cycle that was tested. This cycle does not have an associated compliance limit as it is not and will not be part of the certification process. For the purposes of this work, the LLC limit of 0.05 g/hp-hr can be applied to the cycle. The cycle is 800 s long and four are joined together. The first two cycles are preps, and results presented reflect the last two cycles. Figure 12 provides the graphical data points, and Table 10 provides the quantitative results for the beverage cycle experiments. Overall, the tailpipe NOX remains well below the 0.05 g/hp-hr LLC standard for all experiments. The CO2 results, however, indicate a reduction for the heater experiments compared to the baseline results. The 2.4 and 5 kW experiments show the best results with a CO2 reduction of 6% or greater. The 2.4 kW free energy experiment also highlights an improvement in CO2 over the normal 2.4 kW case.

FIGURE 12. Beverage cycle results.
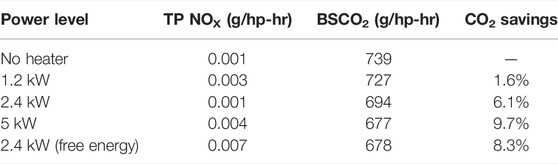
TABLE 10. Beverage cycle results.
Figures 13A–F show critical data comparisons that consider overall system performance. This includes LO-SCR temperature, primary SCR temperature, LO-SCR NOX conversion, cumulative TP NOX, EH power measurements, and cumulative TP CO2. The base experiments indicated the lowest temperatures of the cycle with several cycle segments approaching 200°C. There are also examples where the base experiment was observed to operate at temperatures higher than several heater experiments. During these points, the 1.2 kW case shows the same temperature behavior. For the 2.4 kW, 2.4 kW free energy, and 5 kW experiments, the temperatures largely remained between 220°C and 240°C. The only exception was at the end of the cycle where the 5 kW experiment maintained a temperature just above 220°C. Conversely, the other experiments maintained a temperature near 240°C. The differences observed in temperature were largely attributed to the differences in engine mode status, which will be discussed in a later paragraph.
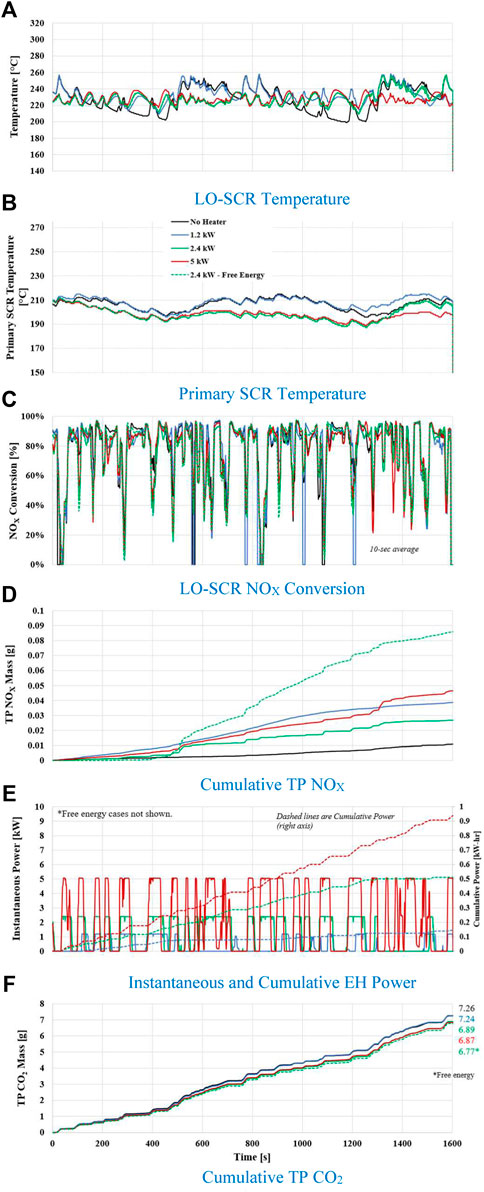
FIGURE 13. (A–F) Beverage.
Figure 13D, which considered the TP NOX mass, shows a different conclusion from the provided results in earlier graphs and table. However, it is worth noting the units are different and that total cycle work completed was not considered in this graph. Because the cycle was classified as low load, any small differences in engine load will yield different total cycle work values. Consequently, this is not reflected in the cumulative NOX mass emissions.
Figures 14A,B show the cumulative engine-out NOX mass results, as well as the thermal management modes for the different experiments. Table 11 provides the associated thermal management duration for the different experiments. The engine-out NOX mass was revealed to be lower for the no heater and 1.2 kW experiments. This was attributed to the engine operating in the thermal management mode for a longer duration compared to the heater experiments with higher power targets. As discussed, the base and 1.2 kW experiments also had higher LO-SCR average temperatures, which were also caused by the thermal management mode. Conversely, the remaining heater experiments spent less time in the thermal management mode and provided a CO2 reduction. Depending on the experiment, the time spent in the thermal management mode by 75% or greater. The CDA operation is shown in Figure 14C, which accounts for 66% of time in CDA.
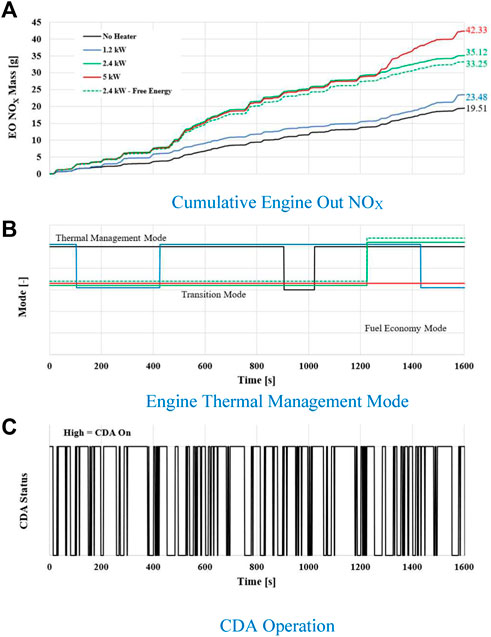
FIGURE 14. (A–C) Beverage engine operation.
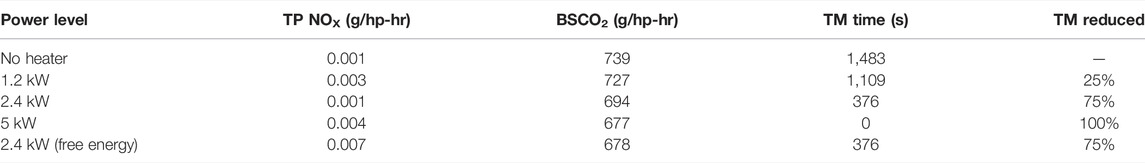
TABLE 11. Beverage time in engine thermal management.
Like the LLC cycle, the beverage cycle was observed to have the same benefits with respect to CO2, while maintaining NOX emissions well below the CARB’s 2027 LLC standard. For this cycle, the best option with respect to CO2 and NOX was the 5 kW experiment. Although the beverage cycle is not part of the certification cycles, it did provide insights for low-temperature operation and the benefits from utilizing the heater instead of relying on thermal management.
The addition of an EH upstream of a LO-SCR followed by a downstream primary aftertreatment system using a CDA in-line 6 cylinder diesel engine proved beneficial for NOX and CO2 over the FTP, LLC, and beverage cycles. All aftertreatment catalysts were hydrothermally aged to the end of the useful life. NOX was reduced by shifting the LO-SCR into a more optimal and efficient temperature region. CO2 was decreased by reducing the amount of time in the engine thermal management mode. The best EH power setting from previous works was 5 kW, while this current work showed that the optimal maximum power setting could be reduced to 2.4 kW.
The composite FTP yielded nearly the same NOX as the baseline without the EH while saving CO2 on the order of 1.6%. The baseline result using CDA, LO-SCR, and primary aftertreatment yielded a tailpipe NOX of 0.014 g/hp-hr, which is 30% lower than the CARB 2027 regulation of 0.020 g/hp-hr. The addition of an EH with a maximum power setting of 2.4 kW showed slightly larger NOX margin of 40% down to 0.012 g/hp-hr while also saving 1.6% CO2. Improvements on both the cold and hot FTP cycles contributed to these savings. The EH on the cold cycle increased the LO-SCR temperature by 35°C over the baseline, which achieved near optimal conditions by 200 s into the cycle; thus, dropping the cold NOX by 27%. The EH on the hot cycle decreased CO2 by 1.9% using 2.4 kW maximum power by shifting the engine operation by 90% less time in the thermal management mode while maintaining the same tailpipe NOX.
The NOX and CO2 were also improved over the LLC using a 2.4 kW EH setting. The baseline CDA results yielded excellent tailpipe NOX of 0.013 g/hp-hr, which is 75% below the CARB 2027 NOX standard. The addition of 2.4 kW e-heating saved 2.9% CO2 while maintaining a 50% margin on tailpipe NOX (0.025 g/hp-hr). This savings is attributed to spending 75% less time in the engine thermal management mode by using the EH. Additional CO2 savings can be achieved for vehicle situations where the battery system is fully charged and used to provide energy to the EH. These cases are referred to as “free energy” in this study and show more than 75% margin on NOX (0.012 g/hp-hr) at 3.2% CO2 savings. The CO2 savings in this case is attributed to 71% less time in the engine thermal management mode, as no energy was required to be generated by the engine, representative of the battery system being maintained at the required charge levels, likely through the use of braking regeneration.
Similarly, the NOX and CO2 were also improved over the beverage cycles using a 2.4 kW EH setting. The baseline CDA results yielded near zero tailpipe NOX of 0.001 g/hp-hr for this real world driving cycle. The addition of 2.4 kW saved 6.1% CO2 while maintaining the tailpipe NOX at near zero (0.001 g/hp-hr). This savings is attributed spending 75% less time in the engine thermal management mode, as the LO-SCR is at its optimal temperature. Additional CO2 savings were realized up to 8.3% using “free energy” when the battery system is charged.
The work showed that adding a 2.4 kW EH upstream of a LO-SCR in combination with CDA and the primary aftertreatment system yielded NOX and CO2 savings over the FTP, LLC, and beverage cycles. The FTP results added an incremental 10% addition NOX margin up to 40% by adding the EH while also saving 1.9% CO2. The LLC showed that a 50% NOX margin could be maintained with 2.9% (engine powered EH) to 3.2% (free energy) CO2 savings by adding 2.4 kW e-heat. Finally, the beverage cycle showed that near zero tailpipe NOX is achievable with 6.1% (engine powered EH) to 8.3% (free energy) reductions in CO2.
The main takeaway of this work is that a modest EH on the order of 2.4 kW is appropriate for a heavy-duty application in combination with CDA and a LO-SCR. Since this power level is low, a modestly sized EH could be packaged in a 4- or 5-inch-diameter exhaust pipe upstream of a LO-SCR with minimal backpressure. Using a larger size unit is also acceptable.
The original contributions presented in the study are included in the article; further inquiries can be directed to the corresponding authors.
BZ conducted the experiment, did the data analysis, and a large portion of the writing. JM provided background writing contribution and overall paper editing for content and flow. AM provided writing contribution and all graphical and tabular data. CS also provided technical expertise and writing. All authors participated in the experimental test setup and confirmation of test results.
The authors declare that this study received funding from Eaton. The funder was not involved in the study design, collection, analysis, interpretation of data, the writing of this article or the decision to submit it for publication.
BZ, AM, and CS were employed by SwRI. JM was employed by Eaton company.
All claims expressed in this article are solely those of the authors and do not necessarily represent those of their affiliated organizations, or those of the publisher, the editors, and the reviewers. Any product that may be evaluated in this article, or claim that may be made by its manufacturer, is not guaranteed or endorsed by the publisher.
The authors would like to acknowledge the support of multiple supporting organizations for this work including CHEDE-VII, CARB, EPA, MECA, SCAQMD, SwRI, Cummins, and Eaton. Specifically, the authors would like to acknowledge Watlow for providing the EH along with the EH control system.
BMEP, brake mean effective pressure; BP, bypass; BSFC, brake-specific fuel consumption; CARB, California Air Resources Board; CDA, cylinder deactivation; DEF, diesel exhaust fluid; DOC, diesel oxidation catalyst; DPF, diesel particulate filter; EH, electric heater; EO, engine-out; FTP, federal test procedure; HD, heavy-duty; LLC, low load cycle; LO-SCR, light-off SCR; NVH, noise, vibration, and harshness; RPM, revolutions per minute; PID, proportional, integral, and differential; SCR, selective catalytic reduction; TM, thermal mode; and TP, tailpipe.
Allen, C. M., Gosala, D. B., Joshi, M. C., Shaver, G. M., Farrell, L., McCarthy, J., et al. (2019). Experimental Assessment of Diesel Engine Cylinder Deactivation Performance during Low Load Transient Operations. Int. J. Engine Res. 22, 606–615. doi:10.1177/1468087419857597
Allen, C. M., Gosala, D. B., Shaver, G. M., and McCarthy, J. (2018). Comparative Study of Diesel Engine Cylinder Deactivation Transition Strategies. Int. J. Engine Res. 13, 570–580. doi:10.1177/1468087418768117
Archer, A., and McCarthy, J. (2018). Quantification of Diesel Engine Vibration Using Cylinder Deactivation for Exhaust Temperature Management and Recipe Implementation in Commercial Vehicles. SAE. doi:10.4271/2018-01-1284
California Air Resources Board, (2021). California Adopts Strong New Regulation to Further Reduce Smog-Forming Pollution from Heavy-Duty Diesel Trucks. Available at: https://ww2.arb.ca.gov/news/california-adopts-strong-new-regulation-further-reduce-smog-forming-pollution-heavy-duty (Accessed on Aug 28, 2020).
California Air Resources Board, (2019). Staff Current Assessment of the Technical Feasibility of Lower NOX Standards and Associated Test Procedures for 2022 and Subsequent Model Year Medium-Duty and Heavy-Duty Diesel Engines. Available at: https://ww3.arb.ca.gov/msprog/hdlownox/white_paper_04182019a.pdf.
Chundru, V., Johnson, J., and Parker, G. (2020). “A Modeling Study of an Advanced Ultra-low NOX Aftertreatment System, ” SAE Int. J. Fuels Lubr. 13(1):2020. doi:10.4271/04-13-01-0003
Ding, C., Roberts, L., Fain, D., Ramesh, A. K., Shaver, G., McCarthy, J., et al. (2015). Fuel Efficient Exhaust Thermal Management for Compression Ignition Engines during Idle via Cylinder Deactivation and Flexible Valve Actuation. Int. J. Engine Res. 12, 619–630. doi:10.1177/1468087415597413
Epa, (2020). Advance Notice of Proposed Rule: Control of Air Pollution from New Motor Vehicles: Heavy-Duty Engine Standards, Jan. Available at: https://www.epa.gov/regulations-emissions-vehicles-and-engines/advance-notice-proposed-rule-control-air-pollution-new.
Gosala, D. B., Allen, C. M., Ramesh, A., K., Shaver, G. M., McCarthy, J., Stretch, D., et al. (2017). Cylinder Deactivation during Dynamic Diesel Engine Operating Conditions. Int. J. Engine Res. Mar. 18 (10). doi:10.1177/1468087417694000
Gosala, D. B., Allen, C. M., Shaver, G. M., Farrell, L., Koeberlein, E., Franke, B., et al. (2018). Dynamic Cylinder Activation in Diesel Engines. Int. J. Engine Res. 19, 849–861. doi:10.1177/1468087418779937
Halbe, M., Pietrzak, B., Fain, D., Shaver, G., McCarthy, J., Ruth, M., et al. (2017). Oil Accumulation and First Fire Readiness Analysis of Cylinder Deactivation in Diesel Engines. Front. Mech. Eng. Mar. 6.
Harris, T., McCarthy, J., Sharp, C., Zavala, B., and Matheaus, A. (2021). “Meeting Future NOx Emissions Limits with Improved Total Fuel Efficiency,” in Presented at Heavy-Duty, On- and Off-Highway Engines 2021 Rostock, Germany: ATZ.
Joshi, M. C., Gosala, D. B., Allen, C. M., Vos, K., Van Voorhis, M., Taylor, A., et al. (2017). Reducing Diesel Engine Drive Cycle Fuel Consumption through Use of Cylinder Deactivation to Maintain Aftertreatment Component Temperature during Idle and Low Load Operating Conditions. Front. Mech. Eng. 8, 8. doi:10.3389/fmech.2017.00008
Joshi, M., Gosala, D., Allen, C., Srinivasan, S., et al. (2018). Diesel Engine Cylinder Deactivation for Improved System Performance over Transient Real-World Drive Cycles. SAE Technical Paper 2018-01-0880.
Lu, X., Ding, C., Ramesh, A. K., Shaver, G. M., Holloway, E., McCarthy, J., et al. (2015). Impact of Cylinder Deactivation on Diesel Engine Aftertreatment Thermal Management and Efficiency at Highway Cruise Conditions.” in Frontiers in Mechanical Engineering: Engine and Automotive Engineering, 24.
Matheaus, A., Neely, G. A., Sharp, C. A., Hopkins, J., and McCarthy, J. (2021). Fast Diesel Aftertreatment Heat-Up Using CDA and an Electrical Heater. SAE Technical Paper 2021-01-0211.
Matheaus, A., Singh, J., Janak, R., Sanchez, L., and Evans, D. (2020). Evaluation of Cylinder Deactivation on a Class 8 Truck over Light Load Cycles. SAE Technical Paper 2020-01-0800.
McCarthy, J. E. (2019). Simultaneous CO2 and NOX Reduction for Medium & Heavy-Duty Diesel Engines Using Cylinder Deactivation. Brazil: Sao Paulo. https://www.integer-research.com/conferences/ies-brazil-2019/.
McCarthy, J. (2017). “Cylinder Deactivation Improves Diesel Aftertreatment and Fuel Economy for Commercial Vehicles,” in 17th Stuttgart International Symposium, Stuttgart, Germany
McCarthy, J. (2017). “Enabled Improved Vehicle Fuel Economy and Emissions,” in 2017 Symposium – Engine Research Center. Wisconsin, USA: University of Wisconsin-Madison in Madison.
McCarthy, J., Matheaus, A., Zavala, B., Sharp, C., and Harris, T. (2022). Meeting Future NOx Emissions over Various Cycles Using a Fuel Burner and Conventional Aftertreatment System. SAE 22PFL-0514.
McCarthy, J., Theissl, H., and Walter, L. (2017). “Mproving Commercial Vehicle Emissions and Fuel Economy with Engine Thermal Management Using Variable Valve Actuation,” in ATZ Live International Engine Congress (Baden-Baden, Germany, 21-22.I
Neely, G. D., Sharp, C., and Rao, S. (2020). CARB Low NOX Stage 3 Program – Modified Engine Calibration and Hardware Evaluations. SAE Technical Paper 2020-01-0318.
Neely, G., Sharp, C., Pieczko, M., and McCarthy, J. Simultaneous NOX and CO2 Reduction for Meeting Future CARB Standards Using a Heavy-Duty Diesel CDA-NVH Strategy. SAE Int. J. Engines 13 (2), 2020. doi:10.4271/03-13-02-0014
Pieczko, M., Hamler, J., and McCarthy, J. (2021). Mitigating Vibration for a Heavy Duty Diesel Cylinder Deactivation Truck. SAE Technical Paper 2021-01-0661.
Ramesh, A. K., Gosala, D. B., Allen, C. M., Joshi, M. C., Shaver, G. M., McCarthy, J., et al. (2018). Cylinder Deactivation for Increased Engine Efficiency and Aftertreatment Thermal Management in Diesel Engines. SAE Technical Paper 2018-01-0384.
Rao, S., Sarlashkar, J., Rengarajan, S., Sharp, C., et al. (2020). “A Controls Overview on Achieving Ultra-low NOX," SAE Technical Paper 2020-01-1404, doi:10.4271/2020-01-1404
Reinhart, T., Matheaus, A., Sharp, C., Peters, B., Pieczko, M., McCarthy, J., et al. (2020). Vibration and Emissions Quantification over Key Drive Cycles Using Cylinder Deactivation. Int. J. Powertrains, IJPT 2847779 (No. 4), 315. doi:10.1504/ijpt.2020.10033152
Roberts, L., Magee, M., Fain, D., Shaver, G., Holloway, E., McCarthy, J., et al. (2020). “Impact of Cylinder Deactivation at Idle on Thermal Management and Efficiency,” in SAE Comm. Veh. Cong., 10/14 (Rosemount, IL: SAE CV-0336).
Sharp, C. (2020). Update on the Path to 2027 Emissions Stage 3 Low NOX Program Results. Novi, Michigan, USA: Global Automotive Management Council. www.gamcinc.com.
Sharp, C., Webb, C., Neely, G., Carter, M., Yoon, S., and Henry, C. (2017). Achieving Ultra Low NOX Emissions Levels with a 2017 Heavy-Duty On-Highway TC Diesel Engine and an Advanced Technology Emissions System - Thermal Management Strategies. SAE Int. J. Engines 10 (4), 1697–1712. doi:10.4271/2017-01-0954
Sharp, C., Webb, C., Neely, G., Sarlashkar, J., et al. (2017). “Achieving Ultra Low NOX Emissions Levels with a 2017 Heavy-Duty On-Highway TC Diesel Engine and an Advanced Technology Emissions System - NOX Management Strategies,” in SAE Int. J. Engines (U.S. Department of Transportation, “Summary of Fuel Economy Performance,” NHTSA), 10, 1736–1748. NVS-220, Apr. 28.
Sharp, C., Webb, C., Yoon, S., Carter, M., and Henry, C. (2017). Achieving Ultra Low NOX Emissions Levels with a 2017 Heavy-Duty On-Highway TC Diesel Engine - Comparison of Advanced Technology Approaches. SAE Int. J. Engines 10 (4), 1722–1735. doi:10.4271/2017-01-0956
Wang, L. (2019). Low Load Cycle Development, ” CARB Heavy Duty Low NOX Workshop. Available at: https://ww2.arb.ca.gov/our-work/programs/heavy-duty-low-nox/heavy-duty-low-nox-meetings-workshops.23.
Keywords: electric heat, LO-SCR, diesel aftertreatment, NOx control, CDA
Citation: Zavala B, McCarthy JE, Matheaus A and Sharp C (2022) Fast Diesel Aftertreatment Heat-Up Using CDA and an Electrical Heater Between 1.2 and 5.0 kW. Front. Mech. Eng 8:918003. doi: 10.3389/fmech.2022.918003
Received: 11 April 2022; Accepted: 17 May 2022;
Published: 25 July 2022.
Edited by:
Tiegang Fang, North Carolina State University, United StatesReviewed by:
Arvind Thiruvengadam, West Virginia University, United StatesCopyright © 2022 Zavala, McCarthy, Matheaus and Sharp. This is an open-access article distributed under the terms of the Creative Commons Attribution License (CC BY). The use, distribution or reproduction in other forums is permitted, provided the original author(s) and the copyright owner(s) are credited and that the original publication in this journal is cited, in accordance with accepted academic practice. No use, distribution or reproduction is permitted which does not comply with these terms.
*Correspondence: James E. McCarthy, Jr., SmltTWNDYXJ0aHlAZWF0b24uY29t; Andrew Matheaus, YW5kcmV3Lm1hdGhlYXVzQHN3cmkub3Jn
Disclaimer: All claims expressed in this article are solely those of the authors and do not necessarily represent those of their affiliated organizations, or those of the publisher, the editors and the reviewers. Any product that may be evaluated in this article or claim that may be made by its manufacturer is not guaranteed or endorsed by the publisher.
Research integrity at Frontiers
Learn more about the work of our research integrity team to safeguard the quality of each article we publish.