 Muhammad Salman Bin Ahmad1
 Apostolos Pesyridis1,2
 Panos Sphicas3*
 Amin Mahmoudzadeh Andwari4
 Ayat Gharehghani5
 Bianca Maria Vaglieco6
- 1Center for Advanced Powertrain and Fuels Research (CAPF), Department of Mechanical and Aerospace Engineering, Brunel University London, London, United Kingdom
- 2College of Engineering, Alasala University, Dammam, Saudi Arabia
- 3Department of Mechanical Engineering, University of Bolton, Bolton, United Kingdom
- 4Machine and Vehicle Design (MVD), Materials and Mechanical Engineering, University of Oulu, Oulu, Finland
- 5School of Mechanical Engineering, Iran University of Science and Technology, Tehran, Italy
- 6Istituto Motori-CNR, Napoli, Italy
The transportation sector is generally thought to be contributing up to 25% of all greenhouse gases (GHG) emissions globally. Hence, reducing the usage of fossil fuels by the introduction of electrified powertrain technologies such as hybrid electric vehicle (HEV), battery electric vehicle (BEV) and Fuel Cell Electric Vehicle (FCEV) is perceived as a way towards a more sustainable future. With a seemingly more significant shift towards BEV development and roll-out, the research and development of BEV technologies has taken on increasing importance in improving BEV performance and ensuring its competitiveness. Numerical simulation, using MATLAB, is performed as a tool to investigate and to improve the overall performance of BEVs. This study provides an overview of the possible technology outcome and market consequences for future compact BEVs along with HEVs, FCEVs and internal combustion engine vehicles (ICEV). The techno-economics of BEVs, market projection and cost analysis up to 2050 are investigated, as are important BEV characteristics alongside those of other types of vehicles. Well-to-wheel analysis of BEVs is also studied and compared with HEV, FCEV and ICE.
Introduction
The transportation sector is identified to emit about 25% of the greenhouse gas (GHG) emissions (Mahmoudzadeh Andwari et al., 2017). The powertrain of land vehicles is constantly changing. Improvements in conventional internal combustion engines (ICE), such as improvements in the fuel injection combustion (Sphicas, 2013; Frank et al., 2015; Sphicas et al., 2017a; Sphicas et al., 2017b; Sphicas et al., 2018), combustion of biofuels (Jassim et al., 2019) and turbocharging and downsizing (Feneley et al., 2017), have increased the performance and reduced the produced emissions. Electric vehicles (EVs) are gaining popularity as a commercially viable and technology-ready way to reduce GHG emissions. EVs are easy to operate, quiet, and do not impose fuel costs associated with conventional vehicles. EVs seem to be well suited in an urban environment for the following reasons: 1) EVs do not store liquid, flammable fuels and do not produce emissions; 2) EVs produce the maximum torque from the start-up; 3) EVs are capable of frequent start-stop driving; and 4) EVs do not require gas station. Renewable energy sources and the smart grid are gaining momentum in power generation and distribution. EVs are considered a huge contributor to this direction (Norgard et al., 2014; Forero Camacho and Mihet-Popa, 2016).
The idea of driving vehicles with electric motors (EM) is not recent. EVs held 29% of the total vehicles and were preferred over ICE until the early 1900 (Andwari et al., 2018; Mahmoudzadeh Andwari et al., 2019). However, due to very low oil prices, ICE gained momentum and monopoly of the market. In 1996, General Motors introduced EV1 and it has instantly claimed the spotlight in automotive industry. Other car-manufacturers, such as Honda, Toyota, and Ford released their version of EVs as well. Toyota’s highly successful Prius, the first commercial hybrid electric vehicle (HEV), was launched in Japan in 1997. Prius saw almost 20,000 units sold in its first year of production. The fourth generation of Prius is currently available in the market. Today, the market is dominated by Chevrolet Volt, Nissan Leaf, and Tesla Model S.
A combination and interaction of different subsystems are the factors working an EV. There are many technologies that can be used to operate them. The key parts of these subsystems and their contribution to the total system is demonstrated in Figure 1. Some parts require minimal interaction with other parts. While some other parts need to interact extensively. There are multiple ways to configuring an EV. Evs can be solely driven with the stored electrical power. Some EVs can produce this energy from an ICE. Some Evs are driven by both ICE and electrical motors.
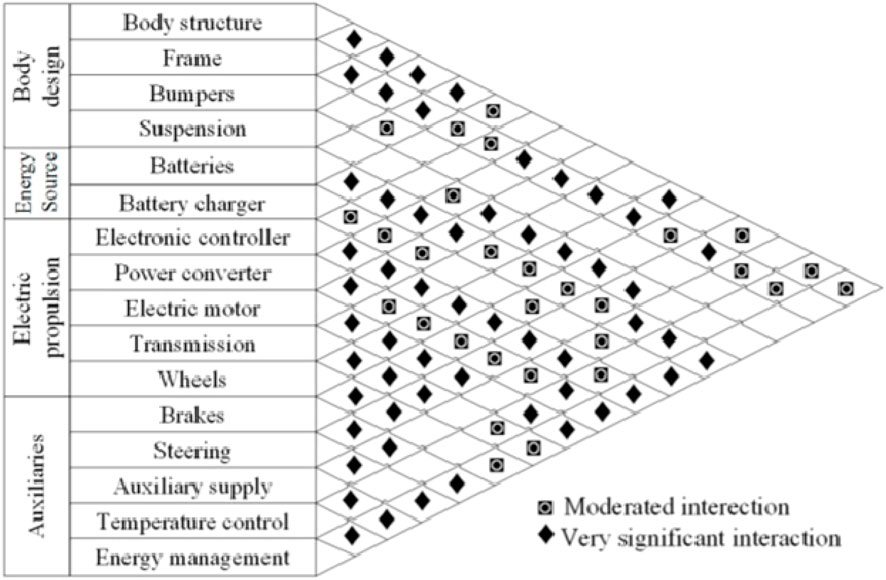
FIGURE 1. Major EV Sub-systems and their Interactions. Data from (Andwari et al., 2015).
Limitations and Existing Solutions
Even though electric vehicles offer promising results for the future, they are still not widely adopted. Some of the reasons are quite serious as well.
It takes some time for the society to accept new and immature technology, along with its consequences. Driving an EV means: 1) Change of re-fueling habits; 2) Preparedness to find an alternative mode of transportation in case battery is low; and 3) Change of driving patterns (Chan, 2014; Ghanaati et al., 2015).
The number of charging stations has increased a lot. However, more charging stations are needed. The long charging time is a huge disadvantage for EV penetration. Moreover, not all public charging stations are compatible with every car. Therefore, it can be difficult to find a proper charging station when required. There is also the risk that the charging station is occupied. Manufacturers are working to solve these issues. For example, Nissan and Tesla are expanding their own charging network.
EV proliferation is opposed by many technical challenges. Batteries are the main concern as they contribute significantly to the weight of the car. Charging period and range also depend on the battery. These factors, together with a few others are listed below.
The range of EVs is dictated by the capacity of batteries. Additionally, the range depends on: 1) the driving behavior; 2) the speed of the vehicle; 3) the terrain; 4) the carried cargo on the vehicle; and 5) the energy consumed by services running in the car (for example: air condition, heating, electronics). These factors develop a “range anxiety” towards the consumers (Shareef et al., 2016). The “range anxiety” is amplified by the limited number of appropriate charging stations. Surveys have shown that most drivers are willing to spend up to £ 50 to acquire one more extra mile of range (Hidrue et al., 2014). The EVs used in urban environments are not affect by the limited range of EVs, as the available range is usually sufficient for the daily commute.
Another major drawback of EVs is the long charging time. Charging can take from a few minutes to hours, depending on the type of the charger and the battery pack. For comparison, ICE vehicles require a few minutes for re-fueling. It is found that people are willing to spend £ 300–£ 2,300 to reduce the charging time by an hour (Hidrue et al., 2014). Increased voltage level and better chargers, reduce the charging time.
The price of EVs is quite high compared to ICE vehicles. This is due to the high cost of batteries (Shareef et al., 2016). To compensate for this issue, governments provide financial incentives. A decrease in the prices of batteries will be the result of mass technological advancement and production. Affordable EVs with a long range such as Chevrolet Bolt have already emerged in the market. Tesla Model 3 is next on the list.
Commercial Importance
HEVs and EVs develop new mobility concepts and reduce the dependence on fossil fuel. The electrification of the drivetrain could provide a sustainable technology path. This is beneficial for the consumers, as the price of renewable electricity is less volatile and generally cheaper than fossil fuel. In this study, combination of different technologies, involving batteries and motors were tested. The system of Lithium-Sulphur with permanent magnet motor was identified as the most prominent technology for the future. This is due to their high efficiency when compared to other alternatives available in market today. In addition, the production cost could be reduced, and the weight of the vehicle become lighter.
Paper Layout
Firstly, BEVs are compared to other technologies. The objective of this work is to perform a critical analysis on the performance and limitations of the medium-sized battery electric vehicles available in the market today. To model a medium-sized battery electric vehicle MATLAB/Simulink is used to obtain the best combination of power electronics and technology. Also, techno-economics analysis of BEVs is performed and future market path of battery electric vehicles is discussed.
Classification of EVs
EVs can run solely on electric propulsion or work with an ICE. The basic powertrain of EVs uses only batteries as energy source. More advanced powertrain employs different modes of energy source. Such vehicles are known as Hybrid EVs (HEVs). As proposed by the International Electrotechnical Commission, vehicles that employ two or more types of energy storage, source or converters can be grouped as HEV, if electrical energy is produced (Andwari et al., 2015). Therefore, a lot of combinations are possible for HEVs, such as: 1) Battery and ICE; 2) Capacitor and battery; 3) Flywheel and battery; and 4) Fuel cell and battery.
These combinations created confusion to both the general population and specialists. Who began describing vehicles with battery and fuel cell as FCEVs, and vehicles with ICE and electric motor as HEVs, and the vehicles with battery and capacitor as ultra-capacitor-assisted EVs (Chan, 2014; Norgard et al., 2014; Andwari et al., 2015; Ghanaati et al., 2015; Forero Camacho and Mihet-Popa, 2016; Andwari et al., 2018; Mahmoudzadeh Andwari et al., 2019). These terminologies can be categorized as follows: 1) Hybrid Electric Vehicle (HEV), 2) Plug-in Hybrid Electric Vehicle (PHEV), 3) Battery Electric Vehicle (BEV), 4) Fuel Cell Electric Vehicle (FCEV or FCV). Table 1 summarizes the different types of EVs, their features and drawbacks.
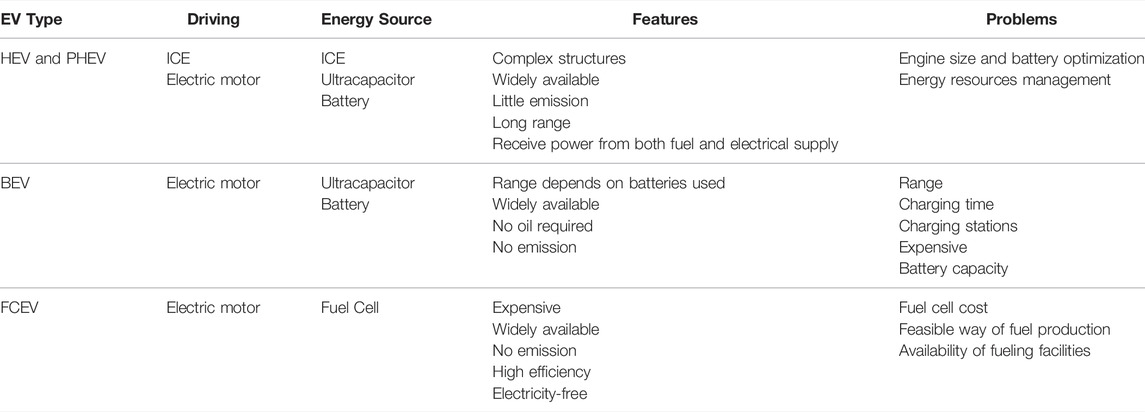
TABLE 1. Comparison of different electric vehicle types (Chan, 2014).
Hybrid Electric Vehicle
HEVs use both a motor and an ICE to power the vehicle. The electric propulsion is only used when the power demand is low. This arrangement provides a huge benefit in low-speed conditions, such as urban areas. Additionally, the ICE stays off during idling period to reduce fuel consumption.
HEVs use the ICE when higher speed is required. Both electric and ICE drivetrains co-exist to increase the vehicle performance. Hybrid power systems are commonly used to remove turbo lag in turbocharged cars (such as Acura NSX). The electric powertrain can increase performance by providing speed boosts when needed, and by filling the gaps between gear shifts. Regenerative braking allows HEV to recover energy. HEVs have improved mileage and performance over purely ICE-driven cars that employ electrical drive train without energy storage.
Figure 2 presents the basic building blocks of power flow in an HEV during various stages of a drive cycle. When a vehicle is starting from complete still, the ICE may run the motor as a generator to generate power then store it in the battery. Overtaking requires a boost in speed, hence both electric motor and ICE are driving the power train. While braking, battery is charged through regenerative braking and the ICE could run the motor as generator. During cruising, the ICE drives the vehicle and charges the battery. When the vehicle stops, the power flow will also stop. The energy management systems used in HEVs provides power distribution between electric motor and ICE. Maximum fuel efficiency can be obtained by considering the driver’s input, vehicle speed, state of charge (SOC) of battery, and the motor speed (Bayindir et al., 2015).
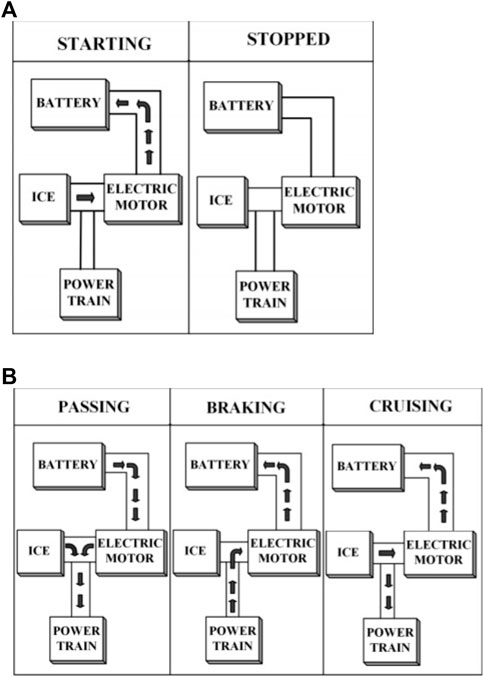
FIGURE 2. (A) Direction of power flow during starting and stopped; (B) Direction of power flow during passing, braking, and cruising. Adapted from (Bayindir et al., 2015) for HEVs.
Plug-In Hybrid Electric Vehicle
The concept was introduced to increase the range of all-electric HEVs. PHEVs use both electrical motor and ICE (similar to HEV). The only difference between HEV and PHEV is that in PHEV, electric propulsion serves as the main driving force. This leads to a bigger battery capacity requirement in PHEVs (Wirasingha et al., 2015; Kramer et al., 2016; Willianson, 2016; Bin Wan Ramli et al., 2020; Dzulkfli et al., 2020; Soldado et al., 2021). PHEVs operate in “all electric” mode, and when the batteries are low, the ICE is used to charge or step-up the battery pack. The purpose of the ICE in PHEV is to extend the range. PHEVs can be charged directly from the grid and therefore can produce a smaller carbon footprint. PHEVs consume less fuel and can utilize regenerative breaking.
Battery Electric Vehicle
BEVs use only batteries to drive. The range of BEVs depends heavily on their battery capacity as they rely solely on the stored energy in their battery packs. A typical single charge has a range of 100–250 km (Grunditz and Thiringer, 2016). These ranges depend on the vehicle configuration, road conditions, driving condition and style, battery type, and climate. The battery pack requires a lot of time (several hours) to be fully charged (Yilmaz and Krein, 2014; SAE International, 2015). Factors such as charger configuration, operating power level, and infrastructure affect the charging period. The wheels are driven by the electric motor or motors which operate on Alternating Current (AC). The Direct Current (DC) power in the battery needs to be converted to AC by the inverter.
BEVs are very simple in operation, manufacturing, and maintenance. They produce neither noise nor greenhouse gas (GHG). High torque can be generated from the electric motor instantaneously even at low speeds. These advantages, combined with their limitation of range, make them the perfect vehicle in urban areas. Figure 3 shows the torque-speed requirements for the Federal Urban Driving Schedule. It is clear that most of the driving is performed in the range of 2,200–4,800 rpm, where most of the dots in the figure are clustered. At this range, a moderate amount of torque less than 50 nm is required. Meanwhile, at lower rpm, higher torque is required around 125 nm. Lower rpms are typical for frequent start-stops driving and are typical of a traffic urban environment.
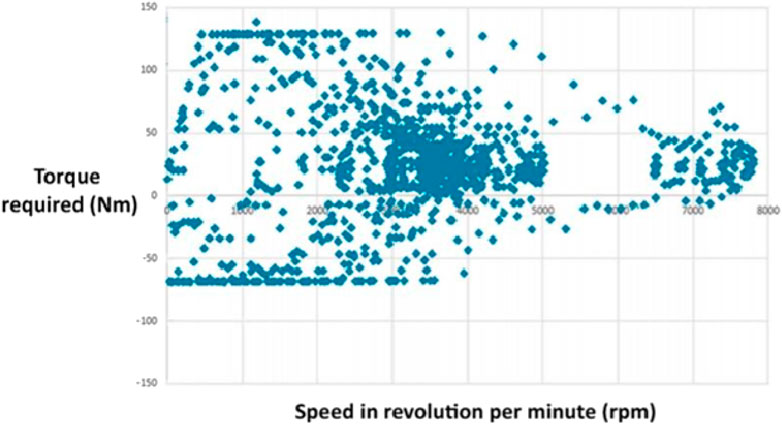
FIGURE 3. Federal Urban Driving Schedule torque-speed requirements. Data from (Chan, 2014).
Fuel Cell Electric Vehicle
FCEVs employ fuel cells to produce electricity. The fuel of choice for this process is typically hydrogen. Hydrogen is carried in special high-pressure tanks. Oxygen, which is another important element for the fuel cell to operate, is obtained from the ambient air. The generated electricity from the fuel cells is then transported to an electric motor to drive the wheels. Examples of such FCVs available in the market are the Toyota Mirai and Honda Clarity. Hydrogen from the cylinders and oxygen from air, react to produce electricity which runs the motor. The only by-product is water, which is exhausted from the tailpipe of the car. Some of the advantages and disadvantages of FCEVs are presented in Table 2.
TABLE 2. Advantages and Disadvantages of FCEV (Rose, 2015).
BEV Configurations
A battery electric vehicle, unlike an ICE vehicle, is more flexible in its configuration. This is due to the absence of complex mechanical systems. In BEV, the electric motor is the only moving part. Different techniques and control arrangements can be implemented to operate the motor. The power can be obtained by an array of batteries. The battery arrays and the electric motor can be positioned at different locations on the vehicle. Provided there is an electrical connection between them, the vehicle will operate. The nature of this flexibility allows for different configurations.
A BEV can be viewed as a system made up of three different subsystems: 1) the propulsion, which consists of the electricity converter, the electric motor, the transmission, the controller, and the wheels; 2) the energy source, which includes the refueling system, the battery arrays, and the energy management system; and 3) the auxiliary systems, like the temperature control system, the power steering unit, and the auxiliary power supply. Figure 4 shows the flow energy between the subsystems of a BEV.
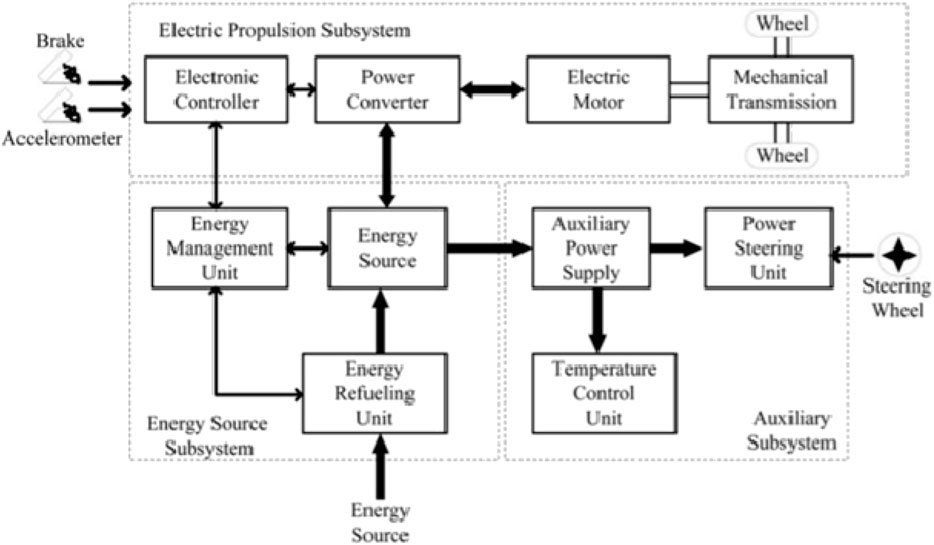
FIGURE 4. BEV Sub-systems, adapted from (Chan, 2014).
Figure 5a displays how an electric motor is used to replace the ICE in a front-engine front-wheel drive vehicle. A clutch and gearbox produce low torque at high speeds and high torque at low speeds. In this configuration, the wheels can rotate at different speeds. In Figure 5b a clutch is omitted from the configuration. The gearbox is replaced with a fixed gear.
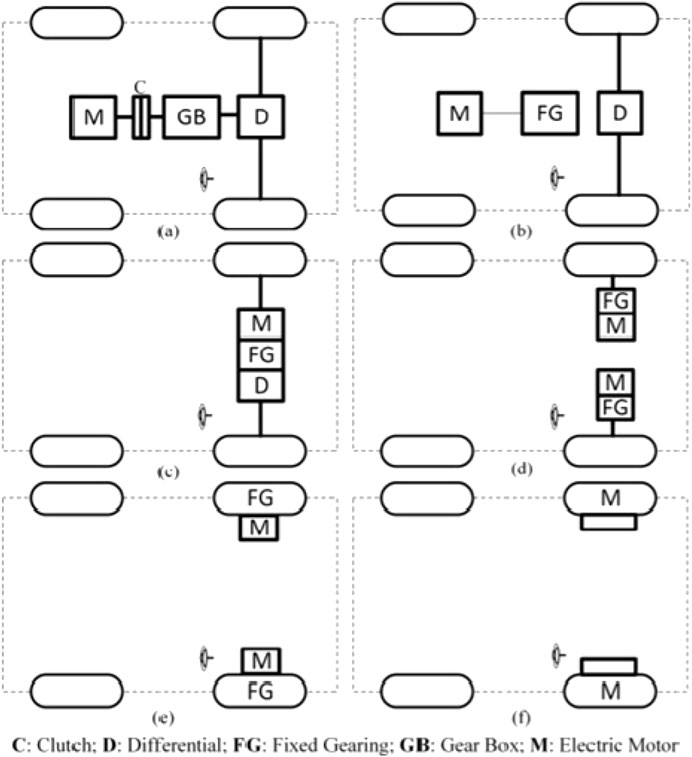
FIGURE 5. Different BEV configurations of front wheel drive (Chan, 2014).
In the configuration of Figure 5c, there is a fixed gearbox, a motor, and a differential, all as one unit that drives both the wheels. Usually, an electric motor is used to drive the front axle. This configuration can be found in the Nissan Leaf and Chevrolet Spark.
Figure 5d shows how two motors, one for each wheel, can be configured to obtain differential action. Placing the motors inside the wheels, as shown in Figure 5e, can reduce mechanical interaction and form an “in-wheel” drive. A planetary gear system is used in inline arrangements of input and output shafts, because planetary gear systems allow for high-speed reduction ratio.
In Figure 5f, the mechanical gear system is completely eliminated, through use of a low-speed motor with an outer rotor configuration on the wheel rim. The wheel and vehicle speed are controlled via the motor speed.
Rear Wheel Drive
BEVs can be configured as rear wheel drive vehicles, as shown in Figure 6a, which is the configuration the single motor version of Tesla Model S. The Nissan Blade Glider is also a rear-wheel-drive BEV with in-wheel motor arrangement. Different amount of torque on each wheel can be applied using in-wheel motors. This allows an efficient turning of the two rear wheels.
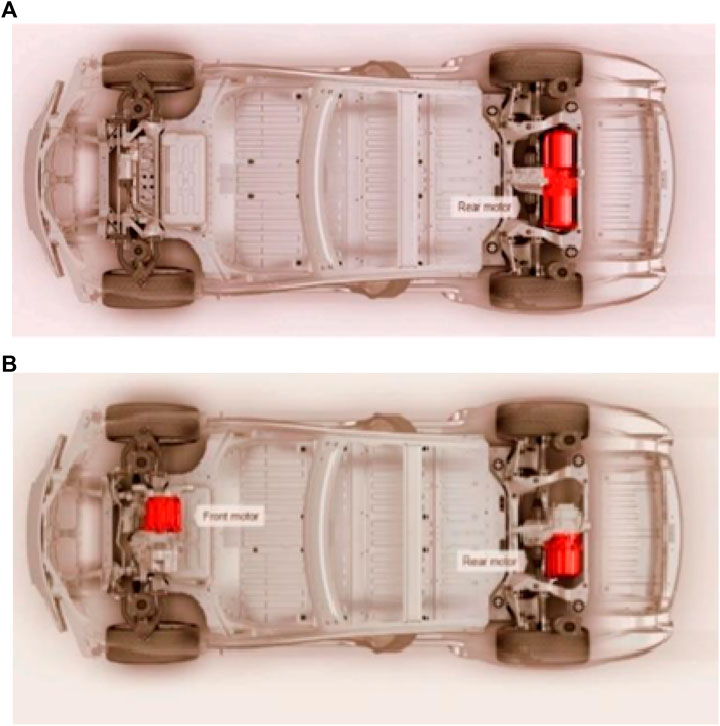
FIGURE 6. Tesla Model S in (A) Rear-wheel drive configuration [Reprint with permission (Thomas, 2016; Tesla, 2018)] and (B) All-wheel drive configuration [Reprint with permission (Wirasingha et al., 2015; Bin Wan Ramli et al., 2020)].
All-Wheel Drive
To provide better control of the vehicle and more power, all-wheel drive configurations can be implemented. All-wheel drive configuration increases the weight, cost, and complexity of the vehicle. Figure 6b shows an all-wheel drive configuration of Tesla Model S, where two motors are used to drive the front and rear axles.
AWD configurations provide efficient traction in slippery conditions, improved cornering, performance, and handling, especially by implementing torque vectoring. All-wheel driving can be implemented using in-wheel motor systems. This configuration is well suited for urban areas, where efficient steering, parking, and turning are important. Additionally, by removing the central motor, differential, transmission, and drive shafts, the weight of the vehicle is reduced. An example is the Hiriko Fold, shown in Figure 7. The Hiriko Fold has steering actuator, brakes, suspension, and a motor all integrated in each wheel.
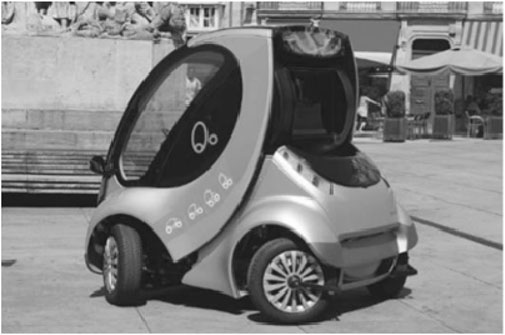
FIGURE 7. Hiriko Fold—A vehicle employing in-wheel motors.
Methodology
A larger family-sized (Class D) Battery Electric Vehicle is modelled using Simulink on MATLAB. The majority of EV literature is concentrated on Class A and B passenger vehicles which is why we have concentrated on this larger class of vehicle—a more significant challenge for the types of technologies discussed in this paper and a further, potentially significant commercial breakthrough for the EV market. Lithium-Sulphur, Lithium-ion, and Nickel-Cadmium batteries were tested as they display high specific energy and specific power density values. Permanent Magnet Synchronous Motor (PMSM), and Induction Motor (IM) were chosen as they can produce high torque and high power. Different combinations of motor and battery were simulated, to identify the best configuration for a medium-sized BEV. The results were evaluated based on the torque production and the power consumption. The results were then critically reviewed based on techno-economic criteria. Finally, future battery technology and future paths for medium-sized BEVs by year 2030 were projected.
Table 3 presents the key properties of the Permanent Magnet Synchronous Motor (PMSM), and the Induction Motor (IM) used in this work. A PMSM uses permanent magnets embedded in the rotor to create a constant magnetic field. The stator carries windings connected to an AC supply to produce a rotating magnetic field. Neodymium magnets are the most used magnets in these motors. The neodymium magnets, increase the cost, but also reduce the size and performance of PMSM. An IM uses permanent magnets embedded in the stator to create a constant magnetic field. The rotor carries windings connected to an AC supply to produce a rotating magnetic field. Brushes are used in IMs, which reduce the performance of IMs. But the permanent magnets placed on the stator allow for cheaper magnets to be used. The performance of PMSM and IM motors is discussed in Table 7.
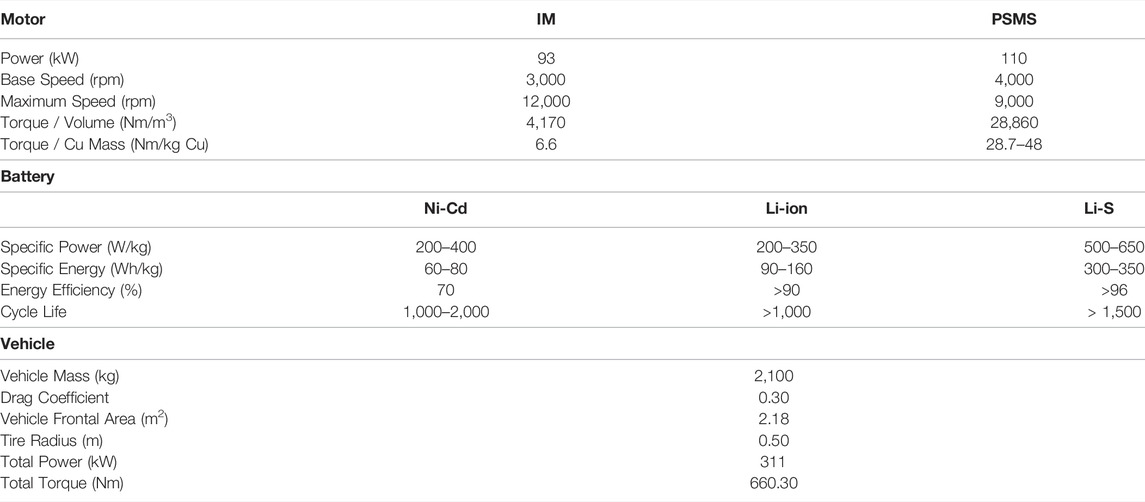
TABLE 3. Motor, Battery and Vehicle simulation properties.
Battery electric vehicles must have a battery. Some of the battery chemistries, currently available in the market, and recommended for electric vehicles, are Lead-acid, Nickel-metal-hydride (NiMH), Sodium Sulphur (NaS), and Lithium-ion (Li-ion). This work focused only on Nickel- Cadmium (Ni-Cd), Lithium-ion (Li-ion), and Lithium-Sulphur (Li-S) batteries. Lithium-Sulphur batteries have not been employed to any vehicle currently in the market, even though they offer high specific energy and power densities. Table 3 shows the most important characteristics of these batteries.
The modelled medium-sized battery electric vehicle was simulated in MATLAB and Simulink. Table 3 presents the vehicle parameters used in this study. To generate results for the electric vehicle performance under real time conditions, multiple scripts were created. Some of the scripts were based on past work in the literature, modified to the parameters of this work. The scripts were then translated into Simulink to create blocks models of the BEV. Figure 8a shows the essential components of the simulated medium-sized BEV in Simulink. These are the control system, the electrical system, and the vehicle dynamics. The blocks were created with reference from the original Hybrid Electric Vehicle Series—Parallel configurations.
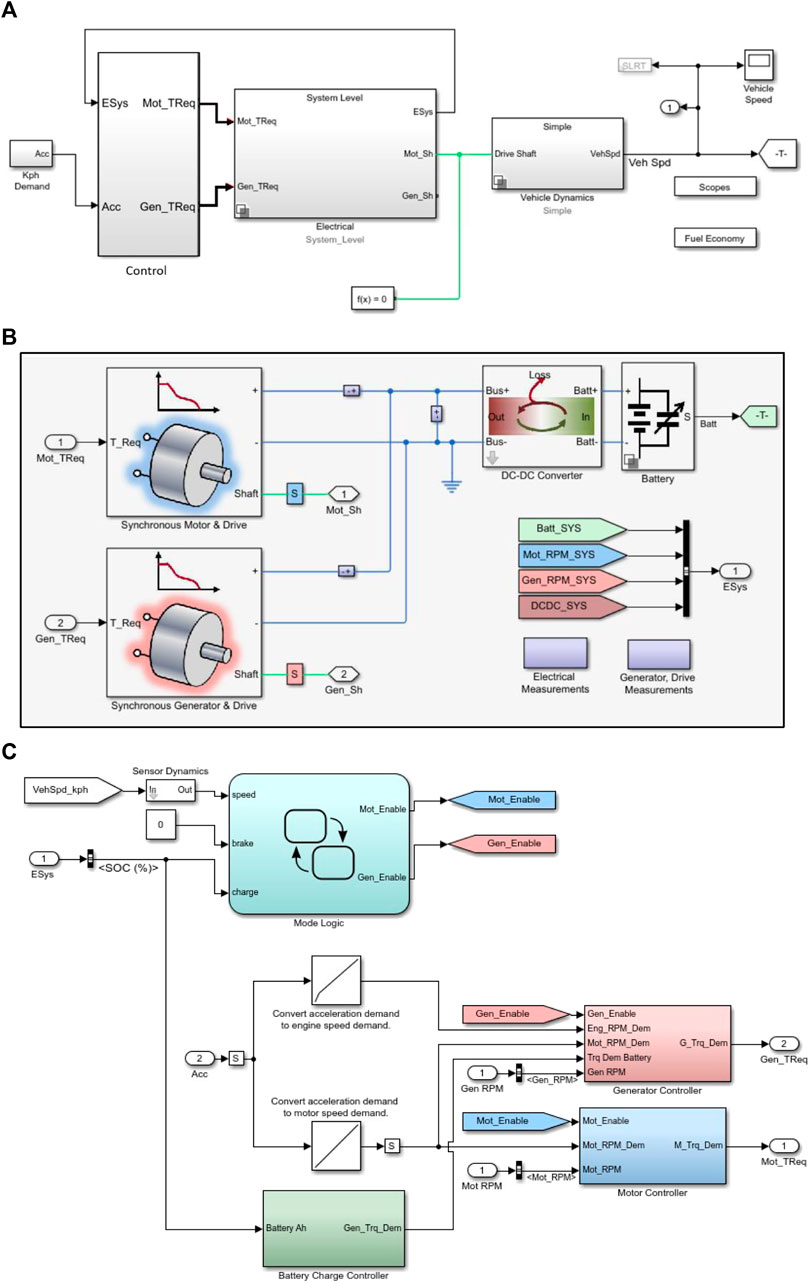
FIGURE 8. Simulink Models of (A) Block of a BEV (Chen and Rincon-Mora, 2006) (B) Electrical system configuration and (C) Control system configuration.
Figure 8b presents the electrical system model of the BEV in detail. The battery is shown on the top right of the figure. A DC—DC converter is placed between the battery and the motor and generator to ensure that only direct current is transmitted. The generator simulates the regenerative braking and the motor simulates the motor used for the vehicle propulsion.
Figure 8c illustrates the processes in the control block. The controller receives inputs from the electrical system while acknowledging the speed demand from the driver. The battery charger controller manages the amount of current flowing in and out of the battery pack. Since the system is prompt to overheating, the battery charger controller prevents such occurrences by reducing the current. The controller also increases the life cycle of the battery. The motor controller is employed to control the electric motor. The motor speed and current are recorded to allow for the calculation of the recommended value of torque.
Modelling Results
This section analyses the performance of a compact BEV in terms of battery performance, motor performance, range and acceleration based on the simulation done in MATLAB/SIMULINK. The FTP-75 drive cycle is used for all simulation in MATLAB/Simulink. The vehicle speed, according to the FTP-75 drive cycle is shown in Figure 9.
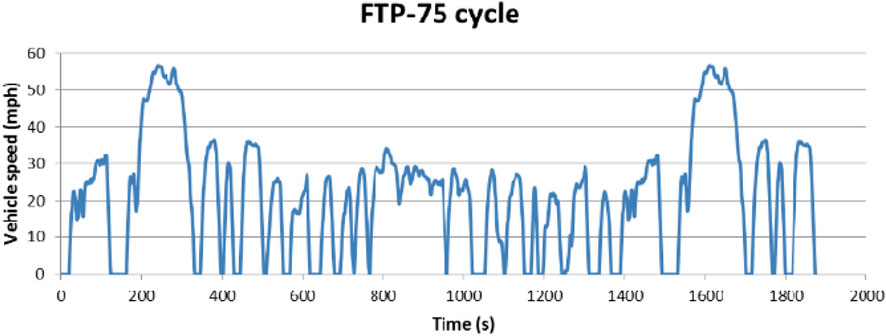
FIGURE 9. Vehicle speed using FTP-75 drive cycle.
Table 4 shows the performance of Lead Acid, Ni Cd, Li-ion, Li-Sulfur and Ni-MH batteries based on the simulation done in Simulink. At the end of the simulated period of 500s, the Lithium-ion battery provided a max battery power of 43 kW and had a state of charge percentage (SoC) of 71%. These values were the highest compared to the other simulated battery types except Li-Sulfur (which however came at the known problem of the lower available number of re-charges available before failure). The performance of the Lithium-ion battery is explained by its high energy density and high charge retainment as shown in Figure 10. The Nickel-Cadmium battery had the second highest SoC and maximum power provided, with values of 41ckW and 65% respectively. The Nickel Metal Hydride and Lead Acid batteries had almost identical performance, providing a maximum power of 32 and 31 kW respectively and maintaining a state of charge of 59% and 60% respectively. The Nickel Metal Hydride and Lead Acid batteries based on their performance and applicability to BEVs were not shortlisted for further analysis in this work.
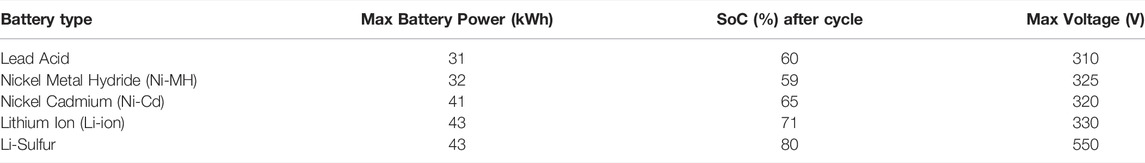
TABLE 4. Simulation results of different battery types.
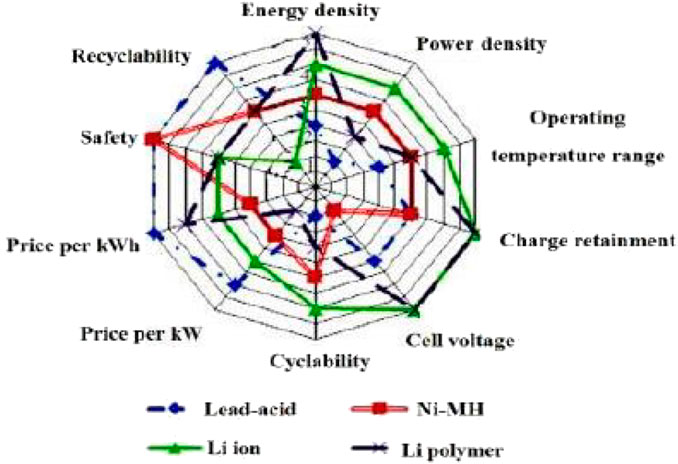
FIGURE 10. Comparison of performance between four different batteries (Zhang et al., 2017).
Lithium-ion batteries are currently considered the standard battery option for BEVs despite their high cost (Yatsui and Bai, 2011). Based on the simulation results of the four different batteries simulated in this work (Lead Acid, Ni Cd, Li-ion and Ni-MH), it is evident that Lithium-ion batteries are considerably the best option for a compact BEV. However, there are many types of Li-ion batteries with similar performance. In Table 5, the different technologies of Li-ion batteries are compared, their advantages and disadvantaged presented. In general, Li-ion battery technology has a lot of advantages compared to other mature type of batteries. For example, Li-ion batteries have a specific energy (∼100–265 Wh/kg) and energy density (∼250–670 Wh/L) much higher than other battery technologies. Li-ion batteries are also good in sustaining energy, with a self-discharge of 1–5% per month, which is 15% lower than that of Nickel Metal Hydride batteries (Hannan et al., 2017). However, the main disadvantage of Li-ion batteries is their overheating issue. Vehicle powertrain could catch fire due to this problem. Manufacturers like Tesla and Nissan invest heavily in research and development to mitigate this issue and hence improve the safety of BEV.
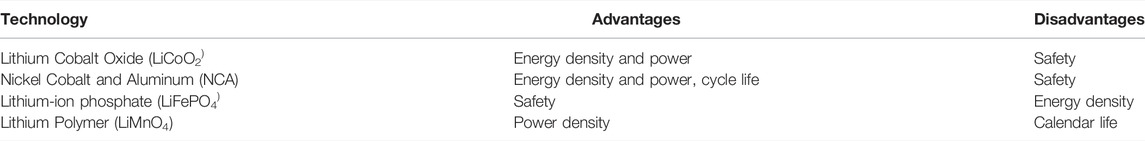
TABLE 5. Comparison of various types of Li-ion batteries in term of advantages and disadvantages (Yatsui and Bai, 2011; Hannan et al., 2017).
General Motor Behavior
Figure 11 is a typical example of the simulation results. Figure 11 presents the motor voltage, current, and generated power as a function of time. The current curve follows the torque, indicating regenerative breaking when the current has negative values. The voltage curve follows the speed curve, showing that the vehicle is moving in the forward direction. The third plot of Figure 11 presents the power flow of the battery to the motor during operation, and the returning of power to the battery during regenerative breaking.
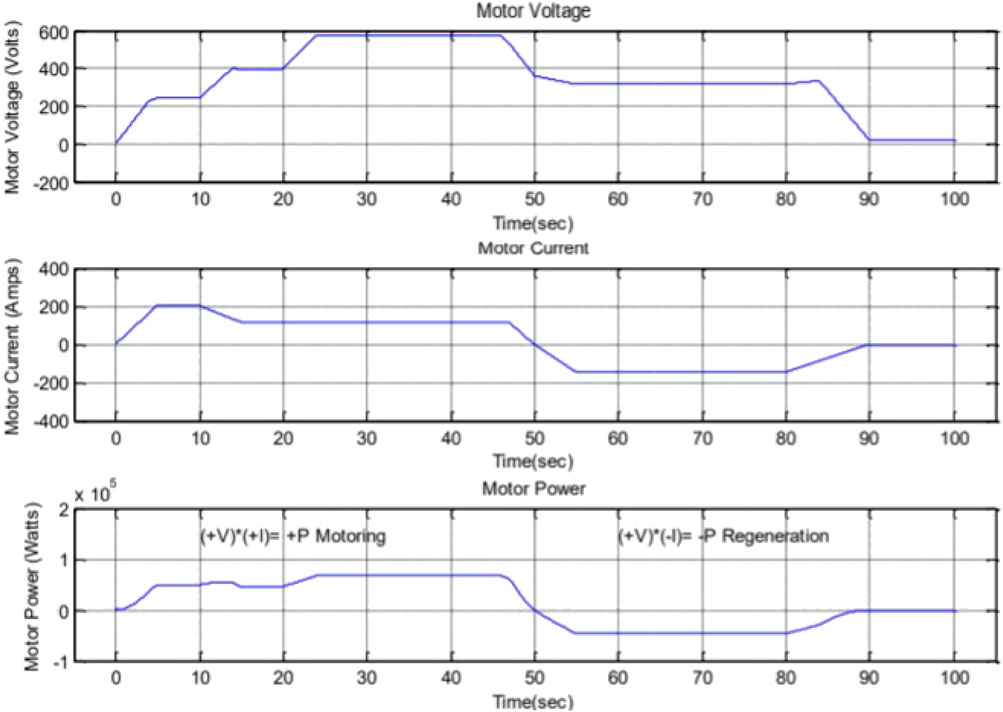
FIGURE 11. Motor voltage, current and power.
Simulations for Different Combinations of Batteries and Motors
Figure 11 refers to the combination of Li-S battery and IM motor. Similar simulations were performed for all the combinations of motors and batteries presented in Table 6. Table 6 shows the average value of torque produced from different combinations of electric motors and batteries. The highest average torque produced is from the combination of permanent magnet motor and Lithium-Sulphur battery, which gives 59.20 nm. Meanwhile, the lowest average torque produced is 17.40 nm, which is obtained from the combination of induction motor and Nickel-Cadmium battery. It can be observed that for every battery chemistry used, the permanent magnet motor always produces a higher value of torque than that induction motor. This is attributed to the lack of brushes and the lighter rotor. Theoretically, the higher the torque, the higher the acceleration of the vehicle. This implies that the vehicle with more torque, can cover a distance in a shorter duration. Therefore, permanent magnet is a better choice than induction motor for an electric motor vehicle.
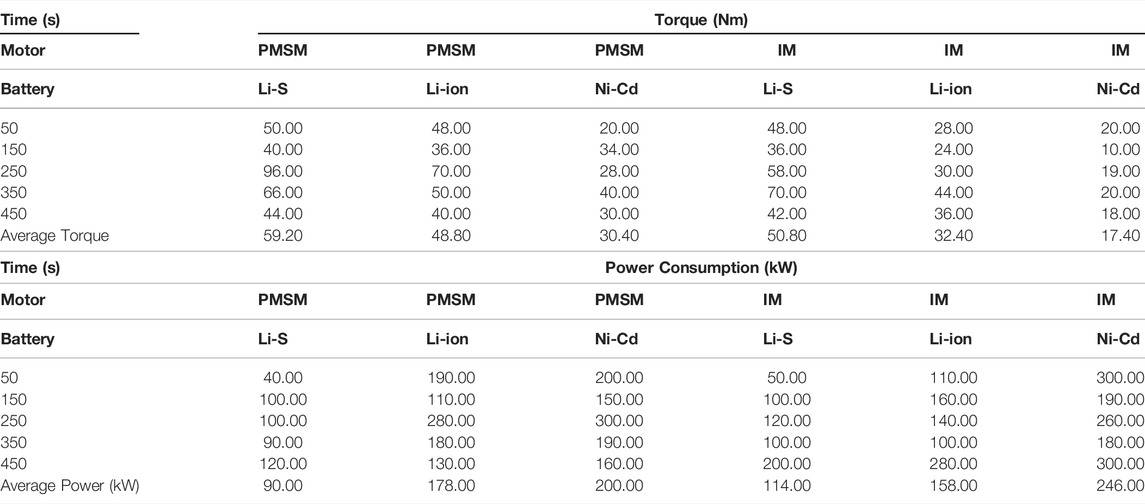
TABLE 6. Average torque and power produced from different combinations of batteries and motors.
Table 6 shows the average power consumption from different combinations of electric motors and batteries technology. The highest power consumption can be seen in the combination of an induction motor with Nickel-Cadmium battery, which consumes about 246.00 W. On the other end, permanent magnet motor with Lithium-Sulphur battery consumed only 90.00 W for the simulated driving cycle.
A permanent magnet motor is more suitable for a BEV than an induction motor. However, when looking at Li-ion battery performance, the induction motor gives a lower value of power consumption than that of the permanent magnet motor. This is the reason why current models, such as Tesla S and Nissan Leaf are equipped with an induction motor.
The life cycle of a battery depends on the power consumption. The higher the consumed power, the shorter the life cycle of a battery. Higher power consumption causes a battery to be less efficient in the long-term and negatively affects the performance of the vehicle. It is evident that Li-S batteries have the lowest average power consumption regardless of the motor type. Li-ion and Ni-Cd batteries follow in increasing average power consumption. Table 7 presents a comparison of the advantages and disadvantages of different battery technologies. Li-S batteries have a higher capacity compared to other battery technologies. However, Li-S batteries have a shorter life cycle, due primarily to the charging cycle in this type of battery causing a build-up of chemical deposits that degrade the cell and shorten its lifespan.
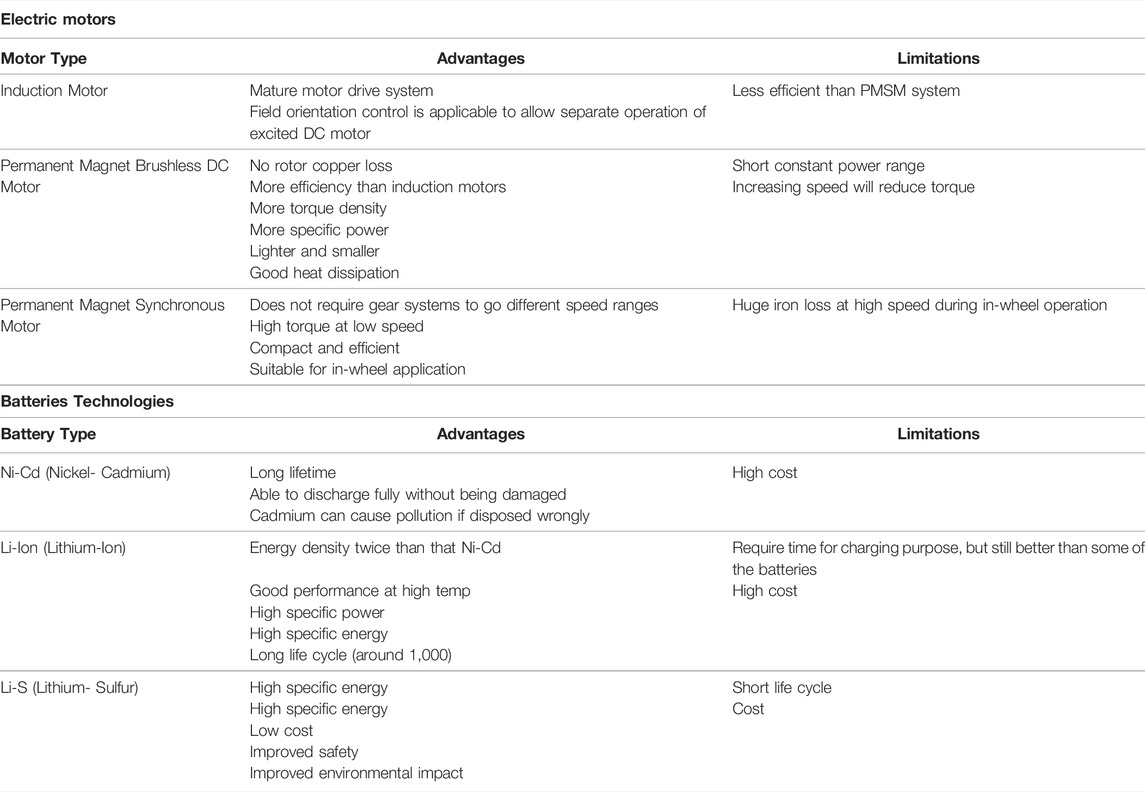
TABLE 7. Limitations and advantages of different electric motors and batteries technologies (Edwards and Kinney, 2011; Cooper and Moseley, 2013; Chalk and Miller, 2014; Fetcenko et al., 2014; Khaligh and Li, 2014; Olson and Sexton, 2015).
Overall, the combination of a permanent magnet motor and Lithium-Sulphur battery appears to be the most suitable for the drivetrain of a medium-sized BEV. The ranking of the performance of different combinations of technologies is tabulated in Table 8. The combinations of different technologies are ranked from the most preferred to the least desired.
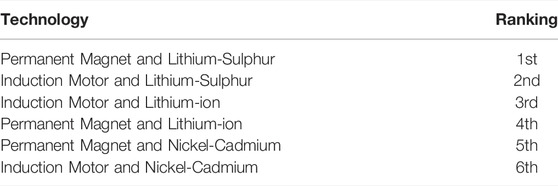
TABLE 8. Performance of different combinations of technologies. With 1- being the most preferred and 6 the least.
Comparing the induction motor and the permanent magnet motor, the characteristic generated by an induction motor provides a more stable curve than the permanent magnet motor. Implementation of a permanent magnet motor in BEVs has been observed to deliver higher performance characteristics. But taking stability into consideration, an induction motor is preferred. This explains why almost every battery electric vehicle available in the market today employs induction motor as their propulsion system. However, permanent magnet, after some minor technological improvement on the stability issues, will probably dominate the future market, along with Lithium-Sulphur battery.
Projection of Battery Technology Pathways
Most of the current EVs, including Tesla Model S, are powered by Lithium-ion batteries due to their high-power density and high energy density relative to other battery technologies. With 80–150 Wh/kg energy density (Scrosati and Garche, 2010a; DunnGaines et al., 2012; Ellingsen et al., 2014), current Li-Ion batteries on are limiting the vehicle range. Today, Li-Ion batteries significantly impact the environmental during their life cycle. Each kg of Li-ion battery consumes 1,141–1224 MJ-equivalent energy and generates 57–85 kg CO2 equivalent emissions during its life cycle (Notter et al., 2011; Li et al., 2014). Recent years have showed rapid progress on the research and development of next-generation battery technologies with higher energy density and better environmental performance.
Compared to conventional Li-ion batteries, Li-S batteries offer a much higher capacity of 1672 mA h/g (Manthiram et al., 2014), corresponding to a high theoretical energy density of −2,600 Wh/kg. Sulphur is widely available in nature and often considered a more environmentally friendly material than heavy metals used in conventional lithium-ion batteries. Figure 12 shows that Lithium-Sulphur batteries have the potential to be both smaller and lighter than Lithium-ion batteries.
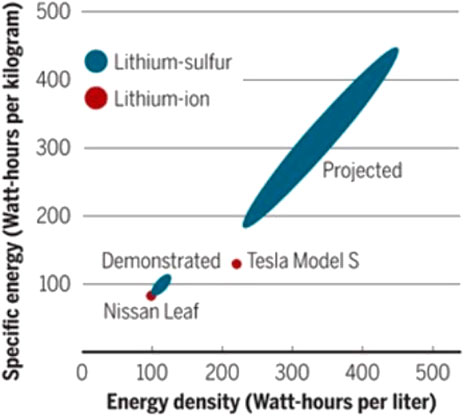
FIGURE 12. Comparison of Li-S and Li-ion batteries. Adapted from (Manthiram et al., 2014).
The path of battery technology can then be summarized in Figure 13. A survey on batteries technology development found that: 1) Improving battery design and packaging will increase 20–25% in specific energy with a similar reduction in cost by 2016–2019. 2) Introduction of advanced materials such as silicon anodes will provide 70–75% improvement in specific energy and 50% reduction in cost per kWh by 2020–2022. 3) Introduction of Lithium-Sulphur batteries and Lithium-air will provide up to 70% cost reduction per kWh by 2030 (Chalk and Miller, 2014).
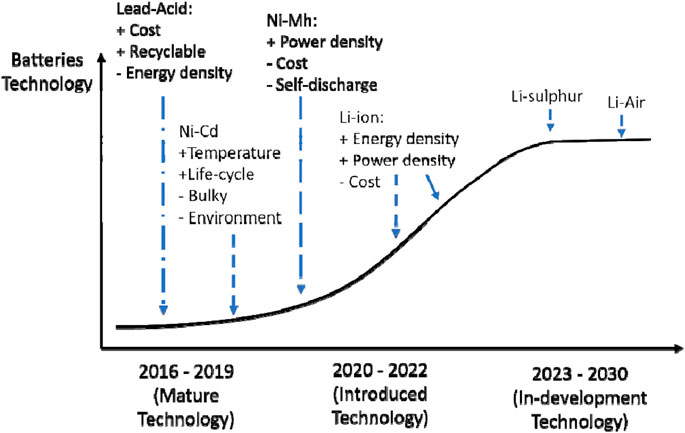
FIGURE 13. Battery technology roadmap (Chalk and Miller, 2014).
Lithium batteries are predicted to be the most widely used technology in BEV. Concerns regarding the availability of lithium to meet the demand have increased (Chalk and Miller, 2014). High demand of lithium could cause lithium depletion, increased market price and drop to BEVs sales. Figure 14 shows the lithium reserves in different countries. The biggest share of production and reserves are in Australia (about 36% globally), followed by Chile (35.6%). The third largest reserves are located in China (17%) followed by Argentina (7.4%). The world lithium reserves were estimated at 10 million tons in 2010. Europe has no significant reserves. Battery manufacturing absorbs about 24% of the global lithium production. Lithium is not just used for BEV, but also for mobile phones, portable electronics and other applications. The weight of lithium needed to produce a BEV with a range of 150 miles is between 5.1 and 19 kg. The reserves of lithium are believed to be inadequate for the production of BEV on a massive scale. The lithium supply will be sufficient for the coming decades, based on current production rates. The problem of lithium depletion can be tackled by reducing the volume of lithium in a single battery cell and by recycling old batteries.
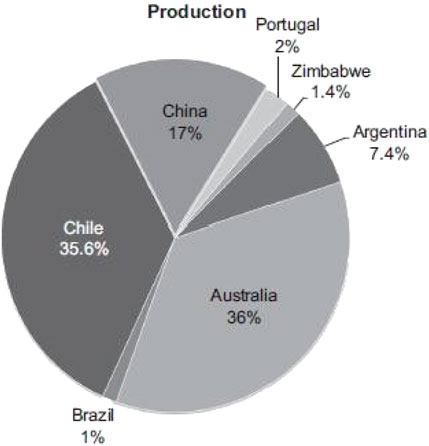
FIGURE 14. Distribution of lithium reserves in 2011 (Zhang et al., 2017).
Lithium Battery Techno-Economics
The implementation of Lithium batteries for BEVs in large scale has increased awareness regarding lithium supply and future availability of Lithium. No major concerns are currently present. If more than half of the cars will be EVs by 2030, the total lithium used would still be around 4 million tons, which is less than 15% of the global known reserves. The current cost of battery cells is around £ 350–£ 450 per kWh. However, some manufacturers have received subsidies, lowering the price of a battery to around £ 300 per kWh. The projection calculation of battery cost in Table 9 is done assuming no subsidies are received. A battery is set to cost around £ 536 per kWh. In addition to the cost of the battery, costs associated with battery cooling and safety, approximated to £ 173 per battery were added. Future costing for 2020–2030 were carried out based on current cost values. Effects of volume and scale in the case of new battery technologies have been taken into consideration. For example, one drawback of ionic liquids in Li-ion batteries is in their cost still prohibitively high, although price reduction is expected if the production will be scaled up (Scrosati and Garche, 2010b).
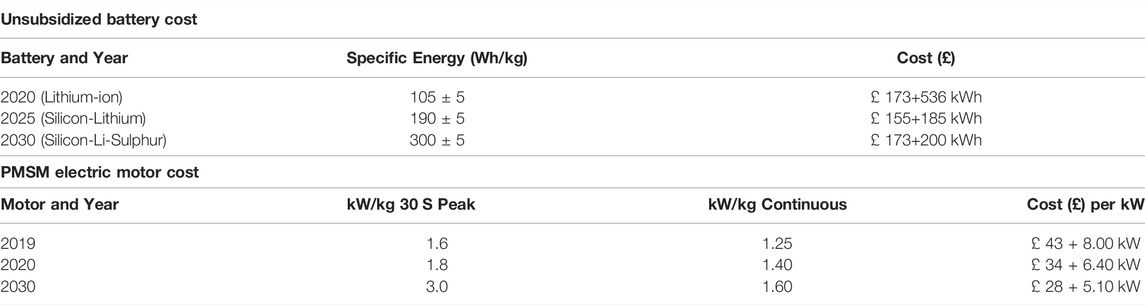
TABLE 9. Unsubsidized battery and PMSM electric motor cost for years 2019–2030.
After batteries, in BEVs, motors are the next most expensive components. This technology is considered mature, hence neither drastic performance increases nor reduction of costs are expected to occur. The baseline of this projection is based on the prevailing battery and PMSM technology for electric motors as summarized in Table 9 (Scrosati and Garche, 2010b).
Future Powertrain Scenarios and EV Adoption to 2030
The hybridization of powertrains, such as 48 V mild hybrids, are helping to meet the 2030 emissions regulations. Plug-in models of hybrid powertrains are proving very popular, as they can recharge their battery from an external electric power source. Renewable and sustainable energy sources make the plug-in hybrid vehicles even cleaner. Additionally, pure electric vehicles are constantly improving. Some of the individual components are transformed drastically, including new battery technologies and structural electronics (Scrosati and Garche, 2010b).
The implementation of a powertrain is not entirely based on performance criteria. More reasons influence the implementation of a powertrain, such as: 1) recyclability; 2) new principles (for example, energy independence, autonomy); 3) disruptive new components which are hard to acquire or manufacture 4) government subsidies and tax breaks, which can change suddenly; 5) changes in law targeting global or local air pollution; 6) integration of mechanical, electrical and electronic parts (for example, components that move such as motors rotating, and batteries swelling and shrinking are harder to integrate into structural components); and 7) change in market demand (for example, Porsche Engineering foresees a world of autonomous vehicles favoring pure electric powertrains and vehicles not bought by individuals) (Scrosati and Garche, 2010b).
In Figure 15 peak diesel can be seen to have already been reached with subsequent decline at the time of writing and until 2026 followed by a sharp decline to around 20% in 2031. Mild hybrid is similarly expected to decline along the same timeframe but a slightly shallower gradient.
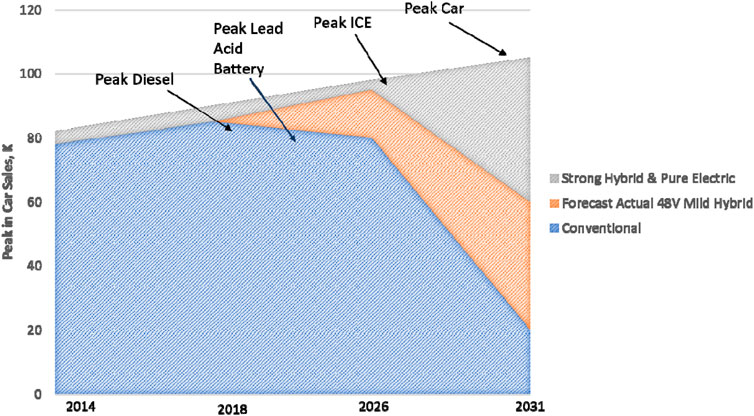
FIGURE 15. Forecast of global sales of different types of Vehicles. Adapted from (Scrosati and Garche, 2010b).
Figure 15 also shows the increasing trend of pure electric vehicles until now. This increasing trend is expected to continue with the same rate until 2031. After 2031, the sales of cars are expected to start levelling off as environmental imperatives and energy security and cost consideration make car pooling/vehicle sharing and increased use of public transport in an increasingly urbanized global population, more relevant. The last ICE-only passenger car is predicted to be manufactured probably by around the same time frame. This is mainly driven by global warming and fuel prices particularly as of last year (2022). In 2037 the peak oil fuel price is expected, and by 2050, fossil fuel independent vehicles are expected to dominate. Mass EV penetration is set to occur globally. For example, China which is expected to represent the largest automotive market in the world by 2025, is continuously pursuing battery and BEV manufacturing in its home market. It should be noted that forecasting sales volumes of EV in the next 2 decades, dependents heavily on parameters that cannot be reliably determined today. Such parameters are the ability of governments to subsidize EVs, and the willingness of consumers to spend on green technology.
Table 10 presents the sales forecast for light-duty vehicles for year 2030. The strict emission regulations and the increasing fuel prices will increase the sales of EV models in all developed countries. In Africa and India, due to the limited infrastructure and government subsidies, EV sales are not expected to surpass the sales of HEVs and PHEVs. In South America, especially Brazil, which relies heavily on biofuels, little penetration of EVs in the market is expected over the next 10 years.
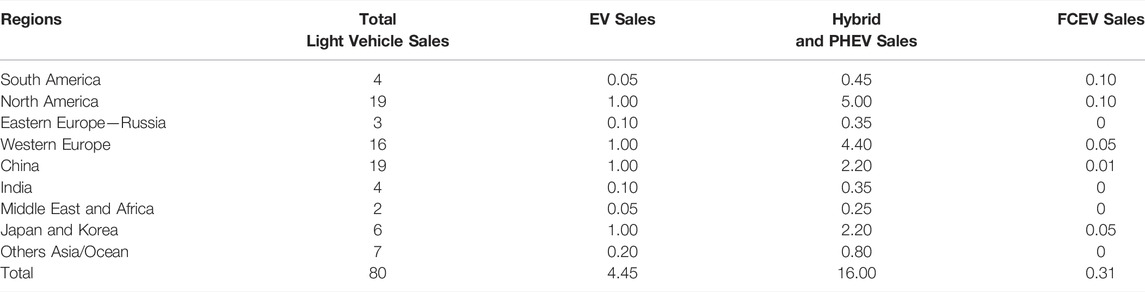
TABLE 10. Global light duty electric vehicle sales forecast for 2030, in millions of units, with optimistic forecast. Data from (Sustainable Energy Ireland (SEI), 2015).
In addition, EV batteries are estimated to reach sales of roughly 4 million units per year by 2030. It is anticipated that these sales will be shared among 12–15 global battery suppliers. Sale and production in volumes is determined by economies of scale. The existing method of battery recycling is expected to intensify by 2030. The industry reports that the cost of recycling batteries is almost £700–£800 per metric ton of batteries, including the after-treatment, transportation, handling and recycling. The recycling cost may be reduced after new battery streams become available and new plants are built in large-scale recycling process. Currently, metal recovery alone is not enough to compensate the recycling costs. Hence, both government and private subsidies are needed. The cost of recycling also depends on the battery type. In some regions, tax is applied on each manufactured battery cell, which is then allocated for its recycling. Lead-Acid and Nickel-based batteries are receiving minimal subsidies, as the metal recovery is relatively profitable. Li-ion battery recycling is currently receiving among the highest subsidies due to small amount of retrievable metal in the cells (Speirs et al., 2014).
Fuel cell vehicles have recently been introduced to the market. Therefore, they are still produced in small volumes. FCV production is expected to increase, but at a slow rate.
Conclusion
With increasingly stringent emission regulations and fuel prices, HEVs, PHEVs and BEVs are expected to increase penetrating the light-duty vehicle market. An economically viable alternative to conventional ICE vehicles are the BEVs. The BEV types, energy sources, configurations, battery technology, and electric motor technology were analyzed and discussed in this work. Different combinations of battery and motor technologies were modelling for a medium-sized vehicle. It was concluded that Lithium-Sulphur batteries and permanent magnet motor are the most prominent technologies going forward. An important challenge of permanent magnet motors is their stability. This issue is the topic of current research and is expected to be addressed soon. Further research on the techno-economics of BEVs concluded that battery recycling, government subsidies and consumer behavior affects the future sales of BEVs. Projection of the future market foresees increase of the penetration of BEVs and gradual elimination of ICE vehicles.
Data Availability Statement
The original contributions presented in the study are included in the article/Supplementary Material, further inquiries can be directed to the corresponding author.
Author Contributions
MA carried out the analysis work; AP was the main supervisor; PS was assistant supervisor; AA provided electric vehicle architectural expertise; AG provide powertrain modelling expertise and BV provided overall automotive and powertrain expertise and drafting assistance and checking.
Conflict of Interest
The authors declare that the research was conducted in the absence of any commercial or financial relationships that could be construed as a potential conflict of interest.
Publisher’s Note
All claims expressed in this article are solely those of the authors and do not necessarily represent those of their affiliated organizations, or those of the publisher, the editors and the reviewers. Any product that may be evaluated in this article, or claim that may be made by its manufacturer, is not guaranteed or endorsed by the publisher.
References
Andwari, A. M., Abdul Aziz, Azhar., Aziz, A. A., Said, M. F. M., Latiff, Z. A., and Ghanaati, A. (2015). Influence of Hot Burned Gas Utilization on the Exhaust Emission Characteristics of A Controlled Auto-Ignition Two-Stroke Cycle Engine. Int. J. Automot. Mech. Eng. 11, 2396–2404. doi:10.15282/ijame.11.2015.20.0201
Andwari, A. M., Muhamad Said, M. F., Abdul Aziz, A., Esfahanian, V., Idris, M. A., Mohd Perang, M. R., et al. (2018). Design and Simulation of a High-Pressure Gasoline Direct Injection (GDI) Pump for Engine Applications. J. Mech. Eng. (JMechE) S1 6 (1), 107–120. (ISSN: 1823-5514).
Bayindir, K. C., Gozukucuk, M. A., and Teke, A. (2015). A Comprehensive Overview of Hybrid Electric Vehicle: Powertrain Configurations, Powertrain Control Techniques and Electronic Control Units. Energy Convers. Manag. 52, 1305–1313. doi:10.1016/j.enconman.2010.09.028
Bin Wan Ramli, W. R., Pesyridis, A., Gohil, D., and Alshammari, F. (2020). Organic Rankine Cycle Waste Heat Recovery for Passenger Hybrid Electric Vehicles. Energies 13 (17), 4532. doi:10.3390/en13174532
Chalk, S. G., and Miller, J. F. (2014). Key Challenges and Recent Progress in Batteries, Fuel Cells, and Hydrogen Storage for Clean Energy Systems. J. Power Sources 159, 73–80. doi:10.1016/j.jpowsour.2006.04.058
Chan, C. C. (2014). The State of the Art of Electric and Hybrid Vehicles. Proc. IEEE 90, 247–275. doi:10.1109/5.989873
Chen, M., and Rincon-Mora, G. A. (2006). Accurate Electrical Battery Model Capable of Predicting Runtime and I-V Performance. IEEE Trans. Energy Convers. 21 (2), 504–511. doi:10.1109/tec.2006.874229
Cooper, A., and Moseley, P. (2013). “Progress in the Development of Lead-Acid Batteries for Hybrid Electric Vehicles,” in Proceedings of the IEEE Vehicle Power and Propulsion Conference (Windsor, UK, 1–6.
DunnGaines, J. B. L., Gaines, L., Sullivan, J., and Wang, M. Q. (2012). Impact of Recycling on Cradle-To-Gate Energy Consumption and Greenhouse Gas Emissions of Automotive Lithium-Ion Batteries. Environ. Sci. Technol. 46, 12704–12710. doi:10.1021/es302420z
Dzulkfli, M. S. B., Pesyridis, A., and Gohil, D. (2020). Thermoelectric Generation in Hybrid Electric Vehicles. Energies 13 (1314), 3742. doi:10.3390/en13143742
Edwards, D. B., and Kinney, C. (2011). “Advanced Lead Acid Battery Designs for Hybrid Electric Vehicles,” in Proceedings of the 16th Battery Conference on Applications and Advances (Long Beach, CA, USA, 207–212.
Ellingsen, L. A.-W., Majeau-Bettez, G., Singh, B., Srivastava, A. K., Valøen, L. O., and Strømman, A. H. (2014). Life Cycle Assessment of a Lithium-Ion Battery Vehicle Pack. J. Industrial Ecol. 18, 113–124. doi:10.1111/jiec.12072
Feneley, A. J., Pesiridis, A., and Andwari, A. M. (2017). Variable Geometry Turbocharger Technologies for Exhaust Energy Recovery and Boosting‐A Review. Renew. Sustain. Energy Rev. 71, 959–975. doi:10.1016/j.rser.2016.12.125
Fetcenko, M. A., Ovshinsky, S. R., Reichman, B., Young, K., Fierro, C., Koch, J., et al. (2014). Recent Advances in NiMh Battery Technology. J. Power Sources 165, 544–551. doi:10.1016/j.jpowsour.2006.10.036
Forero Camacho, O. M., and Mihet-Popa, L. (2016). Fast Charging and Smart Charging Tests for Electric Vehicles Batteries Using Renewable Energy. Oil Gas. Sci. Technol. - Rev. IFP Energies Nouv. 71, 13–25. doi:10.2516/ogst/2014001
Frank, J. H., Pickett, L. M., Bisson, S. E., Patterson, B. D., Ruggles, A. J., Skeen, S. A., et al. (2015). Quantitative Imaging of Turbulent Mixing Dynamics in High-Pressure Fuel Injection to Enable Predictive Simulations of Engine Combustion. Sandia Technical Report SAND2015-8758, September 2015. Available at: https://prod-ng.sandia.gov/techlib-noauth/access-control.cgi/2015/158758.pdf.
Ghanaati, A., Muhamad Said, M. F., Mat Darus, I. Z., Muhamad Said, M. F., and Andwari, A. M. (2015). A Mean Value Model for Estimation of Laminar and Turbulent Flame Speed in Spark-Ignition Engine. Int. J. Automot. Mech. Eng. 11, 2224–2234. doi:10.15282/ijame.11.2015.5.0186
Grunditz, E. A., and Thiringer, T. (2016). Performance Analysis of Current BEVs Based on a Comprehensive Review of Specifications. IEEE Trans. Transp. Electrific. 2, 270–289. doi:10.1109/tte.2016.2571783
Hannan, M. A., Lipu, M. S. H., Hussain, A., and Mohamed, A. (2017). A Review of Lithium-Ion Battery State of Charge Estimation and Management System in Electric Vehicle Applications: Challenges and Recommendations. Renew. Sustain. Energy Rev. 78, 834–854. doi:10.1016/j.rser.2017.05.001
Hidrue, M. K., Parsons, G. R., Kempton, W., and Gardner, M. P. (2014). Willingness to Pay for Electric Vehicles and Their Attributes. Resour. Energy Econ. 33, 686–705. doi:10.1016/j.reseneeco.2011.02.002
Jassim, E. I., Sphicas, P., and Jasem, B. I. (2019). Environmental Impact of Mixing Biofuel with Gasoline in Spark Ignition Engine. IOP Conf. Ser. Earth Environ. Sci. 401 (1), 012013. doi:10.1088/1755-1315/401/1/012013
Khaligh, A., and Li, Z. (2014). Battery, Ultracapacitor, Fuel Cell, and Hybrid Energy Storage Systems for Electric, Hybrid Electric, Fuel Cell, and Plug-In Hybrid Electric Vehicles: State of the Art. IEEE Trans. Veh. Technol. 59, 2806–2814. doi:10.1109/TVT.2010.2047877
Kramer, B., Chakraborty, S., and Kroposki, B. (2016). “A Review of Plug-In Vehicles and Vehicle-To-Grid Capability,” in Proceedings of the 34th IEEE Industrial Electronics Annual Conference, Orlando, FL, USA, 2278–2283. 10 – 13.
Li, B., Gao, X., Li, J., and Yuan, C. (2014). Life Cycle Environmental Impact of High-Capacity Lithium Ion Battery with Silicon Nanowires Anode for Electric Vehicles. Environ. Sci. Technol. 48, 3047–3055. doi:10.1021/es4037786
Mahmoudzadeh Andwari, A., Pesiridis, A., Rajoo, S., Martinez-Botas, R., and Esfahanian, V. (2017). A Review of Battery Electric Vehicle Technology and Readiness Levels. Renew. Sustain. Energy Rev. 78 (October), 414–430. doi:10.1016/j.rser.2017.03.138
Mahmoudzadeh Andwari, A., Pesyridis, A., Esfahanian, V., and Said, M. (2019). Combustion and Emission Enhancement of a Spark Ignition Two-Stroke Cycle Engine Utilizing Internal and External Exhaust Gas Recirculation Approach at Low-Load Operation. Energies 12 (4), 609. doi:10.3390/en12040609
Manthiram, A., Fu, Y., Chung, S.-H., Zu, C., and Su, Y.-S. (2014). Rechargeable Lithium-Sulfur Batteries. Chem. Rev. 114, 11751–11787. doi:10.1021/cr500062v
Norgard, P. B., Camacho, O. M. F., Rao, N., and Mihet-Popa, L. (2014). Electric Vehicle Batteries Testing in a Distribution Network Using Sustainable Energy. IEEE Trans. Smart Grid 5, 1033–1042. doi:10.1109/TSG.2014.2299064
Notter, D. A., Gauch, M., Widmer, R., Wäger, P., Stamp, A., Zah, R., et al. (2011). Contribution of Li-Ion Batteries to the Environmental Impact of Electric Vehicles. Environ. Sci. Technol. 44, 6550–6556. doi:10.1021/es903729a
Olson, J. B., and Sexton, E. D. (2015). “Operation of Lead-Acid Batteries for HEV Applications,” in Proceedings of the 15th Battery Conference on Applications and Advances (Long Beach, CAUSA, 205–210.
Rose, R. (2015). “Questions and Answers about Hydrogen and Fuel Cells,” in Report Style (Washington, DC, USA: U.S. Department of Energy).
SAE International (2015). “SAE Electric Vehicle and Plug-In Hybrid Electric Vehicle Conductive Charge Coupler,” in SAE Standard J1772 (Warrendale, PA, USA: Society of Automotive Engineers SAE).
Scrosati, B., and Garche, J. (2010). Lithium Batteries: Status, Prospects and Future. J. Power Sources 195, 2419–2430. doi:10.1016/j.jpowsour.2009.11.048
Scrosati, B., and Garche, J. (2010). Lithium Batteries: Status, Prospects and Future. J. Power Sources 195 (9), 2419–2430. doi:10.1016/j.jpowsour.2009.11.048
Shareef, H., Islam, M. M., and Mohamed, A. (2016). A Review of the Stage-Of-The-Art Charging Technologies, Placement Methodologies, and Impacts of Electric Vehicles. Renew. Sustain. Energy Rev. 64, 403–420. doi:10.1016/j.rser.2016.06.033
Soldado, J. C., Pesyridis, A., Sphicas, P., Nikolakopoulos, P., Markides, C. N., and Deligant, M. (2021). Axial Turbo-Expander Design for Organic Rankine Cycle Waste-Heat Recovery with Comparative Heavy-Duty Diesel Engine Drive-Cycle Performance Assessment. Front. Mech. Eng. 7. doi:10.3389/fmech.2021.676566
Speirs, J., Contestabile, M., Houari, Y., and Gross, R. (2014). The Future of Lithium Availability for Electric Vehicle Batteries. Renew. Sustain. Energy Rev. 35, 183–193. doi:10.1016/j.rser.2014.04.018
Sphicas, P. (2013). High Pressure and High Temperature Measurements on Diesel Sprays. PhD Thesis. London: Imperial College London. Available at: https://spiral.imperial.ac.uk:8443/handle/10044/1/18063.
Sphicas, P., Pickett, L. M., Skeen, S. A., Frank, J. H., and Parrish, S. (2018). Interplume Velocity and Extinction Imaging Measurements to Understand Spray Collapse when Varying Injection Duration or Number of Injections. At. Spr. 28 (9), 837–856. doi:10.1615/AtomizSpr.2018025956
Sphicas, P., Pickett, L. M., Skeen, S., Frank, J., Lucchini, T., Sinoir, D., et al. (2017). A Comparison of Experimental and Modeled Velocity in Gasoline Direct-Injection Sprays with Plume Interaction and Collapse. SAE Int. J. Fuels Lubr. 10 (1), 184–201. doi:10.4271/2017-01-0837
Sphicas, P., Pickett, L., Skeen, S. A., and Frank, J. H. (2017). Inter-plume Aerodynamicsfor Gasoline Spray Collapse. Int. J. Engine Res. 19 (10), 1048–1067. doi:10.1177/1468087417740306
Sustainable Energy Ireland (SEI) (2015). Hybrid Electric and Battery Electric Vehicles, Technology, Costs and Benefits. Dublin: SEI.
Tesla (2018). Model S | Tesla. Available at: https://www.tesla.com/models.
Thomas, C. E. (2016). Fuel Cell and Battery Electric Vehicles Compared. Int. J. Hydrogen Energy 34, 6005–6020. doi:10.1016/j.ijhydene.2009.06.003
Willianson, S. S. (2016). “Electric Drive Train Efficiency Analysis Based on Varied Energy Storage System Usage for Plug-In Hybrid Electric Vehicle Applications,” in Proceedings of the IEEE Power Electronics Specialists Conference, Orlando, FL, USA, 17–21 June 2016, 1515–1520.
Wirasingha, S. G., Schofield, N., and Emadi, A. (2015). “Plug-in Hybrid Electric Vehicle Developments in the US: Trends, Barriers, and Economic Feasibility,” in Proceedings of the IEEE Vehicle Power and Propulsion Conference, Harbin, China, 3-5 September 2015, 1–8.
Yatsui, M. W., and Bai, H. (2011). “Kalman Filter Based State-Of-Charge Estimation for Lithium-Ion Batteries in Hybrid Electric Vehicles Using Pulse Charging,” in Proceeding of the 2011 IEEE Vehicle Power and Propulsion Conference, 1–5. doi:10.1109/VPPC.2011.6042988
Yilmaz, M., and Krein, P. T. (2014). Review of Battery Charger Topologies, Charging Power Levels, and Infrastructure for Plug-In Electric and Hybrid Vehicles. IEEE Trans. Power Electr. 28, 2151–2169. doi:10.1109/TPEL.2012.2212917
Keywords: battery electric vehicles, hybrid electric vehicles, BEV, HEV, PHEV, FCEV
Citation: Bin Ahmad MS, Pesyridis A, Sphicas P, Mahmoudzadeh Andwari A, Gharehghani A and Vaglieco BM (2022) Electric Vehicle Modelling for Future Technology and Market Penetration Analysis. Front. Mech. Eng 8:896547. doi: 10.3389/fmech.2022.896547
Received: 15 March 2022; Accepted: 30 May 2022;
Published: 01 July 2022.
Edited by:
Evangelos G. Giakoumis, National Technical University of Athens, GreeceReviewed by:
Ravi Sekhar, Symbiosis Institute of Technology, IndiaLuciano Rolando, Politecnico di Torino, Italy
Copyright © 2022 Bin Ahmad, Pesyridis, Sphicas, Mahmoudzadeh Andwari, Gharehghani and Vaglieco. This is an open-access article distributed under the terms of the Creative Commons Attribution License (CC BY). The use, distribution or reproduction in other forums is permitted, provided the original author(s) and the copyright owner(s) are credited and that the original publication in this journal is cited, in accordance with accepted academic practice. No use, distribution or reproduction is permitted which does not comply with these terms.
*Correspondence: Panos Sphicas, UC5TcGhpY2FzQGJvbHRvbi5hYy51aw==