 Tom Tzanetakis
 Jaclyn Johnson
 Henry Schmidt2
 William Atkinson
 Jeffrey Naber
- 1Aramco Americas: Aramco Research Center - Detroit, Detroit, MI, United States
- 2Advanced Power Systems Research Center, Department of Mechanical Engineering-Engineering Mechanics, Michigan Technological University, Houghton, MI, United States
Gasoline compression ignition (GCI) is a promising combustion technology that could help alleviate the projected demand for diesel in commercial transport while providing a pathway to achieve upcoming CO2 and criteria pollutant regulations for heavy-duty engines. However, relatively high (i.e., diesel-like) injection pressures are needed to enable GCI across the entire load range while maintaining soot emissions benefits and managing heat release rates. There have only been a limited number of previous studies investigating the spray characteristics of light distillates with high-pressure direct-injection hardware under charge gas conditions relevant to heavy-duty applications. The current work aims to address this issue while providing experimental data needed for calibrating spray models used in simulation-led design activities. The non-reacting spray characteristics of two gasoline-like fuels relevant to GCI were studied and compared to ultra-low-sulfur diesel (ULSD). These fuels shared similar physical properties and were thus differentiated based on their research octane number (RON). Although RON60 and RON92 had different reactivities, it was hypothesized that they would exhibit similar non-reacting spray characteristics due to their physical similarities. Experiments were conducted in an optically accessible, constant volume combustion chamber using a single-hole injector representing high-pressure, common-rail fuel systems. Shadowgraph and Mie-scattering techniques were employed to measure the spray dispersion angles and penetration lengths under both non-vaporizing and vaporizing conditions. Gasoline-like fuels exhibited similar or larger non-vaporizing dispersion angle compared to ULSD. All fuels followed a typical correlation based on air-to-fuel density ratio indicating that liquid density is the main governing fuel parameter. Injection pressure had a negligible effect on the dispersion angle. Gasoline-like fuels had slower non-vaporizing penetration rates compared to ULSD, primarily due to their larger dispersion angles. As evidenced by the collapse of data onto a non-dimensional penetration correlation over a wide range of test conditions, all fuels conformed to the expected physical theory governing non-vaporizing sprays. There was no significant trend in the vaporizing dispersion angle with respect to fuel type which remained relatively constant across the entire charge gas temperature range of 800–1200 K. There was also no discernable difference in vapor penetration among the fuels or across charge temperature. The liquid length of gasoline-like fuels was much shorter than ULSD and exhibited no dependence on charge temperature at a given charge gas pressure. This behavior was attributed to gasoline being limited by interphase transport as opposed to mixing or air entrainment rates during its evaporation process. RON92 had a larger non-vaporizing dispersion angle but similar penetration compared to RON60. Although this seems to violate the original similarity hypothesis for these fuels, the analysis was made difficult due to the use of different injector builds for the experiments. However, RON92 did show a slightly larger vapor dispersion angle than RON60 and ULSD. This observation was attributed to nuanced volatility differences between the gasoline-like fuels and indicates that vapor dispersion angle likely relies on a more complex correlation beyond that of only air-to-fuel density ratio. Finally, RON92 showed the same quantitative liquid length and insensitivity to charge gas temperature as RON60.
1 Introduction
Liquid petroleum is projected to continue providing a large share of transportation sector energy over the next 30 years (U.S. Energy Information Administration, 2021; International Energy Agency, 2021). This is primarily due to its high energy density and ease of distribution. Demand for middle distillates like diesel and kerosene is also expected to rise within the commercial transport sector (ExxonMobil, 2021). These fuels are needed to support the increased economic activity associated with large, continuously developing nations. At the same time, demand for light distillates like gasoline is expected to decrease due to efficiency gains in the passenger vehicle sector (i.e., hybridization, electrification, etc.) (ExxonMobil, 2021). This scenario will create a demand disparity which could have negative economic impacts on commercial freight operators that rely solely on medium distillates. Furthermore, greenhouse gas and criteria pollutant emissions regulations for the on-road commercial transport sector are becoming far more stringent and difficult to meet with conventional diesel powertrains.
Gasoline compression ignition (GCI) is one technology that could help address the projected demand shift by using light distillates in the heavy-duty transportation sector. Recent research has shown that compared to diesel combustion, GCI can drastically reduce soot emissions while maintaining relatively low engine-out NOx (Zhang et al., 2016; Zhang et al., 2018). This is due to the higher volatility, lower viscosity, longer ignition delay, and better fuel-air mixing achieved with gasoline-like fuels. The improved soot-NOx tradeoff could also help alleviate the tremendous operational and durability demands placed on modern lean aftertreatment systems for meeting upcoming emissions regulations (Lee et al., 2017; Lee et al., 2019; Sharp et al., 2021). Optimizing the combustion system for GCI (i.e., piston bowl shape, injector, and air system configurations) also has the potential to improve fuel economy compared to the most efficient internal combustion engines today (Kumar et al., 2019; Pei et al., 2019; Sellnau et al., 2019). However, relatively high injection pressures (>1,000 bar) are needed to simultaneously manage soot emissions and heat release rates over the entire operating range of the engine, especially at high loads. Therefore, it is important to consider the use of high-pressure common rail injection systems as a key enabler for GCI.
There are only a few prior studies that have investigated the spray behavior of gasoline at high, diesel-like injection pressures (Payri et al., 2012a; Payri et al., 2012b; Han et al., 2014; Feng et al., 2016; Engine Combustion Network (ECN), 2022a). Even fewer have considered charge gas conditions and injector hardware relevant to heavy-duty compression ignition applications (Tang et al., 2017a; Zhang et al., 2017a; Tang et al., 2017b; Tang et al., 2018). The current study aims to address these gaps by investigating the spray characteristics of a heavy-duty, high-pressure common rail injector operating with real gasoline-like fuels. This work is an extension of three preceding studies which used optical diagnostics to measure the spray behavior of a unique light distillate under similar boundary conditions using a heavy-duty injector (Tang et al., 2017a; Zhang et al., 2017a; Tang et al., 2018). Non-reacting test results for this and market gasoline will be presented and compared to ultra-low-sulfur diesel (ULSD) at operating conditions relevant to heavy-duty GCI. The data is intended to shed light on the governing physics of high-pressure gasoline sprays and provide calibration data for high-fidelity models used in the simulation-led design of GCI combustion systems.
2 Materials and Methods
2.1 Fuel Specifications
Table 1 lists the fuel properties of ULSD and two light distillates that can be used in GCI applications. The RON60 is named as such because it has a research octane number (RON) of about 60. It exhibits similar reactivity to diesel but represents a drastic change in physical properties like density, viscosity, and volatility. The RON92 has an octane rating equivalent to that of regular market gasoline but contains no ethanol. Oxygenated compounds were avoided for this initial study to reduce the complexity in comparative analysis between RON92 gasoline and the other pure hydrocarbon fuels.
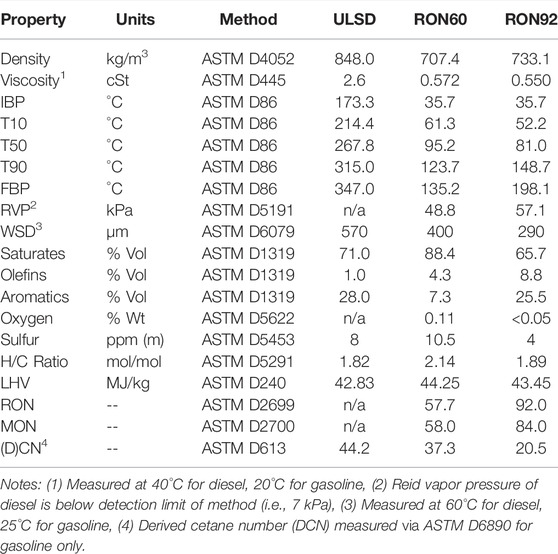
TABLE 1. Fuel properties.
The rationale for selecting RON60 and RON92 is elucidated in Figure 1. Viscosity is used as a singular metric for physical properties because it strongly correlates with volatility and density for petroleum distillates (Aleme et al., 2012). Existing within a similar reactivity range as diesel, RON60 allows the impact of gasoline physical properties on spray behavior to be somewhat isolated and studied. Then, with similar physical properties to RON60 but much lower cetane number, RON92 allows the impact of reactivity differences among gasoline range fuel sprays to be investigated. Excluding the ethanol content, RON92 also closely matches the properties of market gasoline, which is the ultimate target fuel for near-term GCI applications. ULSD provides an established baseline to compare gasoline-like fuels with in high-pressure, direct injection hardware. Since RON60 and RON92 share similar physical properties, it is expected that non-reacting spray characteristics like penetration and dispersion angle should also be similar. This hypothesis has been previously verified with gasoline direct injection (GDI) hardware up to fuel pressures of 450 bar (Zhang et al., 2020). The aim of the current work is to extend this validation to higher fuel pressures with common rail hardware at charge conditions relevant to heavy-duty engines. Although only non-reacting conditions are considered, the fuels are distinguished according to their research octane number to be consistent with other GCI combustion studies which focus on reacting spray characteristics or engine performance and emissions (Tang et al., 2017b; Zhang et al., 2018). Some nuanced differences in non-reacting spray behavior are expected between the gasolines driven primarily by their distinctive density and distillation characteristics (i.e., final boiling points). However, these will be further elaborated upon in the results section.
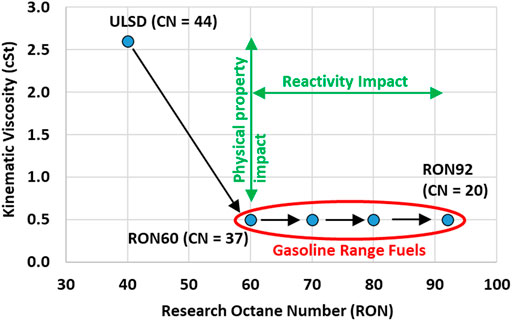
FIGURE 1. Middle and light distillate fuel property ranges.
One additional note should be mentioned regarding fuel lubricity. The neat wear scar diameter (WSD) of gasoline-like fuels typically ranges between 700 and 1000 μm (Arkoudeas et al., 2014). The WSDs of RON60 and RON92 were brought below the maximum value recommended for high-pressure injection equipment by dosing them with 200 ppm of a lubricity-improving additive (Lacey and Mason, 2000; Voice et al., 2017).
2.2 Experimental Setup
A constant-volume, optically accessible combustion chamber was used to generate the charge gas conditions pertaining to heavy-duty compression ignition applications (Zhang et al., 2016; Zhang et al., 2018). The 1 L vessel was rated to a maximum pressure and temperature of 345 bar and 2000 K, respectively.
For non-vaporizing tests, fuel and charge temperatures were kept at 40°C (313 K) to minimize phase change within the spray. Pure N2 gas was used to backfill the vessel and provide the desired charge density. Figure 2 compares fuel distillation curves to the vessel temperature and indicates that significant evaporation was not expected. Figure 3 shows the Z-type shadowgraph image setup used to measure liquid spray penetration and dispersion angle under non-vaporizing conditions (Tang et al., 2017a; Tang et al., 2018). A FASTCAM SA 1.1 high-speed camera with an 85 mm Nikon lens and a lens aperture setting of f/1.4 was employed to capture the spray evolution at 30,000 frames per second (FPS).
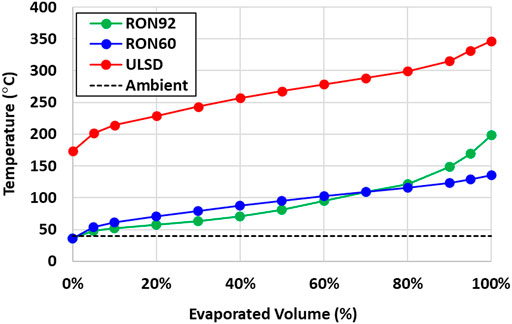
FIGURE 2. Fuel distillation curves (ASTM D86) compared to non-evaporating ambient vessel temperature.
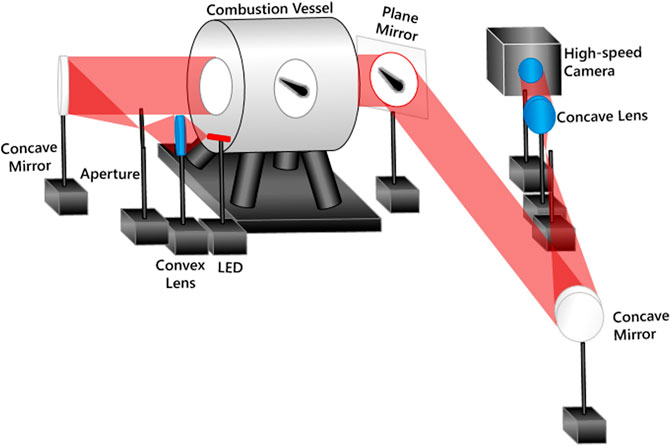
FIGURE 3. Optical setup for non-reacting, non-vaporizing tests, reproduced with permission from Tang et al. (2018), © SAE International.
High temperature vaporizing conditions were achieved by using a lean-dilute, acetylene-hydrogen fueled pre-burn process in the vessel. The initial fuel-air mixture composition was designed so that the thermodynamic end state of the pre-burn combustion process simulated the desired charge gas conditions to be studied without any excess oxygen. Prior to ignition of the pre-burn mixture by a spark discharge, two small fans spinning in opposite directions stirred the gaseous contents to obtain a uniform temperature profile within the chamber. Liquid fuel injection was triggered only when the desired charge pressure and temperature were reached during the cool-down phase of the gas. This occurred after the pre-burn process was completed and heat was lost through the relatively cool vessel walls which were pre-conditioned to 180°C with electrical heating. A separate cooling circuit was also employed around the injector tip to keep fuel temperature at 85°C regardless of the gas conditions. This was required due to heat transfer from the electrically heated vessel and pre-burn product gases to the injector tip. Additional details about the constant-volume chamber and pre-burn process may be found elsewhere (Naber and Siebers, 1996; Pickett et al., 2005; Johnson et al., 2009; Engine Combustion Network (ECN), 2022b).
Figure 4 shows the near-simultaneous Z-type shadowgraph/Mie-scattering layout designed to capture the time evolution of liquid length, vapor penetration, and vapor dispersion angle under evaporating conditions (Zhang et al., 2017a; Zhang et al., 2020). The same high-speed camera previously described was also used for this optical setup but with two Lightspeed Technologies HPLS-36AD3500 light emitting diodes (LEDs). One LED provided the light source for a Mie-scattering image to capture liquid length, while the other produced a shadowgraph image to determine the vapor penetration and dispersion angle. Figure 4 also shows how each LED was synchronized to flash separately in time with the camera shutter at 30,000 FPS (i.e., every 33.3 μs).
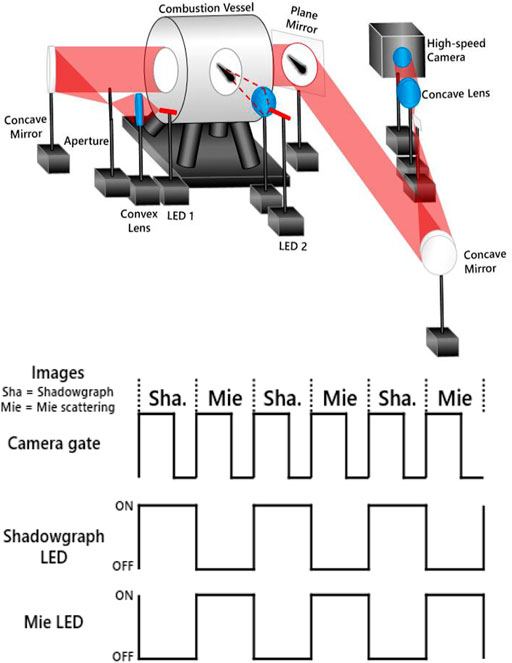
FIGURE 4. Optical setup and synchronized LED signals for non-reacting, vaporizing tests, reproduced with permission from Zhang et al. (2020), © SAE International.
2.3 Injector
Table 2 describes the single-hole injector used in this study. The design was based on a production heavy-duty Cummins XPI injector used in current ISX15 engines. Like most high-pressure diesel hardware, it consisted of a solenoid driven, hydraulically lifted main needle. However, the hole was placed along the central axis of the nozzle tip, as in the Engine Combustion Network (ECN) “Spray-D” configuration (Engine Combustion Network (ECN), 2022c; Yasutomi et al., 2019). The exit diameter, internal taper (K-factor), and peak flow capacity of the single-hole nozzle were targeted to match those of one hole from the production part as closely as possible (Torelli et al., 2018). Due to internal nozzle flow differences which impact the fuel injection rate shape profile and issuing spray behavior, this single-hole design may not be completely representative of the real multi-hole application (Torelli et al., 2021). However, it does enable high-fidelity optical interrogation of a single plume for detailed modeling and analysis studies.
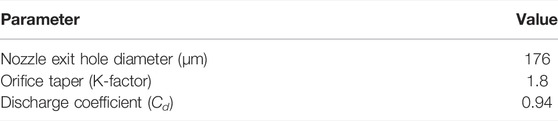
TABLE 2. Single-hole injector specifications.
2.4 Image and Data Processing
Figure 5 shows the methodology used to extract penetration and dispersion angle from shadowgraph images under non-vaporizing conditions (Tang et al., 2017a; Tang et al., 2018):
(1) Read in grayscale data from an uncompressed, 8-bit image file
(2) Perform background subtraction
(3) Apply threshold to grayscale and obtain a binary, black/white image
(4) Identify the spray boundary and extract penetration length based on a specific definition
(5) Extract the dispersion angle based on a specific definition
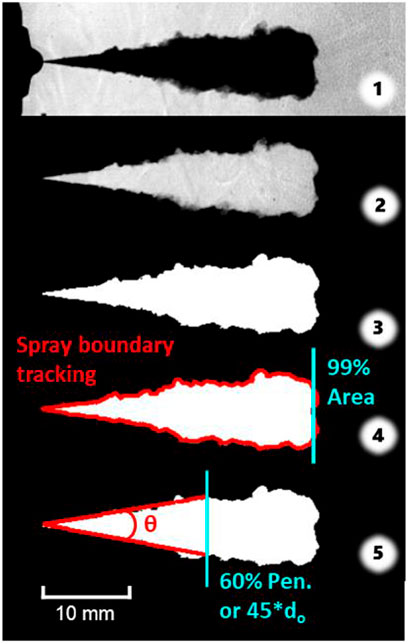
FIGURE 5. Non-vaporizing image processing methodology, reproduced with permission from Tang et al., 2017a, Tang et al., 2018, © SAE International.
Non-vaporizing penetration length was defined as the distance downstream of the injector tip which captured 99% of the total spray area. Two separate methods were considered for determining the spray dispersion angle. The first definition was to perform a linear fit on both sides of the spray plume boundary between the injector tip and 60% of its penetration (Tang et al., 2017a). The second definition employed the same linear fit technique but only within 45 exit hole diameters (
Figure 6 shows the post-processing methodology applied to shadowgraph images under vaporizing conditions (Zhang et al., 2017a). Steps 1–4 were essentially the same as those applied to the corresponding Mie-scattering images and previously to non-vaporizing images with only minor differences. Mie-scattering background subtraction was performed in the standard way due to the high contrast between the liquid spray and charge gas. However, vaporizing shadowgraph background subtraction was performed using the previous frame image due to the lack of contrast between fuel vapor and background gas. Instead of using a 5% max intensity threshold to determine the spray boundary, Otsu’s method was applied to extract a global threshold from the vaporizing shadowgraph images and create a binary image (Otsu, 1979). The definitions for liquid penetration, vapor penetration, and vapor dispersion angle were consistent with those used in the non-vaporizing tests. Varying the threshold values by ± 50% resulted in less than 3% difference among the measured parameters, indicating that the vaporizing post-processing technique was also insensitive to the choice of threshold (Zhang et al., 2017a). Figure 7 shows an example of shadowgraph and Mie-scattered image boundaries under vaporizing conditions 0.8 ms after the start of injection (ASOI) (Zhang et al., 2017a).
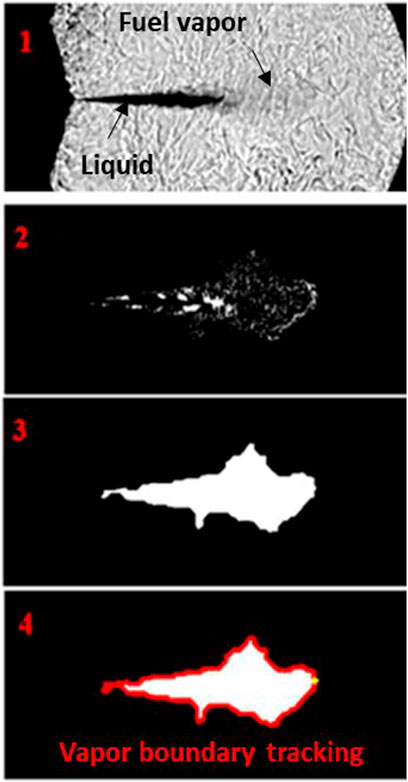
FIGURE 6. Vaporizing shadowgraph image processing methodology (Zhang et al., 2017a).
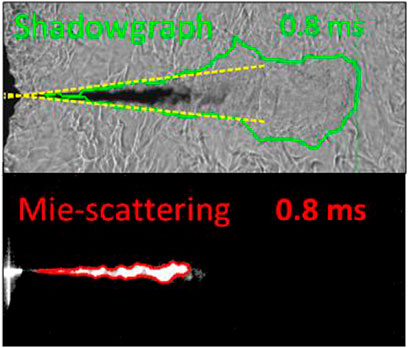
FIGURE 7. Example of vaporizing shadowgraph and Mie scattering image spray boundary tracking (Zhang et al., 2017a).
Due to the finite capture rate of the camera (i.e., time between frames), it was not possible to know the exact start of injection (SOI). However, the procedure shown in Figure 8 was used to estimate SOI and align subsequently measured data points with the origin (t, y) = (0, 0) (Tang et al., 2017a; Zhang et al., 2017a). This process was needed to properly compare penetration data across different fuels and test conditions. A square-root function was fit against the first three measurements in the penetration curve and extrapolated to the point of zero penetration (y = 0). This mathematical dependence for early spray penetration has been firmly established in prior studies of similar injector hardware (Naber and Siebers, 1996). The corresponding time value at zero penetration represents the estimated SOI and time-shift needed to pass the curve through the origin.
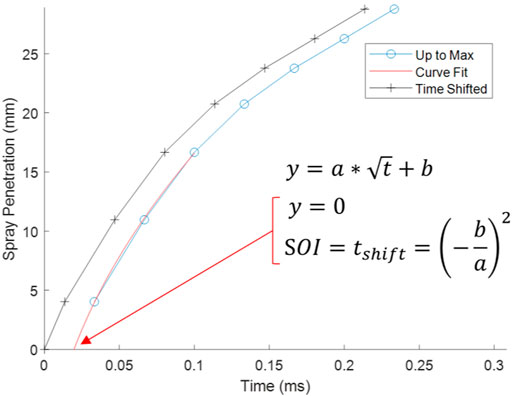
FIGURE 8. SOI estimation and time origin alignment procedure for penetration curves.
To compare spray dispersion angle across different fuels and conditions, a quasi-steady-state (QSS) average was extracted from the time-dependent data. Figure 9 shows that an averaging window between 0.4 ms ASOI and 0.2 ms before the end of injection (BEOI) was used for the 60% penetration angle criterion. To extract a QSS angle based on the
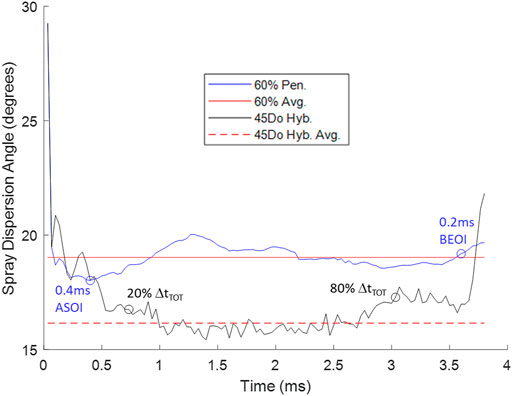
FIGURE 9. Averaging windows used for determining quasi-steady-state dispersion angle.
Finally, all measurements were repeated between 2–3 times for each test condition to create an ensemble-averaged data set. Figure 10 shows that up to 5 repeats were conducted at one condition and did not show a reduced uncertainty compared to the lower number of realizations. Error bars reported on graphs in the results section correspond to the standard deviation across test repeats.
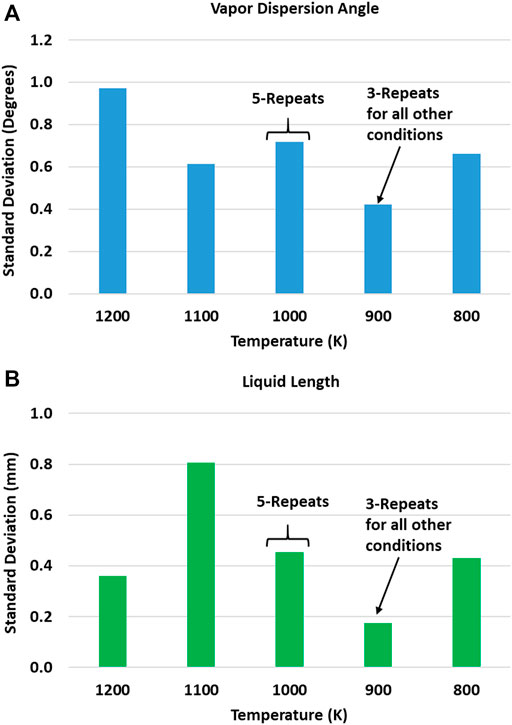
FIGURE 10. Standard deviation of RON92 measurements for (A) vapor dispersion angle and (B) liquid length at ρa = 22.3 kg/m3 using different numbers of test repeats.
2.5 Test Conditions
Table 3 summarizes the test conditions explored in this study. Spray characteristics were not determined across every single condition or fuel. However, measurements at a charge gas temperature of 900 K, density of 23 kg/m3, and injection pressure of 1,500 bar were conducted across all operating conditions, fuels, and optical methods. This was done to provide consistency with ECN Spray-D data which shares a similar hardware configuration and has also been extensively studied (Engine Combustion Network (ECN), 2022c; Yasutomi et al., 2019). The high charge gas densities and temperatures correspond to in-cylinder environments for boosted, high compression ratio diesel engines. These conditions are also relevant to medium-high load GCI which leverages a mixing-controlled combustion strategy for managing soot emissions and heat release rate (Zhang et al., 2017b). The lower temperatures are relevant to low-medium load GCI which leverages a partially premixed compression ignition (PPCI) combustion strategy to simultaneously control NOx and soot (Cho et al., 2018).

TABLE 3. Experimental test conditions.
3 Results and Discussion
3.1 Non-Vaporizing Sprays
3.1.1 Dispersion Angle
Figure 11 shows the dispersion angles (θ) at different injection pressures and charge densities using the 60% penetration criterion. The angles increase with a higher charge gas density because of larger air mass entrainment into the spray. Results from Figure 11 also indicate that gasoline-like fuels exhibit similar or greater dispersion compared to ULSD. Although the physical properties for both gasolines are very similar, RON92 has an appreciably larger angle than RON60. Based on previous work, the non-vaporizing dispersion angle is expected to correlate as follows (Naber and Siebers, 1996; Tang et al., 2017a):
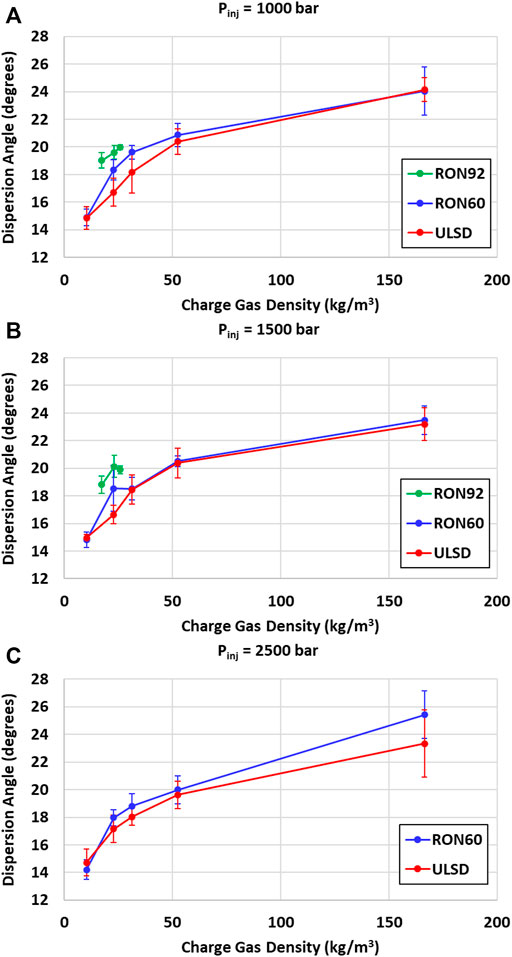
FIGURE 11. Non-vaporizing dispersion angle vs. charge gas density using 60% penetration criterion at (A) Pinj = 1,000 bar, (B) Pinj = 1,500 bar, and (C) Pinj = 2,500 bar.
Given that constants A and B are typically fixed for a given injector design, and
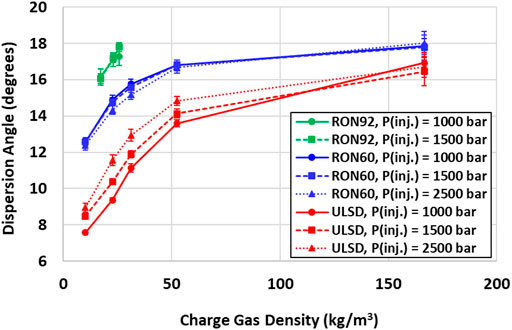
FIGURE 12. Non-vaporizing dispersion angle vs. charge gas density using 45do criterion.
One possible explanation for the discrepancy could be related to injector hardware. The measurements for ULSD and RON60 were performed with one injector, while the experiments for RON92 were conducted with another. Although the nozzle geometry targets were the same for both, there is always some level of manufacturing tolerance that could lead to variation in the rate of injection and subsequent spray behavior. To investigate this further, the dispersion angles for each fuel were separately correlated using Eq. 1 and plotted in Figure 13. The RON92 results fall on a different fit line which indicates distinctive injector behavior. This is also clearly shown in Table 4 which summarizes the fit line coefficients for each fuel. ULSD and RON60 have very similar coefficients, while the B-coefficient for RON92 is distinctly different.
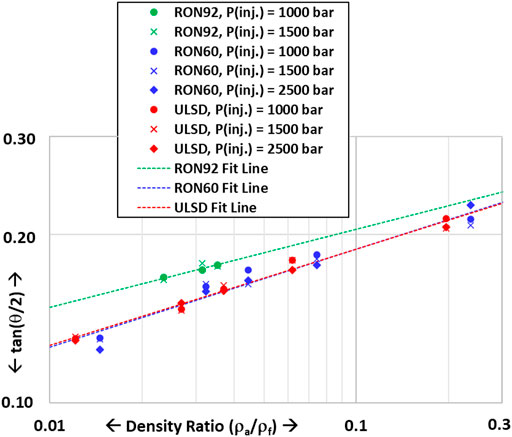
FIGURE 13. Tangent of non-vaporizing dispersion half-angle vs. density ratio.
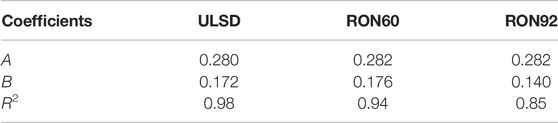
TABLE 4. Fit coefficients and R2 values for non-vaporizing dispersion angle correlation in Eq. 1 and Figure 13.
Finally, Figure 14 shows that injection pressure does not have a significant impact on the spray dispersion angle for all fuels. This further validates that density ratio (ρa/ρf) is the main parameter describing non-vaporizing dispersion for high-pressure sprays. However, there may be some more complex, secondary fuel effects that are not completely captured by the simple correlation in Eq. 1. Evidence for this is provided by the difference in data spread observed for ULSD versus RON60 and RON92 across different injection pressures using the 45do criterion (see Figure 12) (Tang et al., 2018).
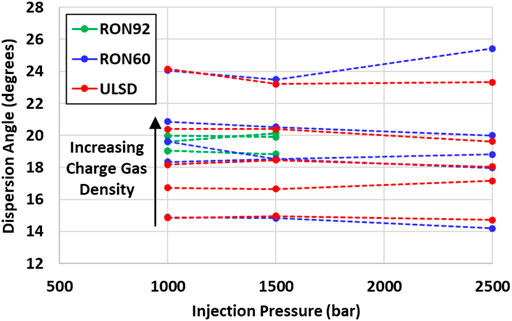
FIGURE 14. Non-vaporizing dispersion angle vs. injection pressure at different charge gas densities.
3.1.2 Penetration
Figure 15 compares the non-vaporizing spray penetration among fuels at a charge gas density of 23 kg/m3. Below an injection pressure of 2,500 bar, both gasoline-like fuels show a slower penetration rate than ULSD. This is an expected result given their dispersion angles are larger than diesel. Eq. 2 was developed in prior work to describe the penetration (S) of high-pressure, single-hole diesel sprays and can be used to explain this behavior (Naber and Siebers, 1996):
Cv and Ca are the velocity and area coefficients of the orifice, respectively, and are related to the discharge coefficient (i.e.,
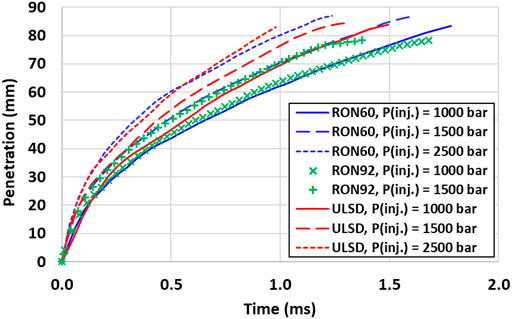
FIGURE 15. Fuel effect on non-vaporizing penetration at a charge gas density of 23 kg/m.3.
Another result from Figure 15 is that RON60 and RON92 exhibit very similar penetration rates. This seemingly conforms to the original hypothesis that both gasolines should have similar non-reacting spray characteristics due to their similar physical properties. However, this is not an expected outcome given the difference observed in their dispersion angles (see Figures 11, 12). Based on Eq. 2, RON92 is expected to have a slower penetration rate compared to RON60 at a given operating condition. As previously discussed, this inconsistency could be due to the use of a different injector build for RON92 experiments.
Equation 2 also indicates that spray penetration rate should increase with higher injection pressure. This is due to the higher initial velocity that gets imparted to the liquid fuel at the nozzle exit via Bernoulli’s principle. Figure 16 confirms that this is indeed the case for RON92 gasoline, while previous work also observed the expected trend for RON60 and ULSD using the same injector configuration (Tang et al., 2017a).
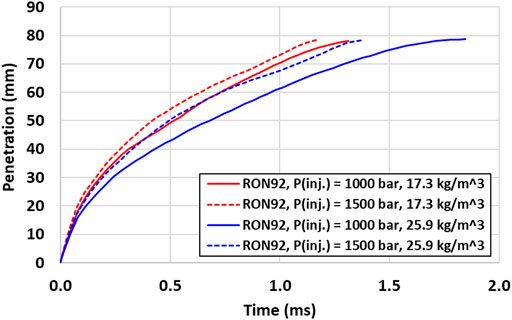
FIGURE 16. Injection pressure effect on non-vaporizing penetration for RON92 gasoline.
Figure 17 shows the impact of charge gas density on non-vaporizing spray penetration at an injection pressure of 1,500 bar. As predicted by Eq. 2, a higher charge gas density (ρa) should result in a slower penetration rate. This is due to larger rates of air mass entrainment with higher charge density. The results in Figure 17 are consistent across all fuels and highlight the slower penetration of RON60 compared to ULSD due to dispersion angle effects. Although the RON92 data is self-consistent (i.e., conditions with higher charge density penetrate more slowly), there is an unexpected ordering of curves against RON60 and ULSD results due to a combination of dispersion angle effects and potentially, injector hardware effects (see previous section).
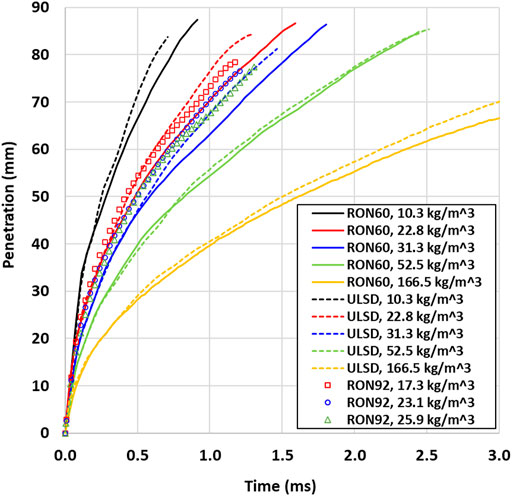
FIGURE 17. Charge gas density effect on non-vaporizing penetration at an injection pressure of 1,500 bar.
The spray penetration can be normalized to a non-dimensional form using the following transformations based on Eq. 2 (Naber and Siebers, 1996):
When the actual penetration (x) and time (t) are normalized against their respective length and time scales (x+, t+), the data across different operating conditions, fuel types, and nozzle geometries should all collapse onto a single curve. The scaling calculations in Eqs 3, 4 were performed using specifications from Table 2, estimating the Cv based on its relationship to discharge coefficient (
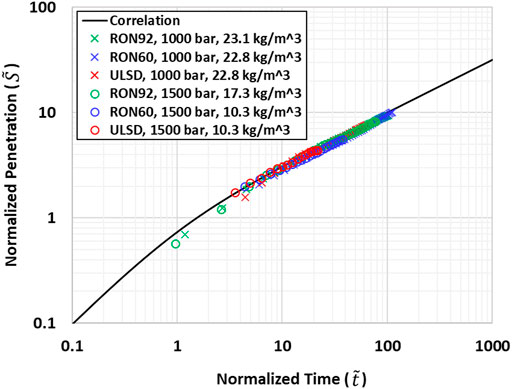
FIGURE 18. Normalized spray penetration curves for non-vaporizing data set.
3.2 Vaporizing Sprays
3.2.1 Dispersion Angle
Figure 19 shows a scatter plot of dispersion angle versus charge gas density under vaporizing conditions. Angles were determined using the 60% penetration criterion and only represent dispersion of the fuel vapor envelope, not the liquid portion of the spray. As predicted by Eq. 2, the angle generally increases with charge density due to a greater rate of air mass entrainment into the spray. Interestingly however, there does not seem to be any discernable trend with respect to fuel type.
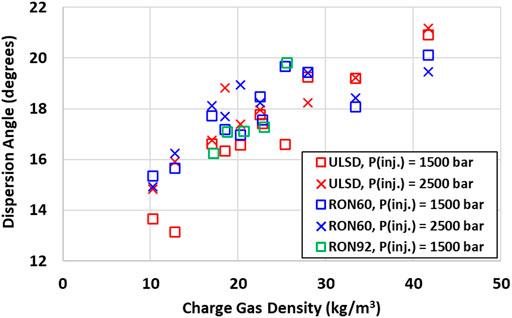
FIGURE 19. Vaporizing spray dispersion angle vs. charge gas density at different injection pressures.
To investigate this further, Figure 20 shows the unique power-law fit for each fuel’s dispersion angle according to Eq. 2. The RON60 and ULSD data were acquired on the same injector, so differences between the two correlations are most likely the result of evaporation effects caused by their vastly different volatility. Based on the original hypothesis of RON92 and RON60 gasoline having similar non-reacting spray characteristics, it is expected they would share similar vaporizing dispersion angles. Although the power law fit for RON92 does not support this claim, additional data at density ratios beyond 0.02 and 0.04 would be needed to make a fair comparison with the other fuels.
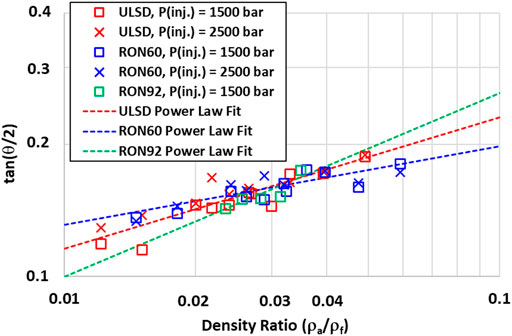
FIGURE 20. Tangent of vaporizing dispersion half-angle vs. density ratio.
Table 5 summarizes the power law coefficients for the half-angle correlation in Eq. 2. Much more variation is observed across fuels with a generally lower R2 value compared to the non-vaporizing data in Table 4. Since these angle measurements were based on the fuel vapor envelope, the correlation between dispersion angle and liquid fuel density may not likely be as strong under these conditions.
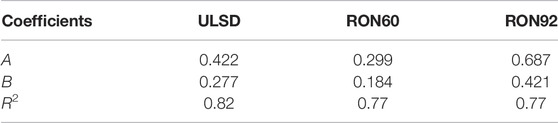
TABLE 5. Fit coefficients and R2 values for vaporizing dispersion angle correlation in Eq. 1 and Figure 20.
The vapor dispersion angle for all three fuels is plotted against charge temperature in Figure 21. Unlike the other results reported in this section, this data was collected with the same nozzle and thus free from any potential injector build impacts on RON92 dispersion angle. As previously observed in Figure 19, there is no statistically significant trend with respect to fuel type for RON60 and ULSD. Within the uncertainty of measurements, the dispersion angle also remains relatively flat with respect to charge temperature. However, RON92 exhibits a larger angle than the other two fuels below 1100 K. Scaling of the dispersion angle also does not follow the order expected due to liquid density (see Table 1 and Eq. 1). These results indicate that a more complex physical model including volatility parameters may be needed to better describe vapor dispersion. For example, RON92 is more volatile than RON60 for 60% of the distillation curve and has a higher RVP (see Table 1 and Figure 2). These differences may have an influence on vapor dispersion angle, especially at the lower end of charge gas temperatures.
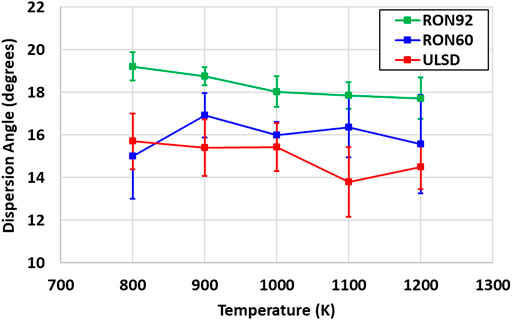
FIGURE 21. Vaporizing dispersion angle vs. charge gas temperature at ρa = 23 kg/m3 and Pinj = 1,500 bar.
3.2.2 Vapor Penetration
Figure 22 shows a plot of vapor penetration for all three fuels over a charge gas temperature range of 800–1200 K. Results indicate that there is no discernable trend with respect to fuel type. This was also observed in previous work which showed a maximum difference of only 5% between the vapor penetration curves of RON60 gasoline and ULSD (Zhang et al., 2017a). Since all the data in Figure 22 was obtained using the same nozzle, there were no potential injector build effects on the RON92 measurements. Hence, it can be confidently said that RON92 exhibits a similar vapor penetration to the other two fuels. The absence of any significant trend with respect to charge gas temperature is consistent with the relatively flat dispersion angles observed over 800–1200 K in Figure 21. However, the differences between RON92 and the other fuels below 1100 K does not seem to impact the penetration. As discussed previously, this may be due to more complex volatility effects that influence the evaporating spray beyond those accounted for in Eqs 1, 2. To better understand these nuanced effects, mixing field measurements using planar laser induced fluorescence (PLIF) or laser induced exciplex fluorescence (LIEF) are planned as part of future work (Parrish and Zink, 2012; Fansler and Parrish, 2014; Chen et al., 2019; Feng et al., 2021).
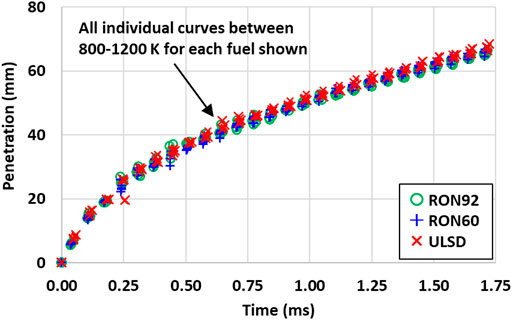
FIGURE 22. Vapor penetration across Ta = 800–1200 K at ρa = 23 kg/m3 and Pinj = 1,500 bar.
3.2.3 Liquid Length
Under vaporizing conditions, the liquid penetration of the spray reaches a quasi-steady-state length. This occurs at a location downstream of the nozzle orifice where the mass flow rate of fuel exactly matches the evaporation rate (Siebers, 1998; Siebers, 1999). Figure 23 plots the liquid length versus charge temperature at different charge gas densities. For ULSD, the liquid length decreases with increasing charge pressure due to higher gas density and rates of hot air entrainment (i.e., enthalpy) into the spray. This supports higher evaporation rates and shortens penetration. Intuitively, the liquid length of diesel also decreases with charge gas temperature because there is more enthalpy available for evaporation.
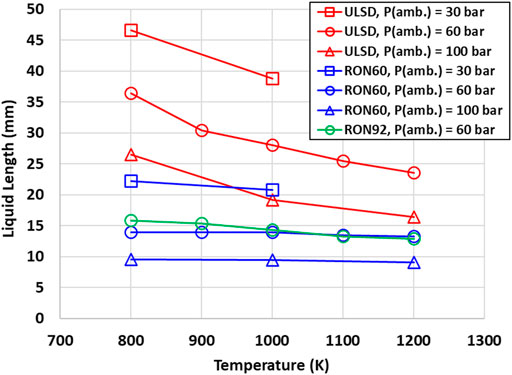
FIGURE 23. Quasi-steady-state liquid length vs. charge gas temperature at Pinj = 1,500 bar and different charge gas pressures.
As observed in previous work however, RON60 exhibits a strikingly flat liquid length characteristic versus charge temperature (Zhang et al., 2017a). RON92 behaves similarly and seems to validate the original hypothesis regarding similarity of non-reacting spray characteristics among gasoline-like fuels. The results reported in Figure 24 at a constant charge gas density were taken with the same injector and further substantiate the gasoline similarity hypothesis due to the alignment between RON60 and RON92.
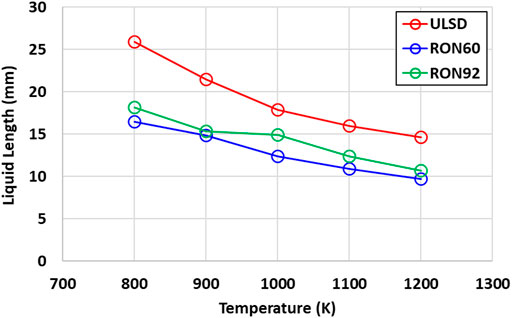
FIGURE 24. Quasi-steady-state liquid length vs. charge gas temperature at ρa = 23 kg/m3 and Pinj = 1,500 bar.
To explain why gasoline exhibits a relatively flat penetration curve compared to diesel, the liquid lengths were normalized according to Eq. 3 through Eq. 5 and plotted in Figure 25. The normalized penetrations of RON92 and RON60 fall much closer to the transition regime defined by a normalized time of
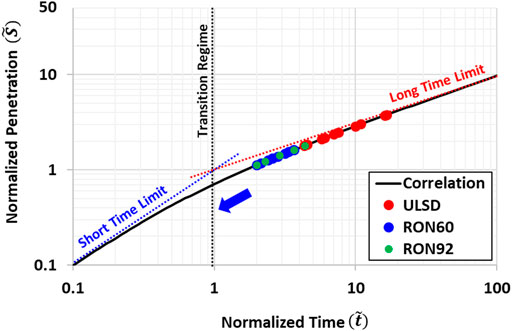
FIGURE 25. Normalized liquid penetration data under vaporizing conditions.
Conversely, Figure 25 shows that ULSD liquid lengths are better described by the longer timescales of the correlation. Interphase transport processes are relatively fast compared to the mixing and air entrainment rates that ultimately limit fuel evaporation in this regime. Under these conditions, the available charge gas enthalpy and entrainment rate of air into the spray directly impact the evaporation rate of fuel. Thus, it is expected that diesel liquid length would be more strongly governed by spray momentum and charge gas properties like density and temperature.
The much lower liquid length exhibited by gasoline-like fuels compared to diesel is of practical significance and can be used to optimize combustion system designs for GCI. In previous work for heavy-duty engine applications, this behavior was leveraged to develop a unique, low-NOx combustion system (Zhang et al., 2019). Using simulation-led design tools, a wide and shallow piston shape was combined with low swirl ratio and a 14-hole injector to produce significantly lower in-cylinder heat transfer losses compared to a conventional geometry-guided (i.e., step-lip), mixing shape, especially at low to medium engine loads. The improved fuel efficiency for this design was determined to be the result of increased air utilization (i.e., faster burning rate) and reduced spray flame interaction with the internal heat transfer surfaces of the combustion chamber.
4 Conclusion
The non-reacting spray characteristics of RON60 and RON92 gasoline were studied and compared to ULSD. Experiments were performed in an optically accessible, constant-volume combustion chamber using a single-hole injector representative of heavy-duty common rail fuel systems. The intent of this work was to elucidate the physics of light distillate fuel sprays needed to enable high injection pressure GCI applications for heavy-duty engines. The hypothesis that gasoline-like fuels should exhibit similar non-reacting spray behavior due to their similar physical properties was tested. The major findings are summarized as follows:
• Gasoline-like fuels exhibited a similar or larger non-vaporizing dispersion angle compared to ULSD. All angles closely follow a correlation depending on the air-to-fuel density ratio (i.e.,
• Gasoline-like fuels exhibited slower non-vaporizing penetration rates compared to ULSD due to their larger dispersion angles. All fuels followed the expected trends of decreased penetration rates for increasing charge gas density and decreasing injection pressure. RON92 showed a similar penetration rate to RON60 despite their appreciable difference in dispersion angle. Once again, this was likely due to injector build impacts rather than lack of conformance to the physical theory governing non-vaporizing sprays. Further evidence for this was given by the collapse of all fuel data onto a non-dimensional penetration correlation over a wide range of test conditions.
• The vaporizing dispersion angle had no significant trend with respect to fuel which generally increased along with charge density. Each fuel exhibited a distinctive fit to the standard air-fuel density ratio correlation, likely because of evaporation effects. The lack of similarity between RON92 and RON60 may be due to nuanced differences in their volatility characteristics (i.e., vapor pressures and distillation curves). RON60 and ULSD did not have any statistically significant difference in their relatively constant angles between charge temperatures of 800–1200 K, whereas RON92 had a slightly larger, increasing angle below 1100 K.
• There were no discernable differences in vapor penetration across fuel type or the entire charge gas temperature range of 800–1200 K. This result correlates well with prior work and the relatively flat dispersion angles measured across charge temperature for each fuel.
• Gasoline-like fuels exhibit a much shorter liquid length compared to diesel under vaporizing conditions. At constant charge pressure, the liquid lengths of RON92 and RON60 were similar and independent of charge temperature, which was not the case for ULSD. This behavior was attributed to gasoline-like fuels being interphase transport limited in their evaporation process as opposed to mixing or air entrainment limited. The shorter, less temperature sensitive liquid length of gasoline-like fuels can be leveraged to design unique combustion systems (i.e., injector configurations and piston bowl shapes) that are optimized for GCI.
Data Availability Statement
The datasets presented in this article are not readily available because approval from all author affiliations is needed on a case-by-case basis before access can be granted. Requests to access the datasets should be directed to jnaber@mtu.edu.
Author Contributions
TT coordinated the study, provided the fuels, analyzed the data, and wrote the manuscript; JJ performed all the image post-processing; HS and WA performed all of the experiments; JN supervised the experiments, image processing, and final data analysis.
Conflict of Interest
Author TT was employed by the company Aramco Americas.
The remaining authors declare that the research was conducted in the absence of any commercial or financial relationships that could be construed as a potential conflict of interest.
Publisher’s Note
All claims expressed in this article are solely those of the authors and do not necessarily represent those of their affiliated organizations, or those of the publisher, the editors and the reviewers. Any product that may be evaluated in this article, or claim that may be made by its manufacturer, is not guaranteed or endorsed by the publisher.
References
Aleme, H. G., Assunção, R. A., Carvalho, M. M. O., and Barbeira, P. J. S. (2012). Determination of Specific Gravity and Kinematic Viscosity of Diesel Using Distillation Curves and Multivariate Calibration. Fuel Process. Technol. 102, 90–95. doi:10.1016/j.fuproc.2012.04.016
Arkoudeas, P., Karonis, D., Zannikos, F., and Lois, E. (2014). Lubricity Assessment of Gasoline Fuels. Fuel Process. Technol. 122, 107–119. doi:10.1016/j.fuproc.2014.01.008
Chen, B., Feng, L., Wang, Y., Ma, T., Liu, H., Geng, C., et al. (2019). Spray and Flame Characteristics of Wall-Impinging Diesel Fuel Spray at Different Wall Temperatures and Ambient Pressures in a Constant Volume Combustion Vessel. Fuel 235, 416–425. doi:10.1016/j.fuel.2018.07.154
Cho, K., Zhang, Y., and Cleary, D. (2018). Investigation of Fuel Effects on Combustion Characteristics of Partially Premixed Compression Ignition (PPCI) Combustion Mode at Part-Load Operations. SAE Int. J. Engines 11 (6), 1371–1383. doi:10.4271/2018-01-0897
Engine Combustion Network (Ecn) (2022). Diesel Spray Combustion. Available at: https://ecn.sandia.gov/diesel-spray-combustion/(Accessed Jan, , 2022).
Engine Combustion Network (Ecn) (2022). ECN7 Proceedings – Fuel Effect on Compression Ignition. Available at: https://ecn.sandia.gov/workshop/ECN7/ecn7_fuel_effect.pptx (Accessed Jan, 2022).
Engine Combustion Network (Ecn) (2022). Spray D Nozzle Geometry. Available at: https://ecn.sandia.gov/diesel-spray-combustion/target-condition/spray-d-nozzle-geometry/(Accessed Jan, 2022).
ExxonMobil (2021). 2021 Outlook for Energy. Available at: https://corporate.exxonmobil.com/Energy-and-innovation/outlook-for-energy (Accessed Jan, 2022).
Fansler, T. D., and Parrish, S. E. (2014). Spray Measurement Technology: A Review. Meas. Sci. Technol. 26 (1), 012002. doi:10.1088/0957-0233/26/1/012002
Feng, L., Sun, X., Pan, X., Yi, W., Cui, Y., Wang, Y., et al. (2021). Gasoline spray Characteristics Using a High Pressure Common Rail Diesel Injection System by the Method of Laser Induced Exciplex Fluorescence. Fuel 302, 1211742021. doi:10.1016/j.fuel.2021.121174
Feng, Z., Zhan, C., Tang, C., Yang, K., and Huang, Z. (2016). Experimental Investigation on Spray and Atomization Characteristics of Diesel/Gasoline/Ethanol Blends in High Pressure Common Rail Injection System. Energy 112, 549–561. doi:10.1016/j.energy.2016.06.131
Han, D., Wang, C., Duan, Y., Tian, Z., and Huang, Z. (2014). An Experimental Study of Injection and Spray Characteristics of Diesel and Gasoline Blends on a Common Rail Injection System. Energy 75, 513–519. doi:10.1016/j.energy.2014.08.006
International Energy Agency (2021). World Energy Outlook 2021. Available at: https://www.iea.org/reports/world-energy-outlook-2021 (Accessed Jan, 2022).
Johnson, S., Nesbitt, J., Lee, S-Y., and Naber, J. D. (2009). Premixed Combustion of Acetylene-Hydrogen Fuel Mixtures for Thermodynamic State Generation in a Constant Volume Combustion Vessel, J. KONES 16 (2), 199–208. 2354-0133.
Kumar, P., Pei, Y., Traver, M., and Watson, J. (2019). System Level 1-D Analysis of an Air-System for a Heavy-Duty Gasoline Compression Ignition Engine. SAE Tech. Paper 2019-01-0240. doi:10.4271/2019-01-0240
Lacey, P. I., and Mason, R. L. (2000). Fuel Lubricity: Statistical Analysis of Literature Data. SAE Tech. Paper 2000-01-1917. doi:10.4271/2000-01-1917
Lee, J., Tzanetakis, T., Zhang, Y., Traver, M., Lewis, S., Moses-DeBusk, M., et al. (2019). Characterization of Particulate Matter Emissions from Heavy-Duty Partially Premixed Compression Ignition with Gasoline-Range Fuels. SAE Tech. Paper 2019-01-1185. doi:10.4271/2019-01-1185
Lee, J., Zhang, Y., Tzanetakis, T., Traver, M., Moses-DeBusk, M., Storey, J., et al. (2017). Emission Performance of Low Cetane Naphtha as Drop-In Fuel on a Multi-Cylinder Heavy-Duty Diesel Engine and Aftertreatment System. SAE Tech. Paper 2017-01-1000. doi:10.4271/2017-01-1000
Naber, J., and Siebers, D. L. (1996). Effects of Gas Density and Vaporization on Penetration and Dispersion of Diesel Sprays. SAE Tech. Paper 960034. doi:10.4271/960034
Otsu, N. (1979). A Threshold Selection Method from Gray-Level Histograms. IEEE Trans. Syst. Man. Cybern. 9 (1), 62–66. doi:10.1109/TSMC.1979.4310076
Parrish, S. E., and Zink, R. J. (2012). Development and Application of a High-Speed Planar Laser-Induced Fluorescence Imaging System to Evaluate Liquid and Vapor Phases of Sprays from a Multi-Hole Diesel Fuel Injector. Meas. Sci. Technol. 24 (2), 025402. doi:10.1088/0957-0233/24/2/025402
Payri, R., García, A., Domenech, V., Durrett, R., and Plazas, A. H. (2012). An Experimental Study of Gasoline Effects on Injection Rate, Momentum Flux and Spray Characteristics Using a Common Rail Diesel Injection System. Fuel 97, 390–399. doi:10.1016/j.fuel.2011.11.065
Payri, R., Garcia, A., Domenech, V., Durrett, R., and Plazas Torres, A. (2012). Hydraulic Behavior and Spray Characteristics of a Common Rail Diesel Injection System Using Gasoline Fuel. SAE Tech. Paper 2012-01-0458. doi:10.4271/2012-01-0458
Pei, Y., Pal, P., Zhang, Y., Traver, M., Cleary, D., Futterer, C., et al. (2019). CFD-guided Combustion System Optimization of a Gasoline Range Fuel in a Heavy-Duty Compression Ignition Engine Using Automatic Piston Geometry Generation and a Supercomputer. SAE Int. J. Adv. Curr. Prac. Mobility 1 (1), 166–179. doi:10.4271/2019-01-0001
Pickett, L. M., Siebers, D. L., and Idicheria, C. A. (2005). Relationship between Ignition Processes and the Lift-Off Length of Diesel Fuel Jets. SAE Tech. Paper 2005-01-3843. doi:10.4271/2005-01-3843
Sellnau, M., Foster, M., Moore, W., Sinnamon, J., Hoyer, K., Klemm, W., et al. (2019). Pathway to 50% Brake Thermal Efficiency Using Gasoline Direct Injection Compression Ignition. SAE Int. J. Adv. Curr. Prac. Mobility 1 (4), 1581–1603. doi:10.4271/2019-01-1154
Sharp, C., Neely, G., Zavala, B., and Rao, S. (2021). CARB Low NOX Stage 3 Program - Final Results and Summary. SAE Int. J. Adv. Curr. Prac. Mobility 3 (4), 1508–1525. doi:10.4271/2021-01-0589
Siebers, D. L. (1998). Liquid-Phase Fuel Penetration in Diesel Sprays. SAE Tech. Paper 980809. doi:10.4271/980809
Siebers, D. L. (1999). Scaling Liquid-phase Fuel Penetration in Diesel Sprays Based on Mixing-Limited Vaporization. SAE Tech. Paper 1999-01-0528. doi:10.4271/1999-01-0528
Tang, M., Pei, Y., Zhang, Y., Tzanetakis, T., Traver, M., Cleary, D., et al. (2018). Development of a Transient Spray Cone Angle Correlation for CFD Simulations at Diesel Engine Conditions. SAE Tech. Paper 2018-01-0304. doi:10.4271/2018-01-0304
Tang, M., Zhang, J., Menucci, T., Schmidt, H., Lee, S.-Y., Naber, J., et al. (2017a). “Experimental Investigation of Spray Characteristics of High Reactivity Gasoline and Diesel Fuel Using a Heavy-Duty Single-Hole Injector, Part I: Non-reacting, Non-vaporizing Sprays,” in Proceedings of the 29th Annual Conference on Liquid Atomization and Spray Systems (ILASS-Americas), Atlanta, GA, USA, May 15-18, 2017.
Tang, M., Zhang, J., Menucci, T., Schmidt, H., Naber, J., Lee, S.-Y., et al. (2017b). “Experimental Spray Ignition and Soot Forming Characteristics of High Reactivity Gasoline and Diesel Fuel in a Heavy-Duty Single-Hole Injector,” in Proceedings of the 10th U. S. National Combustion Meeting Organized by the Eastern States Section of the Combustion Institute, College Park, MD, USA, April 23-26, 2017.
Torelli, R., Matusik, K. E., Nelli, K. C., Kastengren, A. L., Fezzaa, K., Powell, C. F., et al. (2018). Evaluation of Shot-To-Shot In-Nozzle Flow Variations in a Heavy-Duty Diesel Injector Using Real Nozzle Geometry. SAE Int. J. Fuels Lubr. 11 (4), 379–295. doi:10.4271/2018-01-0303
Torelli, R., Pei, Y., Zhang, Y., and Traver, M. (2021). Effect of Fuel Temperature on the Performance of a Heavy-Duty Diesel Injector Operating with Gasoline. SAE Tech. Paper 2021-01-0547. doi:10.4271/2021-01-0547
Tzanetakis, T., Voice, A. K., and Traver, M. (2021). Accurately Simulating the Performance of Gasoline-like Fuels in 1-D Hydraulic Injection System Models Operating at High Pressures. SAE Tech. Paper 2021-01-0389. doi:10.4271/2021-01-0389
U.S. Energy Information Administration (2021). Annual Energy Outlook 2021. Available at: https://www.eia.gov/outlooks/aeo/(Accessed Jan, 2022).
Voice, A. K., Tzanetakis, T., and Traver, M. (2017). Lubricity of Light-End Fuels with Commercial Diesel Lubricity Additives. SAE Tech. Paper 2017-01-0871. doi:10.4271/2017-01-0871
Yasutomi, K., Hwang, J., Manin, J., and Pickett, L. (2019). Diesel Injector Elasticity Effects on Internal Nozzle Flow. SAE Tech. Paper 2019-01-2279. doi:10.4271/2019-01-2279
Zhang, J., Tang, M., Atkinson, W., Schmidt, H., Lee, S.-Y., Naber, J., et al. (2020). Experimental Investigation of the Compression Ignition Process of High Reactivity Gasoline Fuels and E10 Certification Gasoline Using a High-Pressure Direct Injection Gasoline Injector. SAE Tech. Paper 2020-01-0323. doi:10.4271/2020-01-0323
Zhang, J., Tang, M., Menucci, T., Schmidt, H., Naber, J., Lee, S.-Y., et al. (2017a). “Experimental Investigation of Spray Characteristics of High Reactivity Gasoline and Diesel Fuel Using a Heavy-Duty Single-Hole Injector, Part II: Non-reacting, Vaporizing Sprays,” in Proceedings of the 29th Annual Conference on Liquid Atomization and Spray Systems (ILASS-Americas), Atlanta, GA, USA, May 15-18, 2017.
Zhang, Y., Kumar, P., Pei, Y., Traver, M., and Cleary, D. (2018). An Experimental and Computational Investigation of Gasoline Compression Ignition Using Conventional and Higher Reactivity Gasolines in a Multi-Cylinder Heavy-Duty Diesel Engine. SAE Tech. Paper 2018-01-0226. doi:10.4271/2018-01-0226
Zhang, Y., Kumar, P., Traver, M., and Cleary, D. (2016). Conventional and Low Temperature Combustion Using Naphtha Fuels in a Multi-Cylinder Heavy-Duty Diesel Engine. SAE Int. J. Engines 9 (2), 1021–1035. doi:10.4271/2016-01-0764
Zhang, Y., Pei, Y., Tang, M., and Traver, M. (2019). “A Computational Investigation of Piston Bowl Geometry and Injector Spray Pattern Effects on Gasoline Compression Ignition in a Heavy-Duty Diesel Engine,” in Proceedings of the ASME 2019 Internal Combustion Engine Division Fall Technical Conference, ASME 2019 Internal Combustion Engine Division Fall Technical Conference, Chicago, IL, USA, October 20-23, 2019. V001T03A004, ASME. doi:10.1115/ICEF2019-7155
Zhang, Y., Sommers, S., Pei, Y., and Kumar, P. (2017). Mixing-Controlled Combustion of Conventional and Higher Reactivity Gasolines in a Multi-Cylinder Heavy-Duty Compression Ignition Engine. SAE Tech. Paper 2017-01-0696. doi:10.4271/2017-01-0696
Glossary
A, a Equation constants
ASOI After start of injection
ASTM American Society for Testing and Materials
B, b Equation constants
BEOI Before end of injection
Ca Area coefficient
Cd Discharge coefficient
Cv Velocity coefficient
CN Cetane number
DCN Derived cetane number
ECN Engine Combustion Network
FPS Frames per second
GCI Gasoline compression ignition
IBP Initial boiling point
LED Light emitting diode
LIEF Laser induced exciplex fluorescence
LHV Lower heating value
MON Motor octane number
NOx Oxides of nitrogen (NO, NO2)
Pa Charge gas pressure
Pinj Injection pressure
PLIF Planar laser induced fluorescence
PPCI Partially premixed compression ignition
QSS Quasi-steady-state
RON Research octane number
RVP Reid vapor pressure
S Spray penetration
SOI Start of injection
Ta Charge gas temperature
t Time
t+ Penetration time scale
tshift Time shift applied to penetration data
ULSD Ultra-low-sulfur diesel
WSD Wear scar diameter
x, y Axial spray penetration
x+ Penetration length scale
θ Dispersion angle
Keywords: gasoline, high pressure, common rail (CR), fuel injection, sprays, non-reacting
Citation: Tzanetakis T, Johnson J, Schmidt H, Atkinson W and Naber J (2022) Non-Reacting Spray Characteristics of Gasoline and Diesel With a Heavy-Duty Single-Hole Injector. Front. Mech. Eng 8:887657. doi: 10.3389/fmech.2022.887657
Received: 01 March 2022; Accepted: 28 March 2022;
Published: 19 May 2022.
Edited by:
Cinzia Tornatore, CNR—Istituto di Scienze e Tecnologie per l’Energia e la Mobilità Sostenibili (STEMS), ItalyReviewed by:
Isaac Ekoto, Sandia National Laboratories (SNL), United StatesHaifeng Liu, Tianjin University, China
Copyright © 2022 Tzanetakis, Johnson, Schmidt, Atkinson and Naber. This is an open-access article distributed under the terms of the Creative Commons Attribution License (CC BY). The use, distribution or reproduction in other forums is permitted, provided the original author(s) and the copyright owner(s) are credited and that the original publication in this journal is cited, in accordance with accepted academic practice. No use, distribution or reproduction is permitted which does not comply with these terms.
*Correspondence: Tom Tzanetakis, dG9tLnR6YW5ldGFraXNAYXJhbWNvYW1lcmljYXMuY29t