 Akhil Ailaboina
 Kaushik Saha*
- Engines and Unconventional Fuels Laboratory, Department of Energy Science and Engineering, Indian Institute of Technology Delhi, New Delhi, India
A numerical study has been carried out to understand the effects of Unsteady Reynolds Averaged Navier-Stokes (standard k ― ε and RNG k ― ε model) and large eddy simulations (LES) on a multi-hole gasoline direct injection (GDI) system. The fuel injector considered in this study is the Spray G nozzle from the Engine Combustion Network (ECN). A blob injection model, based on empirical rate of injection (ROI) profile, is considered in this study. The latest data on spray penetrations from Engine Combustion Network is used for model validation along with experimental findings on suction velocity and local droplet diameter. The spray breakup is simulated by using the KH-RT breakup length model. The turbulence model constant
Introduction
Emission regulations have become more stringent over the past decade, especially for internal combustion engines (ICE). To comply with the emission norms and to improve engine efficiency, studies aiming at better air-fuel mixing and better combustion quality are highly warranted. Liquid fuels are still preferred due to their ease of storage and higher energy content on a per unit volume basis. One of the important processes for an ICE running on liquid fuel that determines the combustion and the formation of pollutants is the preparation of the air-fuel mixture governed by fuel injection. There are two main strategies for fuel injection in a spark ignited (SI) internal combustion engine (ICE). The most developed strategy is conventional port fuel injection (PFI), in which the fuel is injected into the intake port. The other relatively modern strategy is gasoline direct injection (GDI), which injects the fuel directly into the combustion chamber. The GDI system is a promising technology that increases the engine’s overall volumetric efficiency, compression ratio when compared to conventional PFI engine systems (Zhao et al., 1999; American Petroleum Institute, 2013; National Research Council, 2015). The automotive industry started working on this GDI technology in the early 1980s (Harada et al., 1997; Takagi et al., 1998). For the past 2 decades the impetus for research on the GDI technology has escalated across the globe to meet the stringent emission norms (Duronio et al., 2020a; Duronio et al., 2020c).
The quality of the air-fuel mixture for combustion depends on the fuel injection timing or the mode of engine operation. An ICE typically runs either at full load or part load conditions. An ICE engine can run in homogeneous charge mode under full load conditions and in stratified charge mode when running under part load conditions. For a GDI engine, during a full load condition, the fuel will be injected at the start of the suction stroke, and in part load conditions, the fuel will be injected during the start of the compression stroke, where the intake valve is closed. Whereas, for a PFI engine, the amount of fuel has to be injected during the suction stroke itself, and it is controlled by a throttle depending on the load. In a PFI system, as the fuel is injected into the back of the intake port, there is a higher probability of fuel film formation in the intake valve area of the port (Zhao et al., 1999). This results in a delay of fuel delivery into the combustion chamber during a cold start condition, and also the engine may experience a misfire or partial burn during the initial cranking period, as a result of which the unburnt hydrocarbon emission will increase. This problem is completely avoided when the fuel is injected directly into a combustion chamber, as in the case of a GDI system. One of the main advantages of a GDI system over a PFI system is the charge-cooling effect. In a GDI system, as the fuel is injected directly into the combustion chamber, the fuel spray will absorb the heat from the surrounding gas, reducing the chamber temperature, which allows more air intake and thus increases the volumetric efficiency and reduces the chance of knocking. However, the PFI system has an advantage over the GDI system in regard to the amount of time available for the preparation of charge. The effect of not having enough time for charge preparation in a GDI engine can be negated with fuel injecting at higher pressures, leading to better atomization. ICE cranks at a speed of several thousands of rotations per minute. The fuel is injected into the GDI engine for a shorter duration, on the scale of milliseconds, and with fewer crank angle degree rotations. Consequently, the time scale for the entire process of injecting the fuel and mixing it with the air to form a properly combustible mixture is very small (Zhao et al., 1999). As the mixture preparation is the primary reason behind the combustion quality and extent of fuel utilization, it is crucial to study the spray characteristics in a GDI engine environment.
The fuel injected from the nozzle hole into the combustion chamber will undergo disturbances created by the aerodynamic forces. The shear between the plume and the surrounding chamber-gas in the vicinity of the nozzle exit will break the liquid jet into ligaments, which then undergo further breakup at downstream locations to form small droplets, resulting in the formation of fuel spray (Fundamentals of Mixture Formation in Engines, 2006). Recent technological advancements have enabled the modern GDI engines to handle injection pressures of up to 70 MPa (Montanaro et al., 2019), despite the fact that injection pressures are still typically in the range of 20–30 MPa. This means, GDI injection pressure is almost an order of magnitude lower than that of diesel injection systems (Saha et al., 2019). To have a homogenous air-fuel mixture, the fuel is mostly injected during the suction stroke, where the piston is moving from top-dead center (TDC) towards the bottom-dead center (BDC), unlike in the case of a diesel engine where the fuel is injected at the near-TDC positions during the compression stroke. GDI injectors have a shorter length-to-diameter ratio (L/D) than diesel injectors. Reducing L/D ratio results in increased atomization as a result of increased jet velocity, mass flow rate, and air entrainment. Furthermore, GDI injectors are designed with counter-bore holes. While the liquid flows from the upstream location (sac) to the inner nozzle hole, the high-pressure injection causes the liquid flow from the sac region to make a sharp turn towards the internal hole, resulting in a flow that is not attached at the internal nozzle hole’s entrance, thereby decreasing the effective flow exit area and increasing exit velocities. When using larger L/D ratio injectors, the flow will reconnect with the injector wall and exit through the diameter of the nozzle hole. There are more intense interactions between air and liquid at the end of the smaller nozzle hole, which leads to better droplet breakup and wider spray angles (Tu et al., 2015). Due to this the GDI spray inclusion angle is narrower (from 60
Multiple CFD-based modeling approaches are available in the literature to understand the spray characteristics of a GDI injector. These approaches can be differentiated from each other by the methodology adopted. Depending on the nature of the modeling approach, higher accuracy in results demands higher computational cost. To understand the spray characteristics, most of the spray community follows the Eulerian-Lagrangian approach, which is also called the Discrete Droplet Model (DDM) (Kong et al., 1999; Fan and Reitz, 2000; Rotondi and Bella, 2006; Hildenbrand et al., 2007). For, this kind of approach, the spray simulation is based on the experimentally measured rate of injection (ROI) profile, i.e., fuel injection rate vs time (Som et al., 2016). The gaseous phase is treated as a continuum. The liquid parcels are tracked, and different sub models are employed to capture different spray phenomena such as collision, breakup, evaporation and coalescence. This ROI approach uses the blob injection method at the nozzle exit, which means the initial drop of the spray coming out of the nozzle exit is almost equal to the nozzle hole diameter (Reitz, 1987). However, the major limitation of the ROI approach is that it does not consider the in-nozzle effect and the hole-to-hole fluctuations for a multi-hole GDI injector.
One approach to incorporate the effects of internal nozzle flow and hole-to-hole fluctuations on spray modeling of GDI systems is a two-fold methodology (Som et al., 2010; Battistoni et al., 2012; Wang et al., 2015; Quan et al., 2016; Saha et al., 2017). This method is called the “one-way coupling approach”. Firstly, the nozzle flow is simulated and the data of essential flow variables at the exit of the holes is extracted and saved in an output file. In the second stage, this output file is used as input for the blob-injection approach of the Lagrangian spray modeling. This approach is physically more correct than the ROI based approach, since the internal-nozzle flow fluctuations may show an effect in the spray results, which is not possible with the ROI approach. The one-way approach is computationally expensive due to the low time-step size requirements of the simulation of the internal nozzle flow. Nevertheless, the one-way is still computationally feasible, keeping in mind the developments in computational facilities around the world, and the approach is physically correct.
The most detailed spray modeling approach reported in the literature for GDI sprays is the ‘dynamically coupled ELSA approach’ where the internal nozzle flow and the spray formation are simulated simultaneously (García-Oliver et al., 2013; Saha et al., 2018; Arun and Saha, 2021). Such an extensive modeling approach demands a significant computational resource (15–20 days on 100–200 processors in a high-computing facility (Saha et al., 2018; Arun and Saha, 2021)). The Eulerian-Lagrangian Spray Atomization (ELSA) approach has been originally developed and implemented for diesel and gas turbine injection systems (Lebas et al., 2005, 2009), where the internal nozzle flow is typically not considered. Therefore, in case of GDI systems it has been demonstrated by different modeling groups in ECN that inclusion of the internal nozzle flow characteristics renders higher physical accuracy for GDI spray model predictions. Nevertheless, consideration of internal nozzle flow for spray modeling in a reacting IC Engine CFD problem is still not a tractable approach. For this reason, ROI based blob injection approach is still desirable path for spray modeling community.
The purpose of spray studies is to help in understanding spray behavior, air-fuel mixing and to facilitate engine combustion modeling. Unsteady Reynolds Averaged Navier-Stokes (URANS) RNG k-ε model and Large Eddy Simulations (LES) based turbulence models are typically used in CFD studies of an ICE (Han and Reitz, 2007; Richards et al., 2014; Som et al., 2016; Krastev et al., 2017). However, it has been observed that in spray modeling, i.e., non-reacting simulations, the majority of the scientific community uses the standard k-ε turbulence model and tunes the turbulence model constants to match the experimental data. Naturally, the knowledge gained from spray simulations using the standard k-ε model cannot be applied to engine combustion modeling. Thus, there is a significant scope for developing a modeling framework where the turbulence modeling approach is consistent across the spectrum – from non-reacting to reacting simulations. As a result, numerical investigations are carried out to assess the viability of using RNG k-ε and LES turbulence models in addition to the standard k-ε turbulence model, in case of a multi-hole GDI spray in terms of data on spray penetrations, local droplet diameter, and suction velocity. To the best of the authors’ knowledge, such an endeavor has not yet been reported in the literature.
Other than the Spray G injector from ECN, several researchers across the globe are working on the other available gasoline direct injection systems. The following literature are a few to mention (Schmitz et al., 2002; Zigan et al., 2011; Badawy et al., 2018; Robin et al., 2018; Gong et al., 2019; Yamaguchi et al., 2019, 2020; Li et al., 2020; Ji et al., 2021; Miller et al., 2021; Pratama et al., 2022). Most of the aforementioned literature did not explore the effects of breakup model constants as well as the turbulence model in the context of GDI spray. The extent of information available for Spray G such as ROI,
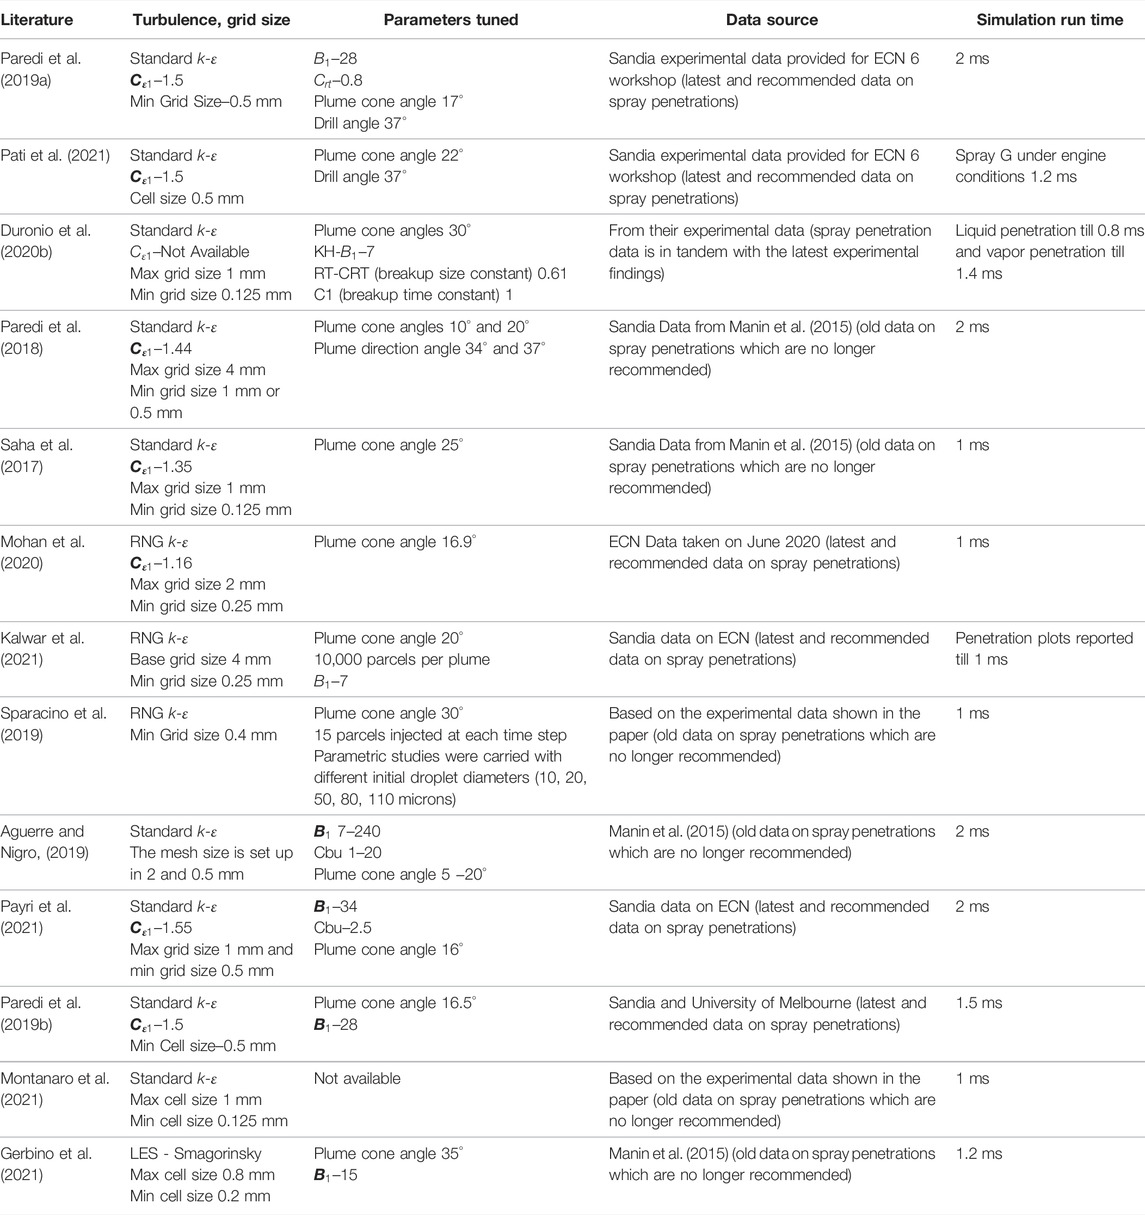
TABLE 1. Comparison of modeling approach and tuning parameters used on Spray G simulation from the published literature.
According to the literature shown in Table 1, the standard k-ε turbulence model is used in the majority of the simulations on the Spray G injector using the Eulerian-Lagrangian approach (ROI-based). It has been observed that majority of the work carried by using the standard k-ε turbulence model, the turbulence model constant
Moreover, in most of the spray simulation studies, model validations have been done based on data on spray penetrations. Only the work done by Paredi et al. (2019a), Duronio et al. (2020b), Payri et al. (2021) compared the model predictions with 1) latest and recommended data on spray penetrations, 2) data on gas axial velocity in the central region of the spray and 3) data on local droplet diameter. However, all the above-mentioned works reported that it was really challenging to achieve reasonable agreement on all three aspects: spray penetrations, gas axial velocity and local droplet diameter. Furthermore, (Paredi et al., 2019a; Duronio et al., 2020b; Payri et al., 2021), did not explore the options of RNG k-ε and LES turbulence models. Thus, the extensive literature review presented before, reinforces the importance of the objective of the current modeling study. The goals will be to develop a validated model setup by: 1) tuning turbulence model constant while using standard k-ε, 2) tuning breakup model constants while using RNG k-ε turbulence model and 3) comparing different LES turbulence models using breakup parameters of the best case scenario with RNG k-ε turbulence model. The above-mentioned modeling approaches will be evaluated with respect to 1) the latest and recommended data on spray penetrations, 2) data on gas axial velocity in the central region of the spray and 3) data on local droplet diameter.
Additionally, in this work simulation is carried out by considering the effects of the stepped holes on ROI-based Eulerian-Lagrangian spray simulation. For this work, a case setup is prepared that consists of Spray G stepped hole domain, and the ROI-based spray simulations is initiated at the exit of the smaller diameter hole. To the best of the author’s knowledge, this kind of work has not been reported in the literature so far.
Finally, parametric studies are carried out to understand the relative importance of the individual spray sub-models, such as breakup, collision, coalescence, and vaporization. Simulations are carried out by turning off each sub-model in each simulation (e.g., simulation is carried out by activating the collision, and breakup models, but deactivating the evaporation model) to see the overall effect on a GDI spray characteristics. Such analysis is also not seen in the literature for a multi-hole GDI injector, to the best of the authors knowledge.
The paper is structured as follows. To begin, the model setup of Spray G and its Eulerian-Lagrangian submodels, as well as the turbulence modelling, are discussed. Second, a detailed discussion of spray breakup is provided, as well as the proposed spray simulation methodology for this work. This is followed by the Results and Discussion section, which begins with a detailed discussion of the modelling approaches’ validation using the most recent and recommended Spray G experimental data. Following a validity assessment, the authors present and discuss the results of an investigation into the effect of including the stepped hole geometry in a ROI-based spray simulation. Finally, the results and discussion sections conclude with a discussion of parametric studies conducted to determine the effect of various spray sub models on a GDI injector. The conclusion section summarizes the work based on the numerous findings from the exhaustive numerical study described previously.
Model Details
Computational Domain
As stated in the previous section, an eight-holed counter bored GDI injector called Spray G from ECN is considered in this work. The injector has five dimples, and eight holes which results in uneven flows passages. The Spray G dimensions are mentioned in Figure 1.
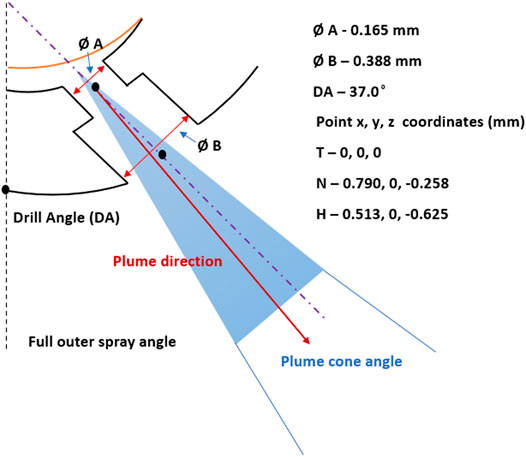
FIGURE 1. Spray G injector nominal geometry details and dimensions.
In this work all simulations are carried out using the conventional ROI approach, in which the mass flow rate in each nozzle hole will be the same. The operating conditions of Spray G injector are shown in Table 2. A cylindrical domain of dimensions 108 mm diameter and 108 mm length is used as a computational domain, as shown in Figure 2. The injector tip is located at the center of the domain on the top surface. The close view of the stepped holes, which is placed at center on top surface of the computational domain is shown in Figure 3.
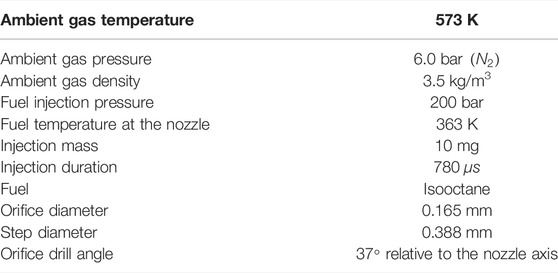
TABLE 2. Spray G standard operating conditions and injection characteristics (ECN, 2022a).
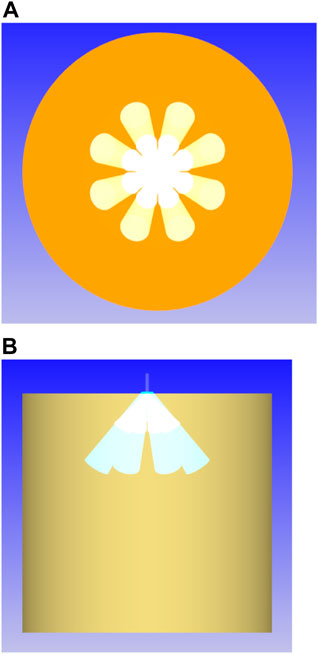
FIGURE 2. Computational domain (A) top view and (B) side view.
FIGURE 3. Magnified front view of the stepped holes of the Spray G injector.
CFD Model Details
This work is carried out using the commercial CFD code CONVERGE v2.4. In this study, a single-component fuel, which is isooctane is used as it replicates the physical behavior of gasoline. The code solves the mass, momentum, species, and energy conservation equations. The transport equations are solved using the Pressure Implicit with Splitting of Operators (PISO) method (Issa, 1986), as it is expected to work well for unsteady compressible flow problems. The Redlich-Kwong gas equation is used to couple the density, pressure, and temperature. Furthermore, the code also solves the sub-models of spray, such as spray breakup by using the Kelvin-Helmholtz (KH) Rayleigh-Taylor (RT) breakup length model, evaporation by using the Frossling model. In this study the spray plume cone angle is considered to be 25°. This specific value of plume cone angle was estimated from the internal nozzle flow simulations carried out by Saha et al. (2017). In that work, using Eulerian simulation, it was observed that the liquid jet coming out of the stepped hole is not a round jet, but rather an elliptical jet. Saha et al. (2017) examined in the near-nozzle region how the liquid volume fraction varied for a specific jet in the radial direction and thus estimated that the liquid jet was expanded more in one specific direction and much less in a direction perpendicular to that specific direction, in which jet width seemed to be maximum. Averaging the spread of the liquid volume fraction in the radial direction, 25° was estimated as the plume cone-angle. It is to be noted that if the plume cone angle needs to be measured with the help of the internal nozzle flow simulations, the estimation should be done within the near-nozzle regions. The plume cone-angle indicates the angular spread within which spray parcels are supposed to be injected, and if Eulerian simulations are used to get that estimate, using jet widths estimate in the far-way regions would be misleading. The drill angle (Figure 1) obtained from the experimental studies is 37°. However from the patternation data analysis done by Manin et al. (2015) and from the x-ray radiography measurements done by Strek et al. (2016) at 2 mm from the injector tip, they have observed the spray plume deflection towards the injector axis. From the studies carried out by Moulai et al. (2015), Saha et al. (2016), it has been observed that, there is a backflow of the chamber gas into the counter-bore, which causes the spray plume to deflect towards the injector axis. Due to this, it is also reported that the resultant spray is ellipsoidal in shape, rather than an approximately round jet. Hence in this work, the simulations are carried out using the plume injection angle as 35°. While postprocessing to make the spray penetration length along the injector axis, the penetration length results are multiplied with cos35°. It is to be noted here that most of the modeling studies in the literature explicitly do not state the methodology of estimation of spray penetrations from the CFD output data, except for Pati et al., (2021). In this study, variable timestep algorithm has been chosen, where the code automatically calculates the timestep size using the maximum allowed Courant-Friedrichs-Lewy (CFL) numbers, spray, and evaporation time-step values. A blob injection model, based on empirical rate of injection (ROI) profile, is considered in this study.
The code creates an automatic mesh while performing the simulation of the maximum grid size. Fixed embedding is used to refine the grid at specific locations in the domain to attain accurate results at that location. While performing the simulations, the Adaptive Mesh Refinement (AMR) technique is also adopted, which refines the grid based on the fluctuating conditions (velocity in this work). The base grid size, or maximum grid size of the simulation, is 1 mm, and the minimum grid size obtained by the AMR and embedding level of 3 is 0.125 mm. The results obtained with a maximum and minimum grid size of 1 and 0.125 mm are shown to be promising with the experimental data for ROI-based simulations (Som et al., 2016; Saha et al., 2017).
The conservation equations of mass, momentum, energy, and species are solved using Favre averaged values. In spray studies inside constant volume chamber, turbulence needs to be accounted for, though there will be a quiescent environment before injection starts, as the spray injection induces chaotic movement of the gas mixture. The spray modeling, i.e., non-reacting studies, has heavily relied on the standard
Smagorinsky: Simple to implement and requires adjusting a viscosity coefficient for each case
Dynamic Smagorinsky: Dynamically determines the viscosity coefficient and it requires additional averaging to remain numerically stable
Dynamic Structure: Contains more physics and directly models stress tensor without a turbulent viscosity.
As mentioned in the “Introduction” section, the simulations ran using the standard
Spray Breakup
As mentioned in the previous section, the blob injection approach is used in this study to distribute the number of droplets, and the injected drop sizes are equal to the nozzle hole diameter (Reitz, 1987). For the liquid spray breakup in this work, the Kelvin-Helmholtz (KH) and Rayleigh Taylor (RT) breakup length models are considered.
Kelvin Helmholtz–Rayleigh Taylor Breakup Length Model
The KH breakup model assumes that the droplet with radius r, breaks up due to unstable surface wave into smaller droplets of radius
where
During the breakup the rate of change of the parent droplet size is calculated using
where
The value
Primarily in this work the KH instabilities are considered for the initial or primary breakup of the liquid jet and both the KH and RT instabilities are activated for the secondary breakup of the liquid jet. The RT model predicts the instabilities on the surface of the droplet, that grow until a certain characteristic breakup time when finally, the droplet breaks up. The unstable RT waves are assumed to occur due to the deceleration of the droplets from the magnitude of the drop force. The RT model is also derived from the wave instabilities, where the frequency of the fastest growing wave is
If the wavelength is smaller than the droplet diameter, RT waves are assumed to be growing on the surface of the droplet. On the surface of the droplet, once the wave begins to grow, the time of wave growth is tracked and it is compared with the breakup time, which is defined by:
where,
In this work, for a given spray both KH and RT breakup models are considered. However, for a given liquid core length from the start of fuel injection, initially only the KH breakup model is accountable for the breakup. After, crossing the mentioned liquid core length in the model, both the KH and RT breakup models are activated on the spray jet. Where, the liquid core length is called as the breakup length. Similar spray modeling approach has been reported in the literature for diesel injection (Xin et al., 1998; Beale and Reitz, 1999; Senecal, 2000).
The breakup length is calculated from Levich theory (Wissler, 1963)
where,
Assuming higher gas Webber number, which can be seen in a typical diesel injector, from the literature it has been shown that the KH breakup length is reduced to Eq. 6 (Senecal, 2000).
On comparing the liquid core breakup length (Eq. 5) and KH breakup length (Eq. 7) the breakup length constant is equal to the half of the breakup time constant (
Results and Discussion
Model Validation With ECN Data
Liquid and vapor penetrations are two important key parameters for characterizing spray behavior. As a result, most of the modeling studies attempt to validate the modeling approaches by comparing the predicted values of liquid and vapor penetrations with the estimated values from experimental studies. Spray penetration estimates help to understand how far the liquid droplets and fuel vapor are spreading in a combustion chamber. The CONVERGE code calculates the liquid penetration length and vapor penetration length (LPL, VPL) for each nozzle/hole. To estimate LPL, the CONVERGE code calculates the total mass of spray parcels coming out of a specific nozzle at a given time-step. Based on a penetration factor (say 99%) the code evaluates the distance from the nozzle exit where 99% of the spray mass is contained in that given time-step. This distance is used as the liquid penetration prediction for the specific time-step.
To estimate the vapor penetration length of the spray, the CONVERGE code considers two parameters, the vapor penetration factor and a bin size. The code calculates the VPL from the nozzle hole center to the farthest position of the cell, where the mass fraction of the fuel vapor in the given cell is higher than the mentioned value in the simulation. In estimating the VPL, the code also considers only the cells that are equal to or higher than the mentioned bin size. Cell size smaller than the bin size are not considered in estimating the VPL. If the cell size is less than the bin size in a given spray cone, the CONVERGE code considers the parent cell (maximum cell size) rather than the embedded cell (minimum cell size). In this work, the bin size is kept as the maximum cell size, i.e., 1 mm. Figures 4–8 shows the liquid and vapor penetration lengths compared with the experimental data using the URANS and LES turbulence models. The latest experimental data on liquid and vapor penetrations mentioned in Figures 4–6, 8, 11 are from Sandia National Laboratory, and the data is available on the ECN website.
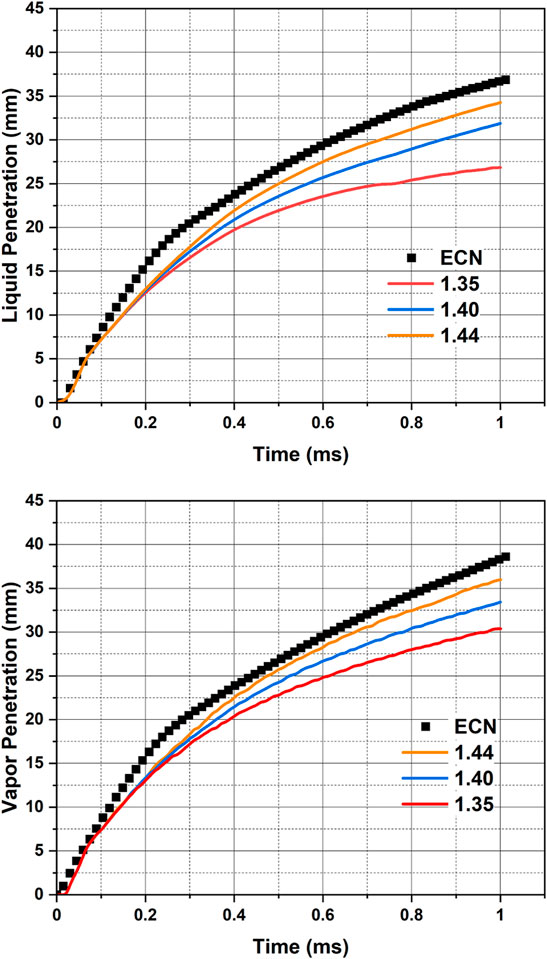
FIGURE 4. Comparison of model predictions of liquid and vapor penetrations with the latest data measured by Sandia National Laboratories, available on ECN (ECN, 2022b) (Standard k – ε turbulence model used with
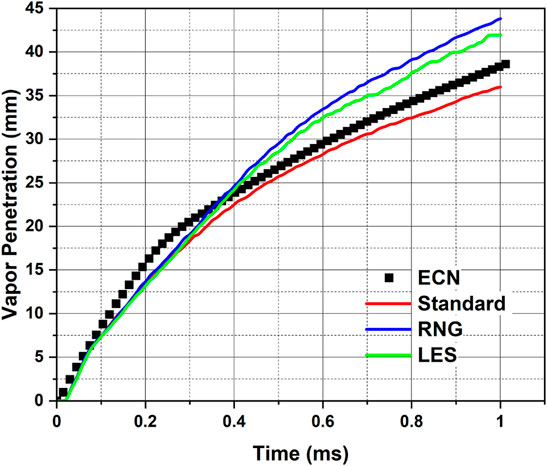
FIGURE 5. Comparison of model predictions of vapor penetration with the latest data measured by Sandia National Laboratories, available on ECN (ECN, 2022b) [Standard k – ε turbulence model used with
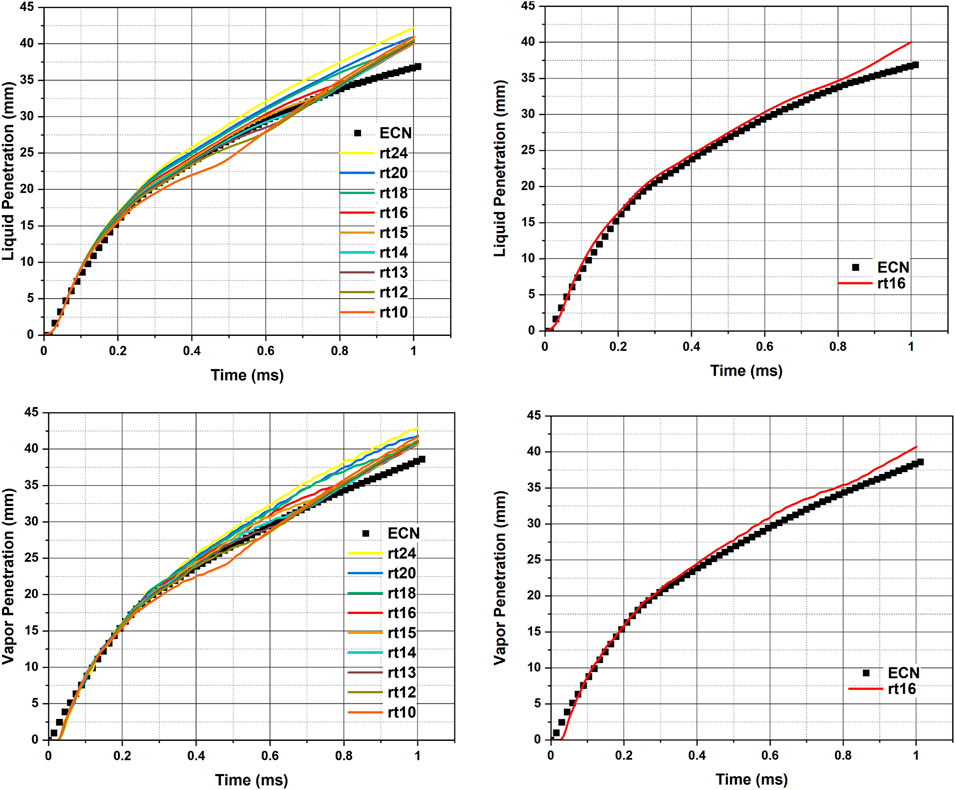
FIGURE 6. Comparison of model predictions of liquid and vapor penetrations with the latest data measured by Sandia National Laboratories, available on ECN (ECN, 2022b) with RNG k – ε turbulence model and different breakup model constants (rt10 to rt24) [
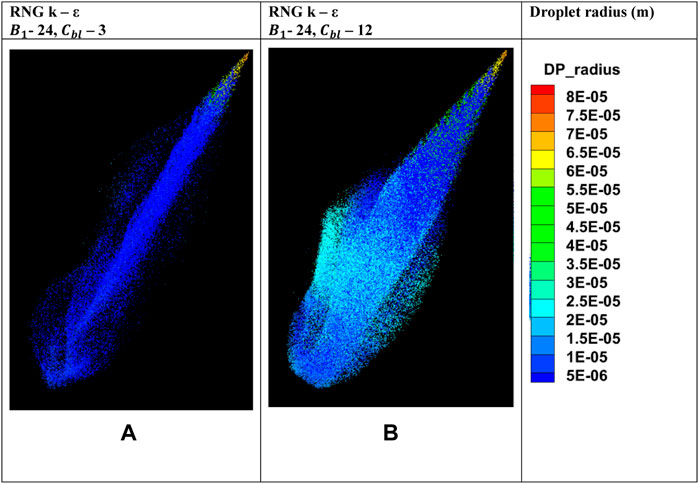
FIGURE 7. Comparison of predictions of radii of spray parcels at 0.8 ms with RNG k – ε turbulence model for two different values of
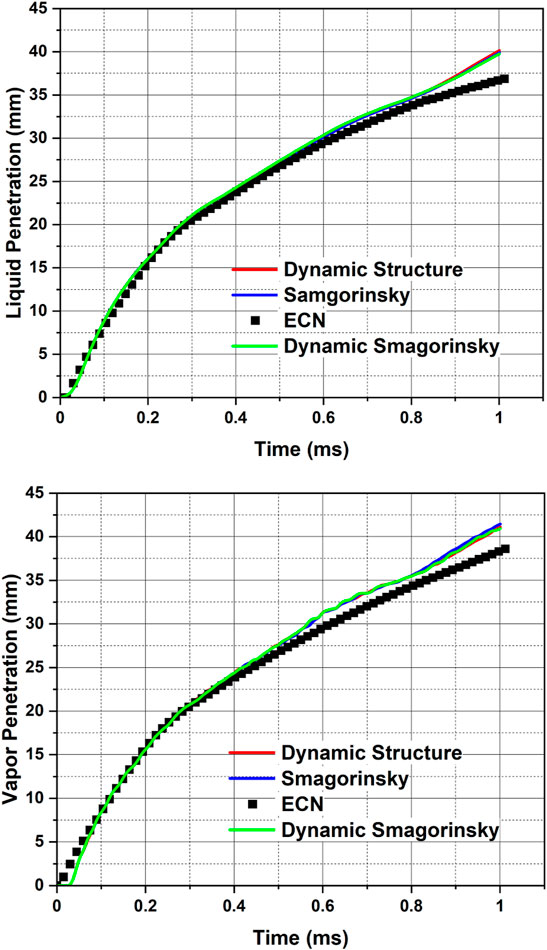
FIGURE 8. Comparison of model predictions of liquid and vapor penetrations with the latest data measured by Sandia National Laboratories, available on ECN (ECN, 2022b) using different LES turbulence modeling approaches i.e., LES with different sub-grid models- Dynamic Structure, Smagorinsky, Dynamic Smagorinsky [
As mentioned in Table 1, the Spray G standard conditions are considered in this simulation study. Figure 4 shows the comparison of the model predictions of liquid and vapor penetrations with the latest data measured by Sandia National Laboratories and available from ECN (ECN, 2022b). The simulation results in Figure 4 are obtained using standard k – ε turbulence model with different values for the turbulence model constant,
In an IC engine problem, the length scales vary from 0.1 mm to 0.1 m (i.e., starting from the fuel injector hole to the engine stroke/bore dimensions) (Richards et al., 2014). Therefore, adopting RNG k – ε and LES-DS (LES with Dynamic Structure sub-grid model) turbulence models for CFD studies on engine combustion are preferred, since capturing the essence of a wide range of length scales will not be possible with standard k – ε. Hence, the breakup constants, plume cone angle used for obtaining the results presented in Figure 4, are used along with RNG k – ε and LES turbulence models, and the results of vapor penetrations are shown in Figure 5 in comparison with Sandia ECN data and standard k – ε (
As mentioned previously, the KH-RT breakup length model was used in the study. Using this model, the code assumes only KH breakup instabilities are responsible for drop breakup inside the characteristic breakup length. Beyond the breakup length, both the KH and RT models are activated for drop breakup. However, the code checks if droplet breakup is feasible under the RT mechanism. If the RT mechanism is strong enough then the droplet is allowed to undergo breakup due to KH instability. It is reported in the literature that the breakup length constant
After seeing the effect of changing
LES modeling predictions are considered more reliable for an unsteady turbulent problem, such as the GDI spray problem, which is the topic of this study. Several publications in the literature explored the differences in the model predictions for IC engine sprays with URANS vs. LES turbulence modeling approaches (Xue et al., 2013; Som et al., 2016; Rutland, 2017). For diesel sprays it has already been demonstrated that LES with Dynamic Structure sub-grid model provides reasonable predictions when compared with ECN experimental data, where different approaches for modeling sub-grid scale characteristics were tested (Xue et al., 2013). To the best of the authors’ knowledge, similar exercise have not been reported for Spray G – standard, i.e., a GDI spray case.
The same grid resolution (1 mm maximum grid size, 0.125 mm minimum grid size, peak cell count ∼12–13 million cells, injected parcel count ∼800k) is verified for the parametric study involving the different sub-grid models of LES available in the CONVERGE code. The predictions using the LES models for the liquid and vapor penetrations are plotted along with the latest and recommended Sandia ECN data in Figure 8. The results from the different LES models are almost overlapping throughout the simulation time. This could be due to the higher numerical viscosity. As for the LES cases, all the simulation parameters are kept same as those of the RNG k – ε turbulence model. For liquid penetrations, with all the LES models, there is excellent agreement with the experimental data till 0.8 ms and the maximum deviation (2–3 mm) is at 1 ms. In case of vapor penetration also, with all the LES models the deviations increase mainly after 0.8 ms. The slope change in the predicted values beyond 0.8 ms must be due to the end-of-injection time at 0.78 ms, when injection of fresh parcels into the domain stops. Figure 8 indicates that the rt16 model setup which provides reasonable agreement with the RNG k – ε turbulence model also works with the LES turbulence models. As shown in the literature, when it comes to using LES models for spray simulations there is a practice of using multiple realizations using random seeds which perturb the initial injection of the parcels to capture the essence of shot-to-shot variability (Xue et al., 2013; Som et al., 2016). It is to be noted that the LES simulation results presented in this work are based on single realizations. From some of the internal studies it seemed that predictions from five different realizations for a given case did not lead to considerable differences in the predictions. The reason behind trying only five realizations is that the work by Som et al. (2016) on GDI sprays that averaging over five spray realizations of LES simulations may yield more than 99% of the relevance index when compared with the predictions of the 18 realizations of the same case.
The grid resolution (1 mm maximum grid size, 0.125 mm minimum grid size, peak cell count ∼12–13 million cells) used in this study was also adopted in the study by Som et al. (2016), and the same CONVERGE code was used. Moreover, the findings reported in the literature indicate that the integral length scale in the spray regions of internal combustion engines is in the order of 1 mm (Barroso et al., 2003; Aleiferis et al., 2017). Therefore, the minimum grid size (0.125 mm) used in this study is easily 1 order smaller than the corresponding integral length scale. Additionally, the minimum length scale that maybe resolved using the URANS approach for the spray problem in this study was calculated based on the formulation suggested in the literature and it came in the order of 0.25–0.3 mm. The values of the flow-field variables at the spray plume tips obtained from the CFD simulation are used for estimating the minimum URANS resolvable length scale. This means that there is no point in going for further refinement while using URANS approaches. For LES models, the 0.125 mm minimum grid size resolution is already 2.5 times smaller than the URANS length scale. Som et al. (2016) also mentioned in their study that a 0.125 mm minimum grid size maybe sufficiently fine for these GDI spray simulations.
As a result, coarse grid resolutions cannot be the reason behind not seeing the considerable differences in the predictions from multiple realizations of LES simulations for a specific case. The possible reasons for not seeing such variations in this work could be two-fold – 1) the injected parcel count in this study is 800k and the injected parcel count in the study by Som et al. (2016) was 50k and 2) the plume cone angle used in this study is 25° and the plume cone angle used in the study by Som et al. was in the range of 35°–40°. Using such a high number (800k) of injected parcels for multi-plume GDI sprays has been reported in the literature (Saha et al., 2017).
Gasoline injection sprays are different compared to diesel sprays mainly in two different aspects – 1) considerably lower injection pressure for GDI sprays and 2) considerably lower injection angle (the angle between the injector axis and the spray plume axis). The liquid penetration in a diesel injection scenario typically reaches a quasi-steady state, which is not seen in the case of GDI sprays. Due to the lower injection angle, there is a high chance that the multiple plumes of GDI spray will interact with each other and may merge to behave like a hollow-cone spray. This phenomenon of plume merging and subsequent plume collapse has been reported and investigated already in the literature through experimental and numerical endeavors (Sphicas et al., 2017; Wu et al., 2019; Du et al., 2020). The measurements done by (Sphicas et al., 2017) provide interesting insight on this aspect by providing gas velocity along the injector-axis measurements during spray injection, where negative velocity meant plumes merged and gas flow was moving up towards the injector tip and positive values indicated that after the plume-merging plume collapse stage had arrived. The same work also showed through numerical studies, that it is extremely challenging to capture this trend both qualitatively and quantitatively. Nevertheless, it is worthwhile to check whether the modeling framework that captures the latest trend of spray penetrations is also able to capture the essence of plume-merging and plume-collapse in the case of Spray G standard condition. All the URANS and LES turbulence models, which are tested for comparison with the data for spray penetrations, are also compared with the axial velocity data obtained from (Sphicas et al., 2017) and the results are presented in Figure 9. These measurements of axial velocity were taken at a distance of 15 mm downstream of the injector tip on the injector axis. The predictions using the standard k – ε turbulence model does not do a good job qualitatively and quantitatively compared to the predictions using RNG k – ε, LES- Smagorinsky, LES- Dynamic Smagorinsky, LES- Dynamic Structure. The best agreement comes with the predictions from RNG k – ε turbulence model and there are non-monotonic slope changes after 0.6 ms in Figure 9, as it is seen from the experimental data also. The predictions using the different LES turbulence models overlapped throughout the duration of the simulation time, and they also exhibit slight non-monotonic trend after 0.6 ms. However, the predictions with LES models do not do a better job compared to RNG k – ε turbulence model. This is unusual since predictions using LES modeling approaches are supposed to be more realistic compared to URANS approaches. This indicates there is room for further improvement using LES turbulence modeling approaches, which constitutes scope for future work. Nevertheless, it is to be noted that the predictions of all the models tested in this study doing a better job compared to the numerical predictions reported in the study by Sphicas et al. (2017) using OpenFOAM and CONVERGE codes. The authors believe the main reason behind the success in capturing the trend of axial velocity in the current study, is the availability of the latest spray penetration data, which is higher than the previously reported data, with which the previous modeling studies used to tune their approach. Matching the older penetration data was misleading, and the modeling approaches earlier were failing to capture the trends in spray penetration as well as the axial velocity. It is imperative for developing trust on the modeling approaches for the multi-hole GDI sprays, solely relying on spray penetrations will not be the right path. Through the comparative studies with data on spray penetrations and gas axial velocity it is evident that the LES simulation setups with the Smagorinsky and Dynamic Smagorinsky sub-grid models do not offer any advantage with respect to the Dynamic Structure sub-grid model.
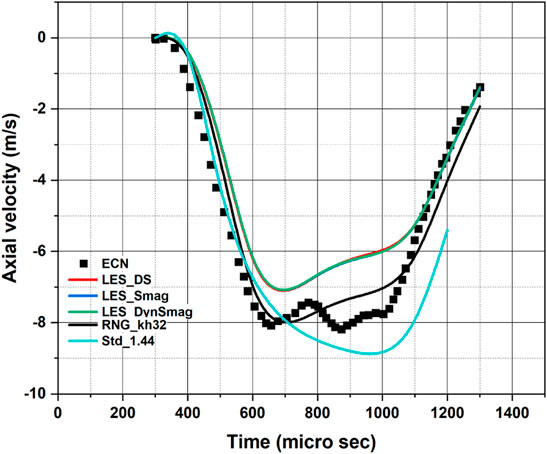
FIGURE 9. Comparison of the predictions of axial velocity of the gas in the chamber during the spray injection using with the experimental data of (Sphicas et al., 2017) [Standard k – ε turbulence model used with
It has been shown that the model predictions using RNG k – ε and LES turbulence models along with KH-RT breakup-length model (
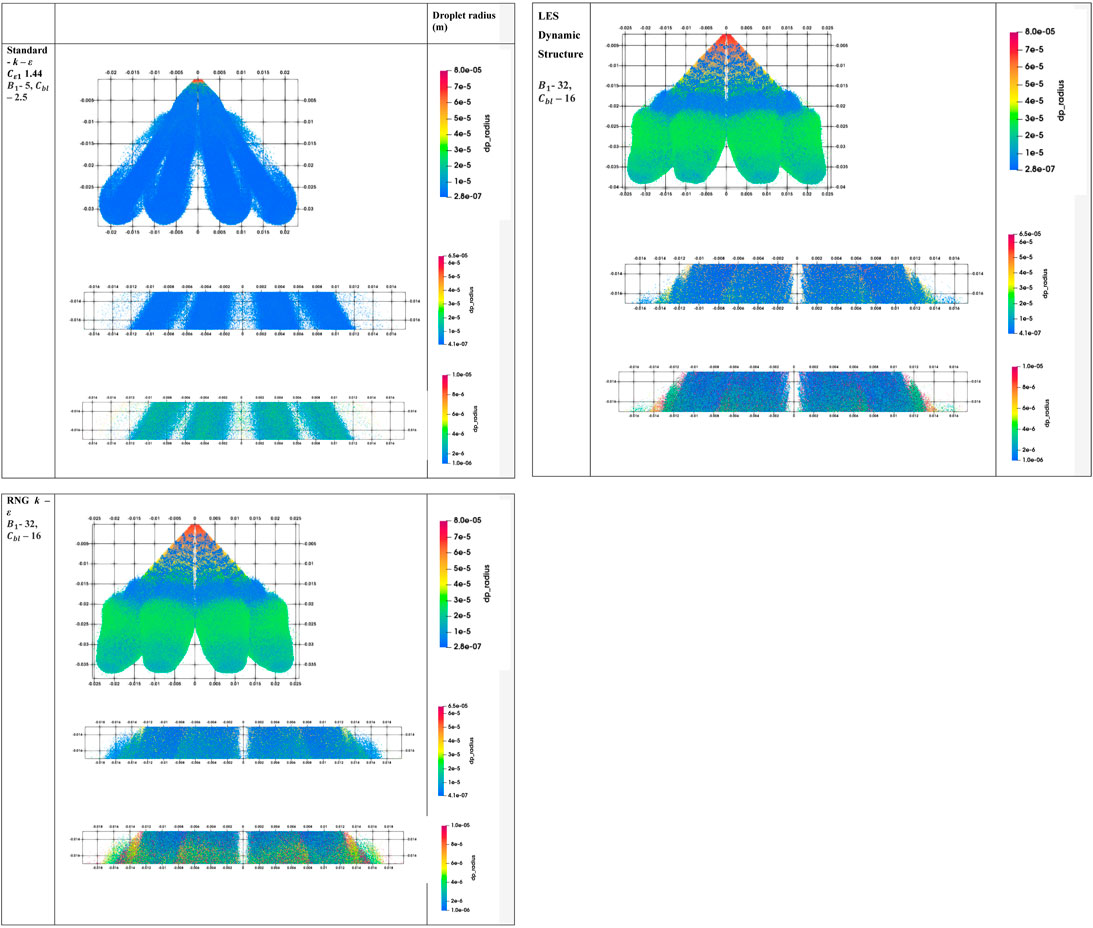
FIGURE 10. Comparison of the predictions of parcel radii at 0.8 ms using three different modeling approaches [Standard k – ε turbulence model used with
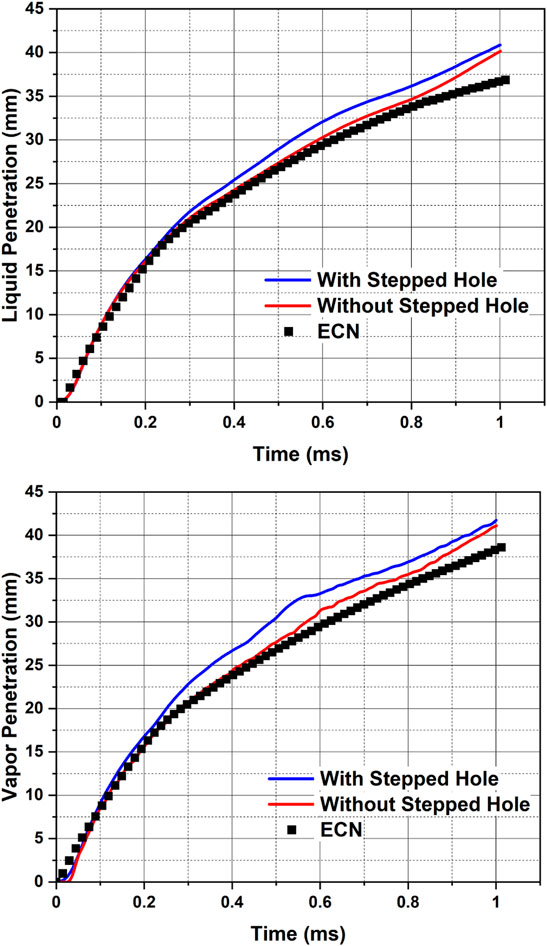
FIGURE 11. Comparison of model predictions of liquid and vapor penetrations with the latest data measured by Sandia National Laboratories, available on ECN (ECN, 2022b) using LES Dynamic Structure turbulence model with and without the stepped holes in the computational domain [
Figure 3 shows the magnified view of the stepped holes of the Spray G injector. The internal nozzle flow studies by multiple research groups (Saha et al., 2017; Mohapatra et al., 2020; Sforzo and Nocivelli, 2020) have demonstrated that the physical understanding of the evolution of the multi-plume GDI spray is incomplete without the inclusion of the Spray G injector geometry. The stepped hole geometry leads to backflow of the chamber gas into the counter-bore region leasing to partial hydraulic flip. Such a phenomenon also pushes the spray plumes more towards the injector axis, resulting in a lower spray-plume injection angle (∼33°–35°) than the drill-angle (37°) of the Spray G injector geometry. However, doing a detailed spray simulations including injector geometry and the transients caused by the needle movement will be computationally expensive, and such a spray modeling approach may not be feasible to adopt in a multi-cycle engine combustion CFD analysis. In the typical ROI based spray simulations, there is no hole geometry included in the computational domain and spray injection is modeled as point injection. However, it would be interesting to see how the spray characteristics would change if these point injections were initiated with the eight stepped holes, i.e., at the exit of the smaller hole, but the spray parcels would have to pass through the counter-bore region before entering the chamber environment. The model settings that are used for ROI-based LES Dynamic Structure simulation are also used for a LES simulation case where the stepped hole is included in the ROI spray simulations. The comparison of the predictions of liquid and vapor penetrations using LES Dynamic Structure with two different computation domains: 1) with the stepped holes and 2) without the stepped holes (the usual ROI computational domain) is presented in Figure 11. The case including the stepped holes led to over-prediction compared to the case with the usual computational domain (i.e., without the stepped holes). Despite the over-predictions, the performance for the case with stepped holes in the computational domain is still promising. The effects of inclusion of the stepped holes will be more evident in the following result.
The simulation setups that showed promising results in terms of liquid and vapor penetrations for the Spray G standard condition are – 1) Standard k – ε -
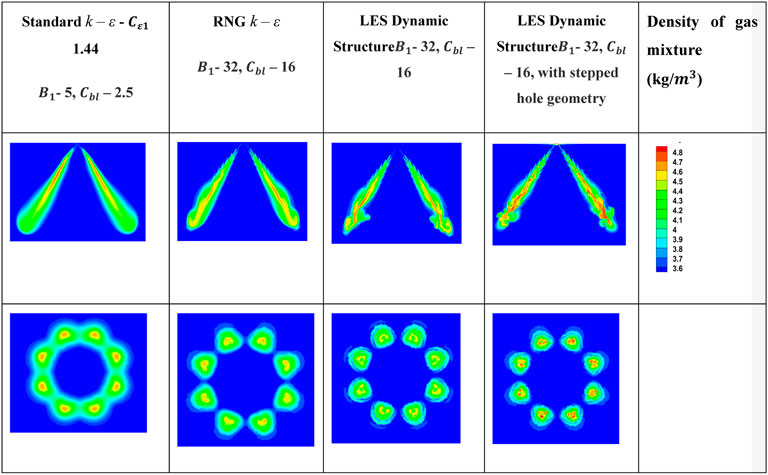
FIGURE 12. Comparison of the predictions of density variations at 0.8 ms using three different modeling approaches for Spray G standard conditions [Standard k – ε turbulence model
Influence of Spray Sub-Models
Unlike diesel fuel injectiors, the GDI system will run at almost one order of magnitude lower injection pressure, and with narrower plume injection angles (angle between the axes of the injector and the hole). In this regard, different spray submodels play vital roles in predicting the overall spray characteristics. In this work, parametric studies are also carried out to understand the effect of individual spray submodels on a GDI spray. For each of these parametric cases, one of the spray submodels is deactivated and the simulation is carried out. Such investigations are only possible in a numerical study, and they will help in understanding which spray sub-model is dominant. This kind of parametric study has not been reported in the literature yet, to the best of the knowledge of the authors. Details of the cases studied in this work are as follows:
• Case 1: Activated model: Collision; Deactivated model: Breakup model, evaporation model
• Case 2: Activated model: KH and RT breakup models; Deactivated model: Evaporation model and collision model
• Case 3: Activated model: KH breakup model; Deactivated model: Evaporation model and collision model
• Case 4: Activated model: RT breakup model; Deactivated model: Evaporation model and collision model
• Case 5: Activated model: Evaporation model; Deactivated model: Breakup model and collision model
The results are presented in such a way, that the effects of each case mentioned in the above are compared with each other and are shown in Figure 13. The variables that are used for this comparison are listed below:
A) Density contour, representing vertical cut section of two opposite plumes
B) Density contour, representing the horizontal cutsection at 15 mm downstream of the injector
C) Temperature contour, representing vertical cut section of two opposite plumes
D) Temperature contour, representing the horizontal cutsection at 15 mm downstream of the injector
E) Droplet radius along a single hole axis from the injector
F) Droplet temperature along a single hole axis from the injector
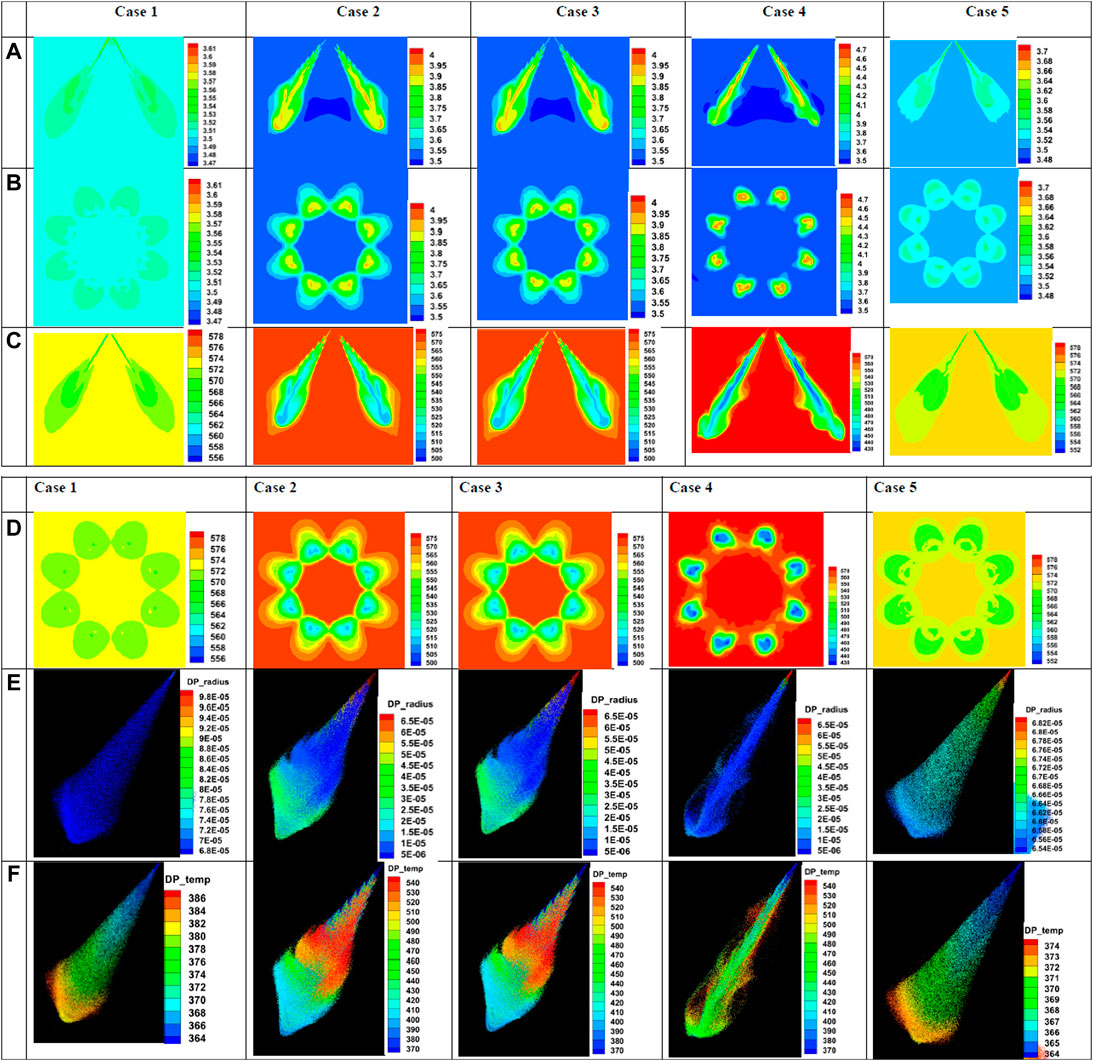
FIGURE 13. Effects of deactivating the spray submodels on different variables.
From the results shown in Figure 13, significant differences are observed. Case 1 and 5 resemble each other, where in case 1, only the collision submodel is activated and in case 5, only the evaporation model is activated. The commanality between these two cases is that the breakup model is deactivated. A difference of around 10–15 K is observed in the parcel temperature between case 1 and case 5, and the temperature differences shown in temperature contour at 15 mm from the injector are a clear indicator of the effect of the evaporation model (see Figure 13, section F).
The effect of deactivating and activating the breakup model on the GDI spray is seen clearly from the results. Significant variations among the results are observed between cases 2, 3, and 4. Case 2 is with the activated KH breakup model and case 3 is with the activated KH and RT breakup length model. However, it is observed that both case 2 and case 3 results are similar in nature. It also indicates the effect of the KH breakup model in the KH-RT breakup length model. When a KH brekup model is activated, it is evident from the results that the spray becomes wider after a certain distance of spray travel from the injector. However, when only the RT breakup model is active it is observed that the spray is not wider and the breakup of droplets is effectively faster than the rest all other cases studied in this work. The effect of RT breakup length is seen as both KH activated cases and the RT alone activated case have different spray shapes. From the B and D results, it is also conclusive that the spray shape of the RT breakup model alone is not wider and there is no effect of the neighbouring plumes on a given plume. Additionally, the surface wave instabilites are seen clearly on a KH-RT breakup length model case and KH breakup model alone activated case. Near nozzle atomization can be expected to be more severe compared to diesel atomization. Even though the injection pressures for GDI are not high as diesel injection cases. This could be because low l/d ratio of the GDI holes are adopted to promote faster atomization. In the cases where the breakup model is activated (cases 2, 3 and 4), the majority of the droplet radius is reported to be lower (10–35 microns) than in the deactivated cases (cases 1 and 5) which are reported at around 65 to 70 microns. This clearly shows the effect of the breakup model in a spray simulation.
In all the cases presented in this work, except for case 5, rest all cases are with a deactivated evaporation model. In such a case with the activated evaporation model (case 5) the parcel temperatures are reported very low, only at the bottom end of the spray domain, the spray parcels are at higher temperature (approx. 520–540 K) than the injected temperature (363 K), wheras the surrounding gas temperature is at 573 K. However, in all other cases, it is observed that the droplet temperatures reach a very high temperature, ideally when a droplet is induced in a higher temperature environment, the parcel will undergo vaporization and vapor fuel will mix with the surrounding chamber-gas, to form a combustible mixture. From this parametric study, it is evident and conclusive that for a spray simulation, the breakup models are dominant.
Summary and Conclusion
In this study, different modeling approaches are proposed to simulate the multi-hole GDI spray for the Spray G standard condition, obtained from ECN. Different turbulence modeling approaches, different breakup model constants are used to arrive at reasonable model setups which are capable of predicting spray penetrations, gas axial velocity in the central region of the spray, local droplet diameters at certain downstream locations of the spray with reasonable accuracy. The current work prioritizes on validating the latest and recommended experimental data on spray penetrations of Spray G injector from ECN using ROI-based Eulerian-Lagrangian approach. The spray simulation setup is validated using 1) tuning turbulence model constant while using standard k-ε, 2) tuning breakup model constants while using RNG k-ε turbulence model and 3) comparing different LES turbulence models using breakup parameters of the best-case scenario with RNG k-ε turbulence model.
The key points to take away from this study are summarized below:
• Parametric studies were done using standard k-ε turbulence model with different values for the turbulence model constant,
• Additionally, simulation setup using standard k-ε (
• In this study, focus is on exploring the effect of changing
• From parametric studies it was also inferred that by increasing values of
• Parametric studies are carried out using LES turbulence models with the different sub-grid models - Smagorinsky, Dynamic Smagorinsky and Dynamic Structure. In these simulations the breakup model constants performed well using RNG k – ε (
• Additionally, in this work, a simulation is carried out by considering the effects of the stepped holes on ROI-based a Eulerian-Lagrangian spray modeling results. For this work, a case setup is prepared which consists of Spray G stepped hole domain, and the ROI-based spray simulations is initiated at the exit of the smaller diameter hole. It was observed that inclusion of stepped-hole in the ROI simulation led to higher fluctuations in the spray downstream. This means if the hole-geometry is known for a given injector the modeling community may consider the stepped-hole geometry in the ROI simulation to provide realistic predictions.
• In this study, comparisons are made with density and temperature variations of the gas mixture at 0.8 ms on a vertical plane cuttung through the mid-section of the injector location and the horizontal plane provide impressions of spray patternations. These comparisons are made with Standard k – ε (using
• Finally, parametric studies are carried out to understand the relative importance of the individual spray sub-models, such as breakup, collision, coalescence, and vaporization. Simulations are carried out by turning off each sub-model in each simulation (e.g., simulation is carried out by activating the collision, breakup models, but deactivating the evaporation model) to see the overall effect on a GDI spray characteristics. From this study it is evident and conclusive that for a spray simulation the breakup models are dominant factors.
Data Availability Statement
The raw data supporting the conclusions of this article will be made available by the authors, without undue reservation.
Author Contributions
AA and KS wrote the manuscript. KS reviewed and provided inputs to the simulations carried in this work. AA did all the simulations and associated post-processing.
Funding
The authors thank the Science and Engineering Research Board (SERB) of the Department of Science and Technology (DST) for funding through the Early Career Research Award (ECRA)–ECR/2018/002372.
Conflict of Interest
The authors declare that the research was conducted in the absence of any commercial or financial relationships that could be construed as a potential conflict of interest.
Publisher’s Note
All claims expressed in this article are solely those of the authors and do not necessarily represent those of their affiliated organizations, or those of the publisher, the editors and the reviewers. Any product that may be evaluated in this article, or claim that may be made by its manufacturer, is not guaranteed or endorsed by the publisher.
Acknowledgments
The authors thank IIT Delhi HPC facility for the computational resource. Authors would like to acknowledge Sibendu Som at Argonne National Laboratory, United States, and Noah Van Dam at University of Massachusetts, Lowell, United States for providing the motivation for carrying out simulations using the computational domain with the stepped hole geometry. Authors are thankful to Mukul Biware, from Convergent Science India for assisting in creating the computational setup which includes the stepped hole geometry.
References
Aguerre, H. J., and Nigro, N. M. (2019). Implementation and Validation of a Lagrangian Spray Model Using Experimental Data of the ECN Spray G Injector. Comput. Fluids 190, 30–48. doi:10.1016/J.COMPFLUID.2019.06.004
Ailaboina, A., and Saha, K. (2022). Modeling the Spray Characteristics of Blended Fuels for Gasoline Direct Injection Applications. Int. J. Green Energy 1, 1–16. doi:10.1080/15435075.2022.2057801
Aleiferis, P. G., Behringer, M. K., and Malcolm, J. S. (2017). Integral Length Scales and Time Scales of Turbulence in an Optical Spark-Ignition Engine. Flow. Turbul. Combust. 98, 523–577. doi:10.1007/S10494-016-9775-9/TABLES/5
American Petroleum Institute (2013). Future US Trends in the Adoption of Light-Duty Automotive Technologies Integrated Final Report. Washington, DC: American Petroleum Institute.
Badawy, T., Attar, M. A., Hutchins, P., Xu, H., Krueger Venus, J., and Cracknell, R. (2018). Investigation of Injector Coking Effects on Spray Characteristic and Engine Performance in Gasoline Direct Injection Engines. Appl. Energy 220, 375–394. doi:10.1016/J.APENERGY.2018.03.133
Barroso, G., Schneider, B., and Boulouchos, K. (2003). An Extensive Parametric Study on Diesel Spray Simulation and Verification with Experimental Data. Pittsburgh, PA: SAE Technical Papers. doi:10.4271/2003-01-3230
Battistoni, M., Grimaldi, C., and Mariani, F. (2012). Coupled Simulation of Nozzle Flow and Spray Formation Using Diesel and Biodiesel for CI Engine Applications. Warrendale, PA: SAE Technical Papers. doi:10.4271/2012-01-1267
Chehroudi, B., Chen, S.-H., Bracco, F. v., and Onuma, Y. (1985). On the Intact Core of Full-Cone Sprays. Detroit, MI: SAE Technical Papers. doi:10.4271/850126
di Ilio, G., Krastev, V. K., and Falcucci, G. (2019). Evaluation of a Scale-Resolving Methodology for the Multidimensional Simulation of GDI Sprays. Energies 12, 2699. doi:10.3390/EN12142699
Du, J., Mohan, B., Sim, J., Fang, T., and Roberts, W. L. (2020). Study of Spray Collapse Phenomenon at Flash Boiling Conditions Using Simultaneous Front and Side View Imaging. Int. J. Heat Mass Transf. 147, 118824. doi:10.1016/J.IJHEATMASSTRANSFER.2019.118824
Duronio, F., de Vita, A., Allocca, L., Montanaro, A., Ranieri, S., and Villante, C. (2020b). CFD Numerical Reconstruction of the Flash Boiling Gasoline Spray Morphology. Warrendale, PA: SAE Technical Papers. doi:10.4271/2020-24-0010
Duronio, F., de Vita, A., Allocca, L., and Anatone, M. (2020a). Gasoline Direct Injection Engines - A Review of Latest Technologies and Trends. Part 1: Spray Breakup Process. Fuel 265, 116948. doi:10.1016/J.FUEL.2019.116948
Duronio, F., de Vita, A., Montanaro, A., and Villante, C. (2020c). Gasoline Direct Injection Engines - A Review of Latest Technologies and Trends. Part 2. Fuel 265, 116947. doi:10.1016/J.FUEL.2019.116947
ECN (2022b). Sandia Spray G Data – Engine Combustion Network. Available at: https://ecn.sandia.gov/data/sandia-spray-g-data/ (Accessed February 16, 2022).
ECN (2022a). “Spray G” Operating Condition – Engine Combustion Network. Available at: https://ecn.sandia.gov/gasoline-spray-combustion/target-condition/spray-g-operating-condition/ (Accessed February 2, 2022).
Fan, L., and Reitz, R. D. (2000). Spray and Combustion Modeling in Gasoline Direct-Injection Engines. At. Spr. 10, 219–249. doi:10.1615/ATOMIZSPR.V10.I3-5.30
Fundamentals of Mixture Formation in Engines (2006). Mixture Formation in Internal Combustion Engine. Berlin, Heidelberg: Springer, 5–46. doi:10.1007/3-540-30836-9_2
Garcia-Oliver, J. M., Pastor, J. M., Pandal, A., Trask, N., Baldwin, E., and Schmidt, D. P. (2013). Diesel Spray Cfd Simulations Based on the Σ-υ Eulerian Atomization Model. At. Spr. 23, 71–95. doi:10.1615/ATOMIZSPR.2013007198
Gerbino, F., Tretola, G., Morgan, R., Atkins, P., and Vogiatzaki, K. (2021). Influence of the Initial Droplet Distribution on the Prediction of Spray Dynamics in Eulerian-Lagrangian Simulations. Int. J. Multiph. Flow 141, 103642. doi:10.1016/J.IJMULTIPHASEFLOW.2021.103642
Gong, Z., Feng, L., and Wang, Z. (2019). Experimental and Numerical Study of the Effect of Injection Strategy and Intake Valve Lift on Super-knock and Engine Performance in a Boosted GDI Engine. Fuel 249, 309–325. doi:10.1016/J.FUEL.2019.03.005
Han, Z., and Reitz, R. D. (1995). Turbulence Modeling of Internal Combustion Engines Using RNG κ-ε Models. Combust. Sci. Technol. 106, 267–295. doi:10.1080/00102209508907782
Harada, J., Tomita, T., Mizuno, H., Mashiki, Z., and Ito, Y. (1997). Development of Direct Injection Gasoline Engine. Detroit, MI: SAE Technical Papers. doi:10.4271/970540
Hildenbrand, S., Staudacher, S., Brüggemann, D., Beyrau, F., Weikl, M. C., Seeger, T., et al. (2007). Numerical and Experimental Study of the Vaporization Cooling in Gasoline Direct Injection Sprays. Proc. Combust. Inst. 31, 3067–3073. doi:10.1016/J.PROCI.2006.07.092
Issa, R. I. (1986). Solution of the Implicitly Discretised Fluid Flow Equations by Operator-Splitting. J. Comput. Phys. 62, 40–65. doi:10.1016/0021-9991(86)90099-9
Ji, C., Chang, K., Wang, S., Yang, J., Wang, D., Meng, H., et al. (2021). Effect of Injection Strategy on the Mixture Formation and Combustion Process in a Gasoline Direct Injection Rotary Engine. Fuel 304, 121428. doi:10.1016/J.FUEL.2021.121428
K. Saha, A. Kumar Agarwal, K. Ghosh, and S. Som (Editors) (2019). Two-Phase Flow for Automotive and Power Generation Sectors (Springer). doi:10.1007/978-981-13-3256-2
Kalwar, A., Chintagunti, S., and Agarwal, A. K. (2021). Gasohol Sprays Simulations of a Multi-Hole GDI Injector in Engine-like Conditions. SAE Technical Papers. doi:10.4271/2021-01-0549
Kong, S. C., Senecal, P. K., and Reitz, R. D. (1999). Developments in Spray Modeling in Diesel and Direct-Injection Gasoline Engines. Oil Gas Sci. Technol. - Rev. IFP 54, 197–204. doi:10.2516/OGST:1999015
Krastev, V., Silvestri, L., and Falcucci, G. (2017). A Modified Version of the RNG K-ε Turbulence Model for the Scale-Resolving Simulation of Internal Combustion Engines. Energies 10, 2116. doi:10.3390/EN10122116
Lebas, R., Blokkeel, G., Beau, P.-A., and Demoulin, F.-X. (2005). Coupling Vaporization Model with the Eulerian-Lagrangian Spray Atomization (ELSA) Model in Diesel Engine Conditions. Detroit, MI: SAE Technical Papers. doi:10.4271/2005-01-0213
Lebas, R., Menard, T., Beau, P. A., Berlemont, A., and Demoulin, F. X. (2009). Numerical Simulation of Primary Break-Up and Atomization: DNS and Modelling Study. Int. J. Multiph. Flow 35, 247–260. doi:10.1016/J.IJMULTIPHASEFLOW.2008.11.005
Li, X., Yang, S., Qiu, S., Li, T., and Xu, M. (2020). Investigation on Flash Boiling Spray Fluctuations in the Near-Field and Far-Field under Gasoline Direct Injection Related Conditions. Appl. Therm. Eng. 179, 115655. doi:10.1016/J.APPLTHERMALENG.2020.115655
Manin, J., Jung, Y., Skeen, S. A., Pickett, L. M., Parrish, S. E., and Markle, L. (2015). Experimental Characterization of di Gasoline Injection Processes. Kyoto: SAE Technical Papers. doi:10.4271/2015-01-1894
Miller, M., Leick, P., Köhler, R., Kuhnhenn, M., Samerski, I., Lamanna, G., et al. (2021). Characterisation of Internal Flow Conditions in GDI Injectors by Means of Spray-Hole-Individual Mass Flow Rate and Momentum Flux Measurements. Iclass 1. doi:10.2218/ICLASS.2021.5879
Mohan, B., Badra, J., Sim, J., and Im, H. G. (2020). Coupled In-Nozzle Flow and Spray Simulation of Engine Combustion Network Spray-G Injector. Int. J. Engine Res. 22, 2982–2996. doi:10.1177/1468087420960612
Mohapatra, C. K., Schmidt, D. P., Sforzo, B. A., Matusik, K. E., Yue, Z., Powell, C. F., et al. (2020). Collaborative Investigation of the Internal Flow and Near-Nozzle Flow of an Eight-Hole Gasoline Injector (Engine Combustion Network Spray G). Int. J. Engine Res. 2020, 146808742091844. doi:10.1177/1468087420918449
Montanaro, A., Allocca, L., and Meccariello, G. (2019). Gasoline Fuel Sprays Characterization at Very-High Injection Pressures. Kyoto: SAE Technical Papers. doi:10.4271/2019-01-2344
Montanaro, A., Duronio, F., Allocca, L., de Vita, A., and Ranieri, S. (2021). “Experimental Visualization and Lagrangian Simulation of ECN Spray G Injection Process,” in 2021 IEEE International Workshop on Metrology for Automotive, MetroAutomotive 2021 - Proceedings (IEEE), 125–129. doi:10.1109/METROAUTOMOTIVE50197.2021.9502864
Moulai, M., Grover, R., Parrish, S., and Schmidt, D. (2015). Internal and Near-Nozzle Flow in a Multi-Hole Gasoline Injector under Flashing and Non-flashing Conditions. Detroit, MI: SAE Technical Papers. doi:10.4271/2015-01-0944
National Research Council (2015). Cost, Effectiveness, and Deployment of Fuel Economy Technologies for Light-Duty Vehicles. Washington, DC: The National Academies Press, 1–466. doi:10.17226/21744
Paredi, D., Lucchini, T., D’Errico, G., Onorati, A., Montanaro, A., Allocca, L., et al. (2018). Combined Experimental and Numerical Investigation of the ECN Spray G under Different Engine-like Conditions. Detroit, MI: SAE Technical Papers. doi:10.4271/2018-01-0281
Paredi, D., Lucchini, T., D’Errico, G., Onorati, A., Pickett, L., and Lacey, J. (2019a). CFD Modeling of Spray Evolution for Spark-Ignition, Direct Injection Engines. AIP Conf. Proc. 2191, 020125. doi:10.1063/1.5138858
Paredi, D., Lucchini, T., D’Errico, G., Onorati, A., Pickett, L., and Lacey, J. (2019b). Validation of a Comprehensive Computational Fluid Dynamics Methodology to Predict the Direct Injection Process of Gasoline Sprays Using Spray G Experimental Data. Int. J. Engine Res. 21, 199–216. doi:10.1177/1468087419868020
Parrish, S. E. (2014). Evaluation of Liquid and Vapor Penetration of Sprays from a Multi-Hole Gasoline Fuel Injector Operating under Engine-like Conditions. SAE Int. J. Engines 7, 1017–1033. doi:10.4271/2014-01-1409
Pati, A., Paredi, D., Welch, C., Schmidt, M., Geschwindner, C., Böhm, B., et al. (2021). Numerical and Experimental Investigations of the Early Injection Process of Spray G in a Constant Volume Chamber and an Optically Accessible DISI Engine. Int. J. Engine Res. 2021, 146808742110394. doi:10.1177/14680874211039422
Payri, R., Marti-Aldaravi, P., Abboud, R., and Bautista, A. (2021). Numerical Analysis of GDI Flash Boiling Sprays Using Different Fuels. Energies 14, 5925. doi:10.3390/EN14185925
Pope, S. B. (1978). An Explanation of the Turbulent Round-Jet/plane-Jet Anomaly. AIAA J. 16, 279–281. doi:10.2514/3.7521
Pratama, R. H., Huang, W., Moon, S., Wang, J., Murayama, K., Taniguchi, H., et al. (2022). Hydraulic Flip in a Gasoline Direct Injection Injector and its Effect on Injected Spray. Fuel 310, 122303. doi:10.1016/J.FUEL.2021.122303
Quan, S., Senecal, P. K., Pomraning, E., Xue, Q., Hu, B., Rajamohan, D., et al. (2016). A One-Way Coupled Volume of Fluid and Eulerian-Lagrangian Method for Simulating Sprays. Greenville, South Carolina, USA: ASME. doi:10.1115/ICEF2016-9390
Reitz, R. D., and Beale, J. C. (1999). Modeling Spray Atomization with the Kelvin-Helmholtz/Rayleigh-Taylor Hybrid Model. At. Spr. 9, 623–650. doi:10.1615/ATOMIZSPR.V9.I6.40
Reitz, R. D. (1987). Modeling Atomization Processes in High-Pressure Vaporizing Sprays. AtST 3, 309–337.
Ricart, L. M., Xin, J., Bower, G. R., and Reitz, R. D. (2018). In-Cylinder Measurement and Modeling of Liquid Fuel Spray Penetration in a Heavy-Duty Diesel Engine. Dearborn, MI: SAE International, 1622–1640.
Richards, K. J., Senecal, P. K., and Pomraning, E. (2020). CONVERGE 2.4 CFD MANUAL. Madison, WI: Convergent Science.
Richards, K., Probst, D., Pomraning, E., Senecal, P. K., and Scarcelli, R. (2014). “The Observation of Cyclic Variation in Engine Simulations when Using RANS Turbulence Modeling,” in ASME 2014 Internal Combustion Engine Division Fall Technical Conference, ICEF 2014 (ASME). doi:10.1115/ICEF2014-5605
Robin, H., Paul, J., Leick, P., Georg Stapf, K., Schünemann, E., and Thévenin, D. (2018). Multi-objective Optimization of High-Pressure Gasoline Injector Nozzles Using Genetic Algorithms Coupled with Computational Fluid Dynamics (CFD): Exploiting the Manufactural Design. Available at: https://www.researchgate.net/publication/326610721.
Rotondi, R., and Bella, G. (2006). Gasoline Direct Injection Spray Simulation. Int. J. Therm. Sci. 45, 168–179. doi:10.1016/J.IJTHERMALSCI.2005.06.001
Rutland, C. J. (2017). Large-eddy Simulations for Internal Combustion Engines - a Review. Int. J. Engine Res. 12, 421–451. doi:10.1177/1468087411407248
S, A. R., and Saha, K. (2022). “The Numerical Analysis of Spray Formation for GDI System Using Dynamically Coupled Internal Nozzle Flow and ELSA Spray Simulation,” in Proceedings of the 26thNational and 4th International ISHMT-ASTFE Heat and Mass Transfer Conference December 17-20, 2021, IIT Madras, Chennai-600036, Tamil Nadu, India (IIT Madras, Chennai, India: BEGELL HOUSE Inc.), 623–629. doi:10.1615/IHMTC-2021.930
Saha, K., Quan, S., Battistoni, M., Som, S., Senecal, P. K., and Pomraning, E. (2017). Coupled Eulerian Internal Nozzle Flow and Lagrangian Spray Simulations for GDI Systems. Detroit, MI: SAE Technical Papers. doi:10.4271/2017-01-0834
Saha, K., Srivastava, P., Quan, S., Senecal, P. K., Pomraning, E., and Som, S. (2018). Modeling the Dynamic Coupling of Internal Nozzle Flow and Spray Formation for Gasoline Direct Injection Applications. Detroit, MI: SAE Technical Papers. doi:10.4271/2018-01-0314
Saha, K., Som, S., Battistoni, M., Li, Y., Pomraning, E., and Senecal, P. K. (2016). Numerical Investigation of Two-phase Flow Evolution of in- and Near-Nozzle Regions of a Gasoline Direct Injection Engine during Needle Transients. SAE Int. J. Engines 9, 1230–1240. doi:10.4271/2016-01-0870
Schmitz, I., Ipp, W., and Leipertz, A. (2002). Flash Boiling Effects on the Development of Gasoline Direct-Injection Engine Sprays. San Diego, CA: SAE Technical Papers. doi:10.4271/2002-01-2661
Scott, P. (2014). Gasoline Spray Spray G Topic 3.4, Drop Size Measurement. Ann Arbor, MI: ECN3 workshop.
Senecal, P. K. (2000). Development of a Methodology for Internal Combustion Engine Design Using Multi-Dimensional Modeling with Validation through Experiments – Engine Research Center – UW–Madison. Wisconsin-Madison: University of Wisconsin-Madison. Available at: https://erc.wisc.edu/publications/Development-of-a-Methodology-for-Internal-Combustion-Engine-Design-Using-Multi-Dimensional-Modeling-With-Validation-through-experiments/ (Accessed February 8, 2022).
Senecal, P. K., Richards, K. J., Pomraning, E., Yang, T., Dai, M. Z., McDavid, R. M., et al. (2007). A New Parallel Cut-Cell Cartesian CFD Code for Rapid Grid Generation Applied to in-Cylinder Diesel Engine Simulations. Detroit, MI: SAE Technical Papers. doi:10.4271/2007-01-0159
Som, S., Longman, D. E., Ramírez, A. I., and Aggarwal, S. K. (2010). A Comparison of Injector Flow and Spray Characteristics of Biodiesel with Petrodiesel. Fuel 89, 4014–4024. doi:10.1016/J.FUEL.2010.05.004
Som, S., Wang, Z., Pei, Y., Senecal, P. K., and Pomraning, E. (2016). “LES of Vaporizing Gasoline Sprays Considering Multi-Injection Averaging and Grid-Convergent Mesh Resolution,” in ASME 2015 Internal Combustion Engine Division Fall Technical Conference, ICEF 2015 (ASME). doi:10.1115/ICEF2015-1003
Sparacino, S., Berni, F., d’Adamo, A., Krastev, V. K., Cavicchi, A., and Postrioti, L. (2019). Impact of the Primary Break-Up Strategy on the Morphology of GDI Sprays in 3D-CFD Simulations of Multi-Hole Injectors. Energies 12, 2890. doi:10.3390/EN12152890
Sphicas, P., Pickett, L. M., Skeen, S., Frank, J., Lucchini, T., Sinoir, D., et al. (2017). A Comparison of Experimental and Modeled Velocity in Gasoline Direct-Injection Sprays with Plume Interaction and Collapse. SAE Int. J. Fuels Lubr. 10, 184–201. doi:10.4271/2017-01-0837
Strek, P., Duke, D., Swantek, A., Kastengren, A., Powell, C. F., and Schmidt, D. P. (2016). X-Ray Radiography and CFD Studies of the Spray G Injector. Detroit, MI: SAE Technical Papers. doi:10.4271/2016-01-0858
Takagi, Y., Itoh, T., Muranaka, S., Iiyama, A., Iwakiri, Y., Urushihara, T., et al. (1998). Simultaneous Attainment of Low Fuel Consumption High Output Power and Low Exhaust Emissions in Direct Injection SI Engines. SAE Technical Papers. doi:10.4271/980149
Torelli, R., D'Errico, G., Lucchini, T., Ikonomou, V., and McDavid, R. M. (2015). A Spherical Volume Interaction Ddm Approach for Diesel Spray Modeling. At. Spr. 25, 335–374. doi:10.1615/ATOMIZSPR.2015010623
Tu, P.-W., Xu, H., Srivastava, D. K., Dean, K., Jing, D., Cao, L., et al. (2015). Numerical Investigation of GDI Injector Nozzle Geometry on Spray Characteristics. Detroit, MI: SAE Technical Papers. doi:10.4271/2015-01-1906
Wang, F., He, Z., Liu, J., and Wang, Q. (2015). Diesel Nozzle Geometries on Spray Characteristics with a Spray Model Coupled with Nozzle Cavitating Flow. Int.J Automot. Technol. 16 (4 16), 539–549. doi:10.1007/S12239-015-0055-9
Wissler, E. H. (1963). Physicochemical Hydrodynamics (Levich, Veniamin G.). J. Chem. Educ. 40, A827. doi:10.1021/ED040PA827.2
Wu, S., Yang, S., Wooldridge, M., and Xu, M. (2019). Experimental Study of the Spray Collapse Process of Multi-Hole Gasoline Fuel Injection at Flash Boiling Conditions. Fuel 242, 109–123. doi:10.1016/J.FUEL.2019.01.027
Xin, J., Ricart, L., and Reitz, R. D. (1998). Computer Modeling of Diesel Spray Atomization and Combustion. Combust. Sci. Technol. 137, 171–194. doi:10.1080/00102209808952050
Xue, Q., Som, S., Senecal, P. K., and Pomraning, E. (2013). Large Eddy Simulation of Fuel-Spray under Non-reacting Ic Engine Conditions. At. Spr. 23, 925–955. doi:10.1615/ATOMIZSPR.2013008320
Yamaguchi, A., Koopmans, L., Helmantel, A., Karrholm, F. P., and Dahlander, P. (2019). Spray Characterization of Gasoline Direct Injection Sprays under Fuel Injection Pressures up to 150 MPa with Different Nozzle Geometries. San Antonio, TX: SAE Technical Papers. doi:10.4271/2019-01-0063
Yamaguchi, A., Koopmans, L., Helmantel, A., Dillner, J., and Dahlander, P. (2020). Air Motion Induced by Ultra-high Injection Pressure Sprays for Gasoline Direct Injection Engines. SAE Int. J. Fuels Lubr. 13, 223–235. doi:10.4271/04-13-03-0014
Zhao, F., Lai, M.-C., and Harrington, D. L. (1999). Automotive Spark-Ignited Direct-Injection Gasoline Engines. Prog. Energy Combust. Sci. 25, 437–562. doi:10.1016/S0360-1285(99)00004-0
Zigan, L., Schmitz, I., Flügel, A., Wensing, M., and Leipertz, A. (2011). Structure of Evaporating Single- and Multicomponent Fuel Sprays for 2nd Generation Gasoline Direct Injection. Fuel 90, 348–363. doi:10.1016/J.FUEL.2010.08.001
Nomenclature
AMR Adaptive Mesh Refinement
BDC Bottom Dead Center
CFD Computational Fluid Dynamics
CFL Courant-Friedrichs-Lewy
DDM Discrete Droplet Model
DS Dynamic Structure
ECN Engine Combustion Network
ELSA Eulerian-Lagrangian Spray Atomization
GDI Gasoline Direct Injection
ICE Internal Combustion Engine
KH Kelvin-Helmholtz
LES Large Eddy Simulations
LPL Liquid Penetration Length
PFI Port Fuel Injection
PISO Pressure Implicit with Splitting of Operators
ROI Rate of Injection
RNG Renormalization Group
RT Rayleigh-Taylor
TDC Top Dead Center
URANS Unsteady Reynolds Averaged Navier-Stokes
VPL Vapor Penetration Length
ε Turbulent dissipation rate
k Turbulent kinetic energy
Keywords: spray modeling, gasoline direct injection (GDI), turbulence modeling, internal combustion engines, Spray G, Eulerian-Lagrangian
Citation: Ailaboina A and Saha K (2022) On Modeling of Spray G ECN Using ROI-Based Eulerian-Lagrangian Simulation. Front. Mech. Eng 8:880635. doi: 10.3389/fmech.2022.880635
Received: 21 February 2022; Accepted: 23 May 2022;
Published: 15 July 2022.
Edited by:
Roberto Torelli, Argonne National Laboratory (DOE), United StatesReviewed by:
Hengjie Guo, Argonne National Laboratory (DOE), United StatesLuca Marchitto, CNR–Istituto di Scienze e Tecnologie per l’Energia e la Mobilità Sostenibili (STEMS), Italy
Copyright © 2022 Ailaboina and Saha. This is an open-access article distributed under the terms of the Creative Commons Attribution License (CC BY). The use, distribution or reproduction in other forums is permitted, provided the original author(s) and the copyright owner(s) are credited and that the original publication in this journal is cited, in accordance with accepted academic practice. No use, distribution or reproduction is permitted which does not comply with these terms.
*Correspondence: Kaushik Saha, a2F1c2hpa3NhaGFAZGVzZS5paXRkLmFjLmlu